Article

GCP and PPK Utilization Plan to Deal with RTK Signal Interruption in RTK-UAV Photogrammetry

Department of Civil Engineering, Kyonggi University, Suwon 16227, Republic of Korea
*
Author to whom correspondence should be addressed.
Drones 2023, 7(4), 265; https://doi.org/10.3390/drones7040265
Submission received: 24 March 2023 / Revised: 5 April 2023 / Accepted: 11 April 2023 / Published: 12 April 2023

Abstract

:
When surveying a large target area with a real-time kinematic unmanned aerial vehicle (RTK-UAV), the RTK signal tends to be disconnected when city canyons or macrocells are included. Thus, the accuracy is reduced due to the lack of RTK signal or the fact that RTK signal is not available in certain areas. The available methods to solve this problem are costly. Therefore, we used one GCP and performed post-process kinematics (PPK) to verify whether the accuracy reduction caused by the lack of RTK signal in certain areas could be solved. A data set detailing the percentage of time during which the RTK signal was received (100%, 90%, 5%, and 0%) was obtained, and ATs were conducted both with and without PPK using GCPs located at the four corners and center. In 40 experiments, the trend of root mean square error (RMSE) values based on the distance between the GCP used and the 41 check points (CPs) was analyzed. In the absence of PPK, the error tended to increase depending on the distance between the GCP and CPs, but there was no significant difference after PPK as up to 10 cm horizontal error and up to 20 cm vertical error were observed within a 1 km radius of the GCP. As a result, even if the RTK signal is disconnected during shooting, it is possible to achieve an accuracy within 3 GSD up to a radius of 1 km from the GCP.

1. Introduction

Due to recent advancements in the industry, the need for three-dimensional (3D) spatial data has increased, and the infrastructure for building 3D spatial data is developing rapidly [1,2]. Among the various methods that can quickly and accurately build rapidly changing 3D spatial data, unmanned aerial vehicles (UAVs) are attracting attention from researchers [3,4,5]. Compared to aircraft, UAVs can efficiently build spatial information, such as 1:1000 digital maps, for small areas at lower altitudes and at a lower cost and in less time [6].
To generate high-quality geospatial data using UAVs, sensors such as a global navigation satellite system/inertial measurement unit (GNSS/IMU) and ground control points (GCPs) can be used to improve the accuracy of the external orientation parameters of the acquired images [7].
When spatial data are generated using these sensors and a sufficient number of GCPs, the quality of the generated data is improved because the deviation or bias is reduced [8]. Therefore, to build spatial data through UAVs, the Republic of Korea has created the Guideline for Public Survey Using Unmanned Aerial Vehicles [9]. According to these guidelines, nine GCPs per 1 km2 are suggested and the separation distance between GCPs should be less than 500 m.
However, to obtain high-precision results according to the effect of the geometric distribution of GCPs on the accuracy through aerial triangulation (AT) and the size of the study area, additional studies on optimizing the number of GCPs are needed. However, because GCP surveying requires physical surveying, it is a costly and time-consuming task in the overall UAV-based survey process.
Therefore, by reducing the number of GCPs, the time required for field surveys can be reduced due to aerial photogrammetry using UAVs [10]. In a GCP survey, a technician must visit the site and acquire the coordinates of the location, and at the same time, the location must be identifiable from the image taken by the UAV in order to proceed with relative orientation later. Using the GNSS or Total Station, the coordinates from these artificial targets should be measured. However, it is very difficult to obtain the coordinates of GCPs on steep slopes or inaccessible areas [11].
When the physical measurement described above is difficult, a direct georeferencing method is proposed to achieve the required accuracy. Because the direct georeferencing method does not use GCPs, the location accuracy of the UAV has a significant influence on the accuracy of aerial photogrammetry. Surveying using a single GNSS is inaccurate because of various fundamental errors [12]. Further, in a real-time kinematic (RTK) survey using two GNSSs, multi-differentiated results are transmitted to the rover to reduce the number of GCPs, or when the same number of GCPs are applied, higher accuracy results are obtained than when a GNSS-UAV is used [13,14]. The GNSS-UAV method shows meter-level accuracy when performing AT [15,16], whereas RTK-UAV shows a positioning accuracy of several centimeters. Therefore, in cases where there is little fear of RTK signal disconnection, the RTK-UAV method is applied to reduce the number of GCPs because there is little concern about the deterioration of the 3D accuracy of the image [17,18,19].
Ref. [20] showed that RTK-UAV does not require post-processing if the received signal is good, and it can satisfy demanding flight environments through real-time correction. However, if the signal is disconnected, the multi-differentiated solution cannot be received in real time, and the position measured by the GNSS is stored. When the study area is wide or is an urban area, the RTK-UAV accessing the network experiences many signal disconnections, and thus images with 3D positional accuracy in the GNSS state are recorded. Many studies have been conducted to improve the accuracy through a separate post-process kinematics (PPK) procedure using receiver-independent exchange forma (RINEX) data from the continuous observation reference station (CORS) located near the target area [21,22,23,24].
PPK is a post-processing technique that compares GNSS-received data for which error and integer ambiguity have not been determined from hardware elements (such as amplifiers and antennas) and CORS observation data to determine the receiver clock error, neutral atmospheric delay, ionospheric delay, code compensation for deflection, satellite clock errors, etc. [25,26,27]. Ref. [28] also reported that the RTKLIB program showed the best results due to the fact that the AT of images was captured through the GNSS-UAV.
In general, if the RTK signal is disconnected due to a communication failure caused by increased communication distance resulting from a wider shooting area or signal disconnection in a city canyon, the initial value of the extra orientation parameter with uncorrected GNSS errors is included in the image obtained from the RTK-UAV. Therefore, it has an accuracy of several meters, making it unsuitable for generating precise 3D spatial information. However, when the disconnection of the communication signal is small and the RTK reception rate is high, an accuracy of several centimeters can be expected. That is, in the direct georeferencing method using RTK-UAV, the accuracy decreases when the RTK reception rate is poor. Accordingly, using one GCP can solve the bias problem for the Z axis, and using two GCPs can correct the H and Z axes for the area between the GCPs [29]. If three GCPs are used, the correction and distortion of the H and Z axes inside the GCP points can be expressed. It was reported [30] that the z-axis error can be corrected by applying at least one GCP and PPK. In [31], a small area was surveyed using a UAV and the different numbers and costs required for PPK to achieve similar accuracies when using RTK, GNSS, and non-GNSS were analyzed. It was also stated that to obtain the same level of accuracy when recording positions using GNSS and when only using GCPs without GNSS, six and twelve GCPs should be utilized to obtain reliable results.
Ref. [32] suggested that the horizontal error of the control point (CP) decreases as the number of GCPs used in UAV surveying increases. In addition, it was reported that the horizontal error tended to increase as the distance between GCPs and CPs increased.
Ref. [33] reported that the 3D root mean square error (RMSE) was 0.051 m when six GCPs were used, and the RMSE was 0.043 m when a total of seven GCPs were used by adding one GCP inside the target area. In addition, placing GCPs at 350 m intervals was proposed, that is, more densely than the nine or more GCPs per 1 km2 suggested by the UAV Operation Regulations.
Ref. [34] performed accuracy evaluation according to the geometry and arrangement of the GCPs using GNSS-UAV, employing 120 CPs at shooting altitudes of 170 and 200 m and shooting areas of 1.6 and 2.3 km2, respectively. As a result of the analysis, it was found that the geometric arrangement of the GCPs was more conducive to increasing the accuracy of the UAV during AT than increasing the number of GCPs, and the positioning accuracy decreased when the GCP interval exceeded 400 m. Previous studies have pointed out that if signal disconnection occurs when surveying a large study area with RTK-UAV, the 3D location accuracy of images and the accuracy of AT are lowered. However, in actual shooting, because shooting starts in a state in which the RTK signal connection is made, there are cases where the signal is disconnected in the middle of shooting and then connected again. As such, studies on the results of AT when RTK signals are received at 100% and when signals are disconnected in the middle of shooting are insufficient. In addition, according to the RTK reception rate, no studies have analyzed the trend of error according to the distance to the CPs when 1GCP is applied and the error that occurs when PPK is performed. Therefore, in this study, we reviewed the effect of 1GCP+PPK applied to the UAV by [30]. To this end, RTK-UAV image sets were created for cases where the RTK reception rates for the study area were 100%, 90%, 5%, and 0%, and the accuracy of AT was evaluated. According to the reception rate, the accuracy of using only direct georeferencing and performing PPK were compared. In addition, when using 1GCP, we tried to confirm whether it was absolutely necessary to place the GCP in the center of the work site. Therefore, the trends of the H and Z errors according to the distance between the 1GCP and CPs were analyzed.
A flow chart of this study is shown in Figure 1, and the following content is described in each section. In Section 2, the study area, input data for AT, and experimental methods for PPK are described. In Section 3, in the case of 1 GCP, Cases 1–4 were classified according to the RTK reception rate, and the AT results of non-PPK and PPK were compared and analyzed. In Section 4, we analyzed the accuracy of the level of several centimeters at a certain distance when one GCP was applied. Based on these results, a discussion is included in Section 5, and the conclusions of this study are presented in Section 6.

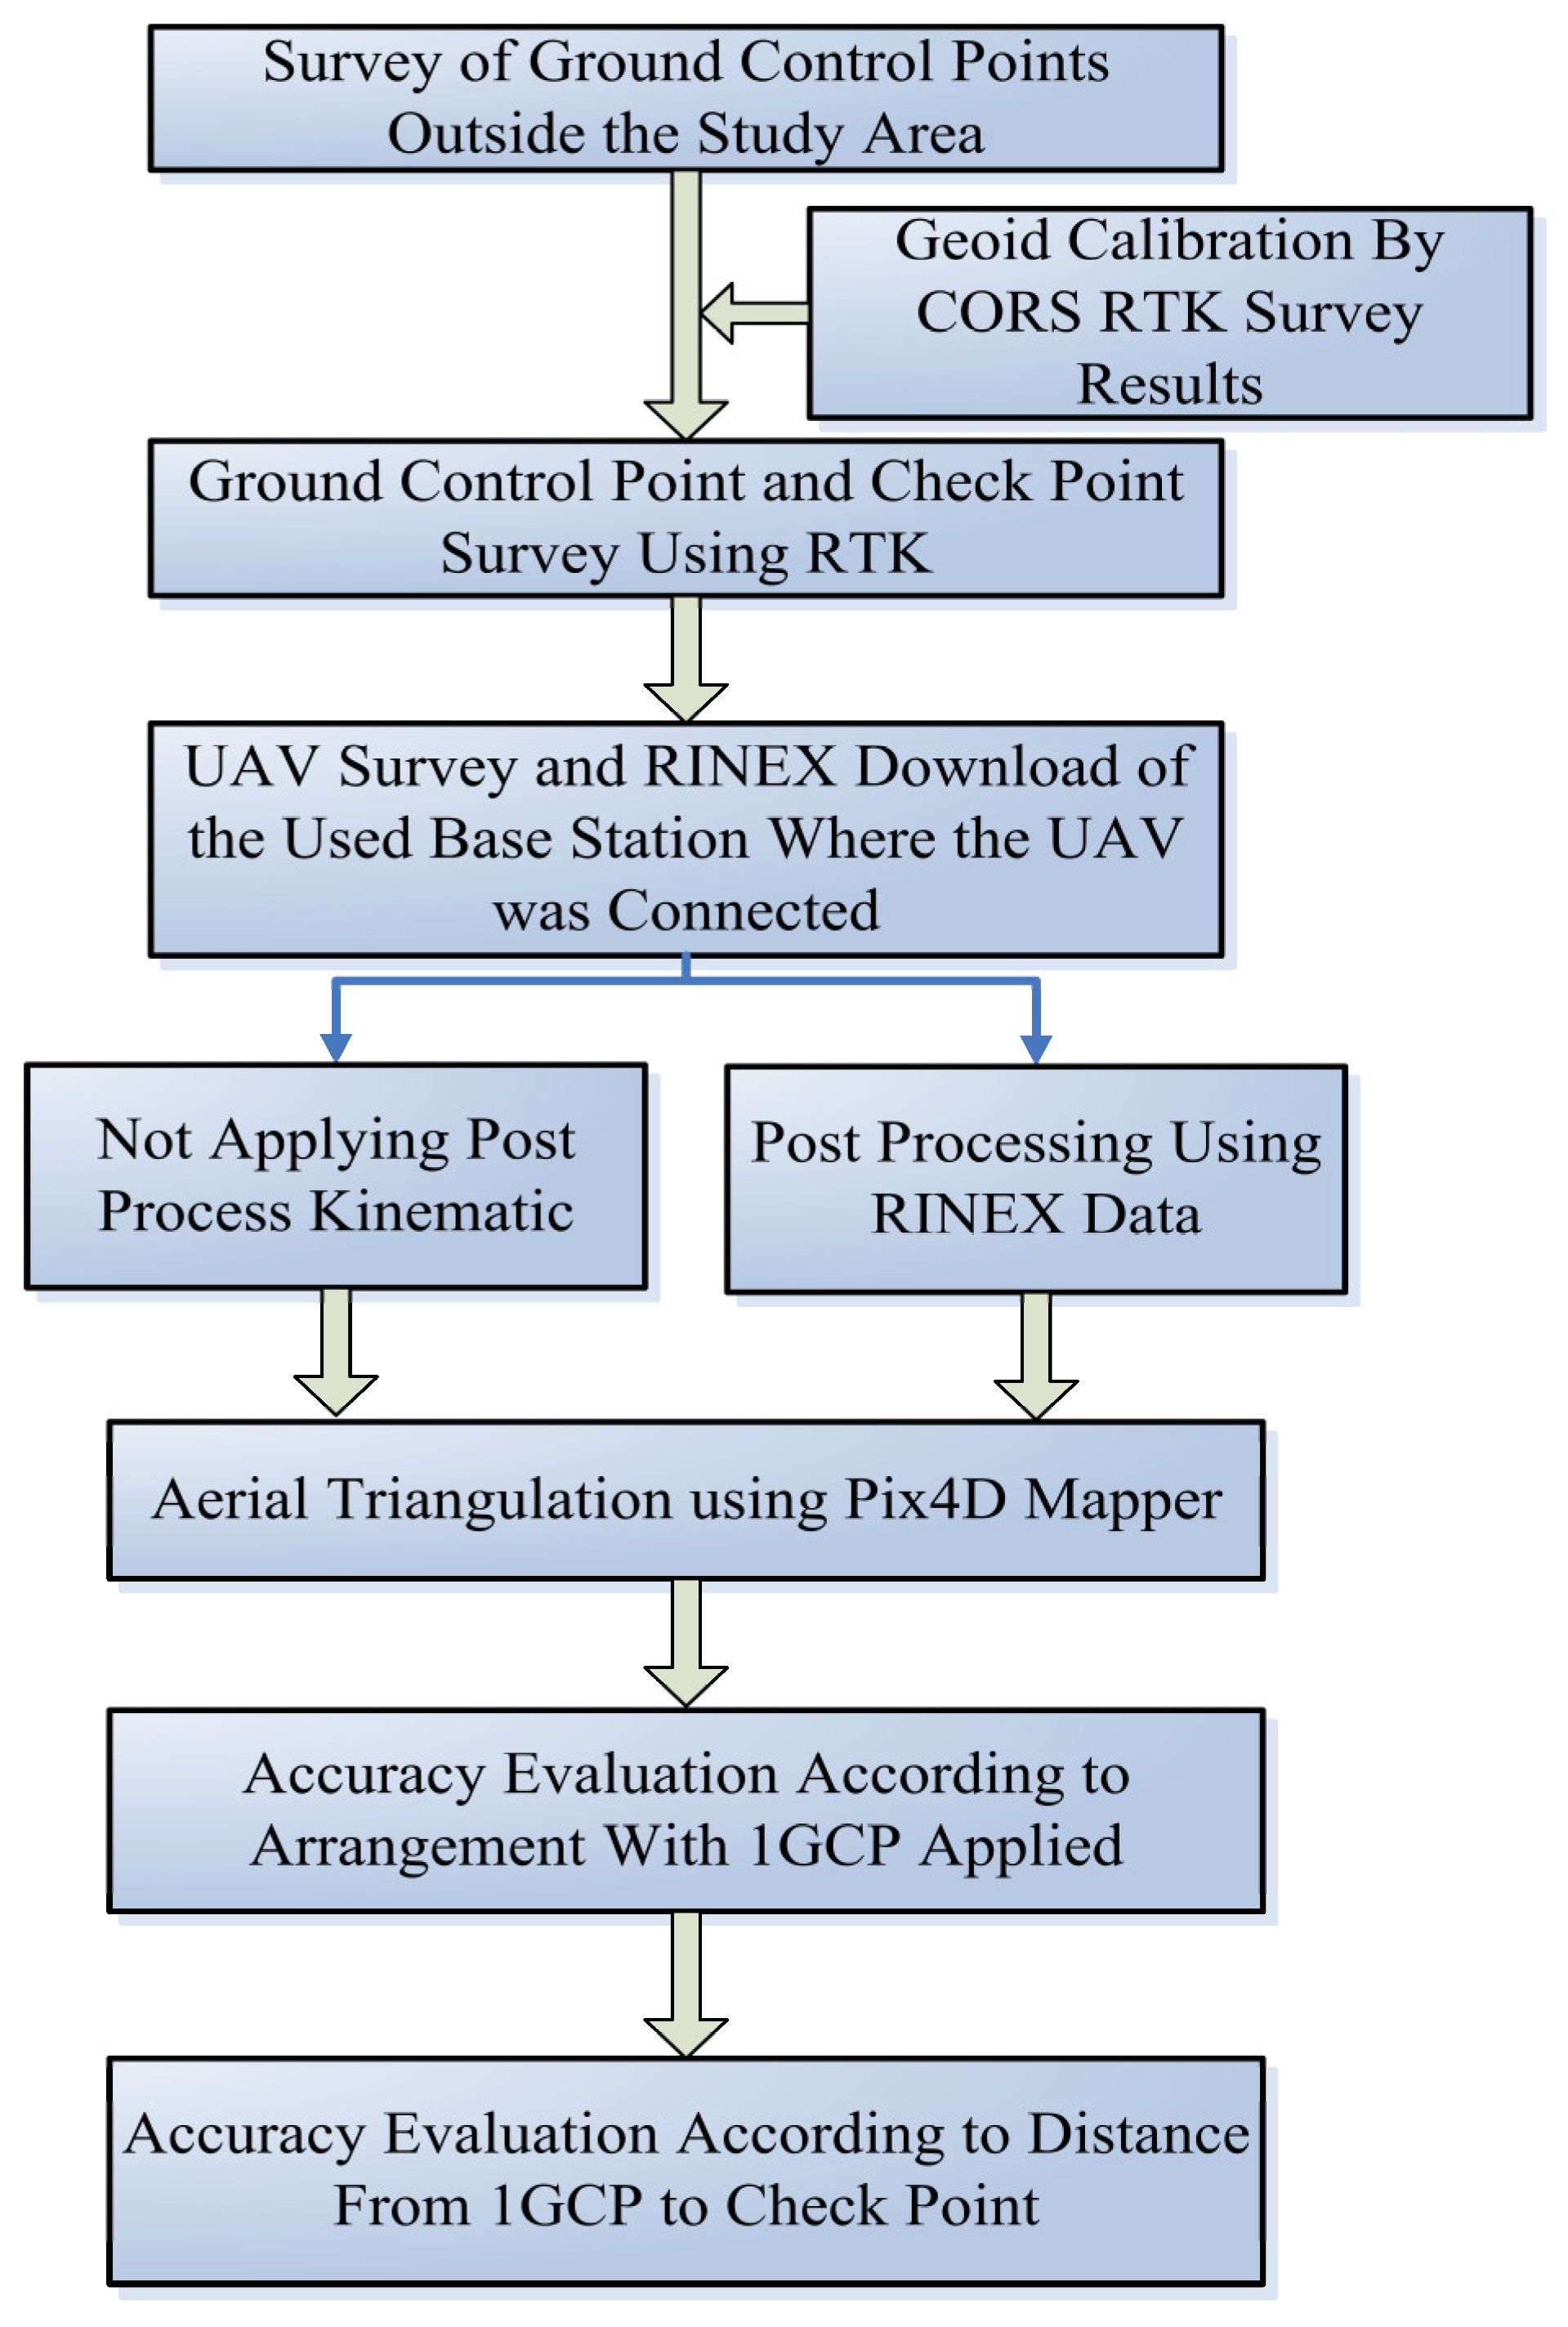
2. Data Acquisition and Experimental Method Setting

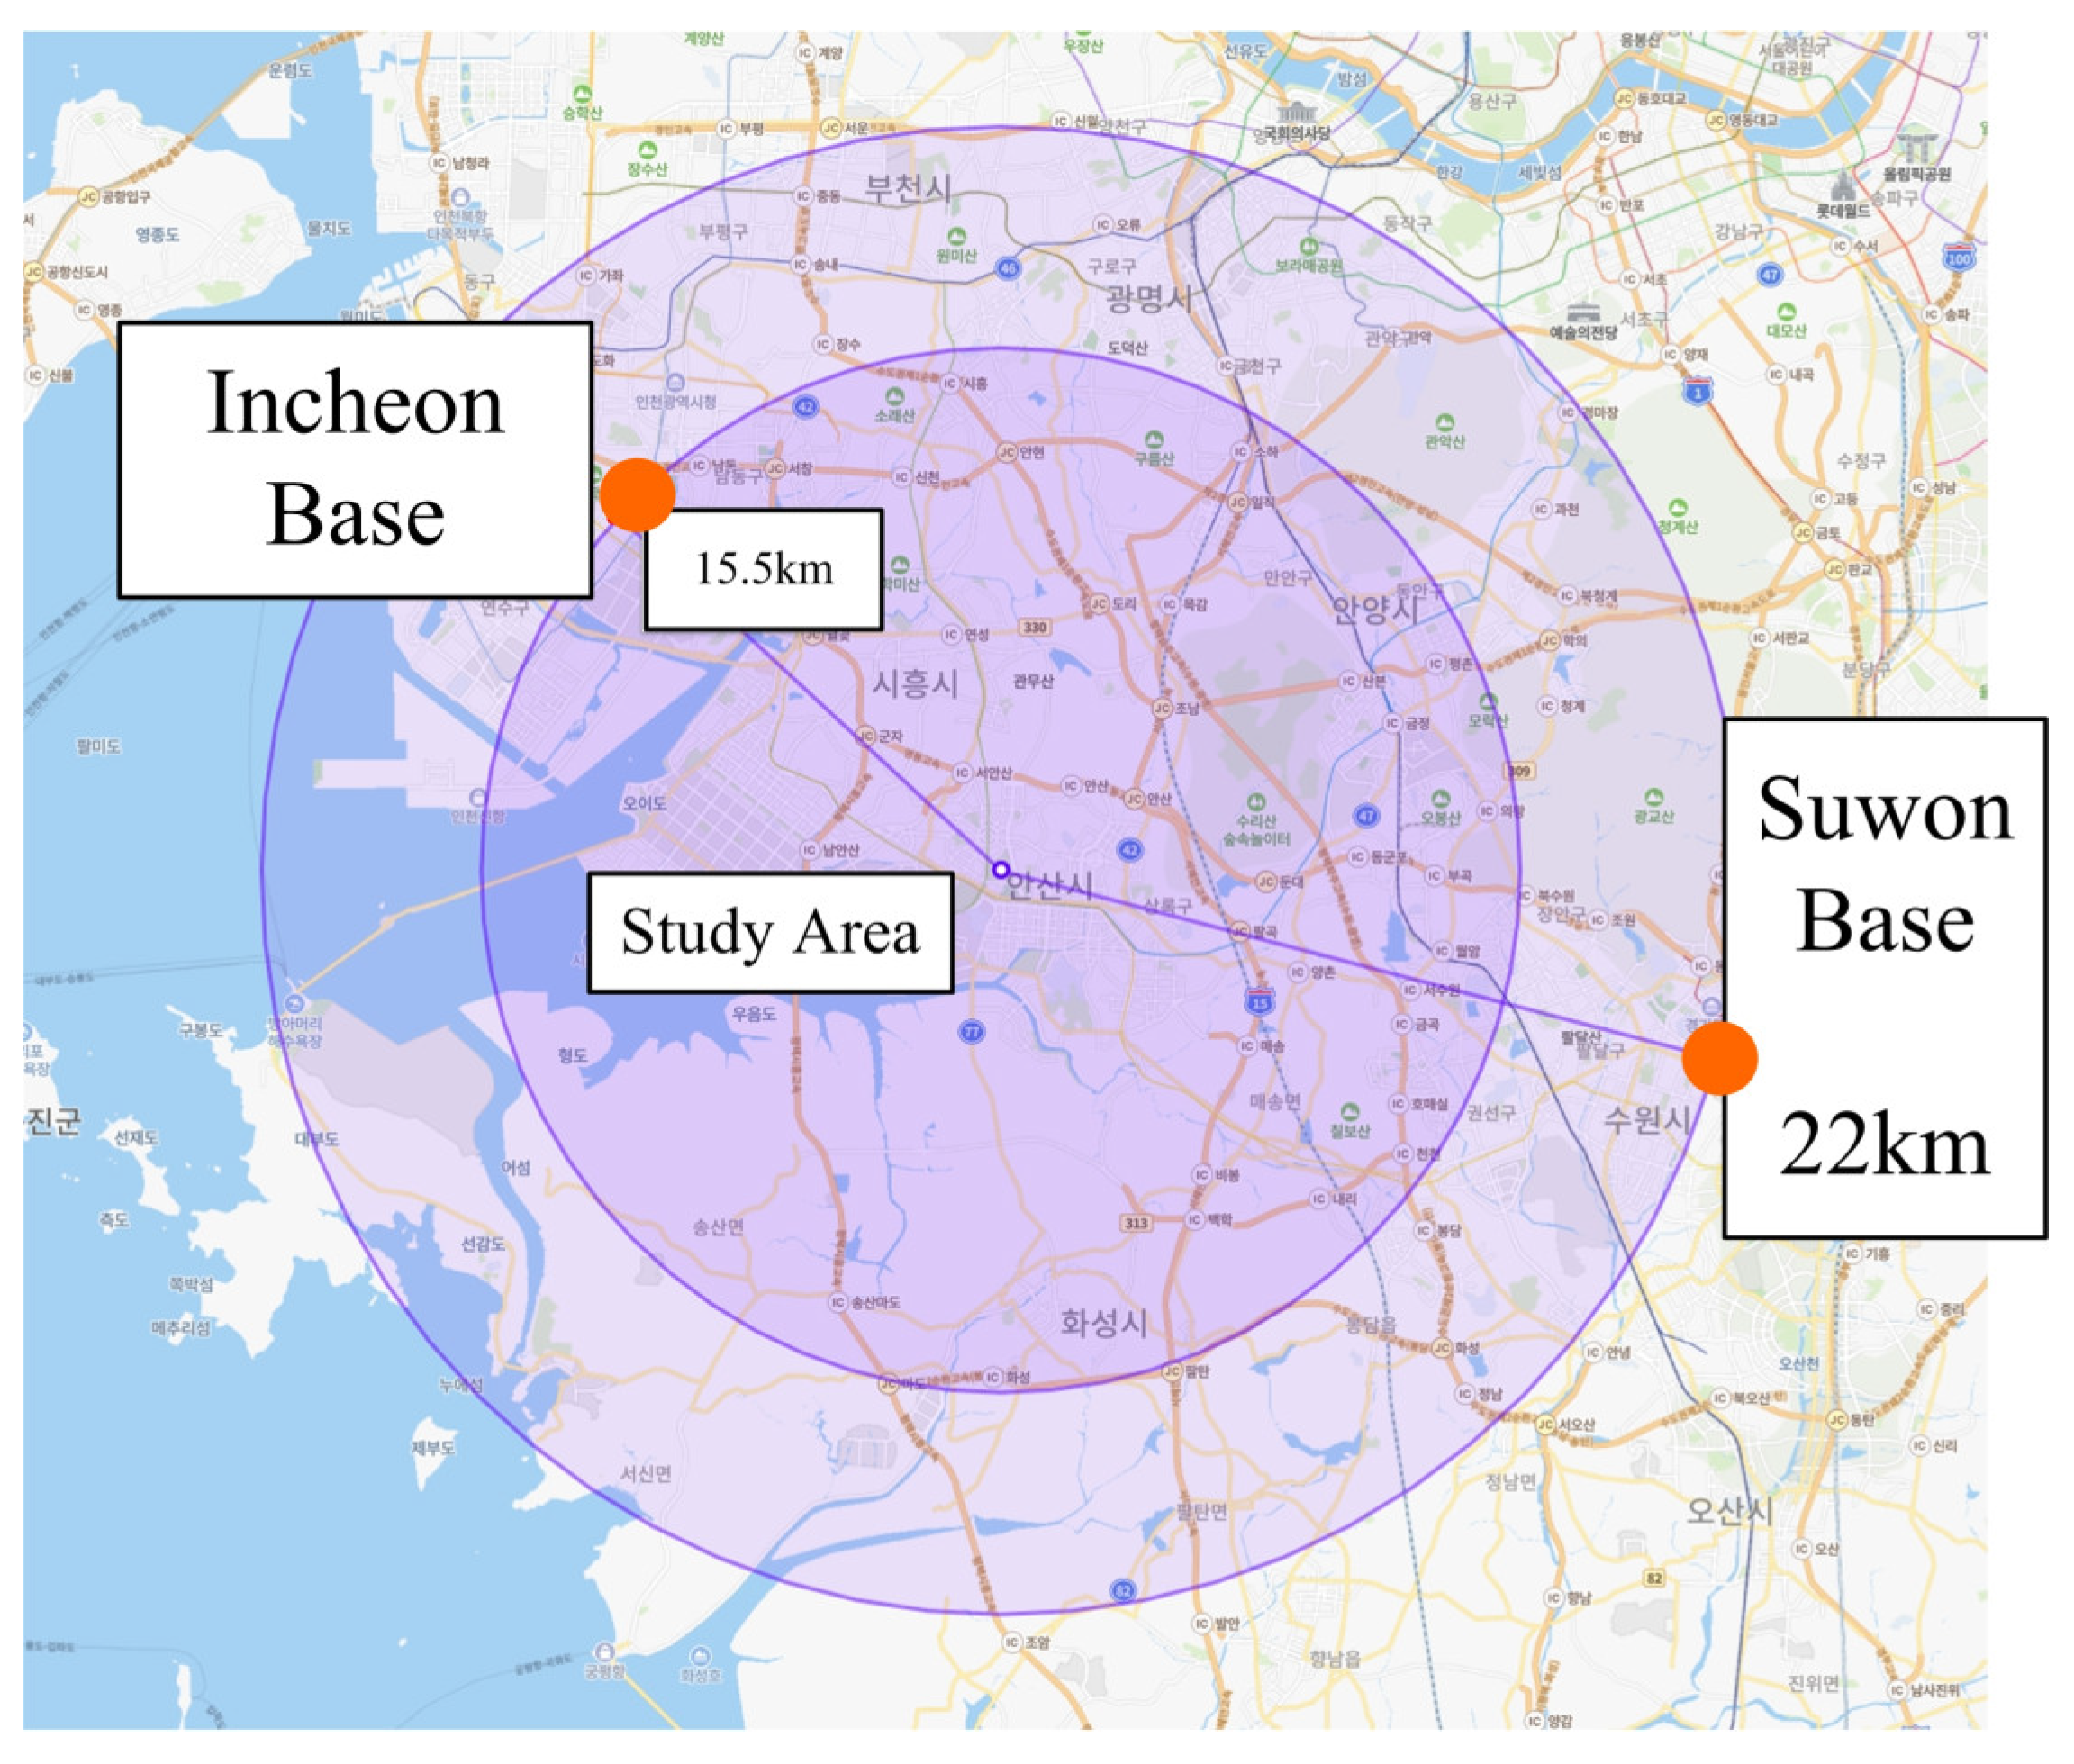
2.1. In Situ Geoid Model Calibration of Study Area

The study area was Hwarang Amusement Park (Latitude: 37°19′34.81″ N, Longitude: 126°48′51.49″ E) located in Ansan, Korea. The actual area of the study area was approximately 0.75 km2 (Figure 2). The study area was flat with minimal elevation differences. There was a museum with a height of approximately 30 m in the center of the target area, the Gyeonggi-Do Museum of Modern Art, with its entire facade made of glass. There were repeaters for wireless communication on the rooftops of apartment complexes and other buildings located outside the study area. Accordingly, the RTK signal may have been locally disconnected in the study area.
Prior research on surveying using RTK [35] states that the distance between the base station and receiver should be within 10 km when the geoid undulation is severe. However, for the study site, the nearest base station was 15.5 km, as shown in Figure 3. A previous study [36] reported that PPK was performed but the RMSE for Z increased. That study was conducted in an area very far from the base, and it was judged that this phenomenon occurred because the EGM96 geoid was used without performing separate site calibration in the mountainous area. Therefore, to obtain precise geoid results for the outer shell in this study, site calibration was performed in this area. A CP survey was conducted using TIANYU’s GR-5N GNSS receiver and CORS, inside and outside the target area. Additionally, EPSG 5186 was used as the coordinate system of the VRS-GNSS survey (Figure 4). When surveying the reference point for site calibration, Incheon was set as the base station, radio technical commission for maritime services (RTCM) 3.1 was used, and the elevation mask was set to 15°.
The geoid model used was KN Geoid 18, a derivative of EGM 2008. KN Geoid 18 has a degree of fit of approximately 2.3 cm and is known as a model optimized for the Republic of Korea because of GNSS/leveling [37,38].
The observation precision of site calibration was evaluated as position dilution of precision (PDOP) 1.80, the horizontal and vertical RMS were 1.4 and 2.1 cm, and the longest point-to-point distance was 6 km. The results of field calibration are shown in Table 1 below. This was similar to the values obtained between 5 and 10 km from the RTK survey results of a previous study conducted in the Incheon area [35].
The reference point survey in the study area was also RTK-surveyed using the same base-station (Incheon Station) as site calibration. A total of 42 points were measured, and as a result, the PDOP was evaluated as 1.82, and the horizontal and vertical errors were evaluated as 1.5 and 2.4 cm, respectively. The positions of the GCPs are shown in Figure 5a–e, which indicate the positions of the measurement points located in the center and outermost parts of the study area in a clockwise direction. Reference points other than the GCPs were used as CPs.

2.2. UAV Surveying and Internal Orientation

The UAV used for UAV surveying was a DJI Phantom4 RTK, and CORS using INCH Base was used for RTK. The DJI automatic flight function was used for the shooting course and driving method in the study area. Details, such as the shooting altitude, shooting angle, shooting speed, shooting course, number of photographs acquired, and the 3D coordinate correction method recorded at the time of taking the photograph, are listed in Table 2.
Case 1 corresponds to the case in which the received RTK signal was 100% and captured images in a very smooth state. Using DJI’s D-RTK 2 (DJI Real-Time Kinematics Mobile GNSS Station), we received a more stable signal than the receiver mounted on Phantom 4 RTK. As for the CORS signal quality of D-RTK2, 70% signal reception was deemed good according to a green light in the DJI’s manual, and the satellite reception status was also shown to be more than 10. Case 2 corresponds to the case in which the RTK signals were received at 0% and equal to GNSS/INS. Case 3 included 90% of RTK signals, 6% of GNSS signals, and 4% of cases in which the signal between the controller and the UAV was completely disconnected. Case 3 was unusual. In the case of GNSS, the RTK signal was temporarily disconnected. Disconnection occurred because of a wireless communication repeater or glass buildings located outside the study area. Therefore, instances such as this can often occur when conducting extensive surveys through RTK-UAV or surveying in urban areas. Among the 3D position records (longitude, latitude, altitude), the record for height was included at the level of 2–3 m, and the accuracy for horizontal and elevation was recorded at 5 and 10 m. Case 4 corresponds to the case where 95% of the RTK signal was received in the GNSS state. In this case, an RTK signal was initially received, but no additional RTK signals were received after the RTK signal was disconnected.
The shooting performance of the Phantom4 RTK used in this experiment was approximately 2.74 cm ground sample distance (GSD) at a shooting altitude of 100 m [39]. The expected GSD was calculated to be approximately 2.9 cm for all shooting plans in Cases 1–4. Therefore, the relative altitude difference between the ground surface of the study site and the UAV was calculated to be approximately 105 m.
In this study, because a low-cost camera was used for the UAV, the interior orientation of the camera was not performed separately [40], and the interior orientation result was confirmed in the bundle block adjustment (BBA) result of the Pix4D mapper. In all the experimental conditions, the resulting values of the internal orientation of the camera were evaluated as values within the tolerance of the detailed quality report presented by Pix4D. Table 3 presents the processing results of Case 1, GCP at 1 o’clock, and unprocessed PPK.

2.3. Post-Process Kinematics and Aerial Triangulation Relative Orientation

The PPK program for initial position correction of the camera used the Redtool box program from RedCatch. This program is based on the RTKPOST program, which normally performs PPK. Meanwhile, INCH, the closest CORS, provides INCH-RTCM3.1 using a Trimble NetR9 GNSS receiver and a TRM 598,000.00 antenna. For the 1 h period RINEX file for PPK, the observations (OBS) file provided by the GNSS integrated data center was used. In the Phantom4 RTK UAV, the coordinates of each image and the correction value between the center of the complementary metal–oxide–semiconductor (CMOS) and the center of the antenna phase of the RTK module were recorded in the Timestamp.MRK file while acquiring the image, and PPK was performed using the OBS file flown from the UAV.
It was confirmed that when PPK was implemented, the positional accuracy of the captured image increased significantly, even when the reception rate of the existing RTK was poor (Table 4). The reason for this is that, as explained in the introduction, even if the RTK signal is partially disconnected or the signal between the UAV and the remote controller is completely disconnected, performing PPK, even if it is not captured in the GNSS state, increases the accuracy of the image, as indicated in Table 4. It was confirmed that the GPS navigation file and GLONASS navigation file used in PPK can effectively obtain centimeter-level positioning accuracy even when the UAV and controller are disconnected.
AT was conducted using Pix4d mapper (version 4.6.4). This program performs BBA. Compared to strip triangulation and independent model triangulation methods, BBA completely removes many errors, such as film distortion, lens aberration, and atmospheric refraction. Therefore, many researchers use this method [41,42,43].
The precision of relative orientation is an important factor when performing AT accuracy assessments. As suggested by [44], consistent work on artificial target can be solved through coding, but in general, in surveys using UAVs, targets use a feature that can be recognized well by UAV, so it is difficult to generalize because there are too many types of artificial targets to solve through techniques such as coding. Therefore, in this experiment, relative orientation was performed with the observation precision within 0.5 pixel error, suggested by the AT work regulations. A disadvantage of manual relative orientation is that inconsistent relative orientation work is performed if the relative orientation is changed every time, according to the location of the ground reference point for each case. After BBA was completed using the GCP at the center of the study area, additional relative orientations were performed by utilizing the current relative orientations.
In addition, to avoid a difference in relative orientation between the data before and after PPK, the data with relative orientation before PPK were used with the Pix4d mapper program’s import and export marks functions. Through this input/output function, the pixel coordinates marked on the image before performing PPK and those marked when performing PPK were the same. Therefore, the difference in relative orientation before and after PPK was eliminated. By using this method, there was no difference in the relative orientation results within each case using the same images. In addition, after the completion of PPK of the image, it was matched with the coordinate system of the VRS-GNSS survey. Meanwhile, the accuracy of the GCPs observed through the GNSS survey was also factored in to the H and Z weight values of the GCPs, and the AT accuracy was evaluated with the weights of the GCPs assigned when BBA was performed.

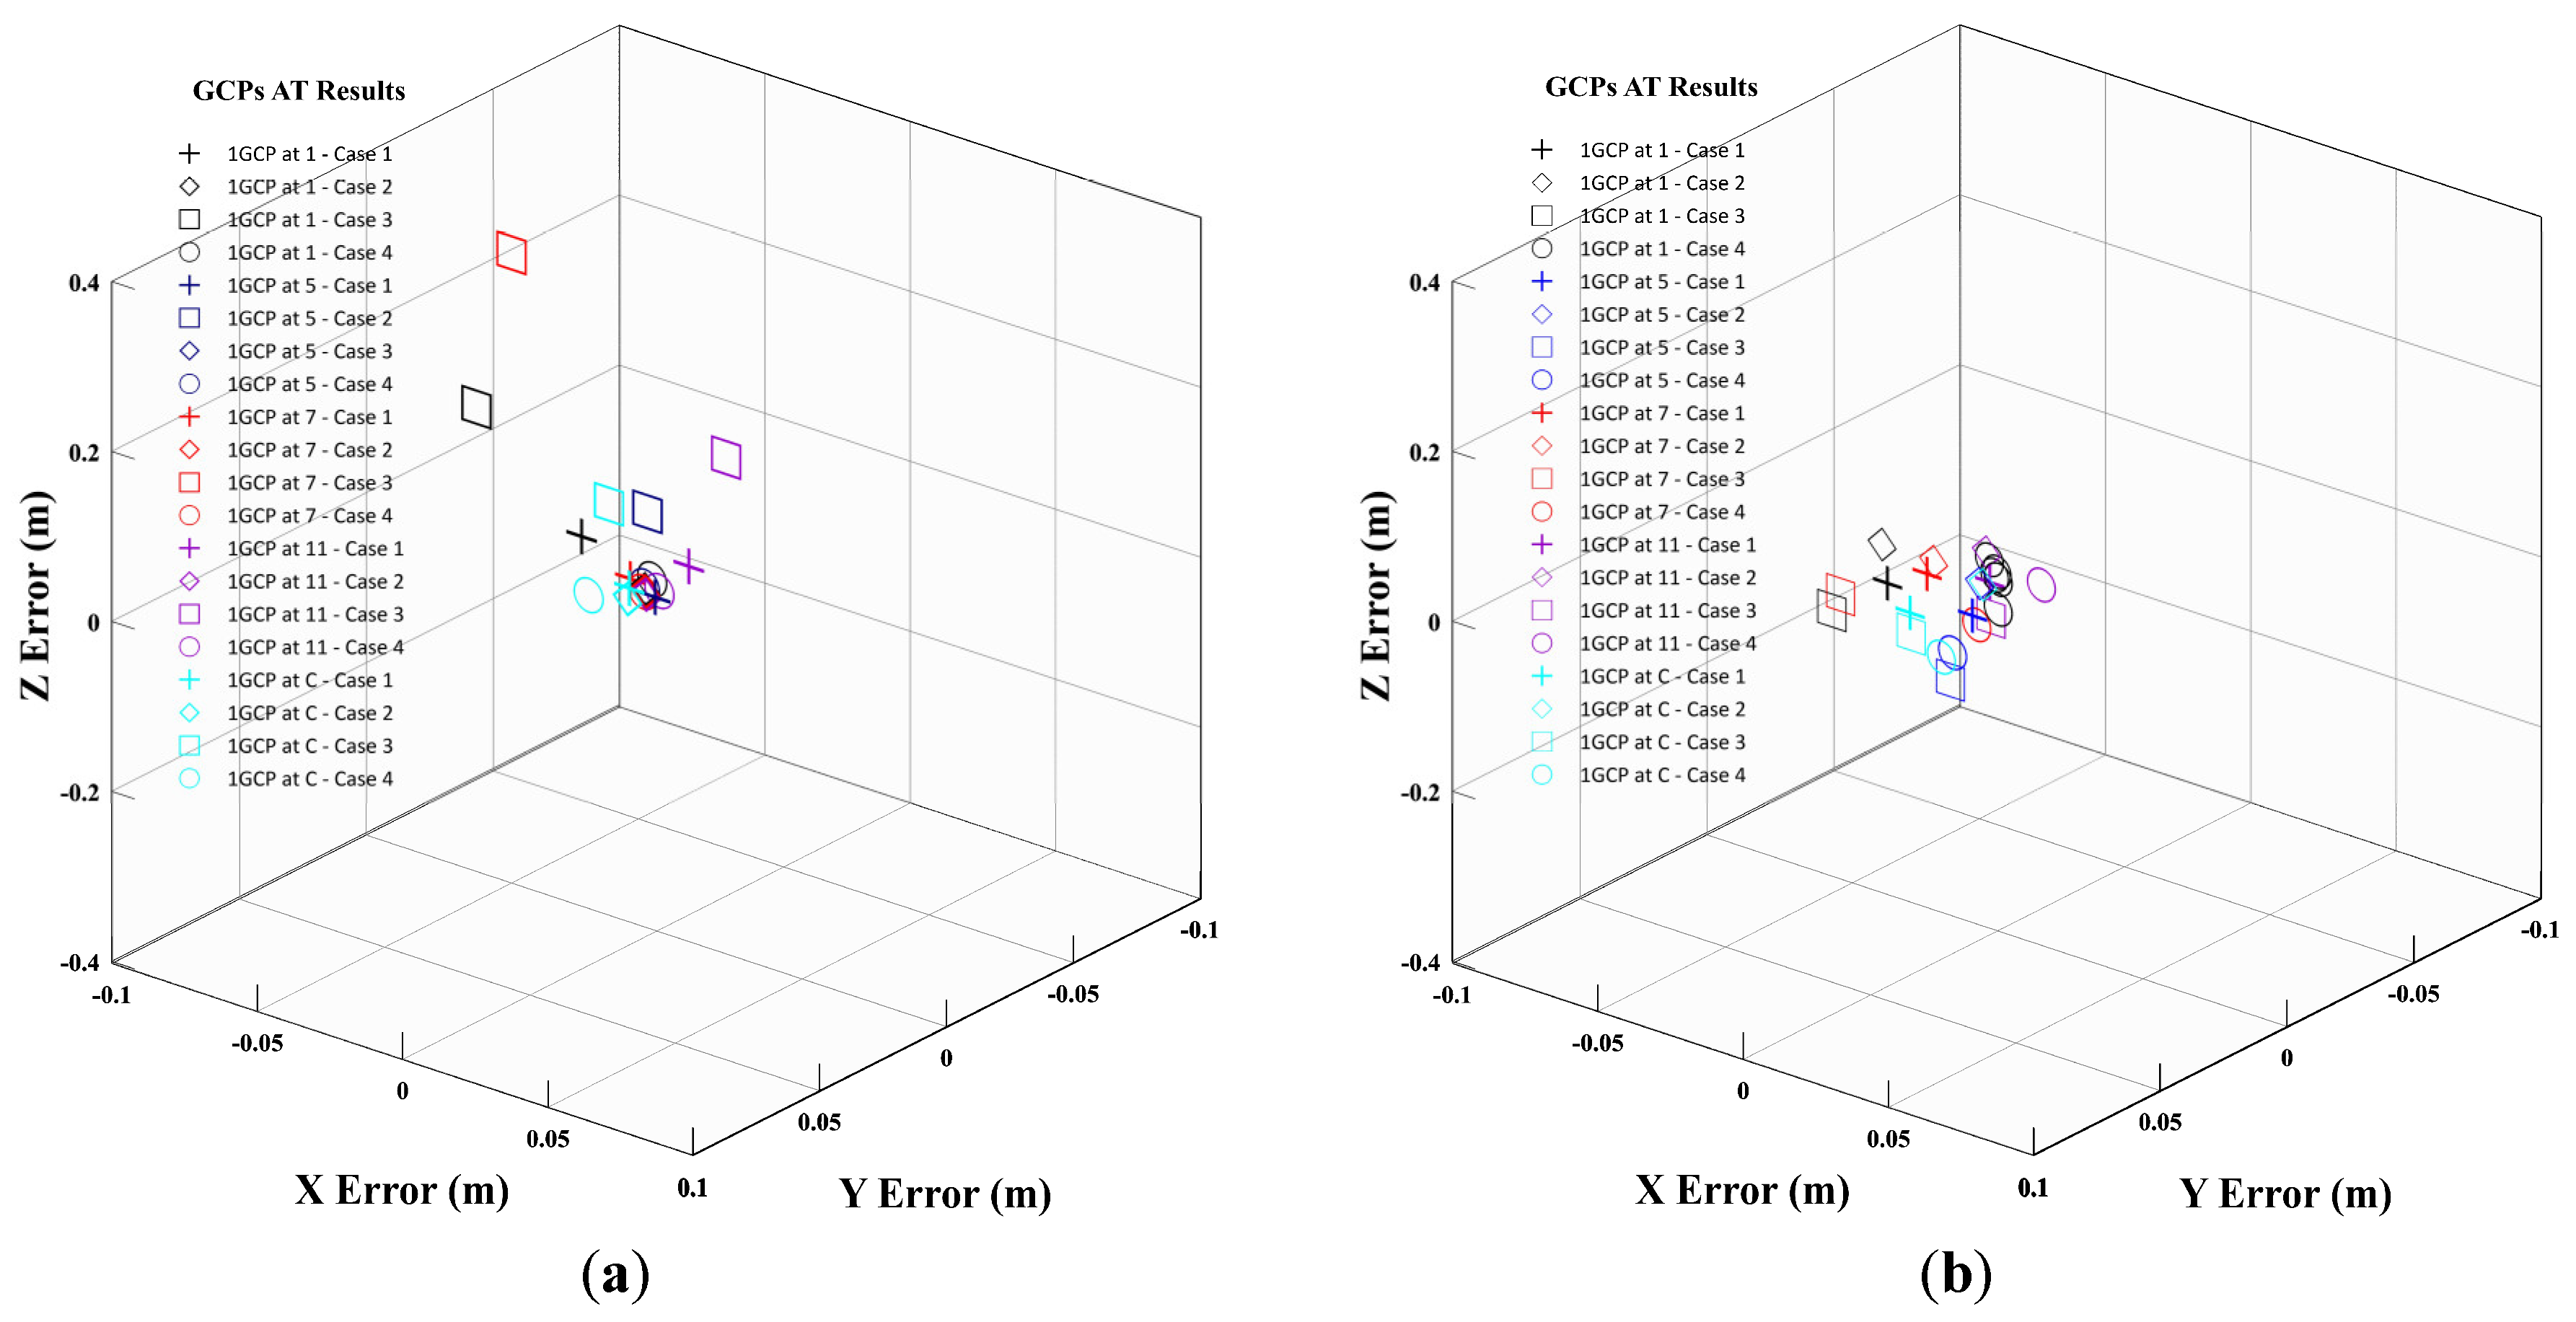
3. Evaluation of Aerial Triangulation Accuracy according to RTK Reception Rate and 1GCP Deployment

Individual AT results for the GCP and individual AT results for the CPs are shown in Figure 6 and Figure 7. The mean and RMSE for CPs are summarized as the results before and after PPK and are listed in Table 5 and Table 6. The accuracy of the AT relative orientation for the GCP and inspection point was within 0.5, as indicated in the AT work regulations. The observation accuracy of the GCP was similar to the GCP observation result [45] under the same RTK-UAV and shooting conditions. H is expressed as the value of the positive square root of XY, and Z is the result of elevation.
Before performing PPK, very different AT results are shown depending on the GCP arrangement for each case. The horizontal RMSE is estimated to be 2.74–85.67 cm, and the elevation RMSE is estimated to be 5.32–94.20 cm, showing a tendency for a wide distribution of errors to occur (Figure 6 and Figure 7).
In the result with PPK, the RMSE for the horizontal direction is approximately 3–4 cm, and the error for the elevation is approximately 5–10 cm depending on the case and GCP position. It can be observed that the difference in accuracy of CPs varies significantly depending on whether PPK is performed on the image. As analyzed in Section 2, the initial location accuracy recorded in the image is an important input variable of BBA and affects the AT result. Additionally, in this study, with 1GCP, it can be observed that when PPK is applied, accuracy of the 10 cm level can be obtained more effectively than that in the 1GCP situation when PPK is not applied (Table 5 and Table 6).
The accuracy that can be obtained through 1GCP+PPK is within the error regulations for the horizontal and elevation of the AT accuracy,  R M S E H   o r   R M S E Z 12   c m , related to the production of 1:1000 digital maps, as indicated in the UAV survey work regulations.

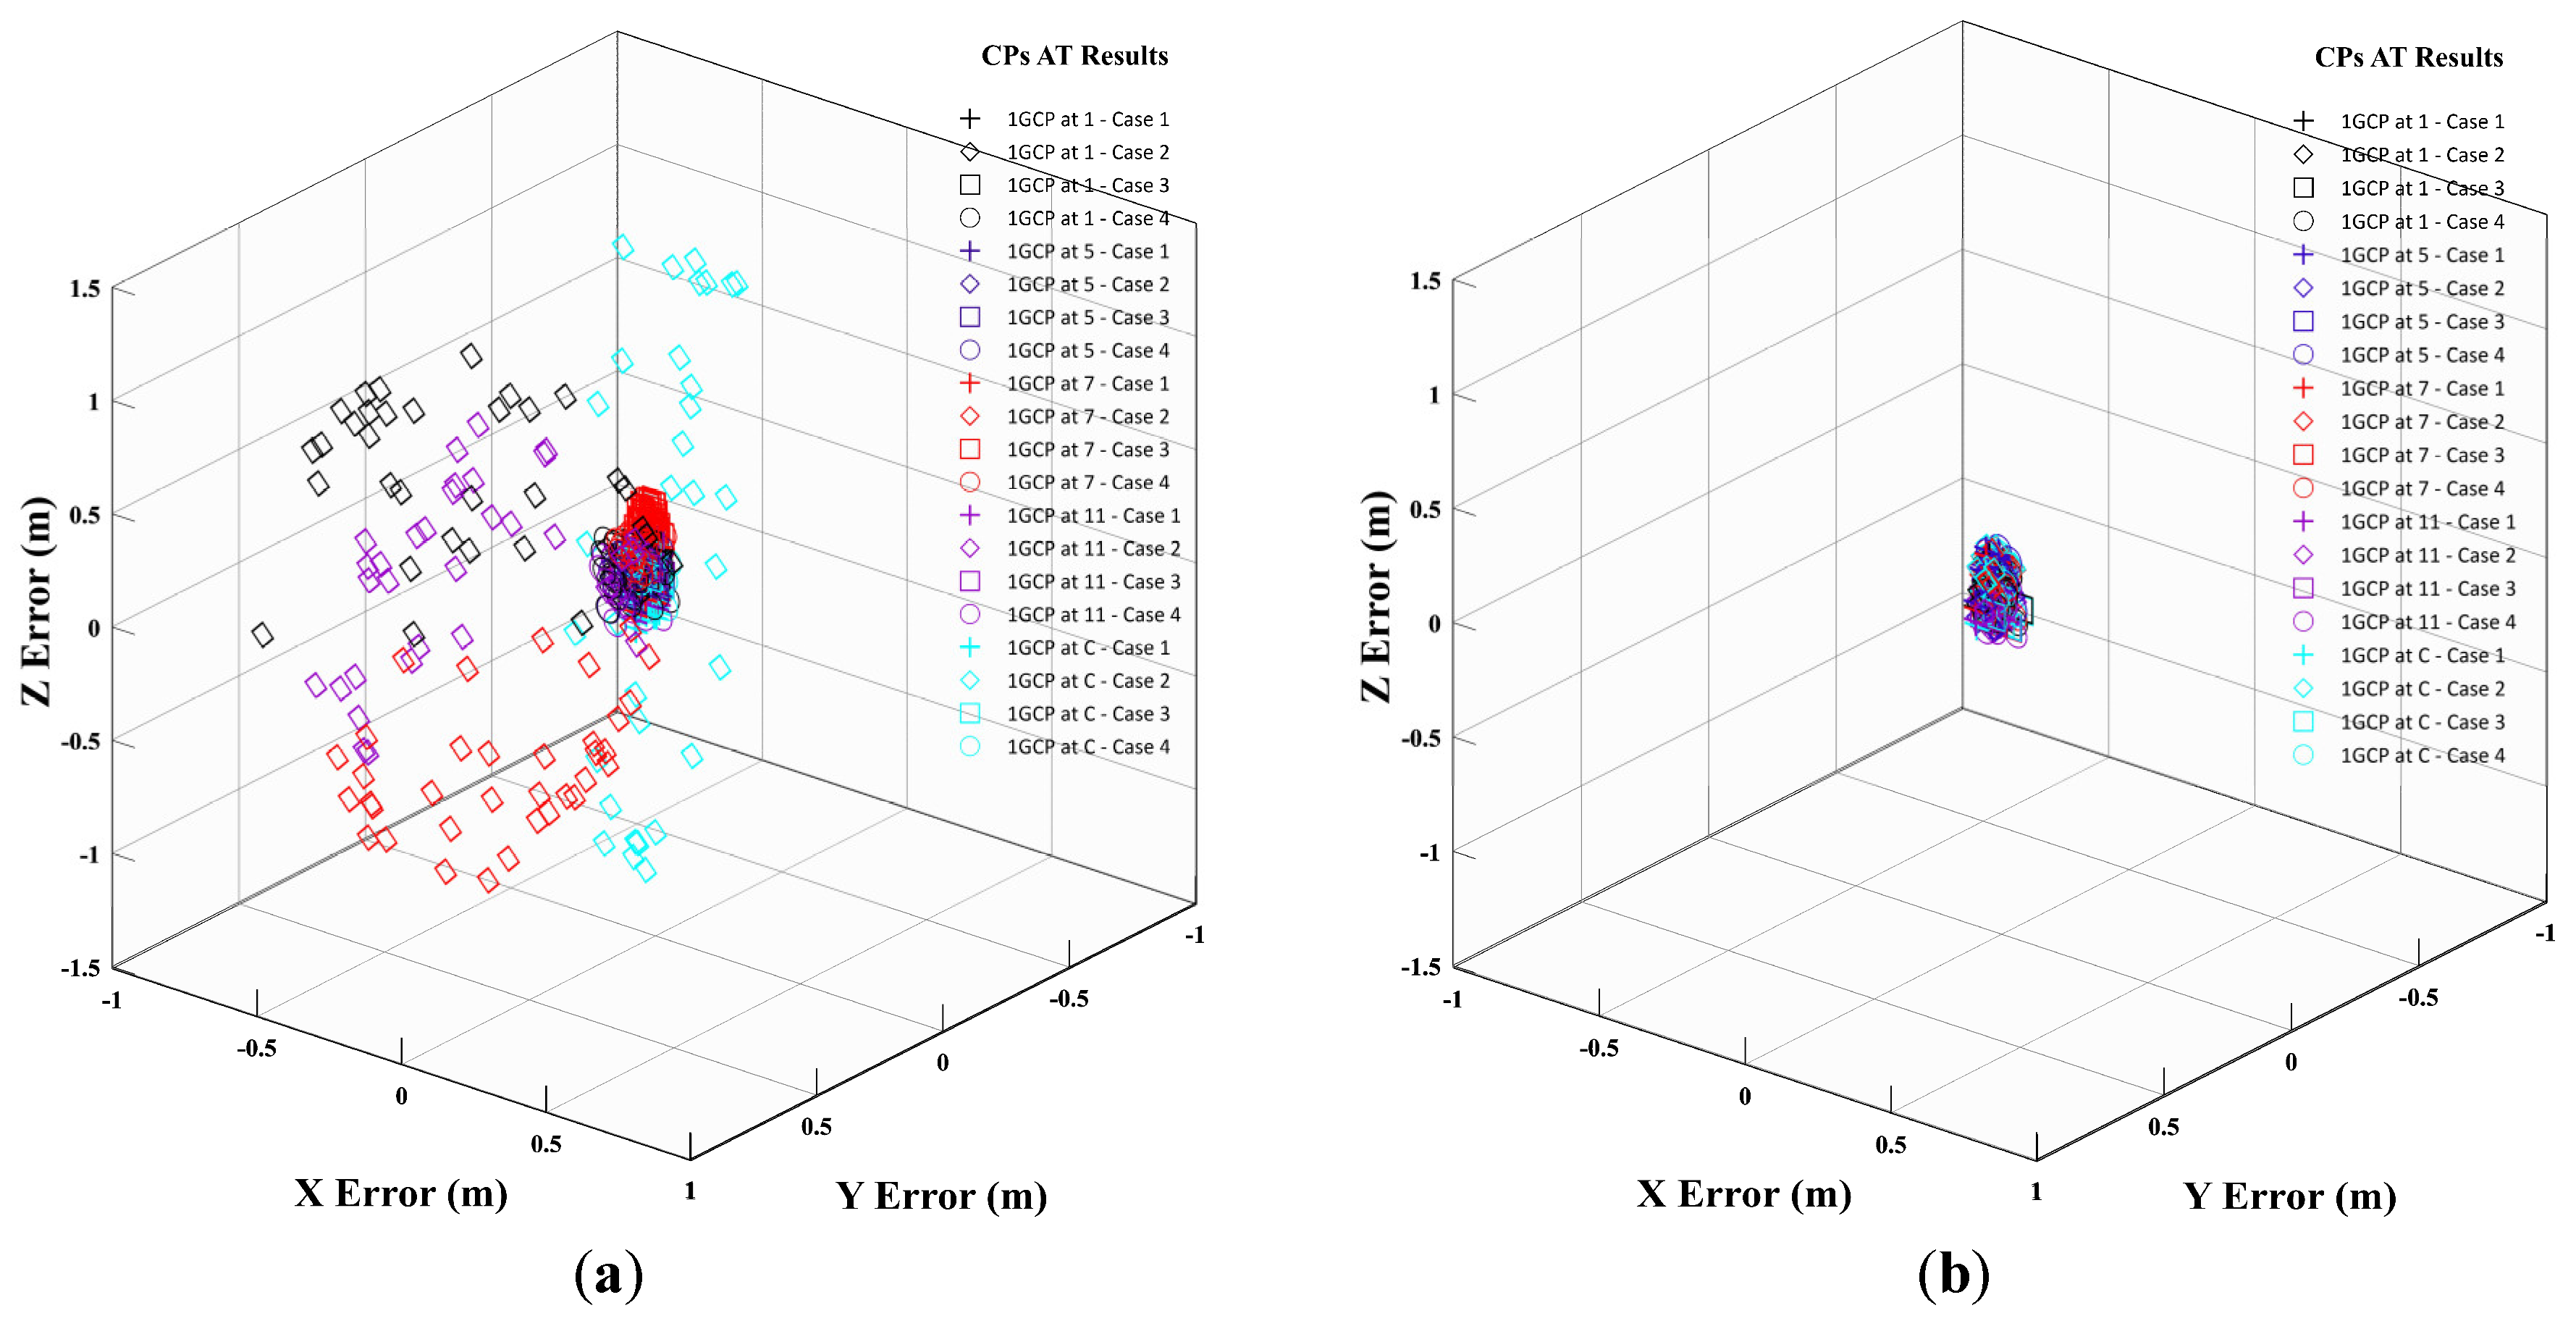
4. Accuracy Evaluation According to the Distance before and after PPK According to the Arrangement of GCP When 1GCP Is Applied

The relative distance between the GCP and CPs changed as the arrangement of the GCP changed (Table 7). Therefore, when 1GCP is applied, the errors for H and Z from the GCP to the checkpoint are shown in Figure 8 and Figure 9.
As Figure 8a and Figure 9a show 100% RTK received data, the slope of the trend line decreased very little even though PPK was performed. As Figure 8b and Figure 9b show GNSS conditions, the absolute error for the checkpoint was large. In non-PPK, it was confirmed that the H error increased linearly as the distance increased. Meanwhile, the projected point coordinate accuracy is significantly improved, and the slope of the trend line is significantly decreased. As seen in Table 4, this is because the error of AT decreases when the positional accuracy of the image is improved.
Figure 8c is corrected with approximately 90% of the RTK signal and shows a tendency to decrease slightly more than the slope decrease in Figure 8a. However, because the non-PPK result in Figure 9c has no negative value for elevation, it can be observed that the mean bias for a specific axis occurs, as mentioned by [17]. In addition, compared to Figure 9d, Figure 9c has a Z error of 10 m owing to the signal disconnection between the UAV and the controller, as described in Table 2, and hence the maximum error is rather large. Thus, it appears to be highly valued.
In Figure 8d and Figure 9d, the absolute size of the error is small compared to that in Figure 9b, even though the number of images acquired under RTK conditions is very small compared to the total number of shots. Meanwhile, in Cases 1 and 3, where RTK was used completely or mostly, it was confirmed that the tendency of the error to decrease as a result of PPK was significantly reduced. Therefore, bias which may occur during PPK processing could be decreased by using 1GCP.

5. Discussion

When conducting a survey using an RTK-UAV, the RTK signal is frequently disconnected. Images captured under conditions where the RTK signal is disconnected are observed with the precision of GNSS conditions. If the signal disturbance is even more severe, the signal between the UAV and the controller is disconnected, and the image may be captured without geotagging. However, if the RTK reception rate is good, the 3D location accuracy of the captured images is good. When BBA is performed, when the RTK reception rate is good, the weight involved in the AT calculation of 1GCP is reflected at a relatively low ratio compared to when the RTK reception is poor. Therefore, if an image with a good RTK signal is used, the accuracy of the AT is improved, and the 3D location accuracy of the spatial data constructed using such an image can be expected to be improved.
When surveying is performed using the RTK-UAV when the RTK signal is disconnected, errors occur, as in Cases 3 and 4, and the accuracy of the 3D data that can be obtained is lowered. Therefore, cumbersome additional shooting or multiple GCP surveys may be required to produce high-quality 3D spatial information. However, in the survey using RTK-UAV, the conditions for RTK reception rate were not included in the work regulations. Accordingly, workers who build spatial data using UAVs are performing inefficient work through methods which involve using an excessive number of GCPs or increasing overlap more than necessary in consideration of the safety factor. Therefore, it is necessary to distinguish between the case of using RTK-UAV and the case of using GNSS-UAV; in the case of RTK-UAV, detailed provisions should be made according to whether the RTK reception rate is good or bad.
As a result of this research, when 1GCP was applied, it was confirmed that the better the RTK reception rate was, the smaller the RMSE of the CPs. When PPK was not performed, the error trends were inconsistent. In addition, depending on the position of the GCP, the accuracy deviation of the CPs was very large. Case 3 and Case 1 were more comparable when PPK was not performed. In Case 3, the number of shots was more than twice as high as in Case 1 due to the double grid flight, but the RTK signal was relatively poor. Therefore, it showed a larger error overall.
Comparing Case 4 and Case 2, Case 4, which partially received the RTK signal, showed a significantly smaller error than Case 2, which was photographed under GNSS conditions. After analysis, it was observed that the bias for H and Z reduced because the image captured by RTK had a larger weight for AT input than the image captured by GNSS. Case 2 also shows that, even with 1GCP, the bias on H and Z cannot be effectively reduced (Figure 8 and Figure 9).
Since the error of CPs vary depending on the position of the GCP, the 1GCP+Non-PPK method is insufficient for completely determining the coordinates through BBA. Therefore, the use of PPK is essential in an environment where only a small number of GCPs can be used. It is also noteworthy that the placement of 1GCP has a different effect on accuracy under 1GCP+Non-PPK and 1GCP+PPK conditions. When 1GCP is located in the center of the study area, no large error is expected to occur because the maximum distance to CPs is relatively short. However, when PPK was not performed, a large error similar to the case where the GCP was located in the corner occurred.
These experimental results show a different tendency from the results of the previous study [30] as they suggest that it is better to place the GCP in the center of the target area. The reason for this result is attributed to the fact that the previous study used a sufficient number of GCPs, whereas this study used only one GCP. In addition, it was confirmed that the use of 1GCP+PPK can suppress the bias for Z compared to the case without use, but the Z error in Case 3 was still biased. As a result of this experiment, accuracies of RMSEH = 1.0 GSD ± 0.06 cm and RMSEZ = 2.4 GSD ± 0.44 cm were obtained with 1GCP+PPK according to the GCP arrangement and shooting case. In the case of 1GCP+Non-PPK, accuracies of RMSEH = 6.4 GSD ± 9.92 cm and RMSEZ = 9.5 GSD ± 9.76 cm were obtained. In the case of using 1GCP+PPK, including the maximum error up to 1 km, H shows results within 10 cm and Z within 20 cm.
If the VRS signal is good [46], positioning is possible through GNSS with RMSEH of 10 cm and RMSEZ of 20 cm. As a result of the experiment in this study, it was confirmed that when using RTK-UAV, a similar accuracy to that in previous studies was obtained through 1GCP+PPK, even when the RTK signal was disconnected.
If 1GCP+PPK is applied using the RTK-UAV method, sufficient accuracy can be obtained even if only one GCP is placed near the UAV take-off point without locating a GCP in the center of the work area up to a radius of 1 km. This confirms that the placement geometry of the GCPs is not significant, as analyzed in [31]. Therefore, it was confirmed that, even when signal disconnection occurred or the shooting direction was a single grid, the resulting value was within the AT tolerance accuracy of the UAV required for 1:1000 digital map production.

6. Conclusions

If an RTK-UAV is used, it is difficult to acquire all images captured using the UAV in the RTK state because the RTK signal may be disconnected. A difference in accuracy occurs when spatial data are built based on these images. In this study, PPK was used to solve these problems. In a survey using a UAV and datasets with different RTK reception rates and shooting conditions, we wanted to confirm that there was no significant difference in accuracy when AT was performed before and after PPK based on the geometrical arrangement of 1GCP and distance between 1GCP and CPs according to PPK. The results obtained in this experiment are as follows.
First, in the case of 1GCP+Non-PPK, the accuracy varied according to the RTK signal reception rate, and the AT result differed according to the GCP arrangement. However, when 1GCP+PPK was performed, there was no significant difference in the RTK signal reception rate, and it was not necessary to consider the distance between GCPs and CPs up to a radius of 1 km from the GCPs. In the size of the study site, RMSEH,Z ≈ 3 GSD accuracy was shown as a result of performing 1GCP+PPK.
Second, when using RTK-UAV, if 1GCP is installed at the point where the UAV takes off and PPK is performed, in the case of a GSD of about 3 cm, an error level of H = 10 cm and Z = 20 cm can be expected up to a radius of 1 km. Therefore, it is possible to efficiently produce 3D spatial data without additional cumbersome flights or physical GCP surveys.
Third, it was found that, regardless of whether the GCP is not positioned in the center of the target area, the vertical bias that may arise during PPK processing can be effectively removed using 1GCP.
Fourth, with the growing popularity of UAVs and urban air mobility (UAM), the demand for highly accurate data sets in urban areas will increase. Even though RTK reception is poor in places containing urban canyon areas, it is expected that high-precision 3D data will be successfully generated using the experimental results of this study.
In this study, the signal disconnection was not intentionally caused. To conduct time series analysis for about 3 years from 2020 to 2022, four signal breaks occurred out of a total of ten experiments, and three of these data were used. Therefore, control variables for signal disconnection were unclear, and experiments on more diverse RTK signal disconnection scenarios are needed in future studies.

Author Contributions

J.M.C. conducted data research, manuscript preparation, and designed experimental methods. B.K.L. reviewed, edited, and acted as a supervisor. All authors have read and agreed to the published version of the manuscript.

Funding

This work was supported by a National Research Foundation of Korea (NRF) grant funded by the Korean government (MSIT) (No. 2022R1A4A5028239).

Data Availability Statement

Not applicable.

Acknowledgments

We appreciate the reviewer’s anonymity. They helped the authors to more clearly modify their expressions and goals.

Conflicts of Interest

The authors declare no conflict of interest.

Abbreviations

AT(Aerial Triangulation)
CORS(Continuously Observation Reference Station)
CP(Check Point)
GCP(Ground Control Point)
GNSS(Global Navigation Satellite System)
IMU(Inertial Measurement Unit)
PDOP(Position Dilution of Precision)
PPK(Post Process Kinematic)
PPP(Precise Point Positioning)
RINEX(Receiver Independent Exchange Format)
RMSE(Root Mean Square Error)
RTCM(Radio Technical Commission for Maritime Services)
RTK(Real Time Kinematic)
UAV(Unmanned Aerial Vehicle)
UAM(Urban Air Mobility)
VRS(Virtual Reference Station)

References

  1. Kim, J.; Lee, S.; Seo, J.; Lee, D.; Choi, H.S. The integration of earthwork design review and planning using uav-based point cloud and bim. Appl. Sci. 2021, 11, 3435. [Google Scholar] [CrossRef]
  2. Eker, R.; Elvanoglu, N.; Ucar, Z.; Bilici, E.; Aydın, A. 3D modelling of a historic windmill: PPK-aided terrestrial photogrammetry vs smartphone app. Int. Arch. Photogramm. Remote Sens. Spat. Inf. Sci. 2022, 43, 787–792. [Google Scholar] [CrossRef]
  3. Kim, D.; Song, Y.; Kim, G.; Kim, C. A study on the application of UAV for Korean land monitoring. J. Korean Soc. Surv. Geod. Photogramm. Cartogr. 2014, 32, 29–38. [Google Scholar] [CrossRef] [Green Version]
  4. Pádua, L.; Marques, P.; Adão, T.; Guimarães, N.; Sousa, A.; Peres, E.; Sousa, J.J. Vineyard variability analysis through UAV-based vigour maps to assess climate change impacts. Agronomy 2019, 9, 581. [Google Scholar] [CrossRef] [Green Version]
  5. Chivasa, W.; Mutanga, O.; Biradar, C. UAV-based multispectral phenotyping for disease resistance to accelerate crop improvement under changing climate conditions. Remote Sens. 2020, 12, 2445. [Google Scholar] [CrossRef]
  6. Feifei, X.; Zongjian, L.; Dezhu, G.; Hua, L. Study on construction of 3D building based on UAV images. Int. Arch. Photogramm. Remote Sens. Spat. Inf. Sci. 2012, 39, B1. [Google Scholar]
  7. Park, S.; Choi, Y.; Bae, J.; Hong, S.; Sohn, H. Three-dimensional positional accuracy analysis of uav imagery using ground control points acquired from multisource geospatial data. Korean J. Remote Sens. 2020, 36, 1013–1025. [Google Scholar]
  8. Laporte-Fauret, Q.; Marieu, V.; Castelle, B.; Michalet, R.; Bujan, S.; Rosebery, D. Low-cost UAV for high-resolution and large-scale coastal dune change monitoring using photogrammetry. J. Mar. Sci. Eng. 2019, 7, 63. [Google Scholar] [CrossRef] [Green Version]
  9. National Geographic Information Institute Regulations for Unmanned Aerial Vehicle Surveying Work. Suwon, Korea, Notice No. 2020–5670. 2020. Available online: https://www.ngii.go.kr/kor/board/view.do?sq=69672&board_code=lawinfo: (accessed on 11 March 2023).
  10. Eisenbeiss, H.; Sauerbier, M. Investigation of UAV systems and flight modes for photogrammetric applications. Photogramm. Rec. 2011, 26, 400–421. [Google Scholar] [CrossRef]
  11. Gómez-Gutiérrez, Á.; Sánchez-Fernández, M.; Juan de Sanjosé-Blasco, J. Performance of different UAS platforms, techniques (LIDAR and photogrammetry) and referencing approaches (RTK, PPK or GCP-based) to acquire 3D data in coastal cliffs. In Proceedings of the EGU General Assembly Conference Abstracts, Vienna, Austria, 23–27 May 2022; p. EGU22-9881. [Google Scholar]
  12. Bulgakov, A.; Sayfeddine, D.; Yu, W.; Buzalo, N. Comparing Embedded Technologies for Aerial Geomatics Using Unmanned Aerial Systems. In Modern Problems in Construction: Selected Papers from MPC 2021; Springer: Berlin/Heidelberg, Germany, 2022; pp. 13–20. [Google Scholar]
  13. Štroner, M.; Urban, R.; Seidl, J.; Reindl, T.; Brouček, J. Photogrammetry using UAV-mounted GNSS RTK: Georeferencing strategies without GCPs. Remote Sens. 2021, 13, 1336. [Google Scholar] [CrossRef]
  14. Bertin, S.; Stéphan, P.; Ammann, J. Assessment of RTK Quadcopter and Structure-from-Motion Photogrammetry for Fine-Scale Monitoring of Coastal Topographic Complexity. Remote Sens. 2022, 14, 1679. [Google Scholar] [CrossRef]
  15. Henkel, P.; Sperl, A.; Mittmann, U.; Fritzel, T.; Strauss, R.; Steiner, H. Precise 6D RTK positioning system for UAV-based near-field antenna measurements. In Proceedings of the 2020 14th European Conference on Antennas and Propagation (EuCAP), Copenhagen, Denmark, 15–20 March 2020; IEEE: Piscataway, NJ, USA, 2020; pp. 1–5. [Google Scholar]
  16. Kang, I.; Kim, T. Accuracy evaluation of 3D slope model produced by drone taken images. J. Korean GEO-Environ. Soc. 2020, 21, 13–17. [Google Scholar]
  17. Cho, J.; Lee, J.; Lee, B. Application of UAV Photogrammetry to Slope-Displacement Measurement. KSCE J. Civ. Eng. 2022, 26, 1904–1913. [Google Scholar] [CrossRef]
  18. Nesbit, P.R.; Hubbard, S.M.; Hugenholtz, C.H. Direct georeferencing UAV-SfM in high-relief topography: Accuracy assessment and alternative ground control strategies along steep inaccessible rock slopes. Remote Sens. 2022, 14, 490. [Google Scholar] [CrossRef]
  19. Ocalan, T.; Turk, T.; Tunalioglu, N.; Gurturk, M. Investigation of accuracy of PPP and PPP-AR methods for direct georeferencing in UAV photogrammetry. Earth Sci. Inform. 2022, 15, 2231–2238. [Google Scholar] [CrossRef]
  20. Pix4D Documentation; Pix4D SA: Lausanne, Switzerland, 2022.
  21. Chiabrando, F.; Tonolo, F.G.; Lingua, A. Uav direct georeferencing approach in an emergency mapping context. the 2016 central Italy earthquake case study. Int. Arch. Photogramm. Remote Sens. Spat. Inf. Sci. 2019, 42, 247–253. [Google Scholar] [CrossRef] [Green Version]
  22. Dreier, A.; Janßen, J.; Kuhlmann, H.; Klingbeil, L. Quality analysis of direct georeferencing in aspects of absolute accuracy and precision for a UAV-based laser scanning system. Remote Sens. 2021, 13, 3564. [Google Scholar] [CrossRef]
  23. Famiglietti, N.A.; Cecere, G.; Grasso, C.; Memmolo, A.; Vicari, A. A test on the potential of a low cost unmanned aerial vehicle RTK/PPK solution for precision positioning. Sensors 2021, 21, 3882. [Google Scholar] [CrossRef] [PubMed]
  24. Zeybek, M. Accuracy assessment of direct georeferencing UAV images with onboard global navigation satellite system and comparison of CORS/RTK surveying methods. Meas. Sci. Technol. 2021, 32, 065402. [Google Scholar] [CrossRef]
  25. Leandro, R.F.; Santos, M.C.; Langley, R.B. Analyzing GNSS data in precise point positioning software. GPS Solut. 2011, 15, 1–13. [Google Scholar] [CrossRef]
  26. Håkansson, M.; Jensen, A.B.; Horemuz, M.; Hedling, G. Review of code and phase biases in multi-GNSS positioning. GPS Solut. 2017, 21, 849–860. [Google Scholar] [CrossRef] [Green Version]
  27. Vierinen, J.; Coster, A.J.; Rideout, W.C.; Erickson, P.J.; Norberg, J. Statistical framework for estimating GNSS bias. Atmos. Meas. Tech. 2016, 9, 1303–1312. [Google Scholar] [CrossRef] [Green Version]
  28. Berber, M.; Munjy, R.; Lopez, J. Kinematic GNSS positioning results compared against Agisoft Metashape and Pix4dmapper results produced in the San Joaquin experimental range in Fresno County, California. J. Geod. Sci. 2021, 11, 48–57. [Google Scholar] [CrossRef]
  29. Yan, L.; Wan, J.; Sun, Y.; Fan, S.; Yan, Y.; Chen, R. A novel absolute orientation method using local similarities representation. ISPRS Int. J. Geo-Inf. 2016, 5, 135. [Google Scholar] [CrossRef] [Green Version]
  30. Zhang, H.; Aldana-Jague, E.; Clapuyt, F.; Wilken, F.; Vanacker, V.; Van Oost, K. Evaluating the potential of post-processing kinematic (PPK) georeferencing for UAV-based structure- from-motion (SfM) photogrammetry and surface change detection. Earth Surf. Dyn. 2019, 7, 807–827. [Google Scholar] [CrossRef] [Green Version]
  31. Bolkas, D. Assessment of GCP number and separation distance for small UAS surveys with and without GNSS-PPK positioning. J. Surv. Eng. 2019, 145, 04019007. [Google Scholar] [CrossRef]
  32. Zhang, K.; Okazawa, H.; Hayashi, K.; Hayashi, T.; Fiwa, L.; Maskey, S. Optimization of ground control point distribution for unmanned aerial vehicle photogrammetry for inaccessible fields. Sustainability 2022, 14, 9505. [Google Scholar] [CrossRef]
  33. Park, J.W.; Yeom, D.J. Method for establishing ground control points to realize UAV-based precision digital maps of earthwork sites. J. Asian Archit. Build. Eng. 2022, 21, 110–119. [Google Scholar] [CrossRef]
  34. Hastaoglu, K.O.; Kapicioglu, H.S.; Gül, Y.; Poyraz, F. Investigation of the effect of height difference and geometry of GCP on position accuracy of point cloud in UAV photogrammetry. Surv. Rev. 2022, 1–13. [Google Scholar] [CrossRef]
  35. Choi, H.J.; Lee, B.; Yeon, S.H. A study on the site calibration of Network RTK surveying. J. Korean Soc. Surv. Geod. Photogramm. Cartogr. 2013, 31, 99–107. [Google Scholar] [CrossRef] [Green Version]
  36. Žabota, B.; Kobal, M. Accuracy assessment of uav-photogrammetric-derived products using PPK and GCPs in challenging terrains: In search of optimized rockfall mapping. Remote Sens. 2021, 13, 3812. [Google Scholar] [CrossRef]
  37. Kim, K.B.; Yun, H.S.; Choi, H.J. Accuracy evaluation of geoid heights in the national control points of south Korea using high-degree geopotential model. Appl. Sci. 2020, 10, 1466. [Google Scholar] [CrossRef] [Green Version]
  38. Lee, J.; Kwon, J.H. Review the status of Korean geoid model development since 2000s and future improvement plan. Terr. Atmos. Ocean. Sci. 2022, 33, 12. [Google Scholar] [CrossRef]
  39. DJI Phantom 4 RTK User Manual; v2.4. 2021. DJI Phantom 4 RTK User Manual; v2.4. 2021. Available online: https://dl.djicdn.com/downloads/phantom_4_rtk/20210716/Phantom_4_RTK_User_Manual_v2.4_EN.pdf: (accessed on 11 March 2023).
  40. Lee, K.; Lee, W.H. Earthwork Volume Calculation, 3D Model Generation, and Comparative Evaluation Using Vertical and High-Oblique Images Acquired by Unmanned Aerial Vehicles. Aerospace 2022, 9, 606. [Google Scholar] [CrossRef]
  41. Przybilla, H.; Gerke, M.; Dikhoff, I.; Ghassoun, Y. Investigations on the Geometric Quality of Cameras for Uav Applications Using the High Precision Uav Test Field Zollern Colliery. Int. Arch. Photogramm. Remote Sens. Spat. Inf. Sci. 2019, XLII-2/W13, 531–538. [Google Scholar] [CrossRef] [Green Version]
  42. Zhou, Y.; Daakir, M.; Rupnik, E.; Pierrot-Deseilligny, M. A two-step approach for the correction of rolling shutter distortion in UAV photogrammetry. ISPRS J. Photogramm. Remote Sens. 2020, 160, 51–66. [Google Scholar] [CrossRef]
  43. Choi, Y.W.; Yoon, H.W.; Choo, M.J.; Yoon, D.K. A Study on Precision of 3D Spatial Model of a Highly Dense Urban Area based on Drone Images. J. Korean Soc. Surv. Geod. Photogramm. Cartogr. 2022, 40, 69–77. [Google Scholar]
  44. Kong, L.; Chen, T.; Kang, T.; Chen, Q.; Zhang, D. An Automatic and Accurate Method for Marking Ground Control Points in Unmanned Aerial Vehicle Photogrammetry. IEEE J. Sel. Top. Appl. Earth Obs. Remote Sens. 2022, 16, 278–290. [Google Scholar] [CrossRef]
  45. Cho, J.; Lee, J.; Lee, B. A study on the optimal shooting conditions of UAV for 3D production and orthophoto generation. J. Korean Soc. Surv. Geod. Photogramm. Cartogr. 2020, 38, 645–653. [Google Scholar]
  46. No, S.; Han, J.; Kwon, J.H. Accuracy analysis of network-RTK (VRS) for real time kinematic positioning. J. Korean Soc. Surv. Geod. Photogramm. Cartogr. 2012, 30, 389–396. [Google Scholar] [CrossRef] [Green Version]
Figure 1. Research flow chart.
Drones 07 00265 g001
Figure 2. Study area of hwarang park area in Ansan, Republic of Korea.
Drones 07 00265 g002
Figure 3. Distance analysis from nearby Suwon base station and Incheon base station near the study area for good RTK signal reception.
Drones 07 00265 g003
Figure 4. External virtual reference station (VRS)-GNSS survey for site calibration.
Drones 07 00265 g004
Figure 5. Arrangement plan when one ground control point (GCP) is used: (a) Center of study area; (b) 1 o’clock direction; (c) 5 o’clock direction; (d) 7 o’clock direction; (e) 11 o’clock direction.
Drones 07 00265 g005
Figure 6. Comparison of result values of the GCP before and after post-processing when one GCP is applied: (a) before; (b) after post-processing of the GCP.
Drones 07 00265 g006
Figure 7. Comparison of result values of the CPs before and after post-processing when one GCP is applied: (a) before; (b) after post-processing.
Drones 07 00265 g007
Figure 8. Horizontal error according to distance when using one GCP for each case: (a) Case 1; (b) Case 2; (c) Case 3; (d) Case 4.
Drones 07 00265 g008
Figure 9. Vertical error according to distance when using one GCP for each case: (a) Case 1; (b) Case 2; (c) Case 3; (d) Case 4.
Drones 07 00265 g009
Table 1. Site calibration result.
Survey PointReference PointdN (m)dE (m)Geoid Height (m)Hor. Residual (m)Ver. Residual (m)
U19U Anyang 19−0.0010.00223.0570.002−0.027
U20U Anyang 200.0020.00622.9740.0070.022
U22U Anyang 22−0.010−0.00523.0380.011−0.011
U75U Anyang 750.009−0.00423.2610.0100.016
Table 2. Shooting plan and calibration of the UAV position.
CaseUAV Survey DateFront and Side Overlap (%)Flight Height
(m)
Camera AngleFlight Speed
(m/s)
CourseImages
GeoReference
DisconnectGNSSRTK
116 December 202070100Nadir10Single Grid 658
217 December 202070100Nadir10Single Grid 646
310 February 202175100Nadir10Double Grid113651477
423 February 202175100Nadir10Double Grid 159991
Table 3. Internal camera parameters (Case 1, non-post-process kinematics (PPK), GCP at 1 o’clock).
Focal Length Pixel/mmPrincipal Point x
Pixel/mm
Principal Point y
Pixel/mm
R1R2R3T1T2
Initial Value3658.3/
8.580
2722.5/6.385 1835.1/
4.304
−0.2690.112−0.0330.000−0.001
Optimized Values3683.661/
8.639
2731.889/6.4071845.674/4.329−0.2670.109−0.0310.000−0.000
Uncertainties (Sigma)0.663/0.0020.119/0.0000.083/0.0000.0000.0000.0000.0000.000
Table 4. Comparison of the horizontal and height accuracy recorded in the original photograph and the post-processing accuracy.
CaseOriginal Image Accuracy DataPPK Image Accuracy Data
H (cm)Z (cm)H (mm)Z (mm)
12.354.255.629.59
2116.92274.616.239.24
341.1084.695.639.70
4116.84254.0214.7322.72
Table 5. Accuracy evaluation for each non post-processed case when one GCP is used according to the arrangement.
GCP LocationCaseError H
(cm)
Z
(cm)
Reprojection Error
1 o’clock
direction
1Mean−1.3914.590.268
RMSE2.7415.53
2Mean66.3090.770.346
RMSE78.0598.72
3Mean1.5516.140.312
RMSE3.2716.66
4Mean5.6911.540.275
RMSE8.1413.32
5 o’clock
direction
1Mean−1.737.190.275
RMSE3.238.83
2Mean72.8723.110.346
RMSE85.6768.52
3Mean1.5411.940.303
RMSE3.2612.66
4Mean4.7311.550.283
RMSE6.6112.61
7 o’clock
direction
1Mean−1.665.560.274
RMSE3.207.49
2Mean59.85−41.150.352
RMSE68.7445.75
3Mean1.9632.590.271
RMSE3.4632.87
4Mean3.5519.150.282
RMSE5.9419.96
11 o’clock
direction
1Mean−1.692.780.269
RMSE3.195.82
2Mean61.0133.050.347
RMSE74.7660.40
3Mean1.5516.000.306
RMSE3.2516.53
4Mean5.674.700.279
RMSE8.198.65
Center of study area1Mean−1.68−1.230.273
RMSE3.205.32
2Mean1.5825.420.347
RMSE13.6394.20
3Mean1.5811.460.312
RMSE3.2712.20
4Mean2.118.450.281
RMSE4.2911.22
Table 6. Accuracy evaluation for each post-processed case when one GCP was used according to the arrangement.
GCP LocationCaseError H
(cm)
Z
(cm)
Reprojection Error
1 o’clock
direction
1Mean1.895.700.333
RMSE3.027.65
2Mean1.250.420.332
RMSE3.445.00
3Mean1.64−5.150.414
RMSE3.096.98
4Mean1.490.310.327
RMSE2.995.64
5 o’clock
direction
1Mean1.978.110.328
RMSE3.079.58
2Mean1.367.550.329
RMSE3.498.97
3Mean1.66−5.220.338
RMSE3.097.04
4Mean1.396.520.335
RMSE2.988.58
7 o’clock
direction
1Mean1.935.280.333
RMSE3.047.35
2Mean1.327.410.334
RMSE3.478.84
3Mean1.71−5.420.322
RMSE3.157.19
4Mean1.412.670.338
RMSE2.966.21
11 o’clock
direction
1Mean1.940.130.331
RMSE3.065.13
2Mean1.33−6.470.331
RMSE3.448.27
3Mean1.67−5.210.339
RMSE3.087.02
4Mean1.41−4.640.333
RMSE3.007.31
Center of study area1Mean1.92−1.730.328
RMSE3.045.43
2Mean1.347.680.331
RMSE3.499.08
3Mean1.66−4.970.399
RMSE3.096.86
4Mean1.394.000.335
RMSE2.956.87
Table 7. CP and distance change according to GCP arrangement.
GCP Arrangement (m)
Center15711
Horz. Accuracy0.0140.0140.0140.0140.014
Vert. Accuracy0.0200.0300.0200.0320.030
Distance Min101.942.2181.767.676.9
Avg356.7589.3637.9630.3590.6
Max568.51048.91051.01048.91051.0
Disclaimer/Publisher’s Note: The statements, opinions and data contained in all publications are solely those of the individual author(s) and contributor(s) and not of MDPI and/or the editor(s). MDPI and/or the editor(s) disclaim responsibility for any injury to people or property resulting from any ideas, methods, instructions or products referred to in the content.

