Article

Application of Space–Sky–Earth Integration Technology with UAVs in Risk Identification of Tailings Ponds

1
School of Energy and Mining, China University of Mining and Technology-Beijing, Beijing 100083, China
2
School of Civil Engineering, North China University of Technology, Beijing 100144, China
3
China Academy of Safety Science and Technology, Beijing 100012, China
4
School of Safety Engineering, China University of Mining and Technology-Beijing, Beijing 100083, China
*
Author to whom correspondence should be addressed.
Drones 2023, 7(4), 222; https://doi.org/10.3390/drones7040222
Submission received: 15 February 2023 / Revised: 20 March 2023 / Accepted: 21 March 2023 / Published: 23 March 2023

Abstract

:
Unmanned aerial vehicle (UAV) tilt photography technology has gradually become a new technical means of disaster risk identification. This technology combines UAVs, satellite remote sensing, and ground online monitoring systems to establish an integrated space–sky–Earth system that can be used for tailings pond risk identification. With the use of this system for visual interpretation, water body identification, and monitoring data analysis, multiple types of monitoring parameters of a typical tailings pond in China, such as the seepage line and surface deformation, were obtained. Moreover, intelligent fusion analysis was performed of multisource data to outline the problems affecting tailings safety in the process of elevation expansion and irregular ore discharge of the tailings pond. Warning values of different levels were obtained to assess the overall safety condition of the tailings pond, and the proposed technology was verified. The research results could provide a new basis for accurate evaluation of the running state of tailings ponds and offer an effective remote monitoring means for tailings pond enterprises and supervisory departments.

1. Introduction

Tailings are byproducts of ore processing. After extracting useful substances from the original coarse ore, mining companies typically add water to the generated waste and mix the material into a slurry with a certain concentration. Under the action of gravity and hydrodynamics, hydraulic deposition structures, namely tailings ponds, are formed [1]. Tailings ponds represent a major hazard source with high potential energy, and related accidents and hazards rank 18th among 93 types of accidents and public hazards worldwide [2]. According to statistics, landslides and overtopping are the main causes of tailings pond accidents, accounting for up to 65% of all accidents [3]. Many countries, such as China, Brazil, and Italy, have experienced tailings pond dam-break accidents [4,5,6,7], which have caused heavy casualties and serious economic losses. These types of accidents can irreparably damage the surrounding environment. In 2016, the Work Safety Authority in China clearly defined tailings ponds that can cause significant downstream human or economic losses as overhead tailings ponds. Such ponds have residents or important facilities located approximately one kilometer downstream. When a dam breaks, the mud and sand flow rate is high, and only a few minutes are needed for the flow to cross the distance from the foot of the dam to one kilometer downstream. The disaster occurs suddenly, the evacuation of downstream residents and the transfer of facility personnel are challenging, and the safety risk is much higher than that associated with other types of tailings ponds. Thus, it is very important to study disaster warning systems for tailings ponds.
In China, safety monitoring technology of tailings ponds is relatively simple, and remote management is difficult. Landslide monitoring and assessment are indispensable parts of the tailings dam failure warning system [8], including the study of tailings pond failure and the identification of the deformation zone [9]. In tailings pond monitoring systems, the combination of landslide monitoring with general packet radio service (GPRS), Internet +, satellite remote sensing, and other advanced technologies can improve the dynamic monitoring ability and disaster prevention ability of tailings ponds. Approximately 80% of tailings ponds in China adopt upstream damming, which is associated with low costs and simple technology but is prone to dam-break accidents. When seepage, leakage, and dam-break accidents occur in a tailings pond, a large area downstream of the reservoir will be flooded by the tailings pond debris flow, resulting in severe consequences. A tailings pond monitoring system can be divided into two parts, namely safety monitoring and environmental monitoring components, providing an important guarantee for the normal operation of tailings ponds and disaster prevention. The purpose of safety monitoring is mainly to monitor indexes with the greatest influence on the stability of tailing pond dams. Common safety monitoring indexes include the infiltration line, displacement, reservoir water level, dry beach length, and slope change. Environmental monitoring includes examining pollution sources in the tailings reservoir, hazard sources in the surrounding environment, and geographical information.
One of the important tasks of mine safety supervision departments is to prevent and eliminate the major risks of tailings ponds. Among these efforts, in China, the government requires the installation of online monitoring systems in third-grade tailings ponds to improve risk monitoring and early warning capabilities. With the application of satellite remote sensing technology and unmanned aerial vehicle (UAV) tilt photography technology in various industries, space–sky–Earth integration technology has gradually become an important form of infrastructure to ensure the safety of tailings ponds [10]. Space–sky–Earth integration technology is new information technology, with remote sensing technology at its core, that uses modern detection and sensing technology, photogrammetry, and remote sensing to establish Earth observation satellite technology, satellite navigation and positioning technology, communication technology, and geographic information systems that can be adopted to study Earth and space targets and realize the acquisition, analysis, management, storage, transmission, display, and application of information related to environmental parameters. Space–sky–Earth integration technology also provides a new data acquisition means to conduct remote monitoring of tailings ponds and to supervise the safety of tailings ponds in China [10,11].
At present, relevant research mainly focuses on online monitoring, which entails a single monitoring method. It is difficult for enterprise management departments and regulatory bodies to grasp the changes in tailings ponds through digital changes. UAV and satellite monitoring techniques are new research methods, but corresponding space–Earth integration technology has not yet been established. It is not possible to realize the remote management of tailings ponds by enterprises and supervisory organizations to achieve tailings pond risk prevention and control. In this technology, the spatial aspect requires the continuous monitoring of the tailings pond area and the surrounding environment and the examination of large areas through satellite remote sensing imagery, the sky aspect entails the application of UAVs to facilitate low-level monitoring of high-risk tailings ponds, and the Earth aspect involves an online monitoring system connected to the tailings pond layout, which enables complementary and mutual verification with space and sky monitoring components. In this study, a new tailings pond monitoring system was established by combining satellite remote sensing technology (space), UAV technology (sky), and ground monitoring technology (Earth), as shown in Figure 1. This system exhibits the characteristics of full coverage and multiple levels, and it can be used to obtain multitype monitoring parameters, such as the seepage line and surface deformation of a tailings pond, to perform fusion analysis of multisource data, to calculate early warning values of the monitoring indexes, and to evaluate the safety state of a tailings pond. This system can compensate for the lack of in-depth panoramic understanding of tailings ponds when the original online monitoring data are in the early warning state. At the same time, the obtained online monitoring and early warning data can be verified with satellite and UAV data, thus improving the monitoring and early warning ability. This technology is an effective remote monitoring means for enterprises and regulatory departments in disaster prevention and the control of tailings ponds. With the use of this research method, the safety situation of a tailings pond can be established in a timely manner, and the safety control of a tailings pond throughout its life cycle can be realized.
After adopting a tailings pond in China as a case study, the integrated system was validated, and an early warning system for the tailings pond was created based on the integrated monitoring data.

2. Materials and Methods
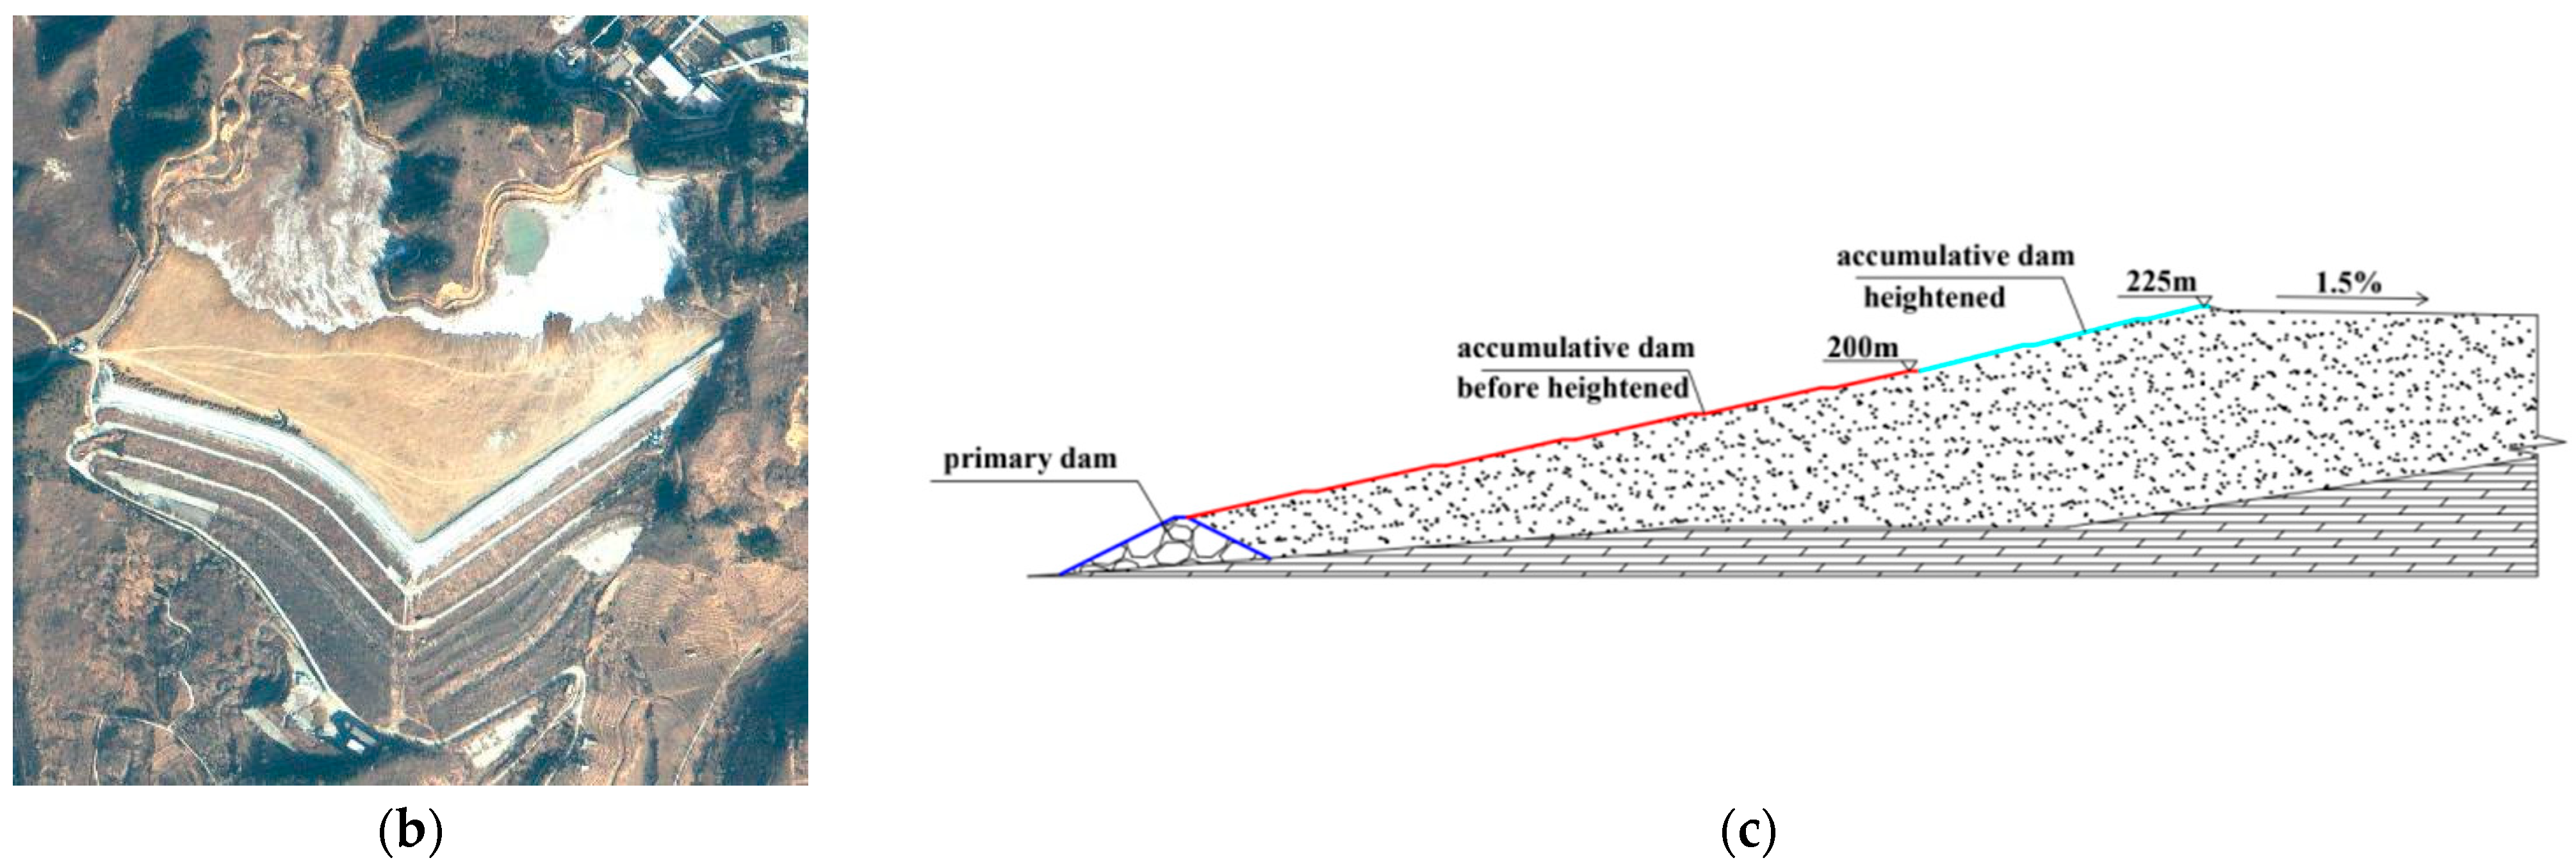
2.1. Study Area

The tailings pond in this study is a typical overhead tailings pond. Important facilities, such as villages and railway stations, are located downstream of the tailings dam. The downstream facilities are summarized in Table 1.
The tailings pond was put into operation in May 1991. The tailings reservoir is 300 m deep and comprises 2 initial dams, both of which are permeable rockfill dams. A tailings accumulation dam occurs at the crest of the initial dam at an elevation of 163.5 m. Five bridle paths are located at elevations of 173.5, 183.5, 193.5, 203.5, and 213.5 m on the outer slopes of the dam. The slope ratio of each section is 1:4.5. In April 2007, the decision was made to increase the capacity of this tailings pond. According to the design requirements, after levelling a 200-m elevation platform at the top of the dam, 3 4 m-wide platforms (tailings pond berms) were established at 200, 210, and 228.5 m. At the end of 2020, the mine was closed, and the tailings pond ceased to be used. Tailings pond data for various years are provided in Table 2.
Figure 2 shows the distribution of buildings and villages downstream of the tailings pond, where a indicates the tailings pond in this study, b indicates the transport plant, concentrator, and other facilities of the mining company, c indicates the 2 downstream villages within 1 km, d indicates the downstream railway station, and e indicates railways and roads. Moreover, the figure shows that in addition to the above facilities, many villages and roads are located beyond the 1 km range. According to the loss ranges of other tailings pond dam-break accidents [6,7], once a tailings pond accident occurs, surrounding villages and roads may be affected, which may cause heavy casualties and property losses. Therefore, there is an urgent need to strengthen the risk identification, prevention, and control processes of overhead tailings ponds with villages or important facilities located downstream.

2.2. Remote Sensing Satellite Water Level Monitoring Technology

The United States launched its first Landsat satellite in 1972, marking the beginning of the space remote sensing era [12]. Remote sensing technology started later in the field of mining in China than in other countries, but the quality of remote sensing data has developed synchronously [13], and Landsat technology has been increasingly applied to the remote sensing of wind, clouds, resources, and the environment, along with the Gaofen (GF) series. The stable operation of the satellite series is represented by a space–Earth observation system. Information on the parameters of the satellites is summarized in Table 3. Remote sensing satellites are mainly used in the fields of land and resource exploration, environmental monitoring and protection, urban planning, crop yield estimation, disaster prevention and mitigation, and space science experiments. These remote sensing satellites include the Fengyun (FY) series satellites, GF series satellites, Ziyuan (ZY) series satellites, and Huanjing-1 (HJ-1) satellites [14,15,16,17,18,19].
Remote sensing satellite images can provide detailed data on the characteristics of the Earth’s surface, which renders this approach a basic tool for environmental, land [20], disaster, and water resource [21] monitoring. At present, satellite remote sensing technology exhibits a wide range of applications in mining, including environmental monitoring around mining areas [22], monitoring of water or environmental pollution after tailings pond dam breaks [23,24], and monitoring of the size and distribution of tailings ponds in mining activities [25,26]. Experts and scholars have attempted to monitor displacement changes in tailings ponds [27] and have increased the capacity of tailings ponds [28], thus verifying the effective use of satellite remote sensing technology in tailings pond risk prevention and control. In addition, satellite images can intuitively display the environmental distribution around and downstream of the reservoir area [29]. Based on the application results of the Zizhao 1 and Gaofen series satellites in the mining field, this paper attempted to analyze the water level and dam elevation of the considered tailings pond and to provide preliminary data for safety management and risk prevention and control of the tailings pond [30,31,32].
In contrast to dry stockpiled tailings ponds, pilot tailings ponds are typical custom facilities formed by hydraulic deposition. There is a large amount of tailings slurry-precipitated water at the tail of the reservoir, and the boundary between water and the surrounding tailings is uncertain. In addition to the water boundary line of the tailings pond, there is a certain length of wet beach surface, and a large amount of water is stored within. Therefore, it is difficult to identify the water boundary of tailings ponds.
To further improve the identification of tailings pond water bodies and obtain the change in reservoir water level in a timely manner, in regard to the water body identification method, based on the normalized water difference index (NDWI) [33], the modified normalized difference water index (MNDWI) [34] was added to successfully identify water bodies [35]. At the same time, artificial optical visual interpretation data were superimposed for verification to further enhance the identification accuracy of tailings pond water. Regarding the difficult identification of surrounding environmental changes, visual interpretation was used to mark changes.

2.3. Intelligent Inspection through UAVs

Drones are remotely controlled or autonomous aircraft that can carry payloads such as cameras, sensors, and communications equipment. The tilt camera system mainly comprises a UAV, a 5-lens tilt camera (the central camera is vertical to the observation plane, and the remaining 4 cameras provide orthogonal azimuthal oblique placement observations), a UAV post-processing kinematic (UAV-PPK) module, and a base station. Through three-dimensional (3D) data processing of oblique photographs, the 3D spatial reality of the tailings pond can be created, which can establish the current situation in the tailings pond reservoir area and surrounding environment in a timely manner and realize accurate management of the tailings pond [36]. In recent years, with the improvement of UAV-related science and technology, UAVs have become increasingly adaptable and have been widely used in different industries. The concept of UAV science and technology was first proposed by the British Military Flying Society. Although initially used for military activities primarily, drone technology can now be found in many applications. UAV tilt photography technology, as an important part of space–sky–Earth integration systems, exhibits the characteristics of notable timeliness, high accuracy, and low labor cost and has gradually become a new technical means in 3D mine modeling, topographic surveys, ecological and geological disasters, and vegetation cover monitoring [36,37,38,39,40].
As one of the main functions of mine concentrators, tailings pond risk monitoring has remained the focus of attention among companies and regulatory departments [41]. Based on UAV photogrammetry technology, basic data such as the digital orthophoto map (DOM), digital surface model (DSM), digital elevation model (DEM), and real 3D model of the tailings pond can be obtained to further calculate the submerged area and the capacity of the tailings pond, providing an important basis for tailings pond risk prevention and control. UAV photogrammetry technology provides many advantages, such as high efficiency, low operating costs, high flexibility, notable adaptability to complex environments, and high-resolution images. Based on a review of Chinese journal articles, a total of 33 papers related to UAV applications and tailings ponds were published from 2016 to 2022, mainly focusing on safety management [42,43], deformation monitoring [44], dam-break simulations [45], and other aspects, verifying the effectiveness of UAVs in tailings pond risk prevention and control applications.
The various types of UAVs in use are summarized in Table 4. Da Jiang Innovations (DJI) UAVs are widely employed in aerial surveys of tailings ponds in China, and real-time kinematic (RTK) and PPK methods are used to realize the observation process. In the observation process, DOM and DEM data can be obtained, and the UAV flight time mostly remains within 30 min. Combined with UAV maximum flight speed data, DJI UAVs can achieve full-coverage aerial photography of tailings ponds in the entire area.
A DJI M600 6-rotor UAV was used to monitor the pilot tailings pond in this study. Although the RTK observation method is generally adopted in tailings ponds monitoring with high accuracy (1–2 cm), the PPK method with a higher applicability and an accuracy of 1–2 cm was selected due to its high workload at the early stage, long on-site time, and large operating radius [49].
According to the requirements of Equations (1) and (2) [45] and the low-altitude photogrammetry specifications for UAV aerial surveys, the course overlap degree should not be less than 60%, and the lateral overlap degree should not be less than 30% [47]; moreover, the image repetition rate along the main UAV flight route was 80%, and the lateral overlap degree was 70%. The image resolution reached 4.0 cm/Px.
p x % = p x l x × 100 %
p y % = p y l y × 100 %
where Px and Py denote the overlap between the heading and the side, respectively, and lx and ly denote the side lengths of the image.

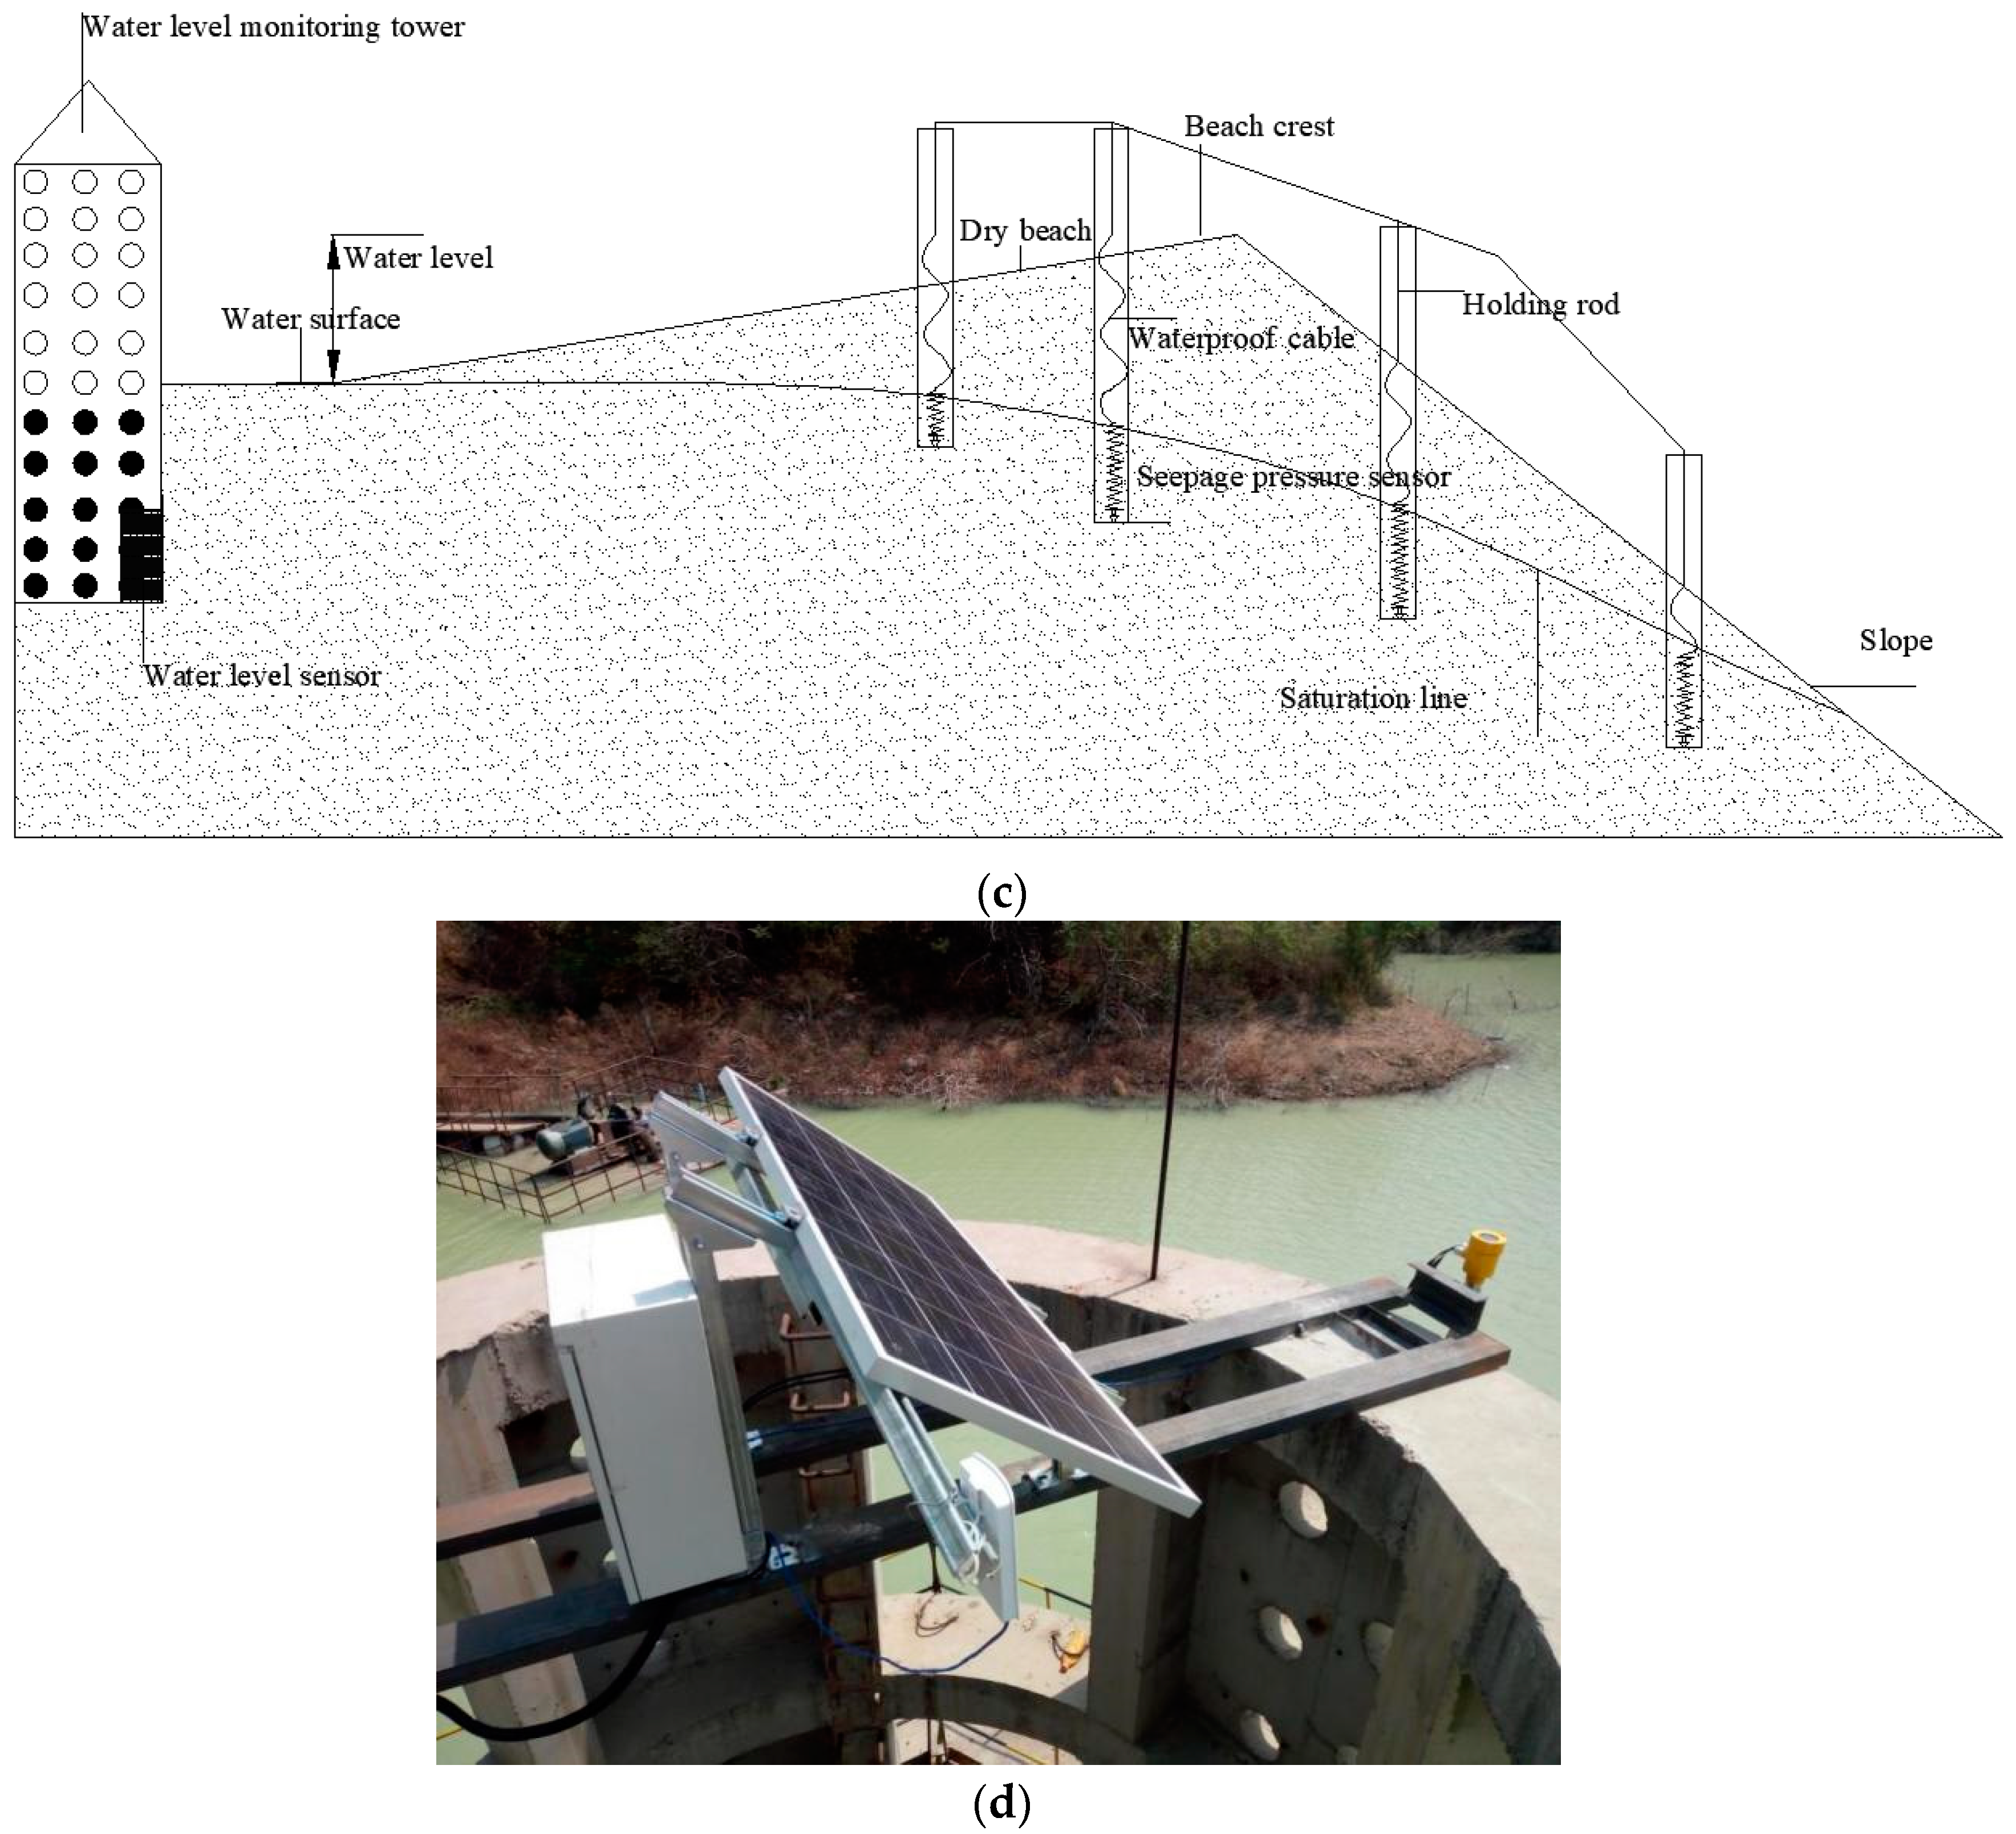
2.4. Online Monitoring for Risk Prevention and Control

The artificial monitoring method has been used to realize the monitoring and early warning of tailings ponds in China [50]. Companies contract professionals to regularly employ total stations, water level gauges, cameras, and other traditional instruments to perform on-site measurements. The main monitoring indexes include the slope ratio of the dam body, dam displacement, infiltration line, dry beach length, reservoir water level, precipitation, and seepage. In addition, dam inspectors assess the conformity and shape integrity of the specifications and design aspects of the dam body, drainage structures, and anti-seepage facilities of tailings ponds daily, and the inspection results are recorded. At the same time, experts are hired in custom inspections and regular tailings pond security assessments and other measures.
Although the artificial monitoring method can achieve a certain effect, the monitoring results are easily influenced by many factors, such as weather, labor, and site conditions, and artificial errors can generate notable influences. Due to the small deformation of tailings ponds and the complex causes of dam breaks, accurate monitoring indexes are needed. However, manual monitoring is a difficult task with low accuracy, resulting in monitoring data errors that directly affect the safe production and management of tailings ponds.
The online monitoring system of tailings ponds is a comprehensive information system for collecting and transmitting pore water pressure information, reservoir water level elevation data, and tailings reservoir dam displacement data to a remote monitoring system through the arrangement of sensors such as seepage and water level meters in the dam body and reservoir area, after which abnormal data can be predicted and highlighted.
China’s online tailings pond monitoring system was developed based on the dam monitoring system, but the study of online tailings pond monitoring systems started late [50]. Before 2008, only a small number of mines in China used remote automatic monitoring systems to monitor certain safety indicators. As early warning systems had not been established, research on the causes of dam-break accidents in tailings ponds was insufficiently deep, and monitoring systems at this time lacked systematic theoretical research and key technical achievements. Only one monitoring index, namely the pore water pressure, which greatly influences the stability of the dam body, was considered, and this index was used to calculate the infiltration line of tailings ponds [51,52]. Therefore, comprehensive monitoring of tailings ponds could not be accomplished.
With the development of cause analysis of tailings pond accidents at home and abroad [53,54,55,56,57] and the gradual establishment of a risk index system of tailings pond dam breaks in China [54], the key monitoring mode of the online monitoring system of tailings ponds was transformed from single-indicator monitoring into indicator system monitoring. After 2008, the main monitoring indexes of China’s online tailings pond monitoring system can be summarized as follows: the tailings dam infiltration line, reservoir water level, dry beach length, dam surface and internal displacement, and precipitation [58,59]. These monitoring indicators have become important indicators for tailings pond safety monitoring and were included in the Technical Specification for Tailings Pond Safety Monitoring (AQ 2030–2010) in 2010. At the same time, online monitoring system technology for tailings ponds was listed as advanced production technology promoted and applied nationwide by the government in 2012, indicating that this technology had officially become the main safety management means for China’s tailings pond industry.
The equipment and facilities of online monitoring systems for tailings ponds generally include data servers, monitoring and early warning software systems, monitoring and data display systems, and other support facilities, which can be used to conduct dam surface displacement assessments, dam internal displacement determinations, infiltration line evaluations, rainfall monitoring, and video monitoring. The surface displacement, internal displacement, and wet line of the dam can be monitored by placing GPS displacement monitoring points and wet line sensors across the surface of the dam. By installing a water level gauge in the reservoir area, the real-time water level elevation in the reservoir can be recorded for rainfall monitoring.
The main monitoring indexes of the online monitoring system for the pilot tailings pond were as follows: reservoir water level, saturation line, dam displacement, rainfall, dry beach elevation, and monitoring video data. The layout principle of the monitoring points entailed the selection of the largest section of the tailings dam or the section posing the highest risk to the downstream area once an accident occurs in the monitoring section to effectively monitor the tailings pond running state. The specific monitoring sites and quantities (as shown in Figure 3) were as follows:
  • Reservoir water level: an electronic water level sensor was placed on the overflow tower of the tailings pond.
  • Beach elevation: 6 small flags were arranged across the sedimentary beach perpendicular to the top of the east and west dams, spanning a distance of 70 m.
  • Wetted line: 19 vibrating string seepage sensors were arranged within 4 sections of the east and west dams.
  • GPS-based displacement: 1 base station and 7 measuring points were placed along the maximum dam height profile of the east dam and the maximum dam height profile of the west dam.
The online monitoring and transmission system of the pilot tailings pond is shown in Figure 3 [50,60]. The sensors can collect monitoring indicator data of the main parameters, and the data are transferred to the monitoring center of the data server through optical fiber communication transmission, thereby using the data server for data collection, or transferred to the early warning management PC system, according to the model of the disaster warning system of tailings dams, tailings flood calculation model, and comprehensive analysis system. In this study, data were quality controlled and analyzed to achieve accurate evaluations and generate early warnings and forecasts.
To prevent tailings pond instability due to excessively high infiltration lines, the Safety Regulations for Tailings Ponds (GB39496-2020) of China provides detailed requirements for the burial depth of infiltration lines in tailings ponds with different dam heights (Table 5).
By calculating the height of the profile containing the tailings reservoir infiltration line, the depth of the infiltration line in each profile should meet the requirements summarized in Table 6.

3. Results

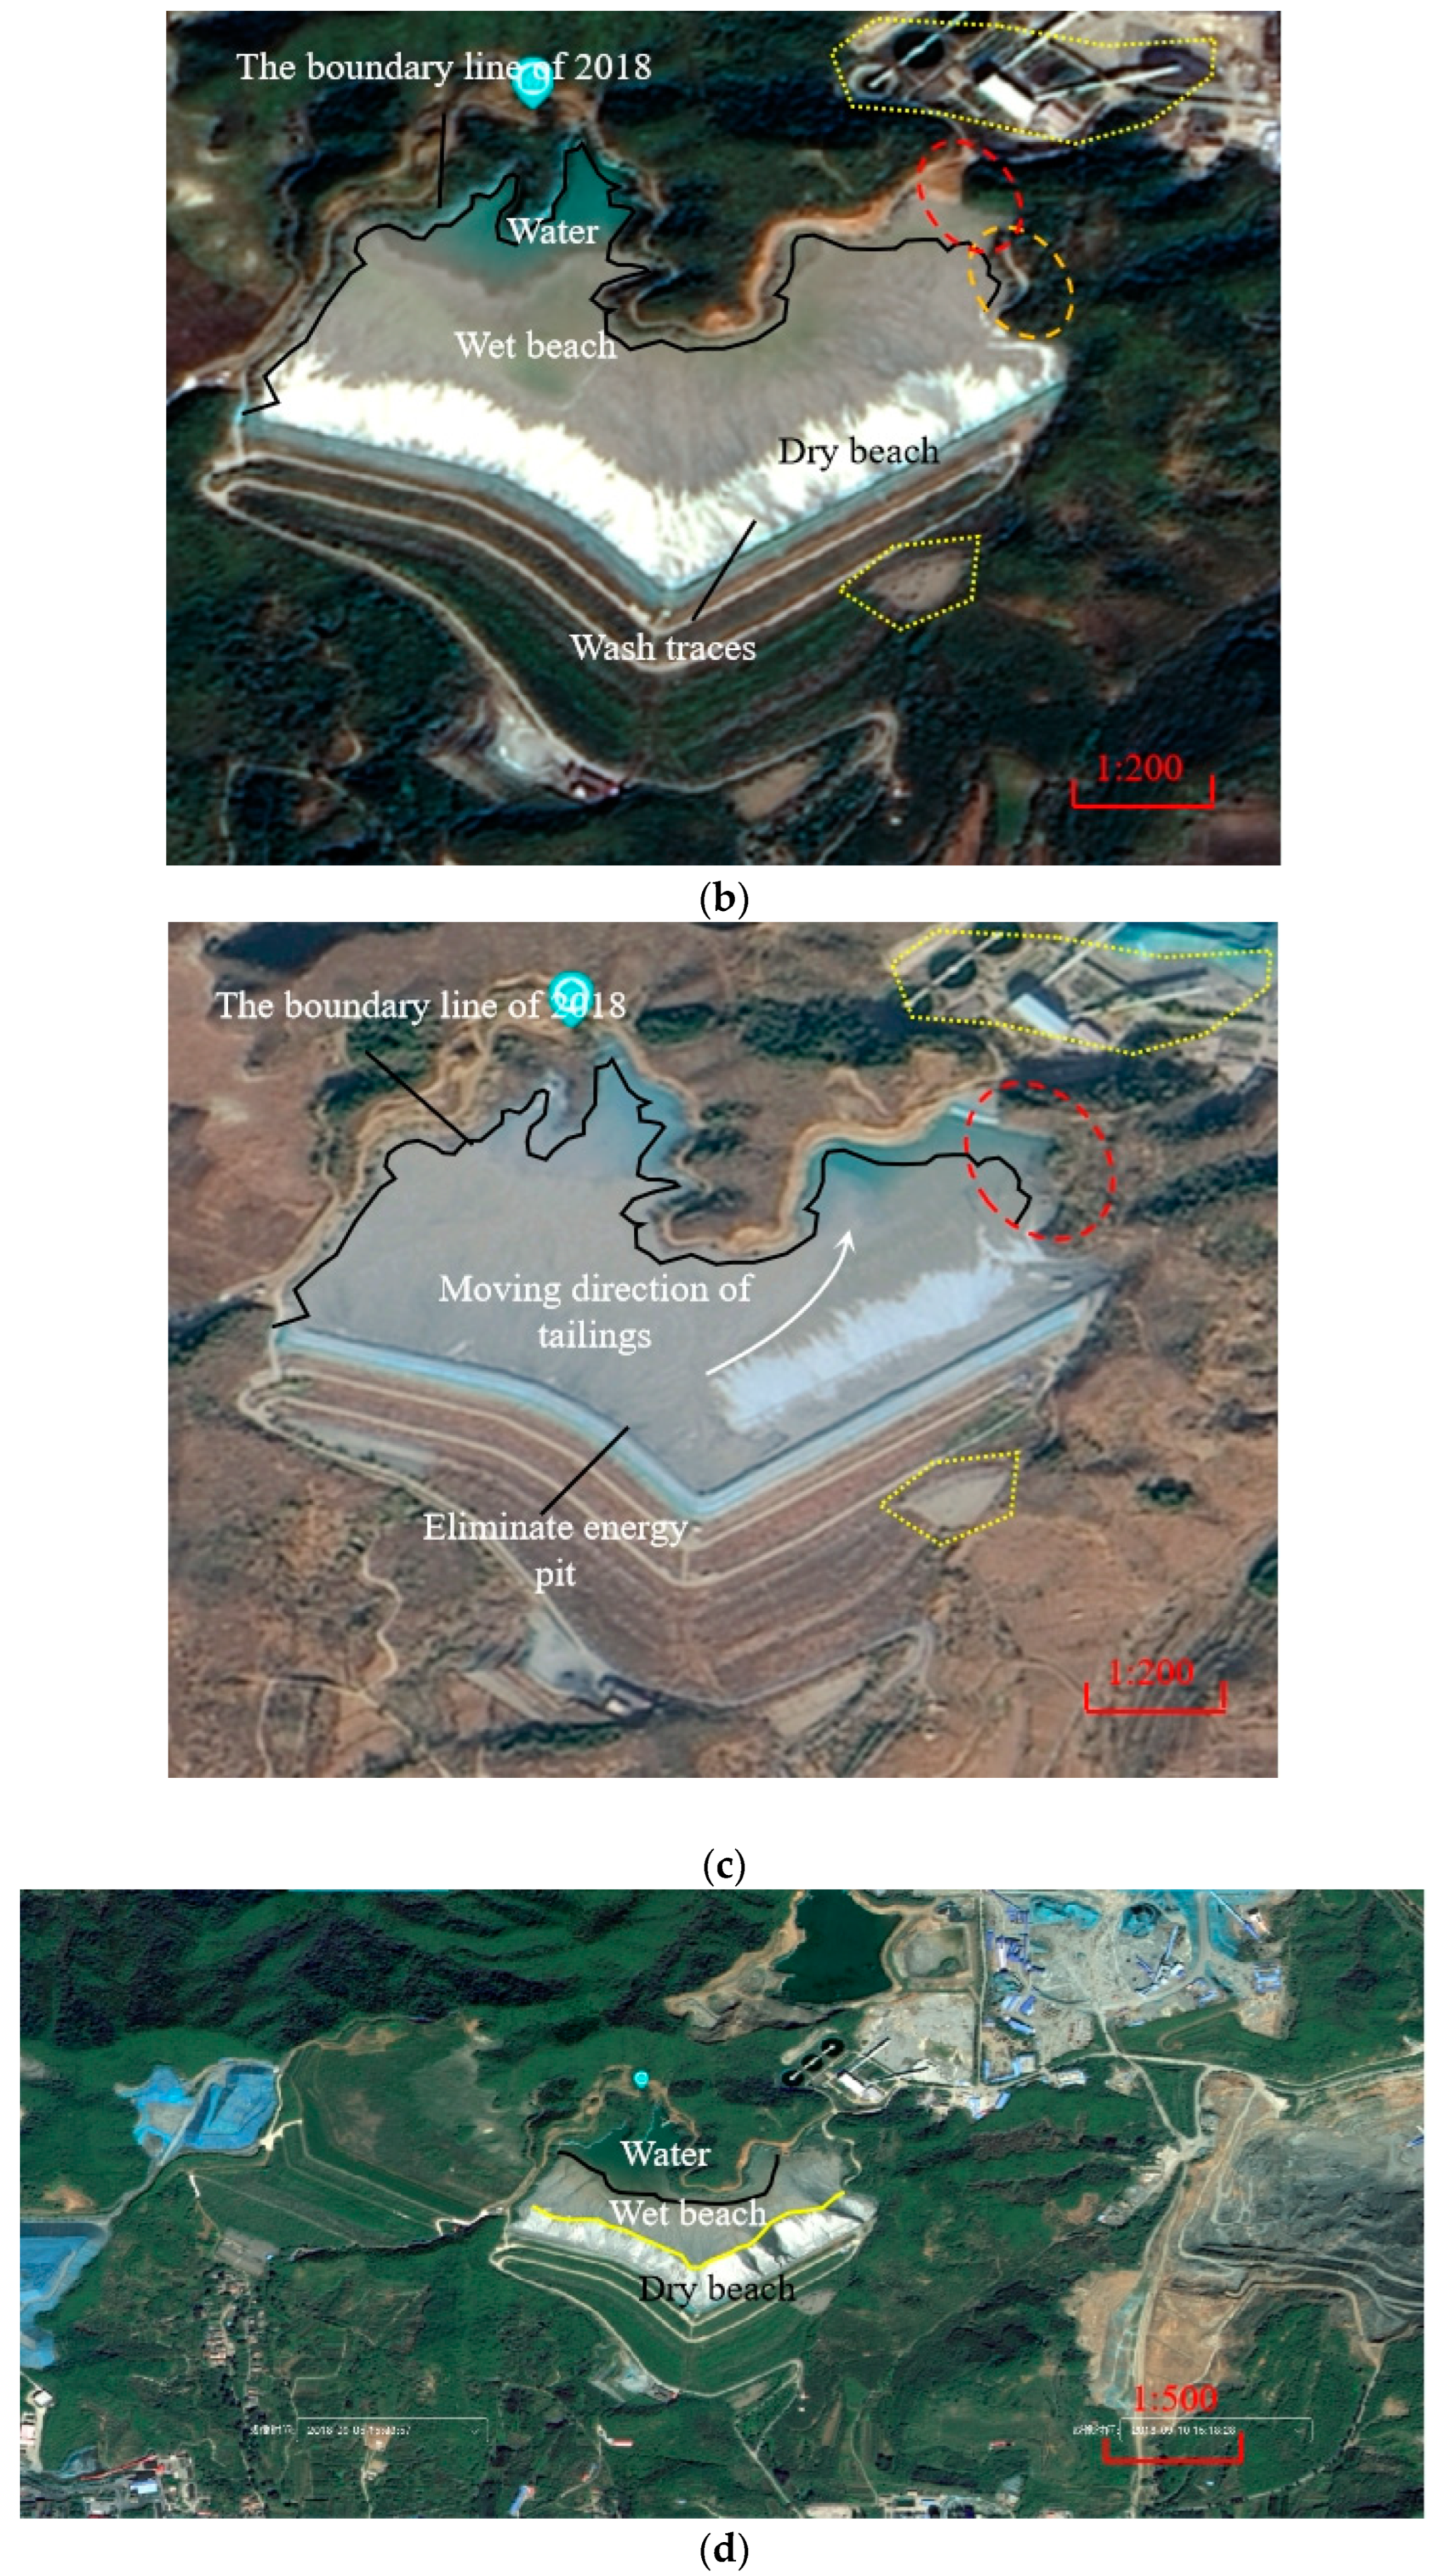
3.1. Application of Remote Sensing Satellite Data and Data Analysis

We extracted satellite images of the tailings pond production stage from 2018 to 2020, as shown in Figure 4. The satellite image for 2020 was obtained one month before the tailings pond ceased to be used. Figure 4b shows that the reservoir area of the tailings pond can be divided into three parts: the water body, wet beach surface, and dry beach surface. The wet beach surface is located between the water body and the dry beach surface. Affected by the reflection of surrounding vegetation, the water in the reservoir gradually darkens with increasing depth. In the following section, we analyze the running conditions of the tailings pond and the variations in the reservoir water level and dam height.
According to comparative analysis of satellite images between the different periods, the following observations were made. (1) From the perspective of vegetation change and road submergence at the end of the reservoir, the outer side of the black curve (the black curve in Figure 4a) in 2018 indicates lush vegetation and the presence of patrol paths in the orange area at the eastern end of the reservoir. However, in 2019, the vegetation boundaries significantly receded (the black curve in Figure 4b), and the road in the orange area was partially submerged. In 2020, the tailings pond was eroded to the edge of the patrol route built by the mining company (the black curve in Figure 4c), while the road in the orange area on the east side was completely submerged. The boundary of the tailings pond expanded over the three surveyed years. (2) According to the observed water scouring traces in front of the east accumulation dam in 2018, drawing points were established at the top of the east stacking dam of the tailings pond during the shooting period, and ore drawing was conducted. In 2019, the dry beach surface in front of the dam gradually approached the trace of the surrounding dry beach, indicating that the tailings reservoir drawing process had ended and no new drawing activities had recently been performed. In 2020, a dry beach had formed in front of the dam on the east side, while silting pits and scour marks occurred on the inner slope in front of the accumulation dam on the west side but no dry beach was formed, indicating that the ore-drawing activities of the tailings reservoir on that side had just ceased. In addition, according to the marks on the dry beach and the scour marks on the dry beach surface in front of the drawing dam, the current drawing position, slurry flow marks, and movement direction of the water body at the tail of the reservoir could be determined simultaneously. (3) Based on the observation of the development trend of the highest sub-dam line in front of the dam, the dam body of the tailings pond continuously increased, further verifying that the height of the tailings pond increased during this period, and the boundary line of the tailings pond continued to move outward. (4) From 2018 to 2021, the tailings pond was in production. With increasing tailings in the reservoir, the tailings pond also increased in size. The tailings pond continued to spread along the hillside, flooding the original patrol road. In the satellite image for 2020, as shown in Figure 4c, the water level on the east and west sides of the reservoir rose at the tail end of the reservoir, whereas the tailings water on the east side of the reservoir exhibited no movement trend toward the west, differing from the trend of the slurry water on the east side of the reservoir, which flowed toward the west side of the reservoir along the water diversion channel in 2018 (Figure 4a). The image for 2020 shows that the tailings in the middle part of the reservoir migrated toward the east, indicating that the tailings in the middle part were higher than those in the east, which could be the reason for water accumulation at the tail of the reservoir in the east.
By comparing the obtained satellite images of the tailings pond, it could be found that the overall height of the tailings pond increased in the production process, and the boundary line of the reservoir area continuously moved outward. When the tailings pond was no longer used, the beach surface of the tailings pond was irregular, and the water level in the tailings pond was unclear, which increased the risk related to the tailings pond upon closure.

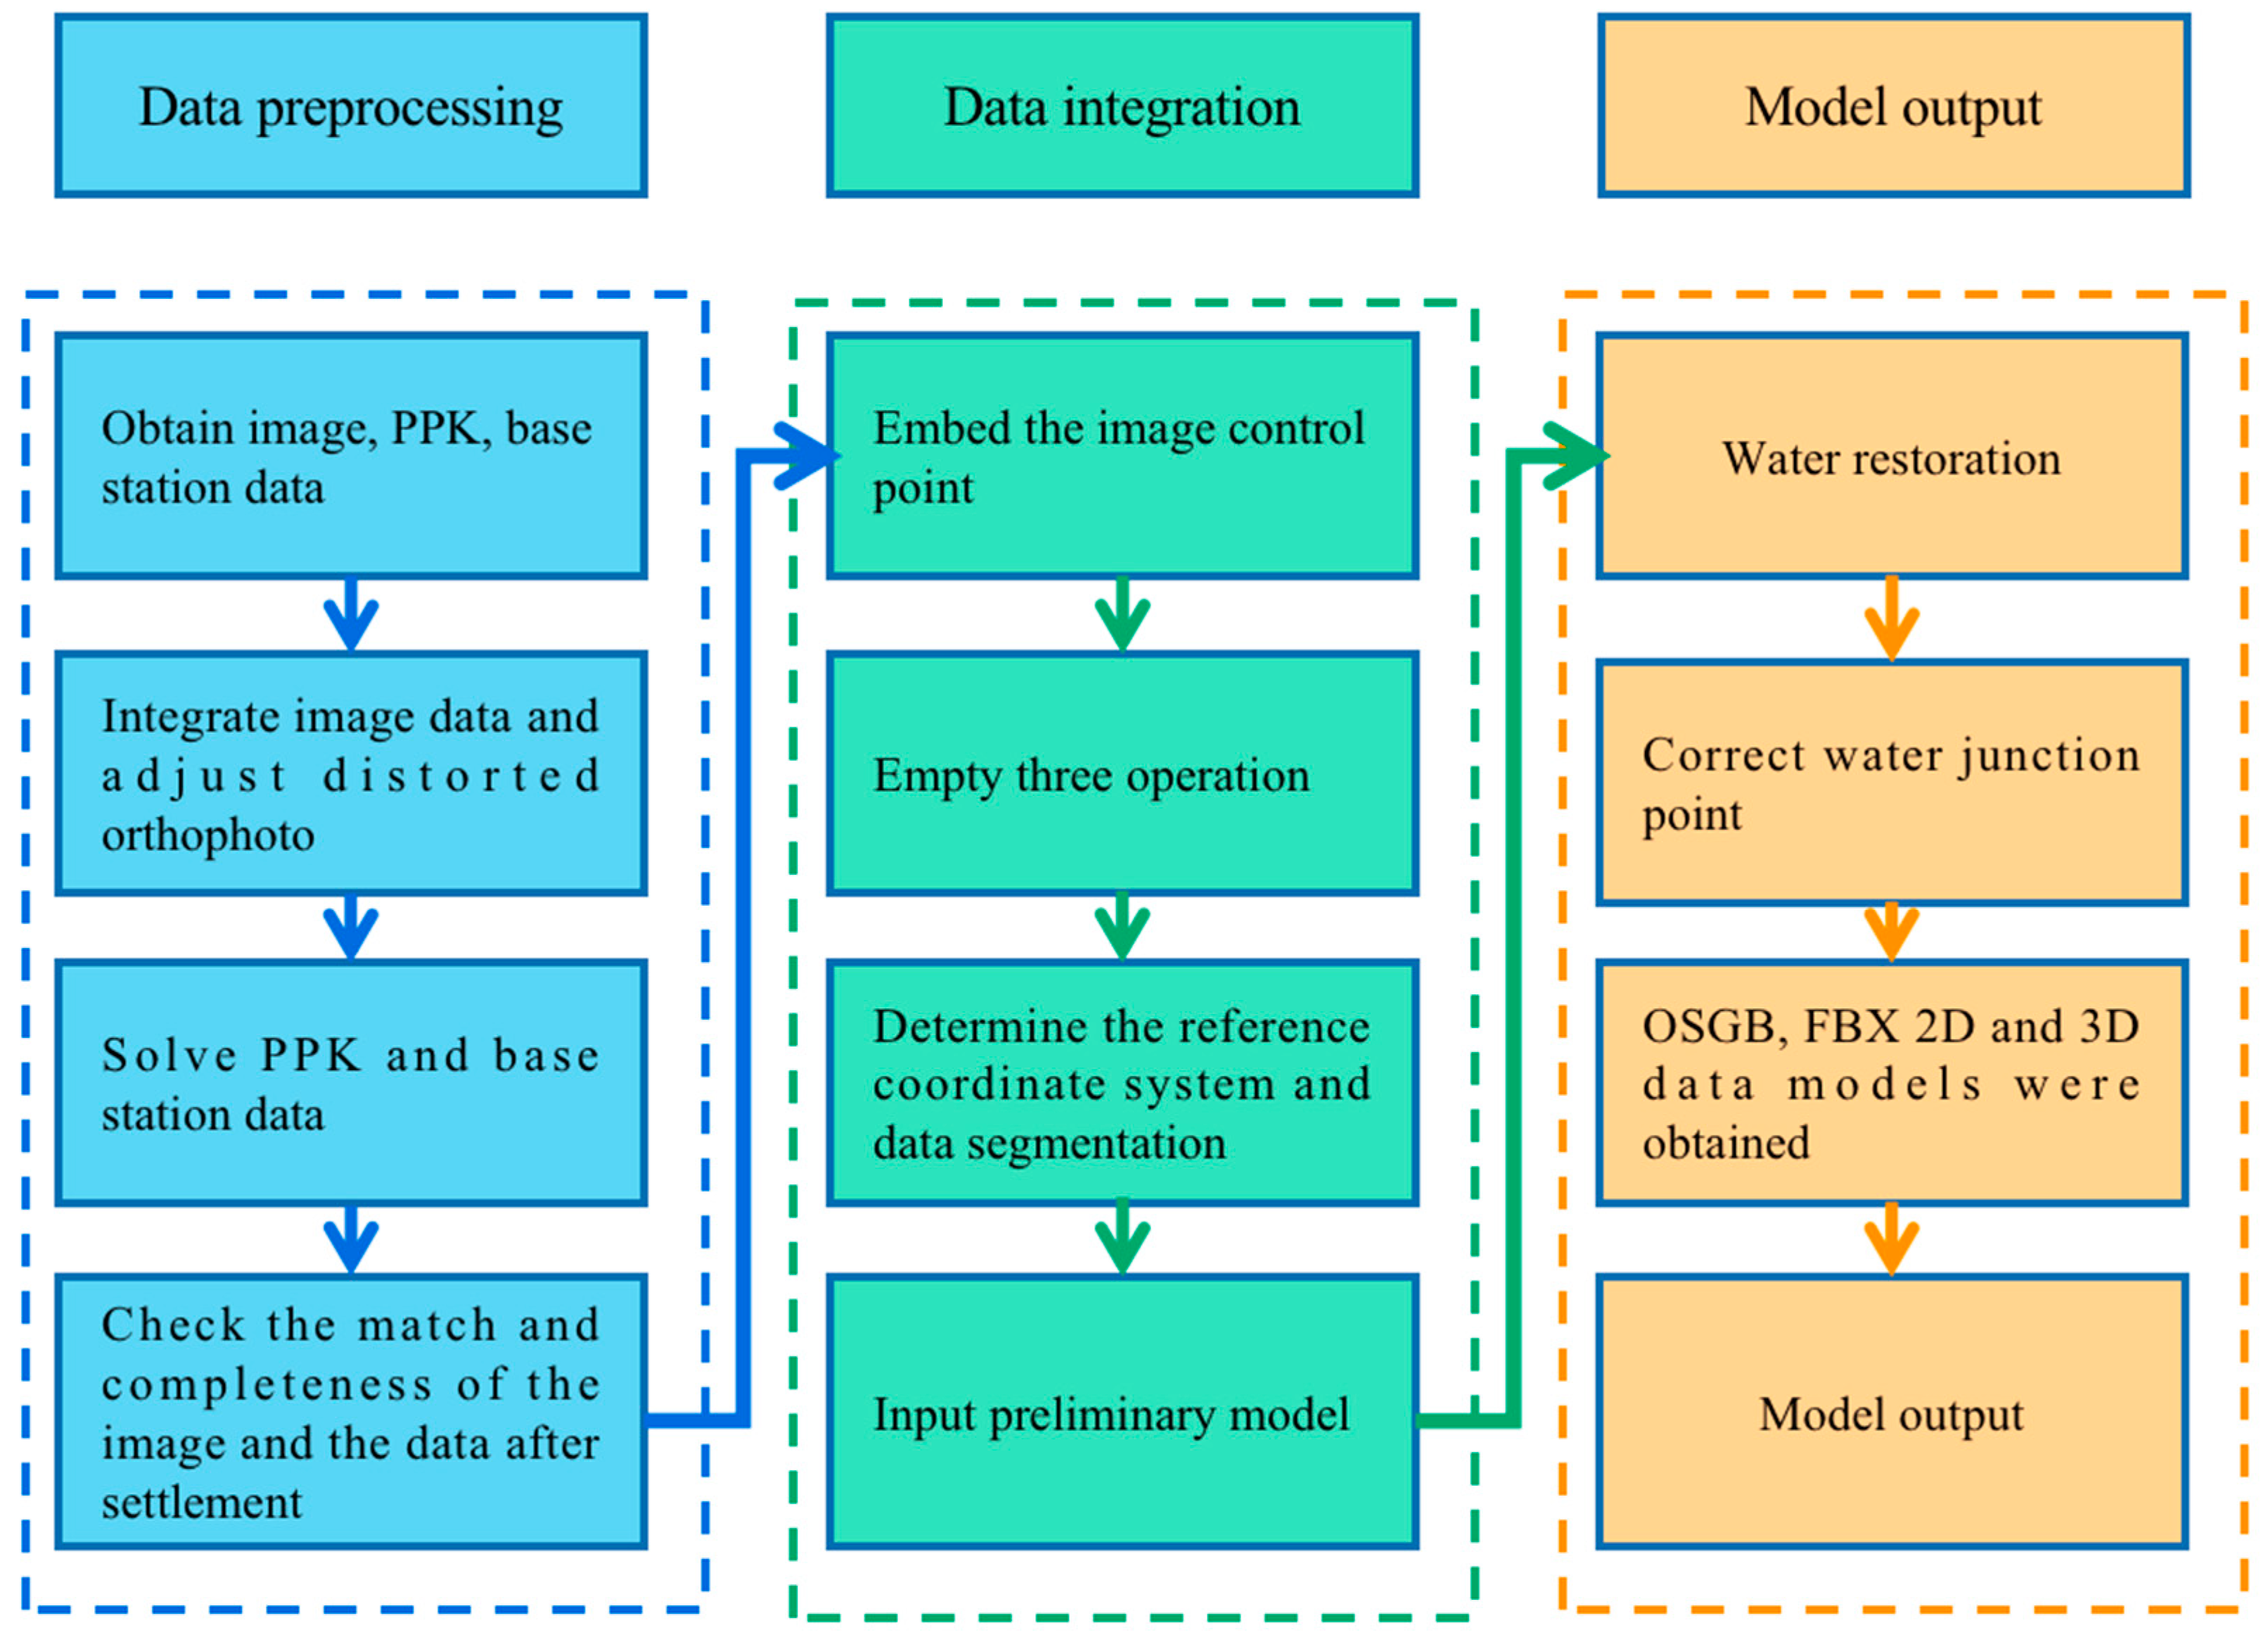
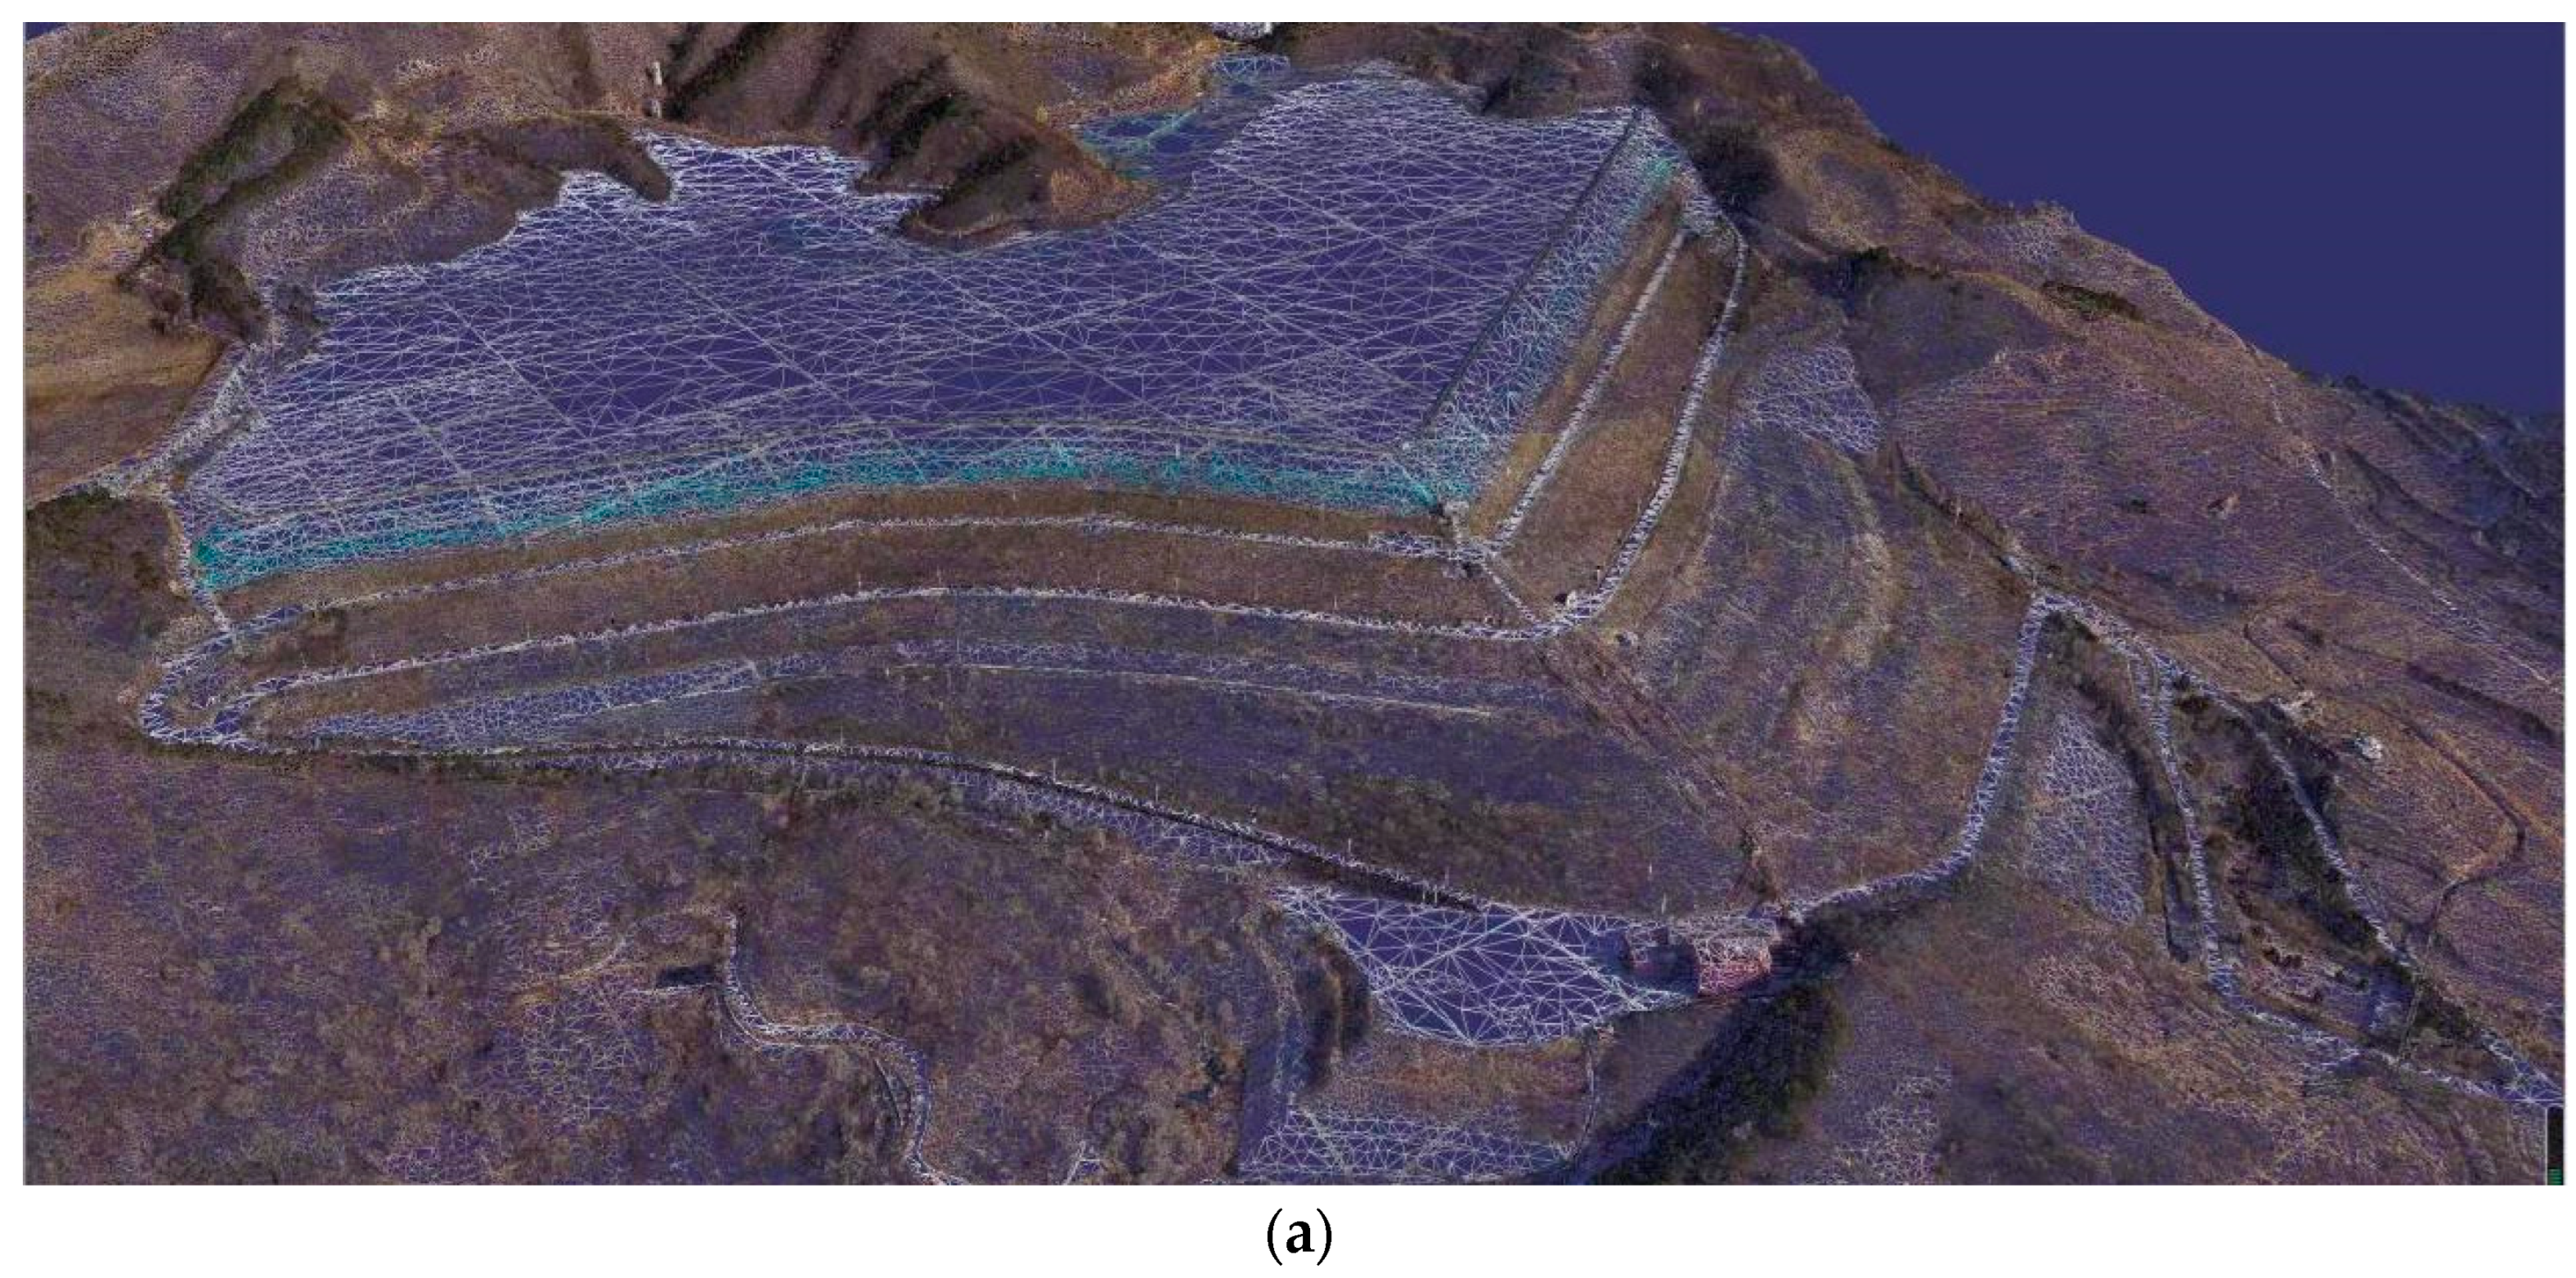
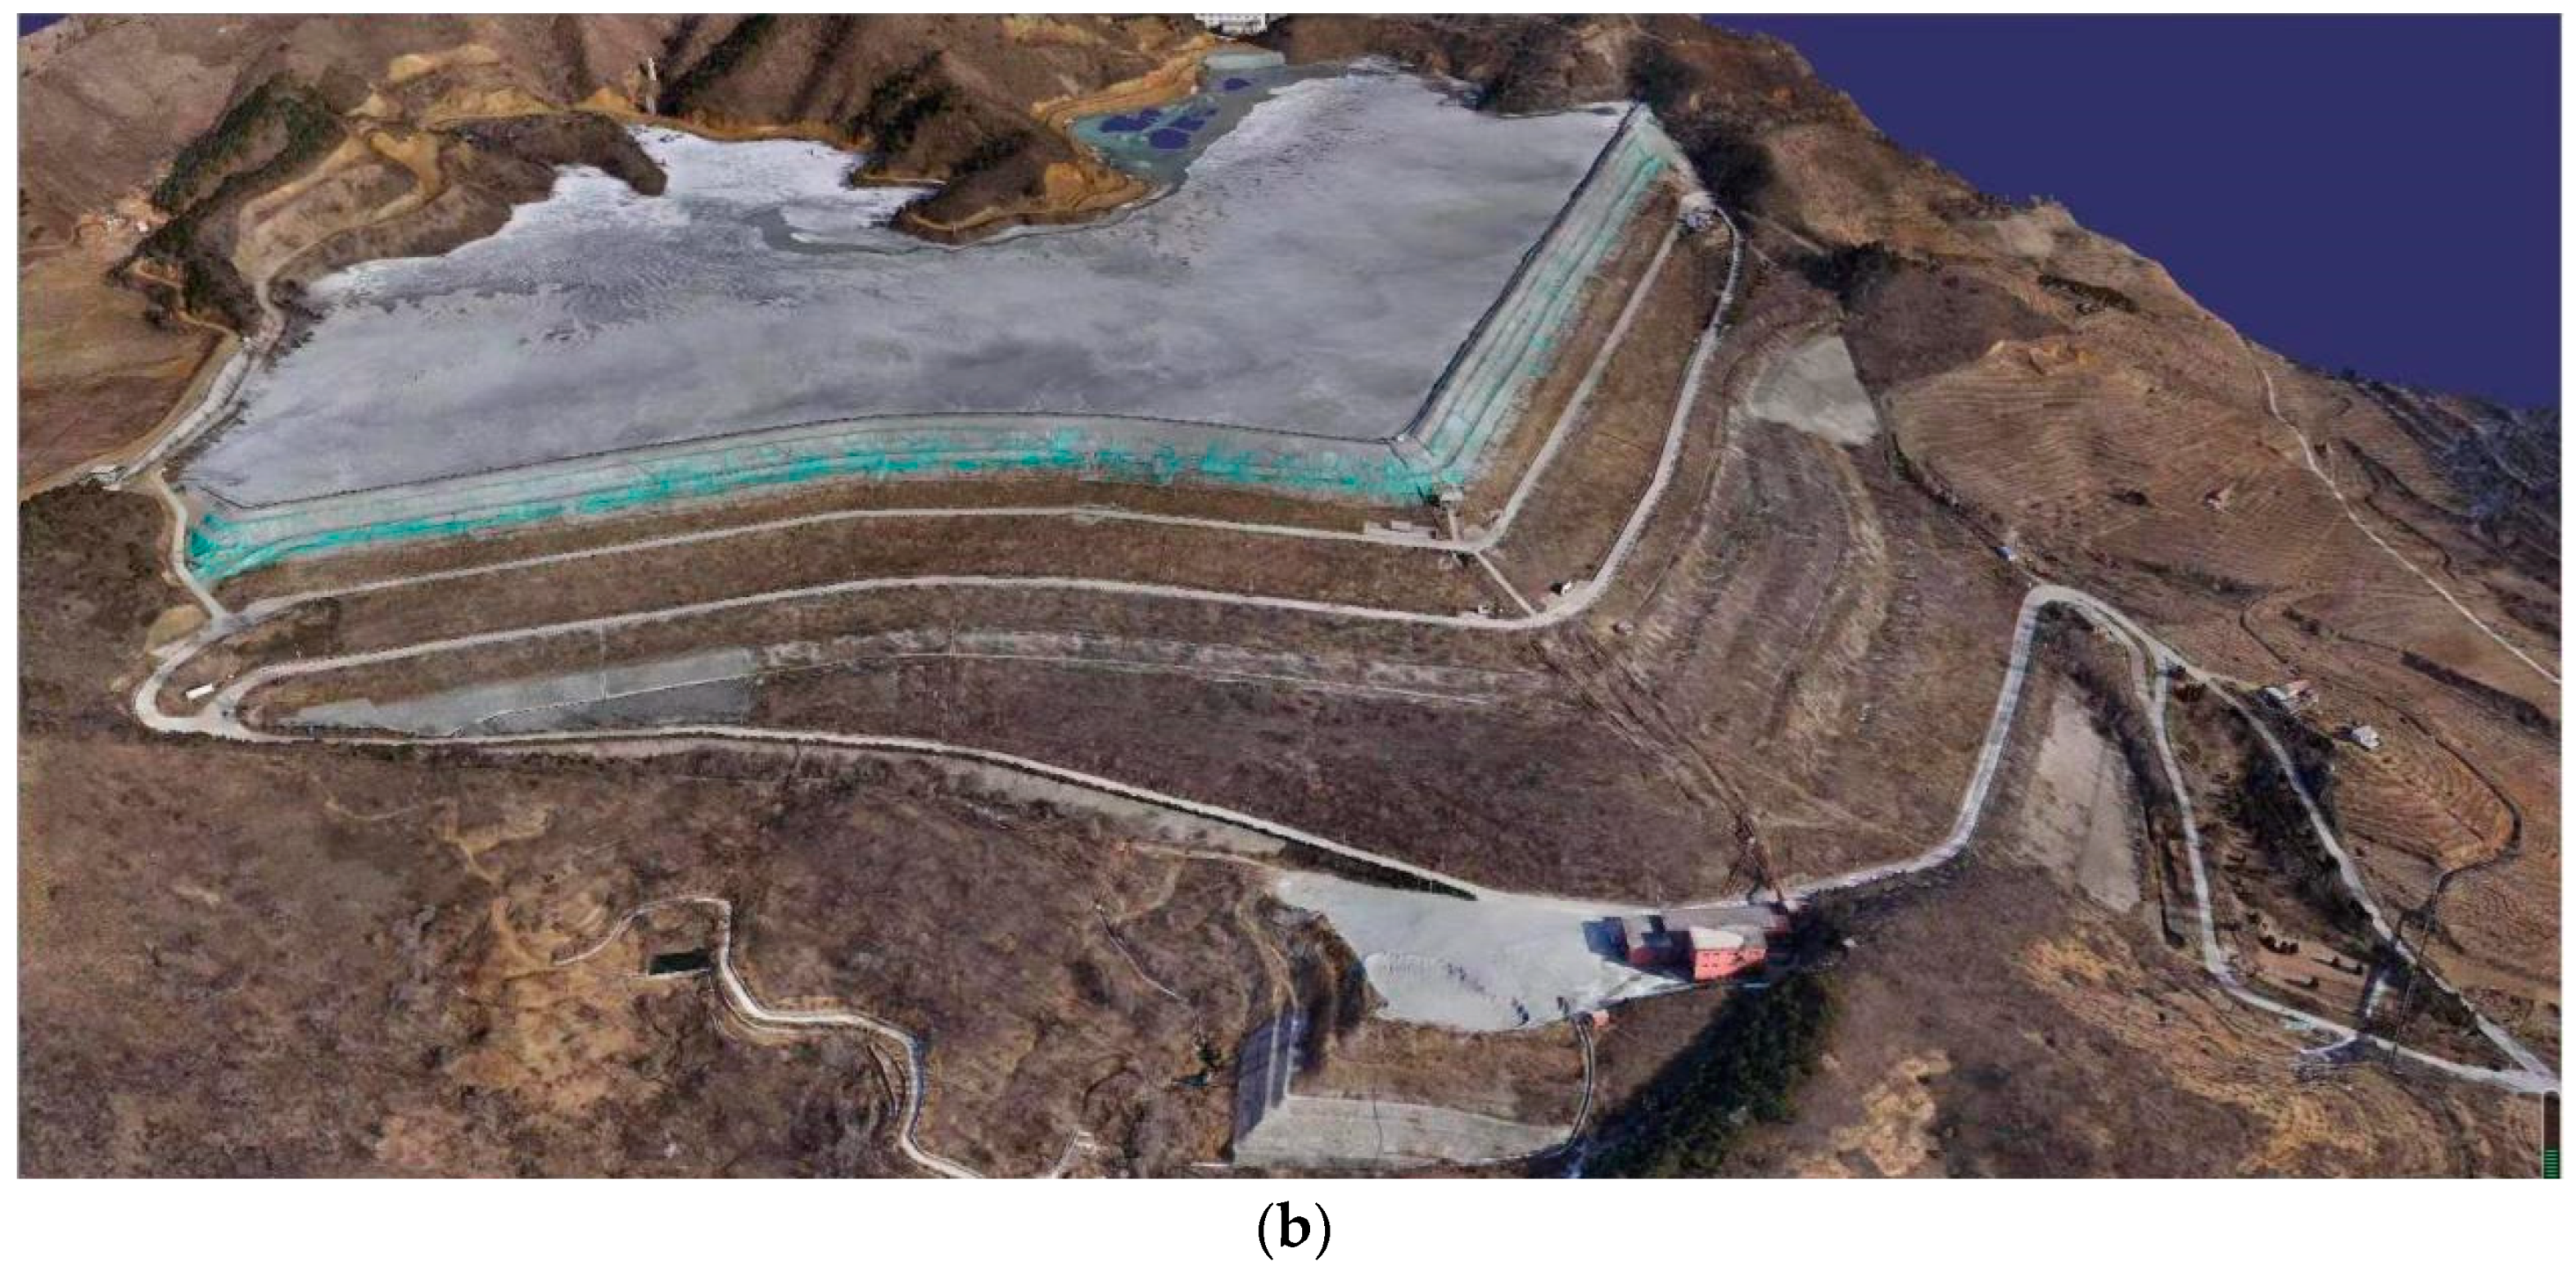
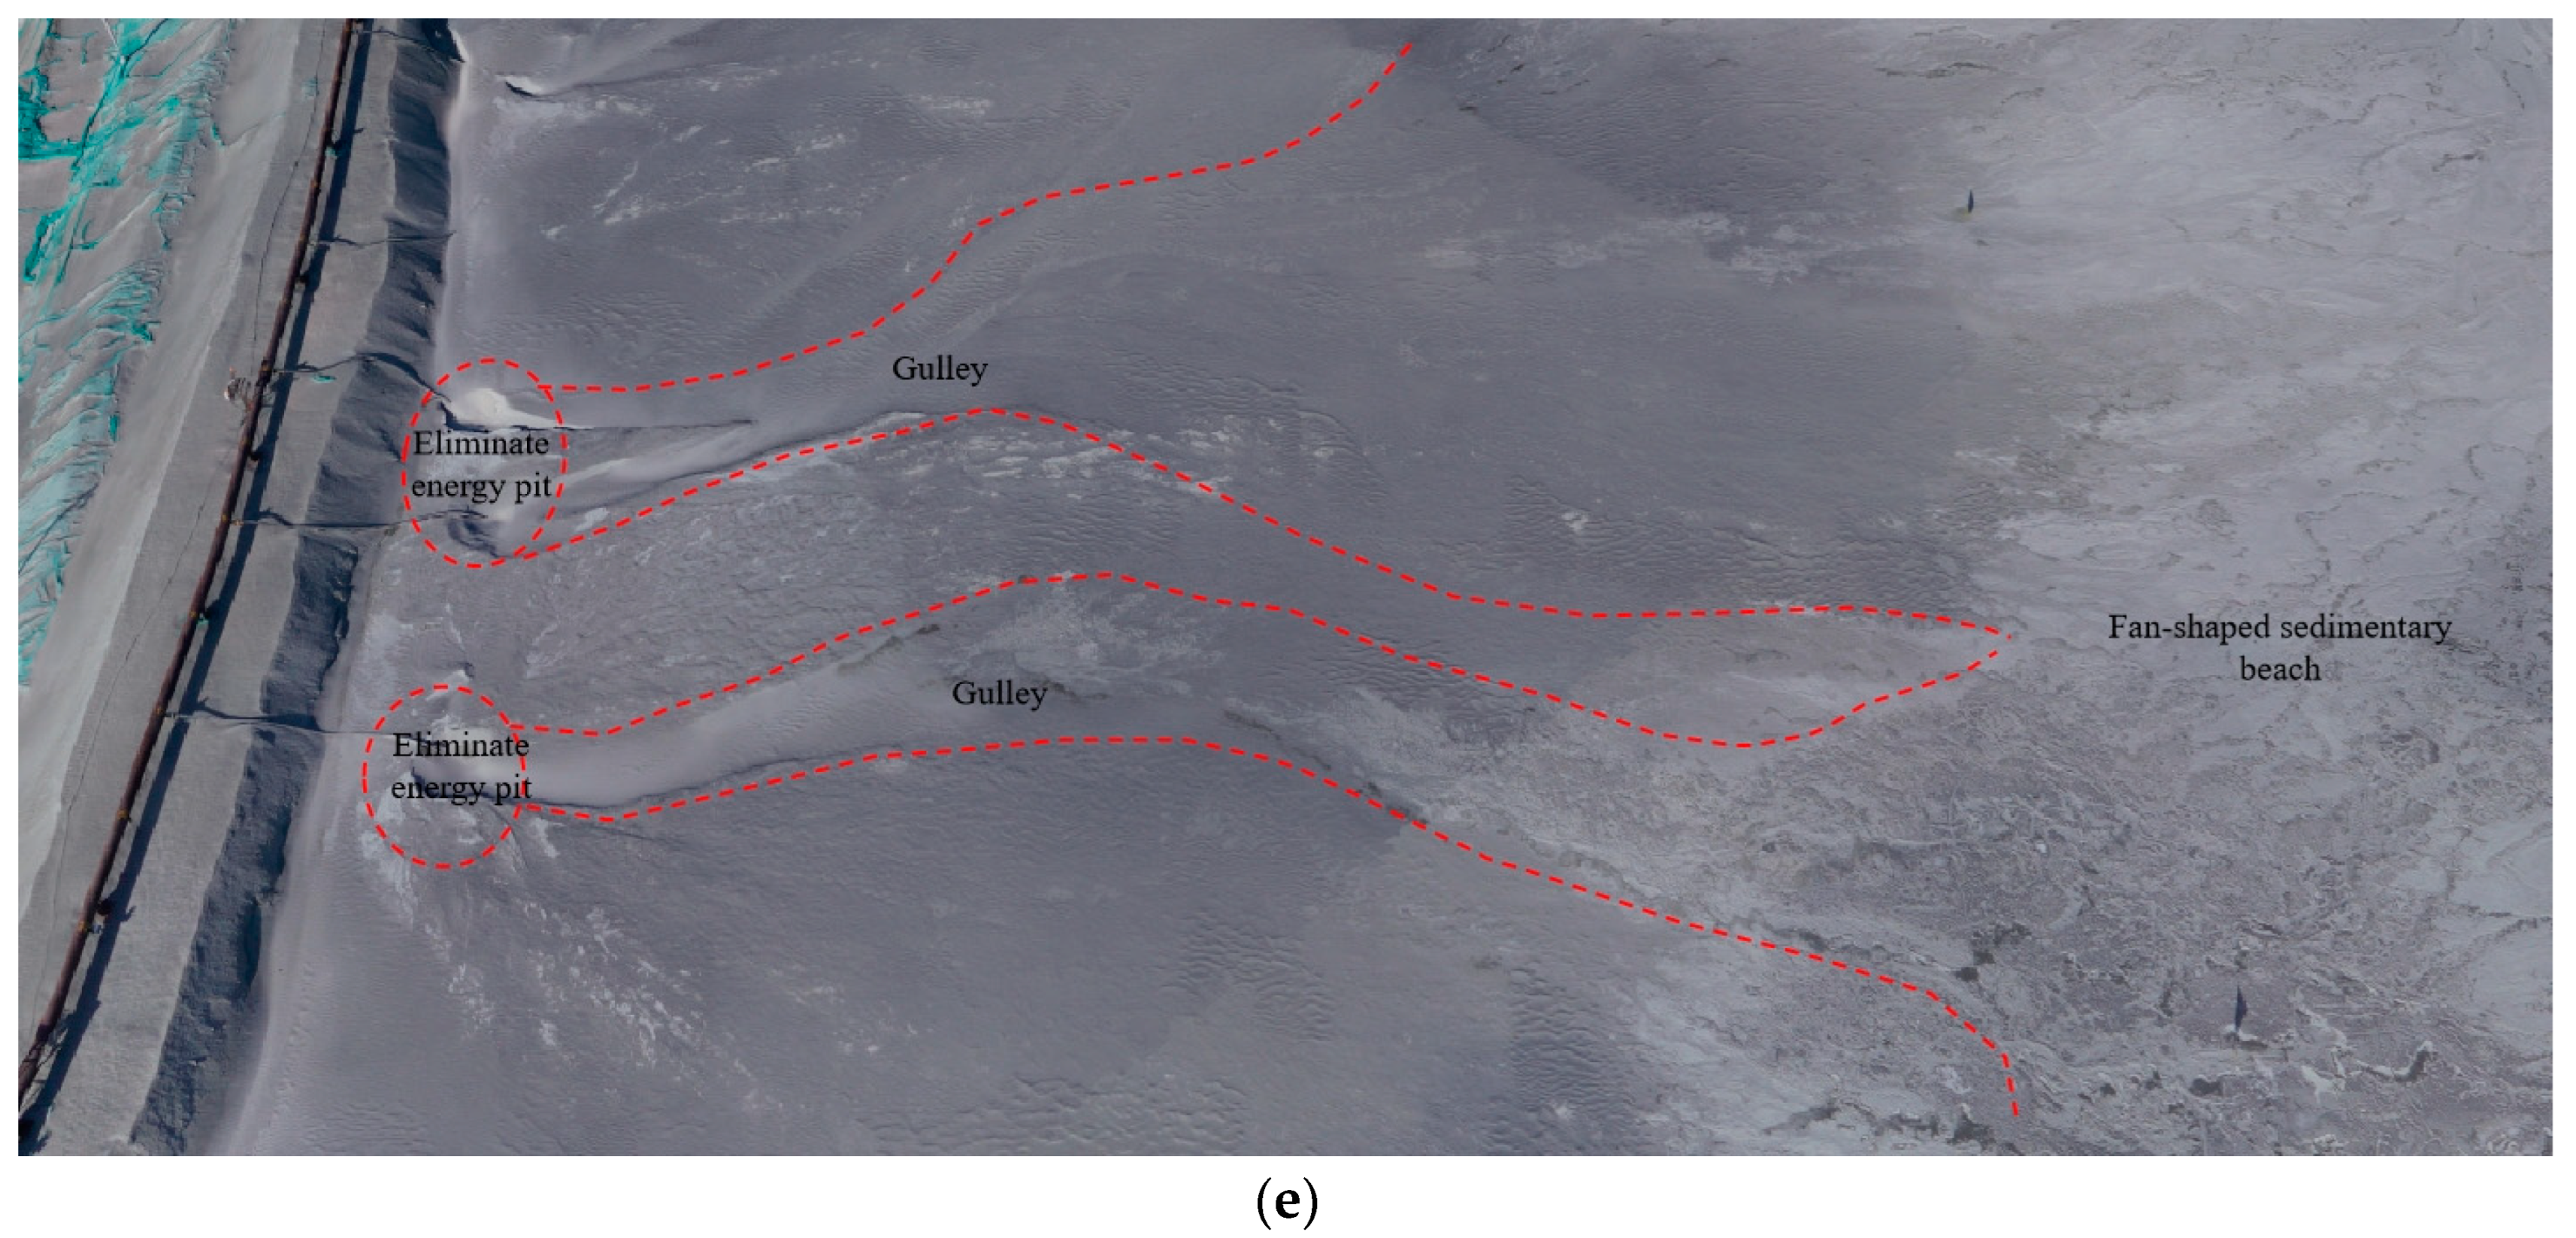
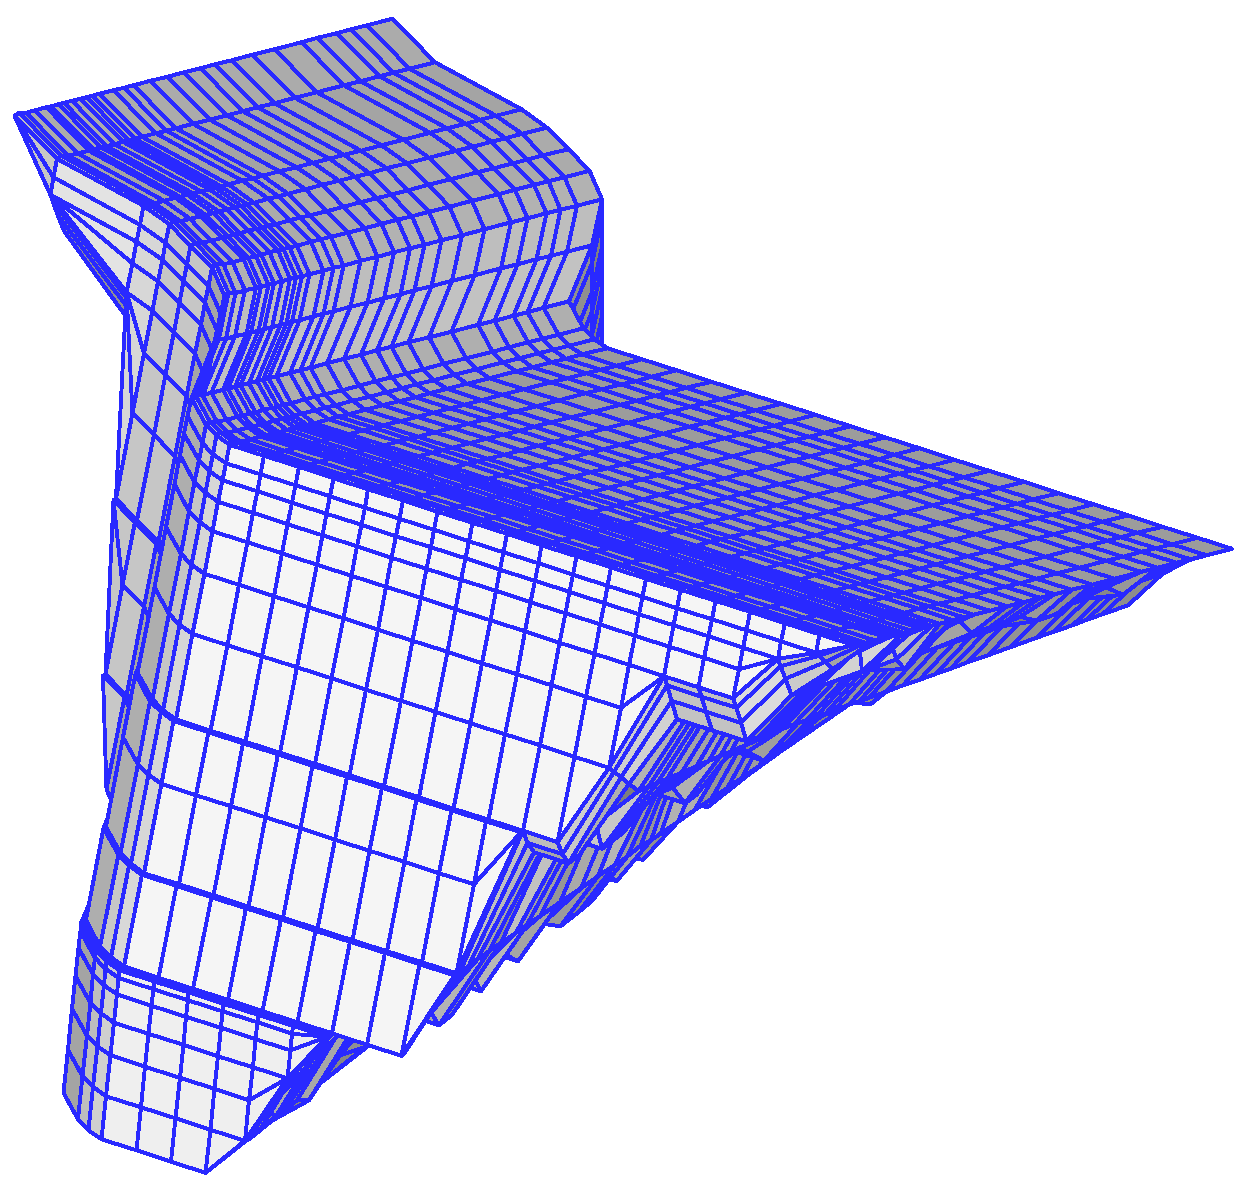
3.2. UAV Application Examples

At present, many UAV data processing methods exist. In this study, the data processing software provided by the UAV manufacturer was used, and an inclined photography model of the tailings pond was generated.
The tilt photography system mainly comprises a UAV, a five-lens tilt camera (the central camera is vertical to the observation plane, and the remaining four cameras provide orthogonal azimuthal oblique placement observations), a UAV-PPK module, and a base station, which can meet the working requirements under general geographical conditions, as shown in Figure 5.
Oblique photography data processing can be divided into three steps: data preprocessing, data integration, and model output. The process is shown in Figure 3. (1) Data preprocessing primarily includes base station data acquisition, influence distortion adjustment, data calculation, data matching, and integrity checks. (2) Data integration mainly entails the cleaning, analysis, and combination of the extracted data to establish a preliminary oblique photography model. (3) At the model output stage, the defects of the initial model are largely improved, and model water identification errors are corrected [36]. The data processing method is shown in Figure 6 and the generation process of 3D oblique photographic images of the tailings pond is shown in Figure 7.
The detailed situation of each part of the tailings pond is shown in Figure 8. The model was established in January 2021. The ore-drawing equipment was not removed one month after tailings pond operation was stopped.
As shown in Figure 8a, the tailings pond includes three drainage wells, one of which is in use. The other two drainage wells at the foot of the mountain are obviously higher than the water surface of the tailings pond and are not in use. The development characteristics of the tailings tail in the 2018–2020 satellite images (Figure 4) can also confirm this conclusion. The whole tailings pond is clearly shown in Figure 8b, which is a positive image of the tailings pond. As the images were captured in January (when the local average minimum temperature reached −11 °C), most of the water body at the tail of the reservoir was frozen, and the wet beach surface could be easily distinguished from the water part of the tailings reservoir based on the color. As shown in Figure 8c, after enlarging the local ore-drawing points on the west dam, many ore-drawing points near the inner dam clearly contained energy dissipation pits formed by the impact of tailings slurry during ore drawing and migration traces produced under slurry flow, and the beach surface of this part was very uneven. By enlarging parts ① and ②, Figure ① clearly shows that the ore drawing pipe is parallel to the inner slope, and no slope protection measures were implemented on the inner slope. Therefore, under the action of hydrodynamics, the pulp at the drawing stage eroded the inner slope of the stacking dam, causing partial damage to the inner slope. This situation violates the requirement whereby tailings slurry washing on the slope surface of the dam and ditch pulling are prohibited, indicating that the ore-drawing operations had not been previously standardized. Therefore, the beach surface on the west side of Figure 6d and Figure 8e shows that the entire beach surface is partially uneven, with gullies and fan-shaped beach surfaces generated under partial slurry flow.
Analysis of the inclined images of the tailings pond shows that the rising reservoir flooded the dam inspection road at the end of the east dam. In addition, by analyzing the flatness of the beach surface and inner slope of the tailings pond, the nonstandard ore-drawing phenomenon was observed in front of the dam before the tailings pond operation was stopped, and the inner slope was not protected during ore drawing, which led to the erosion of the inner slope under slurry flow. However, after the internal slope was eroded and destroyed, its strength was further reduced, thereby affecting the safety of the tailings pond.

3.3. Early Warning Method and Data Analysis of Online Monitoring System

3.3.1. Early Warning Method

The infiltration line and displacement are closely related to tailings pond failure. The early warning method of infiltration and displacement must be established in the online monitoring system. A numerical model of the tailings pond was established by the finite element method (FEM). The model uses the terrain line to cut a two-dimensional mesh for 3D mesh model generation. The 3D grid is dominated by hexahedral elements and their degenerate elements. The model comprises 9436 nodes and 8687 cells, as shown in Figure 9. The Duncan–Chang EB model was adopted for the tailings pond. The material can be divided into four types: tailings coarse sand, tailings fine sand, tailings silty sand, and tailings clay. The material parameters of each calculation unit were obtained according to the distance from the dam body.
Via numerical simulation and analysis, warning values of different levels (levels 1, 2, and 3) were obtained. At the same time, when the displacement, infiltration line and reservoir water level exceeded the set warning values, an early warning was issued.
The early warning method of the tailings dam infiltration line can be described as follows: corresponding to each infiltration line, the safety factors of the four sliding modes were calculated, namely shallow sliding, deep sliding, integral sliding, and broken line sliding. The numerical relationship between the burial depth of the infiltration line and the safety factors of the four sliding modes was then established. By calculating the relationship between the safety factors of surface sliding and overall sliding and the buried depth of the infiltration line, the third-level warning value of the infiltration line of the tailings pond was finally obtained, as listed in Table 7.
By calculating the relationship between the total amount of horizontal deformation of each node downstream and the reduction coefficient, calculation results of the three-level early warning index of the F11, F12, and F13 GPS monitoring points of the east dam of the tailings pond were finally obtained. Among them, the reduction coefficients of the first, second, and third warning levels were 1.0, 0.8, and 0.5, respectively, and the total deformations of the first, second, and third warning levels were 13.3, 8.8, and 5.7 cm, respectively.

3.3.2. Data Analysis of the Online Monitoring System

To better understand the current operating status of the tailings pond according to the operation of the tailings pond online monitoring system, displacement and infiltration line monitoring data for January 2021 were extracted from the online monitoring system to assess the overall safety status of the tailings pond. As shown in Figure 10 and Figure 11.
By evaluating the variation trend of the phreatic depth of the tailings pond in Figure 8, the burial depth of the infiltration line fluctuated from the beginning to the end of the month, but the overall depth exhibited an increasing trend, indicating that the overall water level of the tailings pond constantly decreased. This finding is consistent with the development trend of the overall regional stability of the reservoir area after the suspension of tailings pond operations, when no new water source occurred in the tailings pond. Moreover, the average depth of the infiltration line at the four monitoring points from J-1 to J-4 reached 8.86, 5.05, 5.79, and 3.98 m, and the lowest depth reached 8.27, 4.87, 5.58, and 3.81 m, respectively. Compared to the minimum required values provided in Table 6 and the warning levels in Table 7, the infiltration lines of the three monitoring points J-2 to J-4 satisfied the minimum values stipulated by the state but did not meet the enterprise’s security risk prevention and control requirements, indicating the first-level warning state. At the same time, the buried depth of the infiltration line at point J1 indicated the third-level warning state, so mining enterprises should give attention to timely on-site reviews of the infiltration line at several points and should implement effective drainage measures to quickly increase the buried depth of the infiltration line and ensure the stability of the tailings pond.
The displacement monitoring data for the section monitoring points of the east dam of the tailings pond were analyzed. Positive and negative data values were determined according to personnel standing on the dam body and facing downstream. Along the Y direction, the downstream direction was considered positive, and the upstream direction was considered negative. The displacement along the Z direction was considered positive along the downward direction and negative along the upward direction.
As shown in Figure 11a. The Y values of the F11, F12, and F13 monitoring points on the east dam of the tailings pond were 2.40, 5.00, and 4.85 mm, respectively, in the upstream direction, and 2.71, 4.68, and 4.03 mm, respectively, in the downstream direction. As shown in Figure 11b. The maximum values of the F11, F12, and F13 monitoring points on the east dam of the tailings pond were 3.82, 6.25, and 4.78, respectively, in the downstream direction of the Z direction, and 2.46, 6.27, and 4.92 mm, respectively, in the upstream direction of the Z direction.
The analysis of the displacement data of the east dam of the tailings pond revealed that the maximum displacement of the F12 monitoring point in the Z direction (settlement value) was 6.27 mm (displacement monitoring frequency 15 s/time) on 7 May 2022, resulting in a third-level warning. The mean displacement changes in F11–F13 were analyzed by using an exponentially weighted moving average method, and the frequency fluctuation of the dam displacement tended to remain stable without significant deformation.

4. Discussion

Space–sky–Earth integration monitoring technology constitutes a new means. It can provide supervision authorities with a new monitoring method for remote supervision of tailings ponds through the combination of satellite remote sensing technology (space), UAV technology (sky), and ground monitoring technology (Earth).
The remote sensing images from 2018 to 2020 clearly showed the entire process of tailings pond erosion and degradation of the surrounding environment in the heightening and capacity expansion process. Moreover, the ore pulp-drawing process and the layout of the drawing inlet are shown in the images. According to the flow path and flow process of slurry water in the tailings pond, the change in the tailings pond beach surface could be identified. Therefore, satellite remote sensing technology enables regulatory authorities to remotely monitor changes in various types of data, such as the layout of ore pulp drawing, ore-drawing operations, tailings flow path, and changes in the accumulated water on the pond surface, thereby helping regulatory authorities to better understand changes and operation conditions in advance.
As one of the cores of space–sky–Earth integration monitoring technology, UAV 3D tilt photography technology compensates for the poor satellite remote sensing image accuracy. This technology can accurately reflect the detailed problems affecting safety during the operation of tailings ponds, such as nonstandard ore drawing, uneven ore drawing, and lack of protection of the internal slope at the ore drawing stage during tailings pond operation.
To reflect the internal running state of the tailings pond, it is necessary to monitor parameters such as the infiltration line and displacement. The FEM was used to establish a tailings pond model. By calculating the relationship between the reduction coefficient and the infiltration line or total displacement variation, the early warning index of each tailings pond monitoring point was obtained. The analysis of the displacement data of the east dam of the tailings pond revealed that the maximum displacement of the F12 monitoring point in the Z direction (settlement value) was 6.27 mm (displacement monitoring frequency 15 s/time) on 7 May 2022, resulting in a third-level warning. The infiltration lines of the three monitoring points J-2 to J-4 did not meet the enterprise’s security risk prevention and control requirements, indicating the first-level warning state. Mining enterprises must give attention to timely on-site review of multiple points of infiltration lines, implement effective drainage measures, and quickly increase the depth of infiltration lines.

5. Conclusions

Space–sky–Earth integration monitoring technology is a new means by which supervision departments can strengthen tailings pond risk prevention and control capabilities. These aspects can be verified and complement each other in three ways, which can be easily elucidated by safety supervision departments. The rapid determination of technical indexes is closely related to dam safety. A new dynamic process can facilitate the suitable determination of the safety conditions of tailings ponds, quickly reveal the population distribution downstream of tailings ponds, and prevent casualties and economic losses caused by tailings pond accidents.
Although space–sky–Earth integration technology can help supervision departments to assess environmental changes in the tailings reservoir area and its surroundings, remote monitoring of hidden infrastructure such as flood discharge tunnels and wells has not been realized. To enhance risk prevention and control efforts for flood drainage systems, building information modeling (BIM) methods for concealed engineering modeling purposes will be combined with space–sky–Earth integration technology to explore the establishment of in-depth risk prevention and control technology from the outside to the inside of tailings ponds.

Author Contributions

Methodology, H.Z.; Software, Z.D.; Formal analysis, J.W.; Investigation, B.F. and Z.Z.; Data curation, H.Z.; Writing—original draft preparation, H.Z.; Writing—review, J.W. and Q.L.; Supervision, Q.L.; Funding, Q.L. and H.Z. All authors have read and agreed to the published version of the manuscript.

Funding

This work was supported by the National Key Research and Development Program of China (No. 2021YFC3001303) and the National Natural Science Fund of China (grant number 51874260).

Data Availability Statement

The datasets generated during and/or analyzed in the current study are available from the corresponding author upon reasonable request.

Conflicts of Interest

We declare that we have no financial or personal relationships with other people that may unduly affect our work.

References

  1. Li, Q.M.; Duan, Z.J.; Yu, Y.Z.; Shi, H.; Li, Z.T. Research progress on deposition structure characteristics and performance evolution law of tailings dam. J. Saf. Sci. Technol. 2022, 18, 6–19. (In Chinese) [Google Scholar]
  2. Lin, Y.S.; Zhang, W. Geohazard and risk assessment for tailing reservoir. J. Guilin Univ. Technol. 2006, 26, 486–490. (In Chinese) [Google Scholar]
  3. Li, Q.M.; Zhang, H.; Li, G. Comparison Analysis of Safety Management of Tailings Ponds Life Cycle in China and Australia. Mod. Min. 2016, 32, 1–5+9. (In Chinese) [Google Scholar]
  4. Chen, R.Z. Scientific interpretation of xiangfen tailings pond dam break event. Knowl. Is Power 2008, 53, 14. (In Chinese) [Google Scholar]
  5. Robertson, P.K.; de Melo, L.; Williams, D.J.; Wilson, G.W. Report of the Expert Panel on the Technical Causes of the Failure of Fundão Dam Ⅰ. Prep. Val. Ltd. 2019. Available online: http://www.b1technicalinvestigation.com/report.html (accessed on 1 March 2023).
  6. Xu, R.S. Analysis of Major Accident of Stava Tailing Dam in Northeast Italy. China Occup. Saf. Health Manag. Syst. Certif. 1994, 14, 26+57–60. (In Chinese) [Google Scholar]
  7. Azam, S.; Li, Q. Tailings dam failures:a review of the last one hundred years. Geotech. News 2010, 28, 50–54. [Google Scholar]
  8. Du, H.; Song, D.Q. Investigation of failure prediction of open-pit coal mine landslides containing complex geological structures using the inverse velocity method. Nat. Hazards 2022, 111, 2819–2854. [Google Scholar] [CrossRef]
  9. Li, Q.; Geng, J.; Song, D.; Nie, W.; Saffari, P.; Liu, J.T. Automatic recognition of erosion area on the slope of tailings dam using region growing segmentation algorithm. Arab. J. Geosci. 2022, 15, 438. [Google Scholar] [CrossRef]
  10. Li, D.R. On space-air-ground integrated earth observation network. J. Geogr. Sci. 2012, 14, 419–425. (In Chinese) [Google Scholar] [CrossRef]
  11. Wang, Z.L.; Wang, L.J.; Yin, H. Research on monitoring and controlling technology of tailings pond based on 3D data of space-air-ground. J. Saf. Sci. Technol. 2019, 15, 124–130. (In Chinese) [Google Scholar]
  12. Zhang, Y.M. The Application of Remote Sensing Technology in Digital City Construction. China Inf. Times 2010, 9, 23–25. (In Chinese) [Google Scholar]
  13. Zhang, Y.T. Research on Intelligent Monitoring and Evaluation of Mine Geological Disasters—A Case Study of Ningdong Coal Base, Ningxia; CUGB: Beijing, China, 2021. (In Chinese) [Google Scholar]
  14. Xiang, D.L.; Deng, Y.B. Current situation and future development of spatial earth observation. Sci. Technol. Assoc. Forum 2009, 24, 188–189. (In Chinese) [Google Scholar]
  15. Lu, N.M.; Gu, S.Y. Review and prospect on the development of meteorological satellites. J. Remote Sens. 2016, 20, 832–841. (In Chinese) [Google Scholar]
  16. Yang, J.; Xian, D.; Tang, S.H. The latest progress and application of Fengyun series meteorological satellites. Satell. Appl. 2018, 83, 8–14. (In Chinese) [Google Scholar]
  17. Wang, D.Z.; He, H.Y. Observation Capability and Application Prospect of GF-4 Satellite. Spacecr. Recovery Remote Sens. 2017, 38, 98–106. (In Chinese) [Google Scholar]
  18. Zang, Q.J.; Ma, S.J. Achievements and Progress of China-Brazil Earth Resource Satellite. Spacecr. Eng. 2009, 18, 1–8. (In Chinese) [Google Scholar]
  19. He, Y.J.; Xu, J.; Wei, J.L. Automatic Classification and Accuracy Analysis of HJ-1 CCD Image: Taking Qinbei Distirct of Guangxi as an Example. Geomat. Spat. Inf. Technol. 2017, 40, 153–156. (In Chinese) [Google Scholar]
  20. Maxwell, S.K.; Sylvester, K.M. Identification of “ever-cropped” land (1984–2010) using Landsat annual maximum NDVI image composites: Southwestern Kansas case study. Remote Sens. Environ. 2012, 121, 186–195. [Google Scholar] [CrossRef] [Green Version]
  21. Huang, X.; Jiao, L.; Zhang, Z.; Fang, G.; Chen, Y. Assess river embankment impact on hydrologic alterations and floodplain vegetation. Ecol. Indic. 2019, 97, 372–379. [Google Scholar] [CrossRef]
  22. Kalabin, G.V.; Moiseenko, T.I.; Gorny, V.I.; Kritsuk, S.G.; Soromotin, A.V. Satellite monitoring of natural environment at Olimpiada gold open-cut mine. J. Min. Sci. 2013, 49, 160–166. [Google Scholar] [CrossRef]
  23. Teixeira, D.B.d.S.; Veloso, M.F.; Ferreira, F.L.V.; Gleriani, J.M.; do Amaral, C.H. Spectro-temporal analysis of the Paraopeba River water after the tailings dam burst of the Córrego do Feijo mine, in Brumadinho, Brazil. Environ. Monit. Assess. 2021, 193, 1–13. [Google Scholar] [CrossRef] [PubMed]
  24. Moraga, J.; Gurkan, G.G.; Duzgun, S. Monitoring the impacts of a tailings dam failure using satellite images. In Proceedings of the MineXchange SME Annual Conference and Expo, Phoenix, AZ, USA, 29 August 2019. [Google Scholar]
  25. Gitau, F.; Maghanga, J.K.; Ondiaka, M.N. Spatial mapping of the extents and volumes of solid mine waste at Samrudha Resources Mine, Kenya: A GIS and remote sensing approach. Model. Earth Syst. Environ. 2022, 8, 1851–1862. [Google Scholar] [CrossRef]
  26. Davies, G.E.; Calvin, W.M. Mapping acidic mine waste with seasonal airborne hyperspectral imagery at varying spatial scales. Environ. Earth Sci. 2017, 76, 432. [Google Scholar] [CrossRef]
  27. Roger, M. Satellite Remote Sensing for Effective Monitoring of Tailings Storage. Eng. Min. J. 2016, 217, 54–56. [Google Scholar]
  28. Gao, X.P.; Zhang, Z.X.; Song, J.R.; Zhang, H.X.; Zhao, S.H.; Li, C.H. Application of Space, Air and Ground Integrated Technology in Monitoring and Early Warning of Tailings Pond. Met. Mine 2020, 55, 188–193. (In Chinese) [Google Scholar]
  29. Jia, H.J.; Wang, L.J.; Jin, X.; Tang, Y.; Ma, G.C. Three-dimensional spatial data acquisition and risk analysis of tailings pond based on UAV aerial survey. J. Saf. Sci. Technol. 2018, 14, 115–119. (In Chinese) [Google Scholar]
  30. Cai, J.N.; He, T.H.; Huang, M.Z. The Application of GF-1 and GF-2 Satellite Remote Sensing Data to Ecological Environment Monitoring. Environ. Monit. 2018, 10, 12–18. (In Chinese) [Google Scholar]
  31. Zhou, Y.J.; Li, S.J.; Wei, H.Y.; Gan, F.P.; Liu, X.Y. Preliminary Application Evaluation of “GF102,03,04 Satellite Data” in Remote Sensing Monitoring of Mine Development Environment. Geomat. Spat. Inf. Technol. 2020, 43, 73–75+78. (In Chinese) [Google Scholar]
  32. Lin, X.H. ZY-102C Satellite Data Application in Mine Development and Environmental Survey. J. Longyan Univ. 2018, 36, 77–82. (In Chinese) [Google Scholar]
  33. McFEETERS, S.K. The use of the Normalized Difference Water Index (NDWI) in the delineation of open water features. Int. J. Remote Sens. 1996, 17, 1425–1432. [Google Scholar] [CrossRef]
  34. Xu, H.Q. A Study on Information Extraction of Water Body with the Modified Normalized Difference Water Index (MNDWI). J. Remote Sens. 2005, 9, 589–595. (In Chinese) [Google Scholar]
  35. Qiu, M.Y.; Gan, S.; Zhao, L.H. Research on Index Method of Extracting Water Body of Erhai Lake Using Sentinel-2 Image. Urban Surv. 2022, 37, 117–122. (In Chinese) [Google Scholar]
  36. Zhang, H.; Li, Q.M.; Chen, T.; Sui, J.Z. Application of three-dimensional oblique photography in risk prevention and control of tailings pond. J. Saf. Sci. Technol. 2022, 18, 27–31. (In Chinese) [Google Scholar]
  37. Yang, C.B.; Zhu, W.H.; Sun, J.B.; Xu, X.L.; Wang, R.H.; Lu, Y.F.; Zhang, S.W.; Zhou, W.Q. Assessing the effects of 2D/3D urban morphology on the 3D urban thermal environment by using multi-source remote sensing data and UAV measurements: A case study of the snow-climate city of Changchun. J. Clean. Prod. 2021, 321, 128956. [Google Scholar] [CrossRef]
  38. Esposito, G.; Mastrorocco, G.; Salvini, R.; Oliveti, M.; Starita, P. Application of UAV photogrammetry for the multi-temporal estimation of surface extent and volumetric excavation in the Sa Pigada Bianca open-pit mine, Sardinia, Italy. Environ. Earth Sci. 2017, 76, 103–118. [Google Scholar] [CrossRef]
  39. Polley, H.W.; Kolodziejczyk, C.A.; Jones, K.A.; Derner, J.D.; Augustine, D.J.; Smith, D.R. UAV-Enabled Quantification of Grazing-Induced Changes in Uniformity of Green Cover on Semiarid and Mesic Grasslands. Rangel. Ecol. Manag. 2022, 80, 68–77. [Google Scholar] [CrossRef]
  40. Padro, J.C.; Carabassa, V.; Balague, J.; Brotons, L.; Alcaniz, J.M.; Pons, X. Monitoring opencast mine restorations using Unmanned Aerial System (UAS) imagery. Sci. Total Environ. 2019, 657, 1602–1614. [Google Scholar] [CrossRef]
  41. Li, Y.L.; Liu, Y.F. Mine Tailings Dam Transformation Monitoring Technology. China Molybdenum Ind. 2012, 36, 17–20. (In Chinese) [Google Scholar]
  42. Liao, W.J.; Zhu, Y.L.; Wang, Q.X. Research on Safety Management System of Tailings Pond Based on UAV Intelligent Cruise. Min. Res. Dev. 2021, 41, 165–170. (In Chinese) [Google Scholar]
  43. Huang, L.X.; Li, W.P.; Ling, Q.; Zhou, Z.Y.; Li, Y.F. Application of UAV in health monitoring of mine tailings pond. Nonferrous Met. 2022, 74, 125–129. (In Chinese) [Google Scholar]
  44. Yang, C.; Yang, P.; Lyu, W.S.; Wang, K. Surface deformation monitoring of tailings dam slope based on UAV photogrammetry. J. Saf. Sci. Technol. 2021, 17, 5–11. (In Chinese) [Google Scholar]
  45. Zeng, H.; Zhou, H.Y.; Hu, S.H.; Li, M.X.; Wu, H.; Wang, S.J. Deduction of tailings dam break accident based on UAV modeling. J. Saf. Sci. Technol. 2021, 17, 104–110. (In Chinese) [Google Scholar]
  46. Lin, X.L.; Liu, Y.; Zhang, Q.L.; Wang, W.S. UAV aerial photography-based numerical simulation on failure of tailings reservoir dam. Water Resour. Hydropower Eng. 2021, 52, 71–81. (In Chinese) [Google Scholar]
  47. Chen, Q.M. Application of tailings pond monitoring and analysis based on UAV technology. New Explor. 2019, 34, 17–23+26. (In Chinese) [Google Scholar]
  48. Ma, G.C.; Wang, L.J.; Ma, S.; Tang, Y. Application of UAV photogrammetry in construction planning of mine tailings reservoir. Sci. Surv. Mapp. 2018, 43, 84–88. (In Chinese) [Google Scholar]
  49. Bai, L.S.; Zhang, H.W.; Nie, M.L. The Application and Quality Control of GPS RTK and GPS PPK in the Second Land Investigation of Baotou City. Bull. Surv. Mapp. 2013, 59, 49–53+56. (In Chinese) [Google Scholar]
  50. Li, Q.M.; Wang, Y.H.; Li, G. Tailings dam breach disaster on-line monitoring method and system realization. Procedia Eng. 2011, 26, 1674–1681. [Google Scholar] [CrossRef] [Green Version]
  51. Jiang, W.D.; Li, X.B.; Wu, D.Z.; Zhao, D.Z. An automatic safety monitoring system for the No.2 tailings dam in Dexing Copper Mine. China J. Min. R D. 2003, 23, 33–34+44. (In Chinese) [Google Scholar]
  52. Wang, C.; Wang, Y.H.; Li, Q.M.; Zhou, Z.; Shi, Z.D.; Meng, X.S. Research on an Online Mine Tailings Dana Optical Fiber Surveillance Technology. Shandong Sci. 2008, 21, 4–8. (In Chinese) [Google Scholar]
  53. Yang, L.H.; Li, Q.M.; Cheng, W.Y.; Wang, Y.H. The analysis of main risk factors about tailings dam accidents at home and abroad. J. Saf. Sci. Technol. 2008, 4, 28–31. (In Chinese) [Google Scholar]
  54. Li, Q.M.; Wang, Y.H.; Zhang, X.K.; Zhao, J. Analysis of disastrous factors concerning tailing dam failing and research on risk index system. J. Saf. Sci. Technol. 2008, 4, 50–54. (In Chinese) [Google Scholar]
  55. Li, J.F. Analysis of Factors influencing Safety of Tailings Dam and Countermeasures. West-China Explor. Eng. 2006, 18, 285–286. (In Chinese) [Google Scholar]
  56. Wang, F.J.; Wang, L.G. Hazards of tail reservior and its engineering control. Chin. J. Geol. Hazard Control 2003, 14, 76–80. (In Chinese) [Google Scholar]
  57. Zheng, X.; Xu, K.L.; Wei, Y. Study on the disaster-causing mechanism of the tailings dam falling. J. Saf. Sci. Technol. 2008, 4, 8–12. (In Chinese) [Google Scholar]
  58. Li, Z.K.; Liao, G.L. Design and Research on Monitoring and Early Warning System of Tailings Reservoir Dam Failure. Nonferrous Met. 2008, 60, 33–35. (In Chinese) [Google Scholar]
  59. Li, Q.M.; Xie, X.Y.; Chen, S.R.; Wang, Y.H. Safety monitoring key points of tailings pond. Labour Prot. 2008, 12, 97–99. (In Chinese) [Google Scholar]
  60. Li, Q.M.; Zhang, H.; Yang, Z. Construction of On-line Monitoring System and Monitoring Data Analysis for Tailings in Alpine Region. In Proceedings of the 8th International Conference on Advances in Materials and Manufacturing Processes, Beijing, China, 11–12 November 2017. [Google Scholar]
Figure 1. Space–sky–Earth integration technology for tailings ponds.
Drones 07 00222 g001
Figure 2. Location of the tailings pond. (a) One-kilometer distribution map of the area downstream of the overhead tailings pond (a tailings pond; b facilities of the mining company; c downstream villages; d railway station; e downstream roads and railways). (b) Enlarged view of the tailings pond. (c) Section view of tailings pond.
Drones 07 00222 g002aDrones 07 00222 g002b
Figure 3. Design diagram of the online monitoring system for the tailings pond. (a) Layout of the tailings pond online monitoring system. (b) Sensor transmission line diagram. (c) Profile of the online monitoring system. (d) Tailings pond site rainfall monitoring point.
Drones 07 00222 g003aDrones 07 00222 g003b
Figure 4. Satellite images of the tailings pond from 2018 to 2020. (a) 2018 satellite image: the yellow box denotes the reference point of the tailings pond, which can determine the characteristics of the test tailings pond; the black curve indicates the boundary line of the tailings pond; the white line in the orange area indicates the tailings pond patrol road. (b) 2019 satellite image: the black curve indicates the boundary line of the tailings pond in 2018. At this time, the actual boundary line partially exceeded the area. The white lines in the orange area are the tailings pond patrol roads. The red area is part of the road leading to the downstream area and has disappeared. (c) 2020 satellite image: the black curve indicates the boundary line of the tailings pond in 2018. At this time, the actual boundary line of the tailings pond obviously exceeded the area. The red area is the entire perimeter path that disappeared. (d) Satellite panoramic image.
Drones 07 00222 g004aDrones 07 00222 g004b
Figure 5. Components of the oblique photography system.
Drones 07 00222 g005
Figure 6. Data processing method.
Drones 07 00222 g006
Figure 7. Generation process of three-dimensional oblique photographic images of the tailings pond. (a) Mesh generation. (b) Three-dimensional tilt model.
Drones 07 00222 g007aDrones 07 00222 g007b
Figure 8. Tilt photograph obtained with the UAV. (a) Drainage well photograph. (b) Positive image of the tailings pond. Due to the season when the images were captured, the water surface is partially frozen; the orange area contains no patrol roads, which is consistent with the 2020 satellite image. (c) Expanded view of the west dam. The inner slope in the red area is eroded. (d) Beach surface of the west dam. The yellow areas indicate energy dissipation pits eroded during ore drawing. (e) Slurry movement map of the tailings pond.
Drones 07 00222 g008aDrones 07 00222 g008bDrones 07 00222 g008c
Figure 9. Finite element numerical model.
Drones 07 00222 g009
Figure 10. Trend analysis of the infiltration line of the tailings pond.
Drones 07 00222 g010
Figure 11. Displacement monitoring data and infiltration line trend analysis results for the tailings pond east dam (a). displacement along the Y direction; (b). displacement along the Z direction. Displacement along the Y direction: positive along the downstream direction (standing on the dam body facing downstream); otherwise, the displacement is negative. Displacement along the Z direction: positive downward and negative upward). (a) Displacement along the Y direction of monitoring points F11, F12, and F13. (b) Displacement along the Z direction of monitoring points F11, F12, and F13.
Drones 07 00222 g011aDrones 07 00222 g011b
Table 1. Building and population distributions 1 km downstream of the tailings pond.
AimDistance (m)Population (Individuals)AimDistance (m)Population (Individuals)
Mining company haulage plant500-Spare parts warehouse of the mining company1000-
Concentrator of the mining company600-Village10001542
Small repair shop of the mining company900-Railway station10009
No. 1 warehouse of the mining company500-Railway and highway1000-
Table 2. Tailings pond data for different years.
Year of the Tailings PondElevation of the Dam Crest (m)Bottom Elevation of the East Dam (m)Bottom Elevation of the West Dam (m)Internal and External Slope RatioStorage Capacity (Ten Thousand m³)Inland Slope Ratio of the Beach Surface
1991163.5142.5152Initial dam: 1:2.0-1.5%
2007200Initial dam: 1:2.0760
2020225Fill dam: 1:4.01370
Table 3. Analysis of the main parameters of select satellites in use.
ParameterResource Satellite SeriesGaofen Satellite SeriesHJ-1 Satellite Series
ZY3-02ZY3ZY1-02CZY1-04GF-4GF-2GF-1HJ-1A, BHJ-1C
Carrying equipmentMultispectral cameraPanchromatic/Multispectral cameraVisible near-infrared (VNIR), medium-wave infrared (MWIR)Panchromatic multispectral cameraCCD camera, hyperspectral imager (A), infrared multispectral camera (B)Synthetic aperture radar (SAR)
High-resolution cameraInfrared multispectral camera, wide-field imagerMultispectral camera
Track height/km505505.984780.09977836,000631645649.093499.26
Track inclination/°97.421°97.421°98.5°98.5°Not applicable97.9080°98.0506°97.9486°97.3671°
Descending node/am10:3010:3010:3010:30Not applicable10:3010:3010:30 ± 30 min6:00
Coverage period/d59595526Not applicable69413131
Maximum resolution/m2.12.12.3654012305
Application sceneLand and resource surveying and monitoring, ecological environmental protection, urban planning, disaster prevention and mitigation, and transportation.Disaster risk early warnings and forecasting, meteorological and weather monitoring, land and resource investigation, agricultural monitoring, housing, urban and rural construction, transportation, etc.The satellite system, including 2 small optical satellites (A, B) and 1 small SAR satellite (C), can be used for ecological environmental and disaster monitoring under all-weather, daily, and dynamic monitoring conditions. The system can help experts to forecast disasters and change trends in the ecological environment and quickly assess disasters.
Table 4. Type of UAV used in tailings pond monitoring.
UAV TypePlace of OriginWing TypeObservation MethodType of CameraMaximum Flight Time
(min)
Maximum Flight Speed
(km/h)
Tailings Pond SiteReference
DJI Phantom 4 ProChinaFour rotorsGlobal navigation satellite system (GNSS)-RTKTilt camera3072Gansu[43]
DJI M600ChinaSix rotorsPPKFive-lens tilt camera3865Jiangxi[36]
QC-2-Fixed wing-SONY RX1R M2 digital aerial camera--Xinjiang[46]
DJI Phantom 4 RTKChinaFour rotorsZhonghaida V30 GNSS RTK-2872Shandong[44]
DJI 4AChinaFour rotorsGlobal positioning system (GPS)-RTK---Guangdong[47]
Sensefly EbeeChinaFixed wingGPS-RTKSONY DSC-WX2204545Sichuan[48]
Table 5. Requirements for the burial depth of the infiltration lines in tailings ponds.
Dam Height HH ≥ 150150 > H ≥ 100100 > H ≥ 6060 > H ≥ 30H < 30
Minimum depth of the infiltration line10~88~66~44~22
The height of the accumulation dam can be calculated according to the position of the axial section of each vertical dam. The stacking height of the initial section can be calculated according to the stacking height, and the stacking height of the remaining section can be calculated according to the height difference between the top of the tailings dam and the foot of the slope. The minimum depth of the wetted line can be determined via linear interpolation.
Table 6. Requirements for the burial depth of the infiltration line in each section (In Figure 3a, the profile is 1-1 to 8-8 from left to right).
Profile1-12-23-34-45-5~8-8
Dam height H4547555761.5
Minimum depth of the infiltration line3.003.133.673.804.08
Table 7. Infiltration line warning value.
Name of the Sub-DamWarning LevelDepth of the Infiltration Line (m)
(J1, J2, J3, J4, J5)15.9
27.3
39.5
(J6, J7, J8, J9, J0)16.4
28.0
310.9
(J11, J12, J13, J14, J15)16.5
28.0
311.5
(J16, J17, J18, J19)16.5
28.0
311.5
Disclaimer/Publisher’s Note: The statements, opinions and data contained in all publications are solely those of the individual author(s) and contributor(s) and not of MDPI and/or the editor(s). MDPI and/or the editor(s) disclaim responsibility for any injury to people or property resulting from any ideas, methods, instructions or products referred to in the content.

