Article

Application of Image Processing Techniques for UAV Detection Using Deep Learning and Distance-Wise Analysis

International Institue of Information Technology, Naya Raipur 493661, India
*
Author to whom correspondence should be addressed.
These authors contributed equally to this work.
Drones 2023, 7(3), 174; https://doi.org/10.3390/drones7030174
Submission received: 26 December 2022 / Revised: 15 February 2023 / Accepted: 17 February 2023 / Published: 3 March 2023
(This article belongs to the Special Issue Advances in UAV Detection, Classification and Tracking-II)

Abstract

:
Drones have many applications in our daily lives and can be employed for agricultural, military, commercial, disaster relief, research and development, and many other purposes. There has been a significant increase in the usage of small drones/unmanned aerial vehicles in recent years. Consequently, there is a rising potential for small drones to be misused for illegal activities, such as terrorism and drug smuggling. Hence, there is a need for accurate and reliable UAV identification that can be used in various environments. In this paper, different versions of the current state-of-the-art object detection model, i.e., YOLO models, are used, by working on the principles of computer vision and deep learning to detect small UAVs. To improve the accuracy of small UAV detection, this paper proposes the application of various image-processing techniques to the current detection model, which has resulted in a significant performance increase. In this study, a mAP score of 96.7% was obtained for an IoU threshold of 50% along with a precision value of 95% and a recall of 95.6%. Distance-wise analysis of drones (i.e., for close, mid, and far ranges) was also performed to measure distance-wise accuracies.

1. Introduction

Unmanned aerial vehicles (UAVs) are aircraft that may be operated from a distance. They can be remotely controlled in real-time or pre-programmed to fly independently over predetermined itineraries. This kind of aircraft, more often known as a drone, is being used more frequently across many industries. The demand and usage of drones are increasing every day due to their applications in various sectors. Drones are used for aerial surveillance and observation in the military. Armed forces are supplied with supplies and weapons via cargo drones. Commercial businesses, government agencies, professional photographers, and enthusiasts all employ small drones. Each year, thousands of small drones are sold. These goods are easily accessible (both offline and online). Even a complete beginner can construct a small drone utilizing components that are readily available online. Large aircraft and ground facilities, such as fuel depots are highly unsafe from even a small drone. Drones can fly at high altitudes and capture images of private property, allowing them to peer inside houses through windows. To address these issues, the government has implemented appropriate rules. Law enforcement organizations currently employ a variety of technologies to thwart rogue UAVs, and UAV ownership and operation are subject to various restrictions and regulations. To take down rogue UAVs, options include signal blocking, capture, and attacks.
From a security point of view, it is crucial to detect UAVs (because they might be loaded with explosives) or stop security and privacy breaches. Hence, we need a system for UAV identification that is accurate and reliable and can be used in various environments. Various studies have already been performed to detect UAVs using various object detection techniques, such as RCNN and YOLO. In this study, various image-processing techniques were analyzed along with the YOLO (You Only Look Once) algorithm to increase the identification accuracy of the model for detecting unauthorized unmanned aerial vehicles (UAVs).

2. Related Work and Contributions

The use of UAV (unmanned aerial vehicle) technology is rapidly increasing. UAVs are now being used by individuals to distribute goods and take pictures at various events. UAVs are significant problems since they can access private property. A popular object identification algorithm for object detection in real-time is YOLO (You Only Look Once). A single neural network is used in the YOLO approach that applies to the entire image, divides it into regions, and forecasts the bounding boxes and likelihood for each region. This method is quick and accurate. The implementation of YOLOv2 and YOLOv3 is via a custom dataset for the purpose of real-time UAV identification and to compare the efficiency and mean average precision (MAP) of the two models. In a recent study, comparisons between several versions of YOLO were [1] offered. Based on the UAV detection domain, research for the enhanced YOLO model has been mandated [2], enhancing it to detect UAV more precisely and bringing the YOLOv3-based algorithm to UAV object identification for anti-UAV. To forecast bounding boxes for objects, it uses the last four scales of feature maps rather than the first three, which can gather more texture and contour data to recognize small objects. Similar research using UAV detection technologies built on the enhanced YOLOv4 object detection model [3] was done recently. Through lightweight processing, the YOLOv4 object detection model speed is increased. To further increase recognition accuracy, the CA (coordinate attention) module of the attention mechanism is applied. YOLOv5 is regarded as the benchmark algorithm for improvement, and the deep learning approach represented by a convolutional neural network significantly increases the detection accuracy and speed [4] when compared to the traditional manual feature object detection algorithm. In order to decrease the degree of computation required by the algorithm, shufflenetv2 is utilized in place of the original algorithm’s backbone. The CBMA module is introduced to the algorithm to increase detection accuracy while keeping computation costs low. The divide-and-conquer strategy [5] has been used in the past to improve the detection performance of small objects. High-resolution images are split into multiple image blocks to be detected separately, and the sky region recognition algorithm is used to remove the pure sky region devoid of any objects. The neck and discovery head of YOLOv5 are moved to the shallower sub-caste of the backbone (in terms of network topology) in order to leverage the spatial information in the shallow layers. The apparent resemblance of drones against various backgrounds is one of the complex challenges in real-time UAV detection.
You Only Look Once (YOLOv5), an enhanced machine-learning-based object detection model, was used in a recent study to develop a self-activating image-based UAV detection system to prevent restricted areas from being breached [6] by invading UAVs. Following the discovery of the object in the footage that was captured to distinguish drones from birds, a study [7] employed the YOLOv2 framework. The author utilized precision vs. recall curves to evaluate the performances of their approaches. Both the percentiles for recall and precision were 90. Many research works have investigated different methods for detecting small objects using Faster R-CNN [8] and single-shot detector (SSD) [9] and for differentiating birds from drones using Inception v2 [10] and ResNet-101 [11]. The authors used a dataset made up of 8771 frames taken from 11 films to examine the reliability of various structures. The drone was distant from the camera in one set of experiments, whereas the camera was distant in the other set of experiments. The Faster R-CNN–ResNet-101 hybrid outperforms the previous solutions in terms of recall and precision. Because CFAR-based detectors mainly rely on operator skills for tasks, such as calculating ambient noise distribution and choosing detection window sizes, and because the signals from small UAVs are frequently faint, they frequently perform incompetently when trying to detect smaller drones [12]. In order to solve this problem, a convolutional neural network (CNN) with two heads was put forward—one for predicting the offset between the target and the patch center, and the other for classifying range-Doppler map patches as either containing a target or not. Another study [13] based on a modified YOLOv4 provided a result of 83% mean average precision (mAP), which represents a 4% improvement over traditional YOLOv4 models. A drone detection and positioning system proposal is presented, which utilizes multi-dimensional signal features [14]. The system begins by collecting CSI data and communication signals from both the controller and drone. Subsequently, the SFS, WEE, and PSE are extracted and utilized as features by machine learning algorithms to detect the presence of a drone. Once a UAV is detected, a super-resolution estimation method is utilized to identify the AOA and AOE of the drone for localization.
Over 13,000 pictures of a moving target UAV were collected into a new dataset called Det-Fly by another moving UAV [15]. This dataset is more complete than comparable ones as it contains a wide range of realistic scenarios with various backgrounds, viewing angles, relative distances, flight altitudes, and lighting conditions. Using the Det-Fly dataset, the authors conducted an experimental analysis of eight deep-learning techniques, providing the first thorough analysis of deep learning methods for visual UAV identification, to the best of their knowledge. The evaluation’s findings highlight the main difficulties in air-to-air UAV detection and offer prospective directions for future algorithm development. Researchers proposed a technique to improve the detection of UAVs by classifying features in the foreground detection results [16]. Using edge strength and orientation in the surrounding area of the foreground detection helps distinguish potential UAV targets from the constantly changing background. Researchers developed and implemented a system for identifying low-altitude small unmanned aerial vehicles (UAVs) [17]. This system is based on the YOLO model and incorporates two neural networks, i.e., ResNet and DenseNet. The YOLO model-based detection method can considerably improve the identification of low-altitude UAVs in complex situations, according to experimentation on a small dataset. Using edge computing, researchers offer the Fast-YOLOv4 real-time UAV target detection technique [18]. Moreover, real-time detection is required, but this calls for highly configured hardware, such as a graphics processing unit (GPU). One study [19] attempted to address these issues by proposing the You Only Look Once version 5 (YOLOv5) one-shot detector, which can train the proposed model using pre-trained weights and data augmentation. A quick UAV target detection algorithm based on improved CenterNet was proposed [20] by one research work. It can extract the depth features from the images that were collected, create a keypoint feature map using a Gaussian kernel function, and output information about multiple target locations and categories. Reference [21] suggests a novel DEAX technique called enhanced adaptive feature pyramid networks-based target detection algorithm to identify targets for infrared tiny UAVs. Moreover, some research has been done in which the target detection and extraction approach uses a radar detection system [22]. An enhanced YOLOv3 (You Only Look Once v3) network-based UAV identification approach is proposed in reference [23] by fusing the deep learning method with the three-dimensional range profile obtained by Gm-APD (Geiger mode avalanche photodiode) lidar. A generic architecture was also proposed [24] for a UAV-to-UAV detection and tracking algorithm that uses a camera mounted on a moving UAV platform.
From studying various related works in this domain, it can be inferred that most of the methods use different kinds of convolutional networks and different versions of the YOLO algorithm to increase the identification accuracies of various captured images. Some of the above works performed comparative analyses of previous versions of YOLO algorithms on self-made datasets and obtained high accuracies as they trained their models on a limited number of images with similar backgrounds, which led to the overfitting of the model and resulted in high accuracies. Models trained on images in a similar terrain cannot produce convincing results in a real-world scenario where the model has to deal with different kinds of backgrounds. Previous works in this domain also lacked the range-wise analysis (close range, mid-range, far range) of their models, which is a very crucial aspect for judging the performance of a model for different applications, as many models could obtain high accuracies with UAVs being very close to the point of observation, simultaneously giving poorer results when the UAVs are far away. It was also observed that none of the previous works utilized different image processing techniques in the dataset before feeding them to the model, which could have increased the accuracy.
In order to address the aforementioned shortcomings of the prior works, the following methods were used:
  • A large dataset of various types of UAVs in various terrains was used, which addresses the issue of model overfitting and provides a benchmark for testing the model in various backgrounds, ensuring the model’s reliability in real-world scenarios.
  • Different image processing techniques were performed on the dataset before feeding them to the model, which led to an increment in the accuracies of the models.
  • Recent versions of the state-of-the-art object detection algorithms are used in this paper, providing higher accuracies than the previous ones.
  • Distance-wise analysis was conducted to test the performances of models with image-processed data in close, mid, and far ranges, which is critical when analyzing the performances of different models.

3. Methodology

The phenomenon of object detection in computer vision includes identifying things of interest in digital photos or videos. Numerous computer vision fields (such as image retrieval and video surveillance) use object detection. Object detection can be performed by using conventional image processing methods that are unsupervised or deep learning methods through supervised or unsupervised learning. Deep learning-based approaches require a large amount of annotated images as training data and can be constrained by GPU resources.

3.1. Object Detectors

The following two tasks must be accomplished by deep learning-based object detectors:
(1)
Find an arbitrary number of objects;
(2)
Classify each item and use a bounding box to estimate its size.
Consequently, there are two ways to detect objects, via one-stage detectors or two-stage detectors. The two-stage approach begins with the suggestion of an object region using deep networks or conventional computer vision techniques and then progresses to object classification using bounding-box regression based on features extracted from the suggested region. In the initial stage, two-stage object detectors locate a region of interest, which they then use to locate the cropped zone. However, because cropping is a non-differentiable process, these multi-stage detectors cannot be trained end-to-end. Without the region proposal phase, one-stage detectors can estimate bounding boxes over the images. This method can be applied in real-time applications because it is faster. Two-stage techniques are more accurate, but they are often slower. Due to the several inference steps required for each image, the performance of two-stage detectors (frames per second) is not as good as that of one-stage detectors. YOLO is currently one of the most significant one-stage object identification techniques available.

3.2. YOLO

YOLO is an abbreviation for You Look Only Once. This algorithm performs object classification and localization in a single stage (in real-time). YOLO identifies the probabilities of all classes present in an image during the detection process. The image is divided into grid cells, and the algorithm assigns bounding boxes and their probabilities to each grid cell using a neural network. The resulting bounding boxes are then weighted based on the predicted probabilities. YOLO uses convolutional neural networks (CNNs) to quickly recognize objects, requiring only a single forward pass through the neural network to identify objects, as its name suggests. This means that a single prediction algorithm is applied to the entire image. There are many versions of the YOLO algorithm; some of the most used versions for object detection include YOLO, YOLOv3, YOLOv4, YOLOv5, YOLOv7. YOLOv5 and YOLOv7 both use .yaml files for configuration and are based on the PyTorch framework. YOLOv5 was implemented in our project using Ultralytics Hub, a ground-breaking machine learning and deployment platform. The labels for YOLOv5 and V7 were text-based.
A more compact and quick version of YOLO, called YOLOv5, has been developed for real-time object identification on devices with constrained processing capabilities, including edge devices and low-power mobile devices. It makes use of a single-stage detector architecture and effective methods, such as anchor-free designs and personalized backbone networks.
On the other hand, YOLOv7 is a more modern and potent version of YOLO that increases detection accuracy by using a multi-scale feature pyramid network (FPN). In order to outperform earlier YOLO versions, it includes a variety of extra features, such as anchor-based detection, fine-tuning, training procedures, and enhanced architecture designs. In comparison to YOLOv5, YOLOv7 is slow on typical GPU systems, such as (GTX 1650 ti, and Quadro P2200). YOLOv7 runs quickly on new high-speed GPUs, including (Nvidia RTX 3090, and Tesla A100).

3.3. Image Preprocessing

The process of converting an image into a digital format and carrying out specific procedures to extract useful information from it is known as image processing. When implementing specific specified signal processing techniques, the image processing system typically interprets all images as 2D signals. An image can be thought of as a two-dimensional function, f(p, q), where p and q are spatial coordinates, and the amplitude of function f at any coordinate (p, q) is referred to as the intensity or gray level of the image at that location.

3.3.1. RGB

A color image is captured in 3 planes R, G, and B, Figure 1a. A color image is just three functions pasted together. A pixel value in an RGB image with 3 color channels has 3 values, each ranging from 0 to 255. As an illustration, ’0’ in the red channel denotes the absence of red color, while the value 255 denotes the presence of 100% of red colors in the pixels. The pixels in the other two channels can also be interpreted in this way.

3.3.2. Grayscale

In the gray image, every type of color information is removed, leaving only various shades of gray, with white being the lightest and black being the darkest. Red, green, and blue (often referred to as RGB) average pixel values, which range from 0 to 255, are combined. Each color band’s 24-bit intensity is combined to obtain an acceptable grayscale value (8 bits). It facilitates the simplification of algorithms and removes the difficulties associated with computational requirements. Figure 1b shows sample color and grayscale images from the dataset.

3.3.3. Hue Augmentation

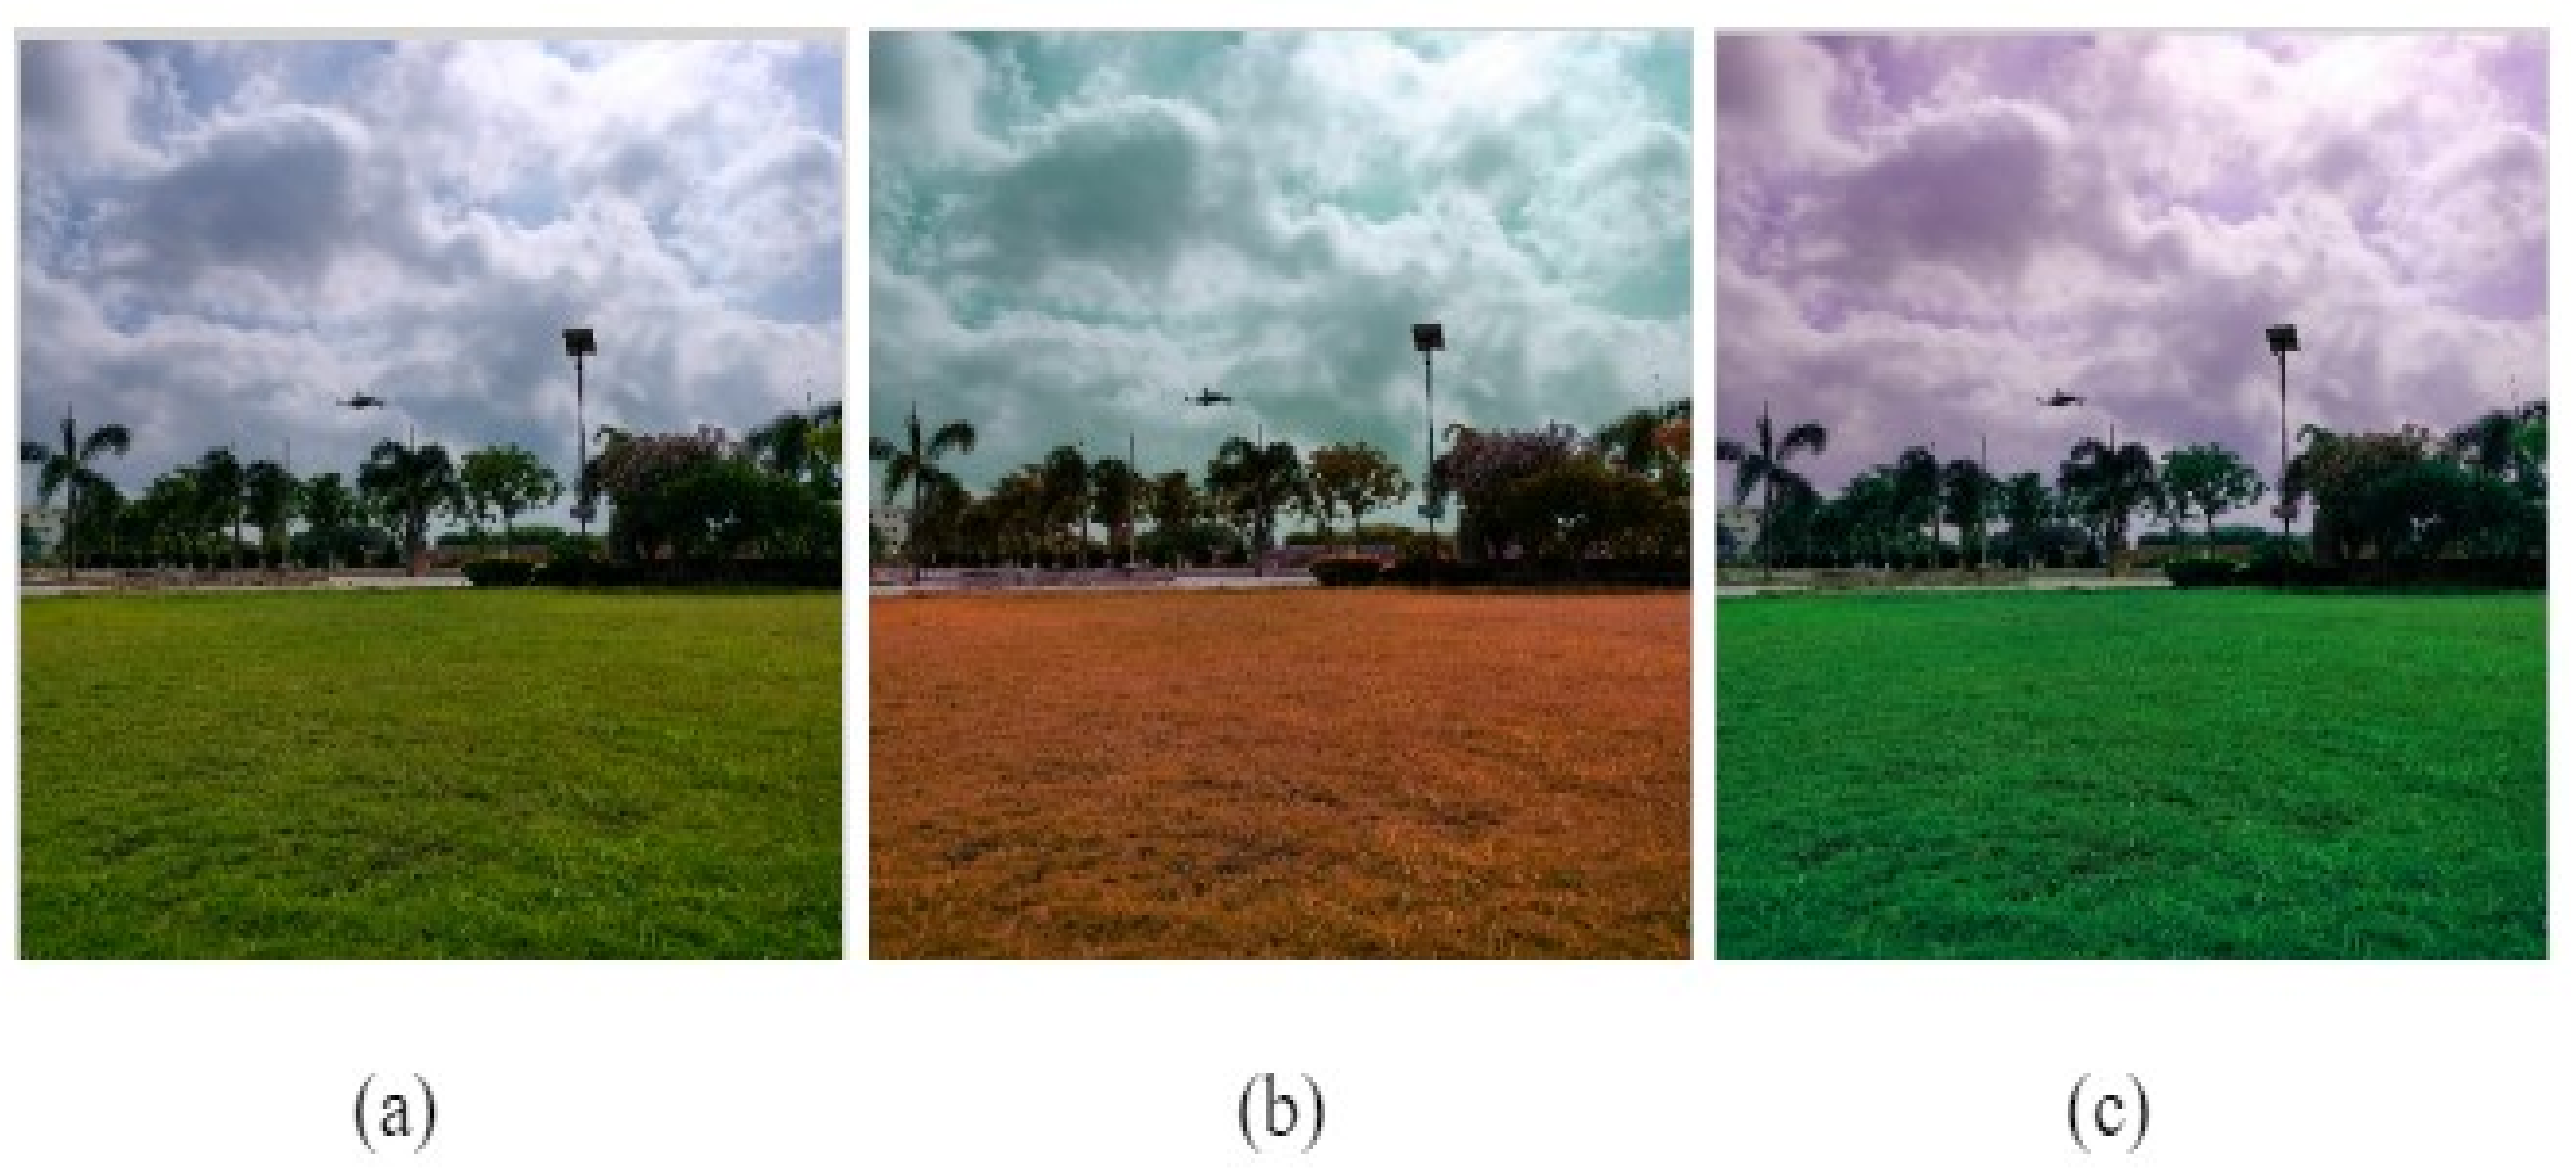
A model will take into account different color schemes for objects and scenes in input images as a result of hue augmentation, which randomly modifies the color channels of an input image. This method can help prevent a model from memorizing the colors of an object or scene. Hue augmentation enables a model to take into account both the edges and geometry of objects as well as their colors, even though output image colors may appear strange or even abnormal to human perception. A sample image from the dataset with hue augmentation applied is shown in Figure 2. Here, the degree of augmentation refers to the amount of random modification done on the image. Moreover, 0-degree augmentation refers to the original image, whereas 180 degrees/−180 degrees means that the image is negative. In this study, we prepared the dataset for 50 degrees and −50 degrees of hue augmentation, which means a slight altering of the colors of the image.

3.3.4. Edge Enhancement

Edge enhancement is the technique of sharpening edges in an image. Edges are curves across which there is a change in image brightness. Edge detection aims to construct an idealized line by enhancing the contrast between nearby areas of various tones. The edge enhancement filter was applied to the dataset through the Python Imaging Library (PIL). Figure 3 shows a sample image from the dataset when edge enhancement was applied to an image from the dataset.
The images taken through cameras were in RGB format. For testing the work of YOLOv5 and V7, all of the above-mentioned image preprocessing techniques were applied separately to train the models for drone detection and the results obtained by the same were compared.

4. Experimental Setup

In this study, for drone detection using images/frames, we performed image-based object detection using YOLOv5 and V7. Many different image preprocessing methods were applied before providing the images to the model for training and their respective results were compared. Here, images were taken in .jpg format; the labels are in .txt format.

4.1. Dataset

The dataset used in this study mainly consists of quadcopter images. Most of the images were taken from Kaggle [25]; others were self-captured using a smartphone camera. Self-captured images were taken by considering visual differences for range-wise (close, mid, and far) analysis. Only drones that were within these ranges were attempted to be photographed. The dataset consists of 1847 images; an 80:20 split was performed for training and validation/testing. Many image pre-processing techniques were also applied, such as gray scaling, hue augmentation, and edge enhancement. For instance, hue augmentation increased the training set to 4753 images by creating two new images for every single image. The dataset was tested with different models, including YOLOv5 and YOLOv7.
The labels used for training were in the following format: Label-ID, X-CENTER-NORM, Y-CENTER-NORM, WIDTH-NORM, HEIGHT-NORM, and were stored in text files. Label-ID is the index number in the classes.txt file, while X-CENTER-NORM and Y-CENTER-NORM are normalized values of the x and y coordinates of the bounding box centers. Similarly, WIDTH-NORM and HEIGHT-NORM refer to the respective width and height of the bounding boxes.

4.2. Parameters

The following parameters were used in the project for measuring and verifying the obtained accuracies of our trained models.
  • Precision—the ratio of positive instances that is correctly classified to the total number of positive instances.
  • Recall—calculated by dividing the positive examples in the test set by the number of correctly categorized positive examples.
  • Confidence score—tells us the classifier’s level of assurance and the likelihood that the box includes an object of interest; the confidence score would ideally be zero if there is no object in the box.
  • Intersection Over Union (IoU)—a ratio that indicates how much overlap occurs between two bounding boxes (Figure 4). The higher value of IoU signifies a closer match between the expected and actual bounding boxes.
  • IoU threshold—refers to the minimum IoU value between the actual and predicted bounding boxes for the prediction to be considered a true positive.
  • Average Precision(AP)—defined as the area under the PR curve (precision–recall curve). For example, AP50 refers to the average precision score when the IOU threshold is 50%.
  • MAP score—mAP or mean average precision is simply all of the AP values averaged in different classes/categories. Since there is only one class in our study (drone), AP and mAP are the same.

4.3. Working

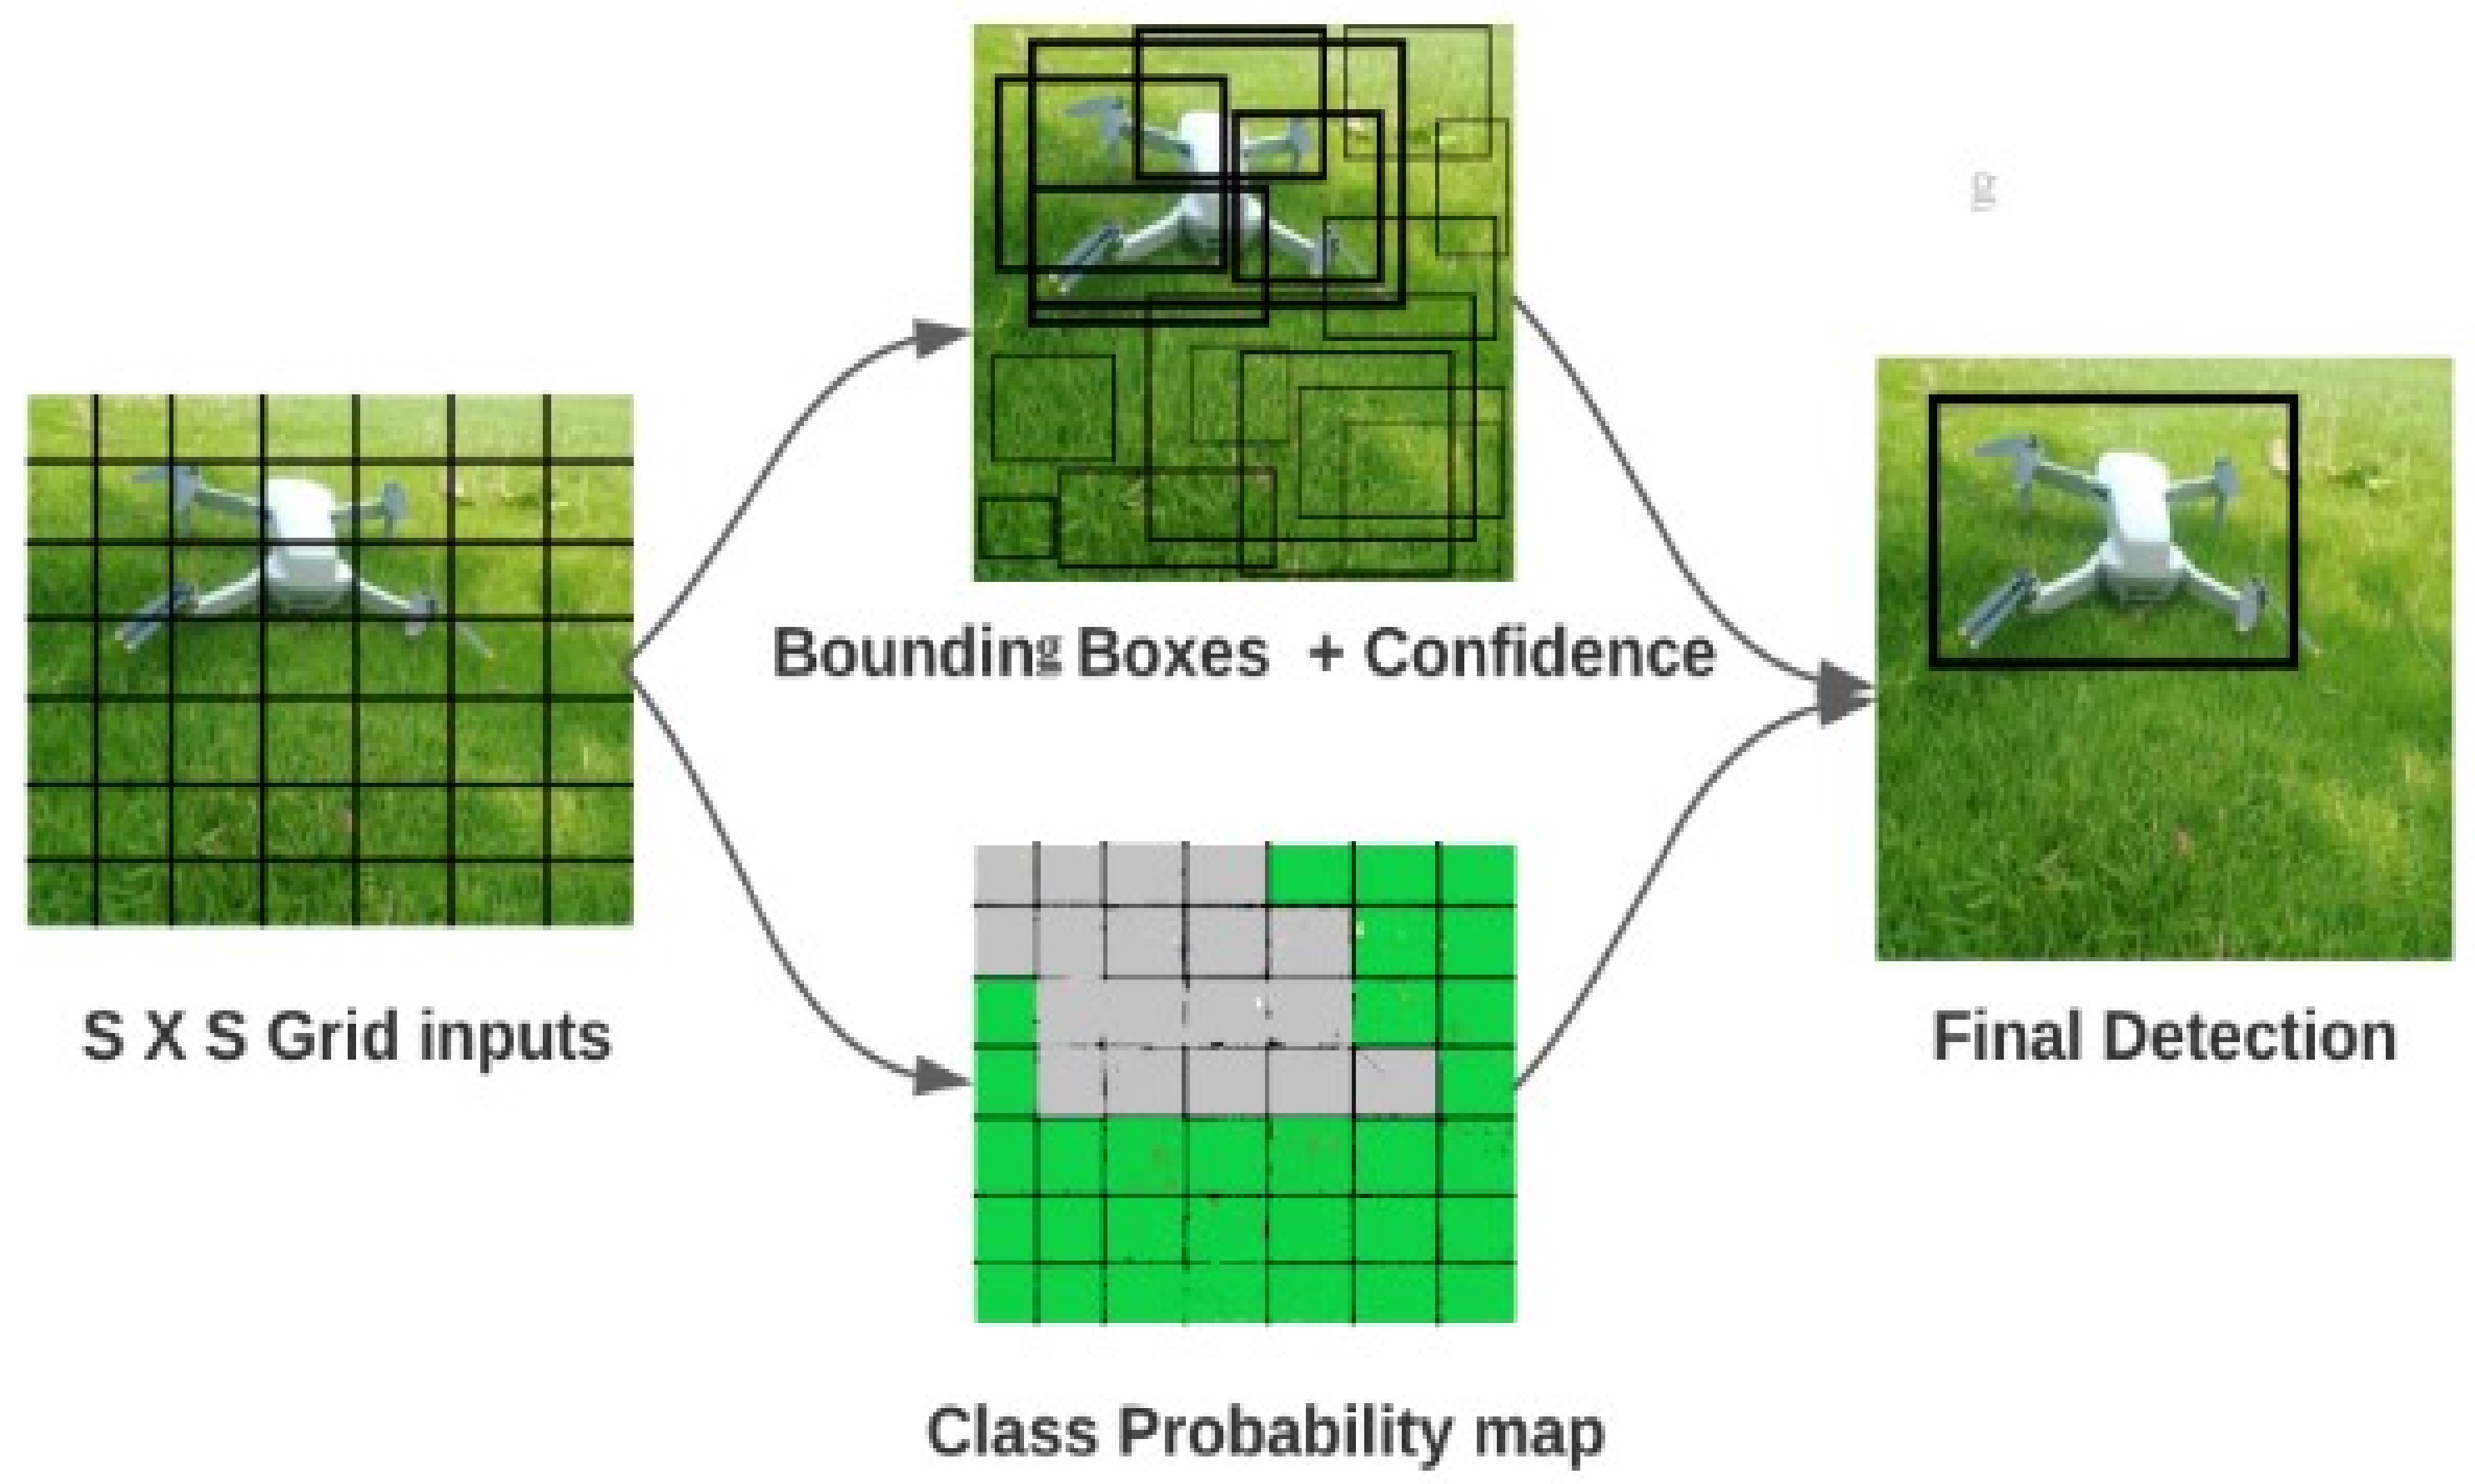
YOLO is a lightning-fast object detection method that improves detection performance right away while training on full images. Here, a single neural network predicts several bounding boxes and class probabilities/chances/possibilities of these boxes concurrently (Figure 5). YOLO cleaves the input image into an S × S grid. If the center of an object falls within/inside a grid cell, then that grid cell becomes accountable for detecting the object. Every grid cell anticipates/predicts the B bounding boxes and the confidence score for each box. The model’s level of confidence in the box’s object containment—and how accurately it thinks the box will be predicted—are shown by these confidence scores. Confidence is formally defined as Prob(Object) ∗ IOU. If there is no object in the cell, then the confidence score obtained should be 0. We require the confidence score to match the IoU score (intersection over union) between the predicted box and the actual data in the absence of it. Five predictions make up each bounding box: x, y, w, h, and the confidence score. Here, the (x,y) coordinates show where the center of the box is in reference to the grid cell’s edges. The height and width are forecasted in relation to the total frame or image. The confidence estimate, which is the final step, represents the IoU between any ground truth box and the projected box. For every grid cell, the conditional class probabilities, Prob(Class|Object) = P(Cl|Ob), are likewise projected. Depending on the grid cell in which an object is located, these probabilities change. Regardless of how many instances of the box there are, YOLO only predicts one set of class probabilities per grid cell.
P(Cl|Ob) ∗ P(Ob) ∗ IoU = P(Cl) ∗ IOU
We obtain class-particular confidence scores for every box by multiplying their conditional class probabilities with the individual box confidence forecasts during testing. These confidence scores encode the likelihood that the class is in the box as well as how well the anticipated box fits the object.
In this study, we performed UAV detection using YOLOv5 and V7 models after applying various image-preprocessing techniques. For both models, the results were measured at 150 epochs with batch sizes of 16 and a learning rate of 0.01 using the SGD optimizer. Detailed performance evaluations of both models in terms of true positive rate (sensitivity), precision, recall, intersection over union (IoU), and mean average precision (mAP) were also done in the proposed work. Based on the accuracies, both models were compared when applied to a different format of the image. The different formats of images we used in our models were RGB, grayscale, hue, and edge enhancement of two levels.
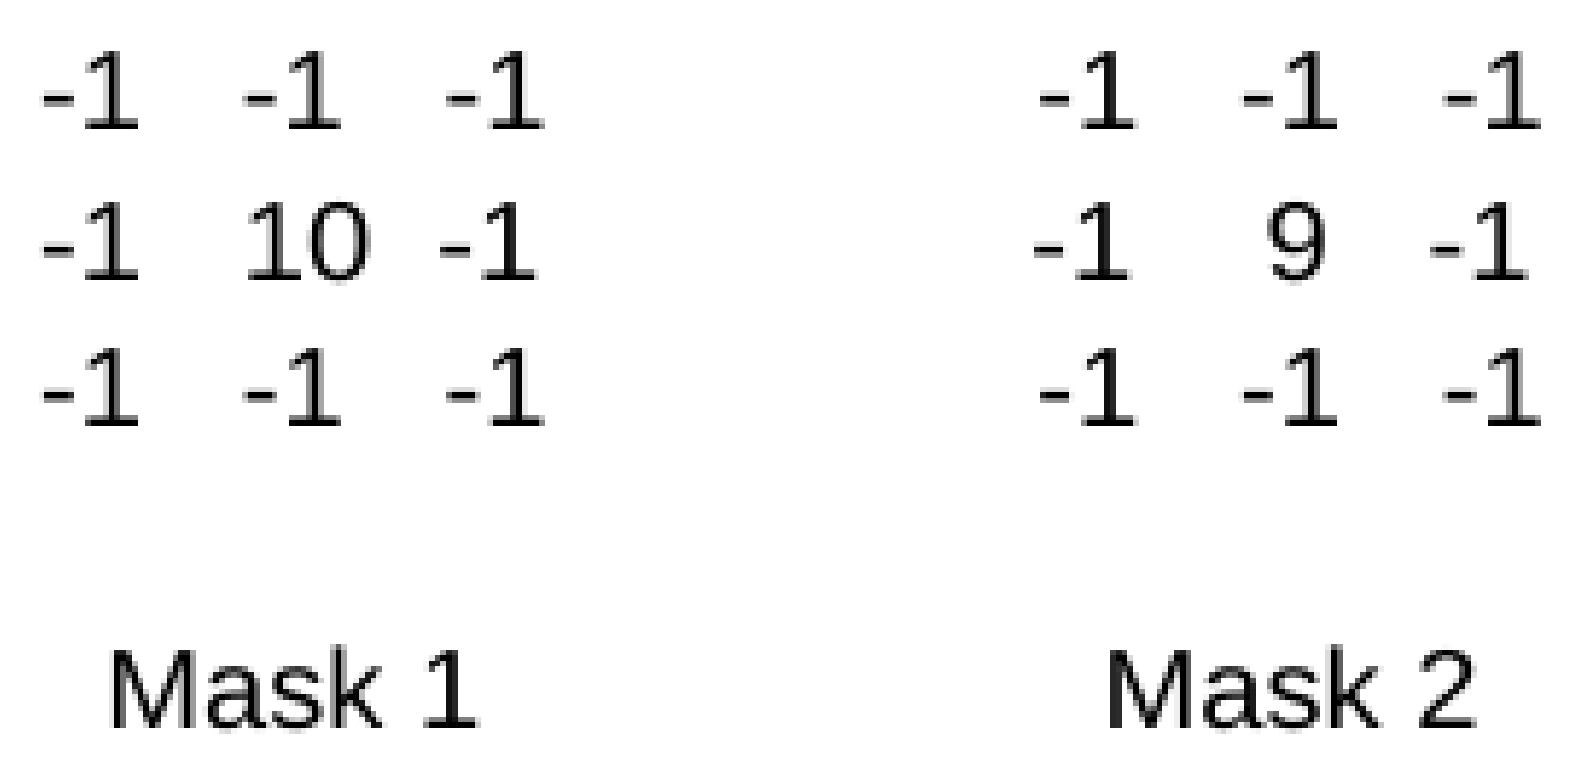
At first, both models were tested with images in RGB format. Then the detection accuracies were tested for the same dataset consisting of images in grayscale format. Then hue augmentation was applied as this technique is useful to ensure a model does not memorize a given object or the scene’s colors. Hue augmentation enables a model to take into account both the edges and geometry of objects as well as their colors, even though output image colors may appear strange or even abnormal to human perception. Then a 50 hue augmentation was applied to the images, randomly altering the color channels and increasing the training dataset size from 1476 images in the training set to 4428 images, as hue augmentation produces two new images for each image. After this, edge enhancement was applied to the original RGB image dataset using the Python Imaging Library (PIL). To increase the impression of sharpness in an image or video, the edge enhancement filter increases the edge contrast. This filter increases the contrast in the region immediately surrounding sharp fringes in the image, such as the boundary between a subject and a background of a contrasting color. Two levels of edge enhancement were applied, as well as their respective masks/filters (Figure 6).
After edge enhancement, it was observed that due to the enhancement of background lines and drone edges, the results were poor due to the presence of excess noise from background objects. After training, precision, recall, and MAP scores were calculated for each model for each image-augmented dataset format, as shown in Table 1. The smallest training time was observed for the grayscale image dataset. It was also observed that the training time of YOLOv7 was greater than YOLOv5.

5. Results and Explanation

After training and testing the YOLOv5 and YOLOv7 models for RGB, grayscale, hue-augmented, and edge-enhanced images, the following results were obtained.
When the accuracies of all formats were compared, the model YOLOv5 with the hue augmentation gave the highest accuracies. The precision value of the model was 95, the recall value was 95.6, and the MAP score of the model at an IoU threshold of 0.5 was 96.7, and with the IoU threshold in the range of 0.5:0.95, it was 61.4. Hence, with the comparison of the different models, the best output we obtained was from the YOLOv5 with hue augmentation, which is the highest accuracy among all other models.
YOLOv5 with the hue-augmented dataset gave the highest accuracy as the model was trained with the same images with slightly altered color channels. Using this method, the model learned to detect edges better rather than depend on the colors.
In the case of YOLOv7, the RGB dataset gave the highest accuracies; YOLOv7 employs more floating point operations (more computational) than YOLOv5, thus extracting more feature information from an RGB image than YOLOv5. The original RGB information provides a complete representation of the objects, including color, texture, shape, and brightness, which can be important for object detection. When using a preprocessed dataset, information may be lost or altered during the preprocessing step, affecting the accuracy of the detection result.
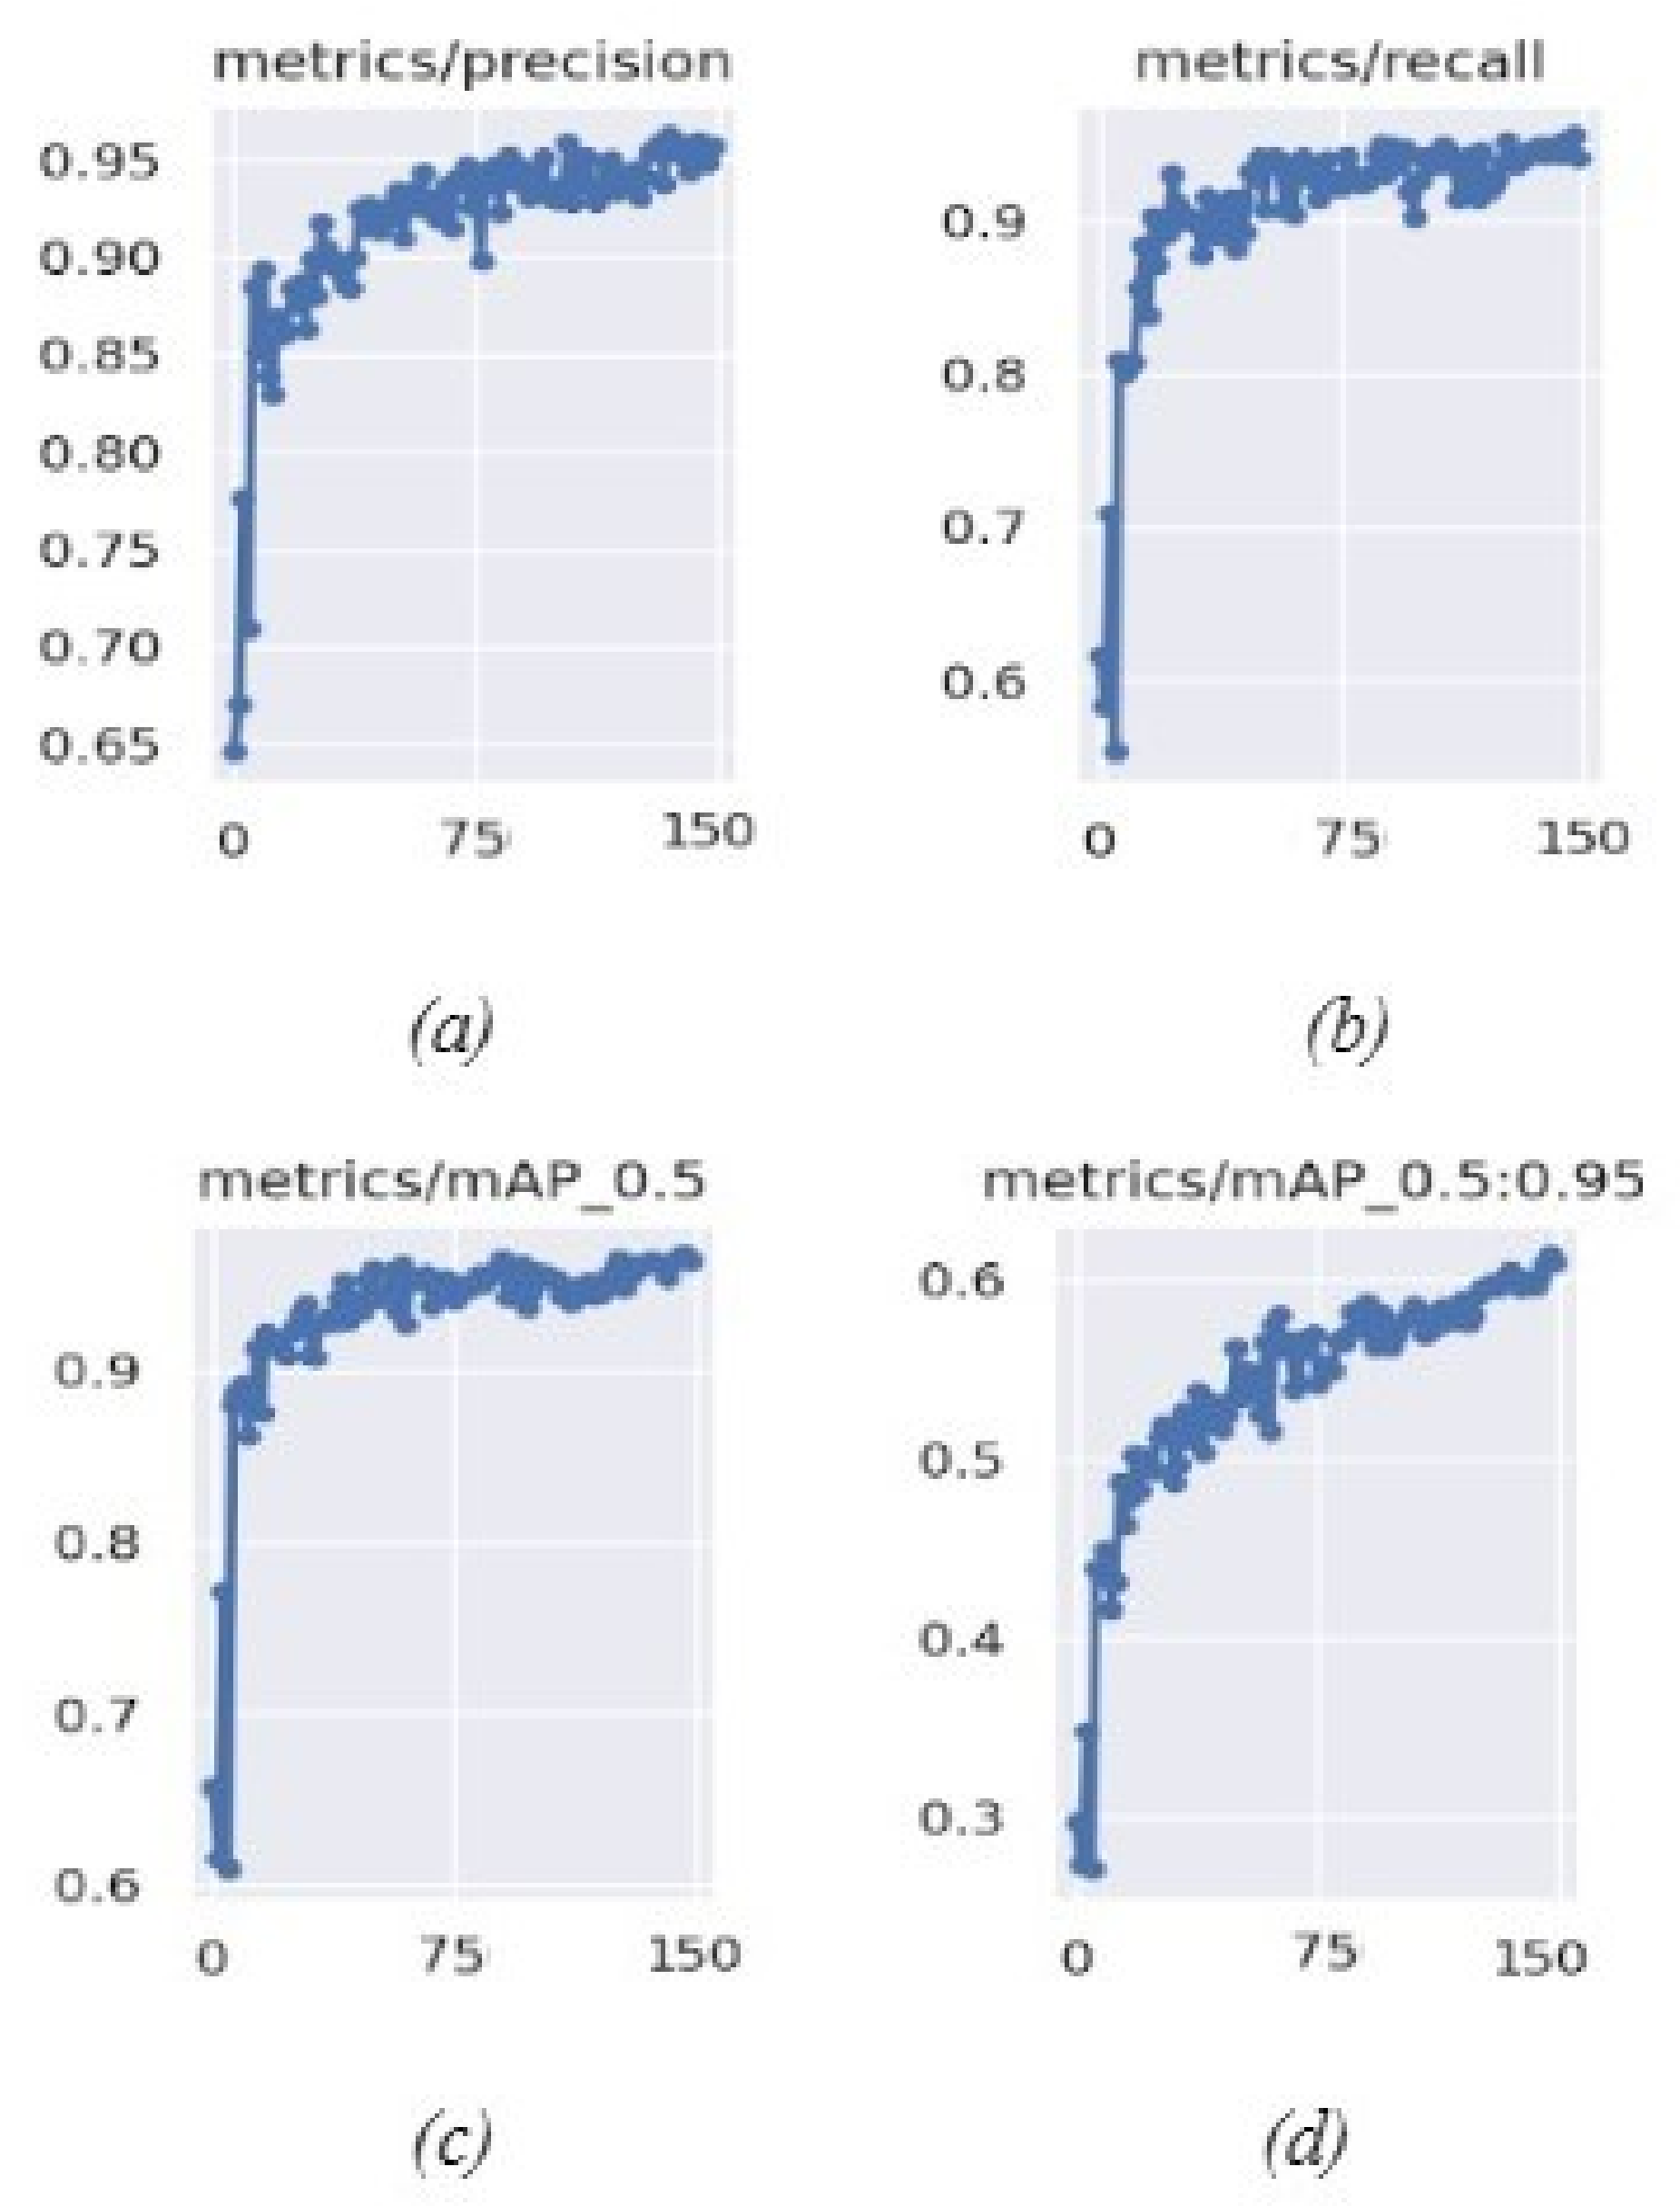
Since the YOLOv5 model with the hue-augmented dataset obtained the best results, its precision, recall and mAP scores vs epoch curves are given in Figure 7.
Figure 8, Figure 9, Figure 10, Figure 11, Figure 12 and Figure 13 show confidence scores measured for different images obtained for each model. The analysis was done in three different distance ranges—close, mid, and far. For every sample image, the output obtained for YOLOv5 and V7 models trained on different image-augmented datasets is shown.
Table 2 shows the results obtained for the distance-wise analysis of YOLOv5 and V7 models when the models were trained with the dataset processed with different image-preprocessing techniques, namely RGB images, gray scaling, hue augmentation, and edge enhancement.
For the close-range analysis, the distance of the drone is very close to the camera/aperture, around 3 to 6 feet or 1 to 2 m. Figure 8 shows a sample image taken from the dataset when the drone is in the air. For close range and a clear background (sky), the best results were obtained by the YOLOv5 model trained with the RGB dataset and the edge-enhanced dataset with mask-1—both obtained confidence scores of 83%. Similarly, we can see in Figure 9 that the highest confidence score was obtained by YOLOv5 with the hue-augmented dataset and edge enhancement mask-2 (89%) when the drone was in close range with a forest background. It can be observed that YOLOv5 gave good results even in a forest background when it was difficult to find the drone with the naked eye. Moreover, the YOLOv7 model gave poor results for the same, in most cases, as it failed to identify/locate the drone in most cases.
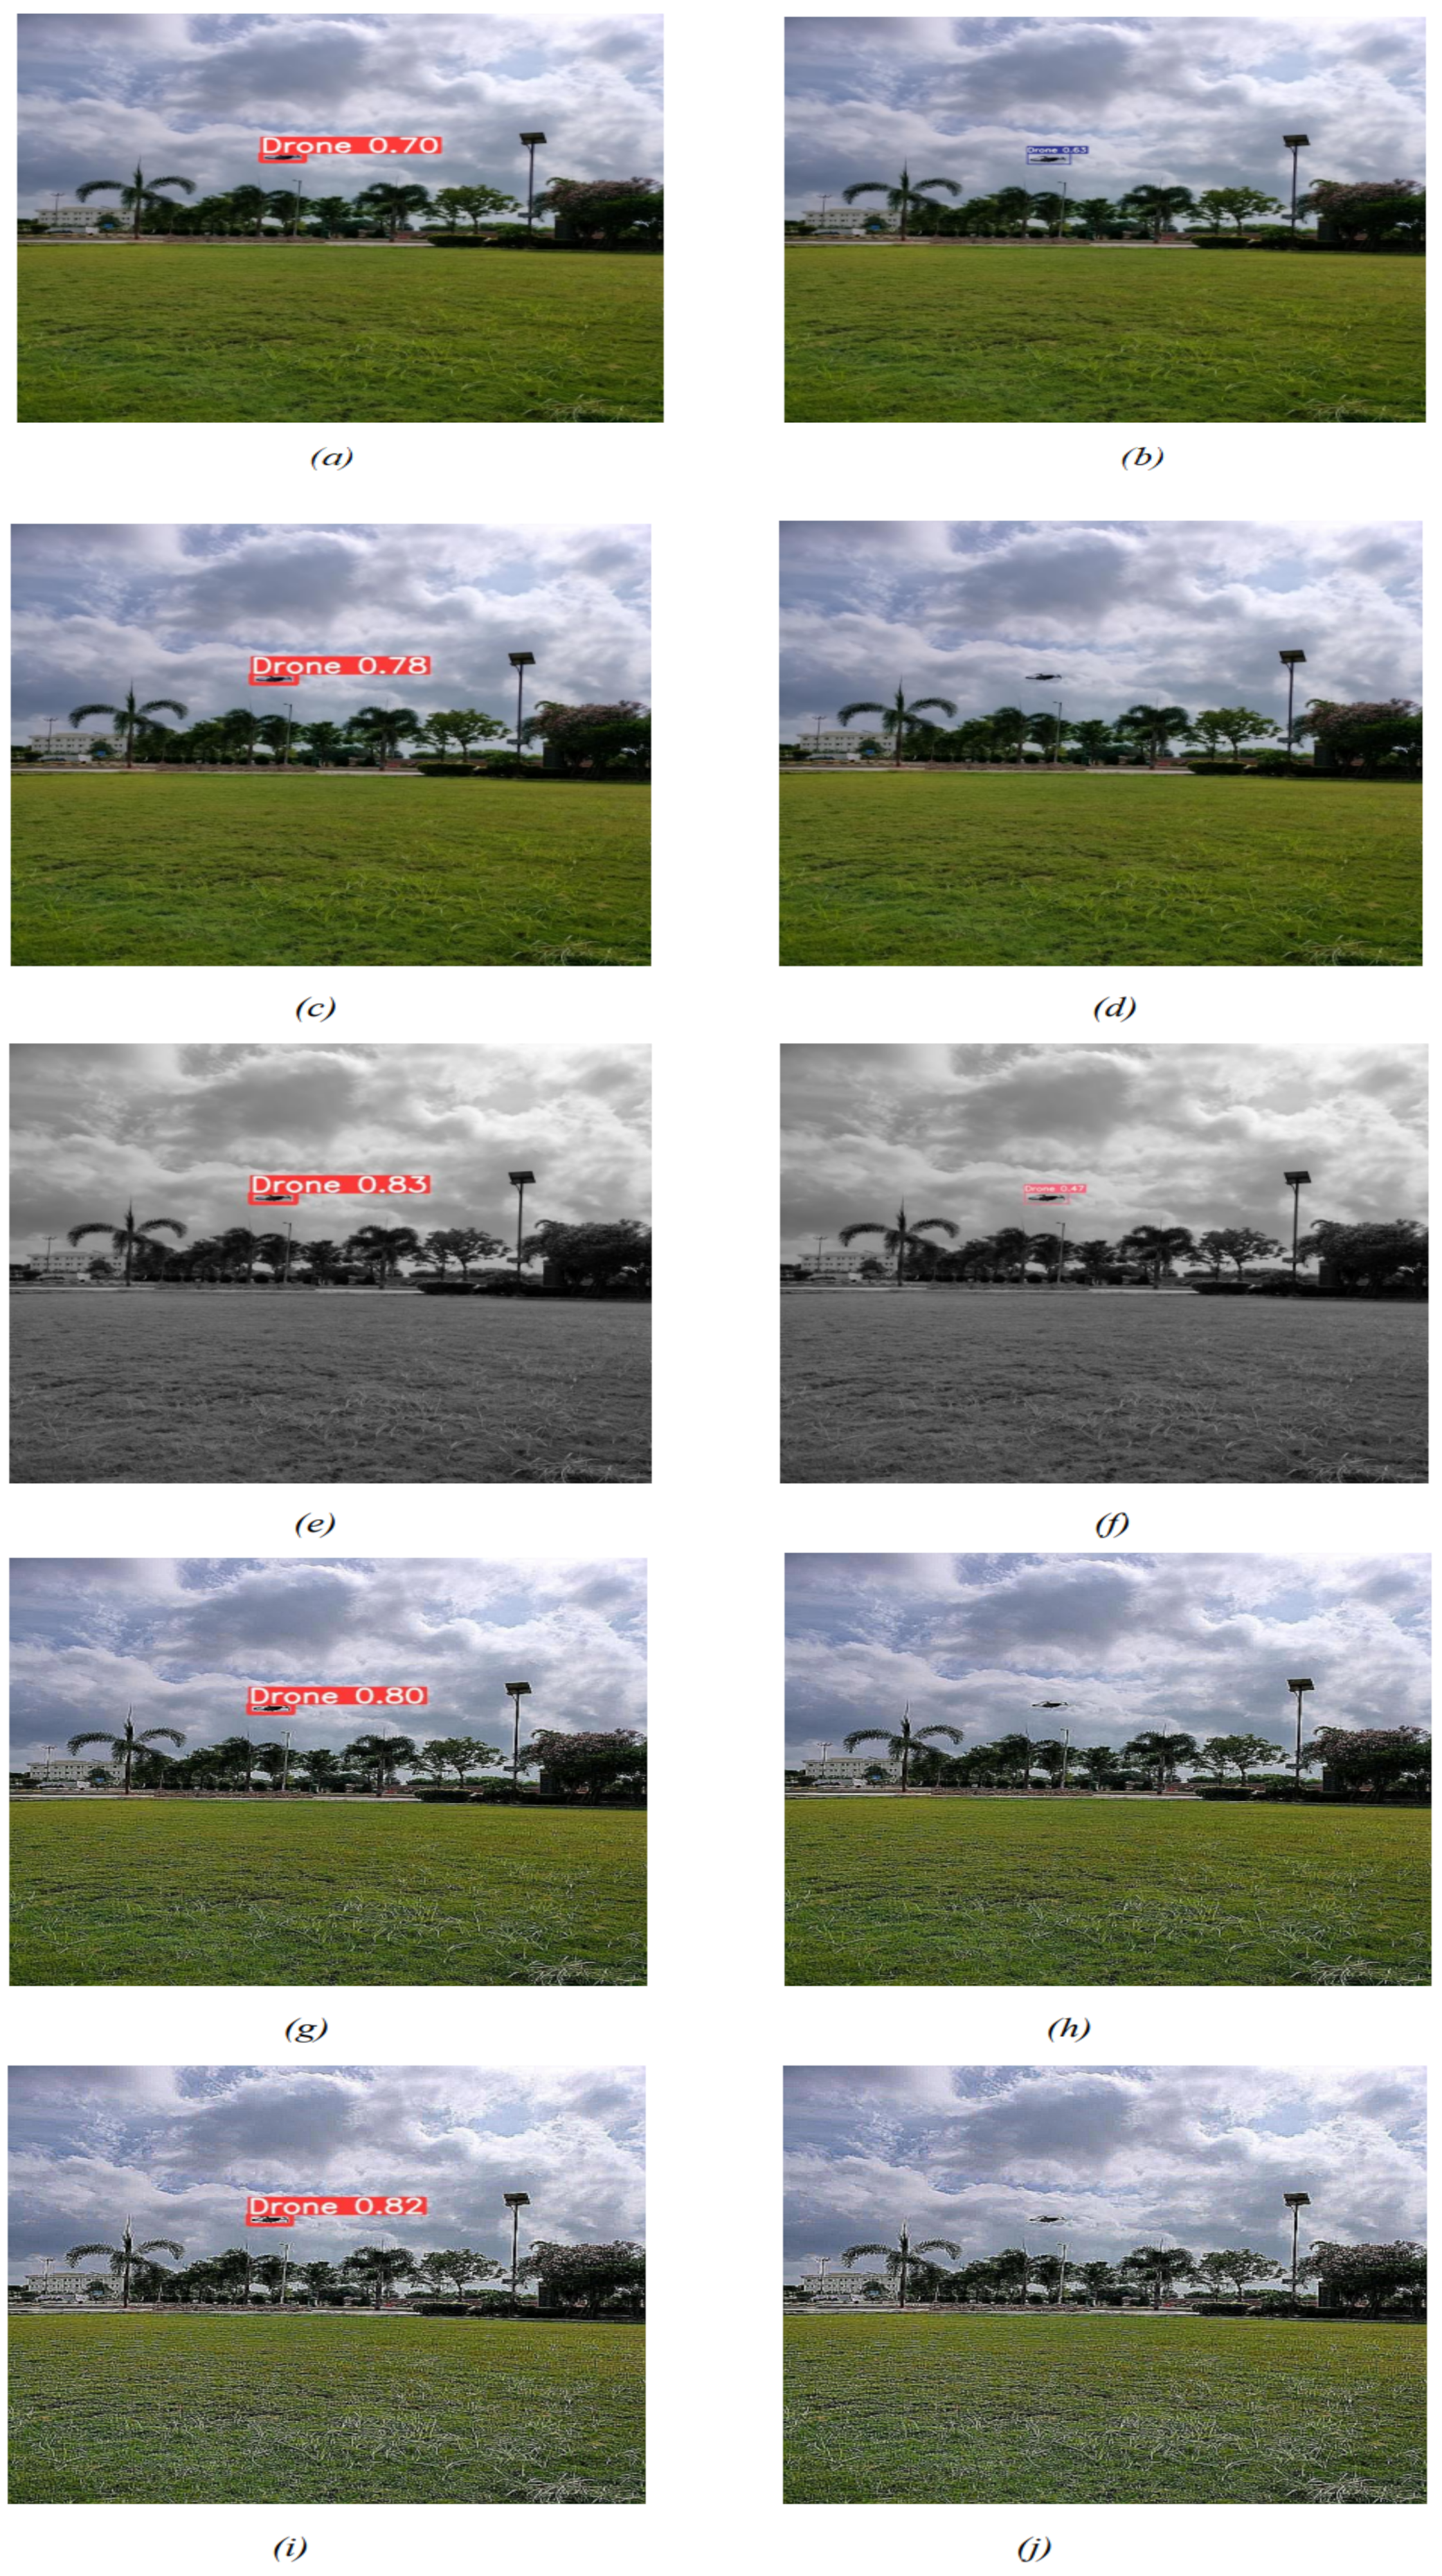
The mid-range analysis was performed by taking sample images from the dataset (test set) when the distance of the drone was around 20 to 25 feet/6 to 8 m. Figure 10 shows the image of the drone when it is in the air with the presence of some clouds. Under these circumstances, the best results were obtained by the YOLOv5 model trained on a grayscale dataset, obtaining a confidence score of 83%. The output confidence scores for YOLOv5 lie in the range of 63 to 88%, whereas for YOLOv7 they lie between 47 and 63%, although it failed to detect the drone in most cases. Similarly, we can see in Figure 11 that in the forest background (when it is hard to identify the drone with the naked eye), the highest confidence score was obtained by YOLOv5 with the edge-enhanced dataset, with mask-1 as 88%. Moreover, the YOLOv7 model gave poor results for the same in most cases as it failed to identify/locate the drone in most cases. The output confidence scores for YOLOv5 lie in the range of 63 to 88% whereas YOLOv7 failed to detect the drone in all cases. YOLOv7 even gave a false confidence score of 80% to a branch with an RGB image dataset. In some cases, the wrong identification of the drone was observed when the model falsely predicted other objects, such as branches of trees as drones.
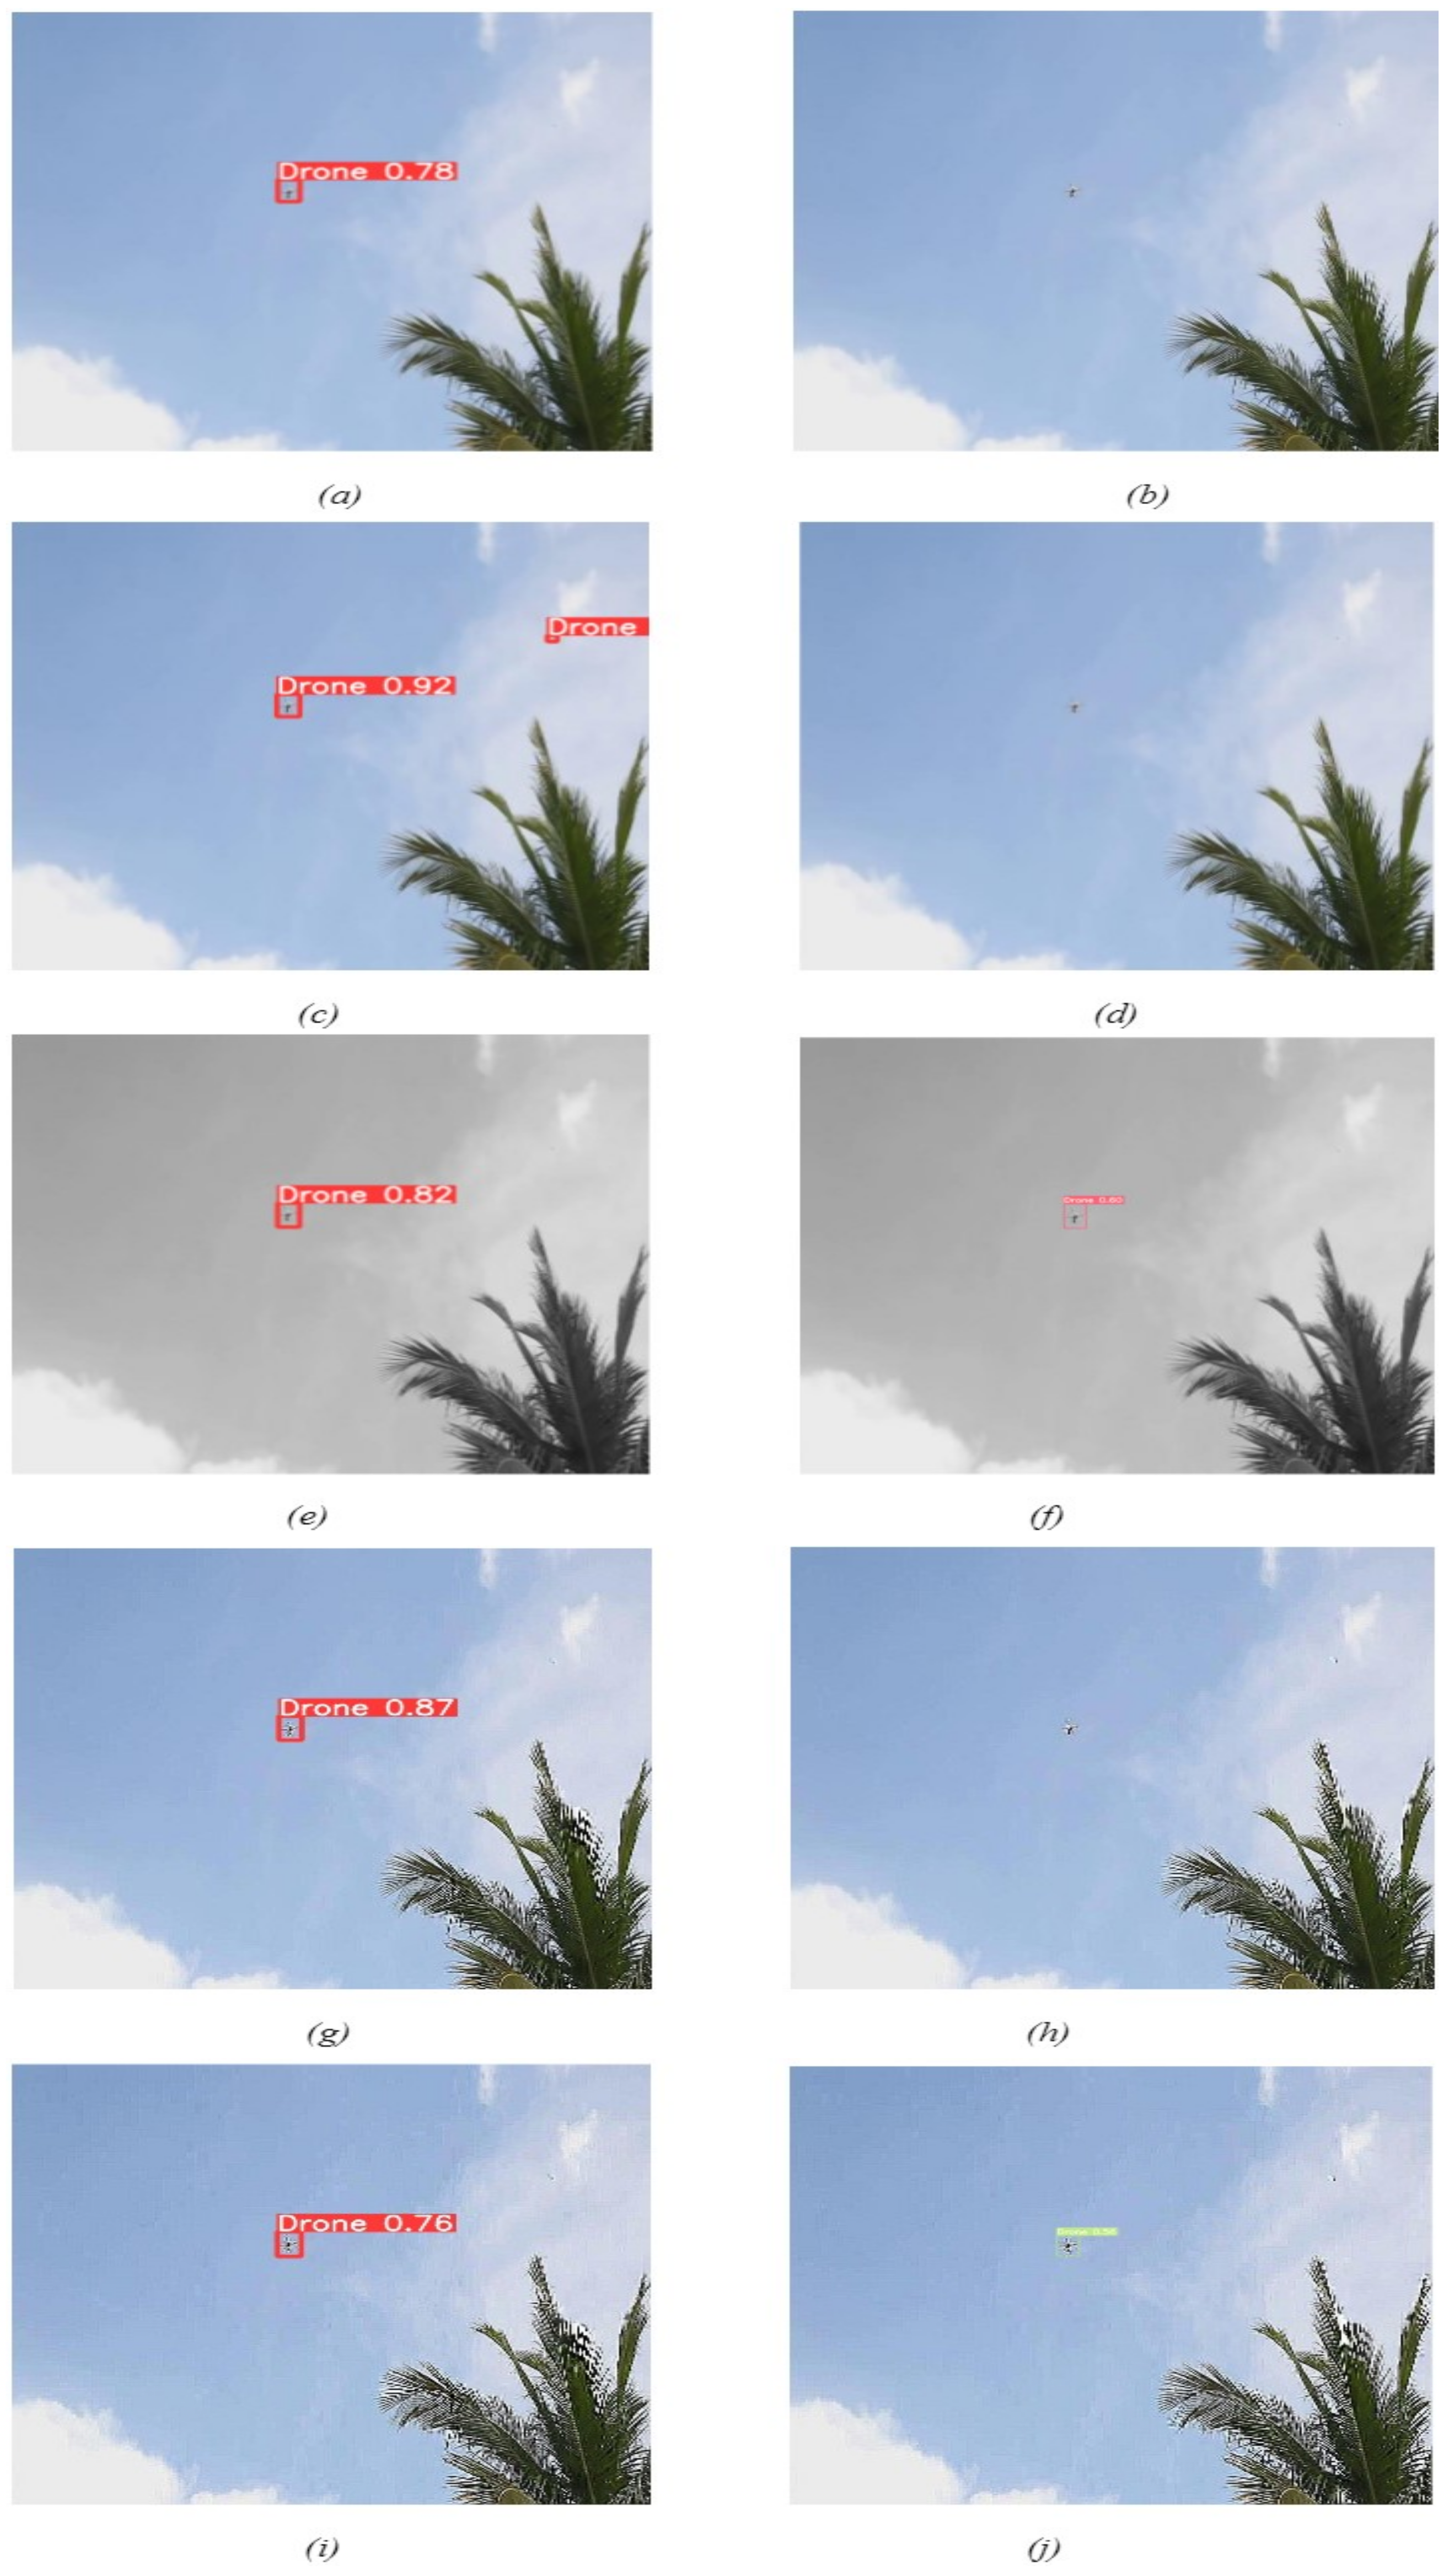
For the far-range analysis, all of the images with drones at a distance of more than 25 feet/8 m from the point of capture were taken as test samples from the dataset. These images were selected with the motive to test the performances of our models in various environments. Figure 12 demonstrates our model’s performance in a region with a clear sky with some trees around it. Under these circumstances, the best results were obtained by the YOLOv5 model trained on a grayscale dataset, obtaining a confidence score of 83%, followed by the YOLOv5 model trained on the hue-augmented dataset; overall, YOLOv5 gave a confidence score between 78% and 92% in all image preprocessing techniques used. On the other hand, the output confidence scores for YOLOv7 remained in the range of 56% to 79%, even though it failed to detect the drone in most cases. Similarly, Figure 13 shows the images of drones in a region surrounded by buildings and trees. Under such conditions, even though it is difficult to detect the drone with the naked eye, the best results were given by the YOLOv7 model trained with the hue-augmented dataset (with a confidence score of 90%) followed by the YOLOv5 model trained with grayscale images (with a confidence score of 84%); overall, YOLOv5 gave confidence scores between 37% and 90% in all image preprocessing methods used. On the other hand, confidence scores remained between 38% and 39% for YOLOv7 as most of the time it failed to detect the drone.
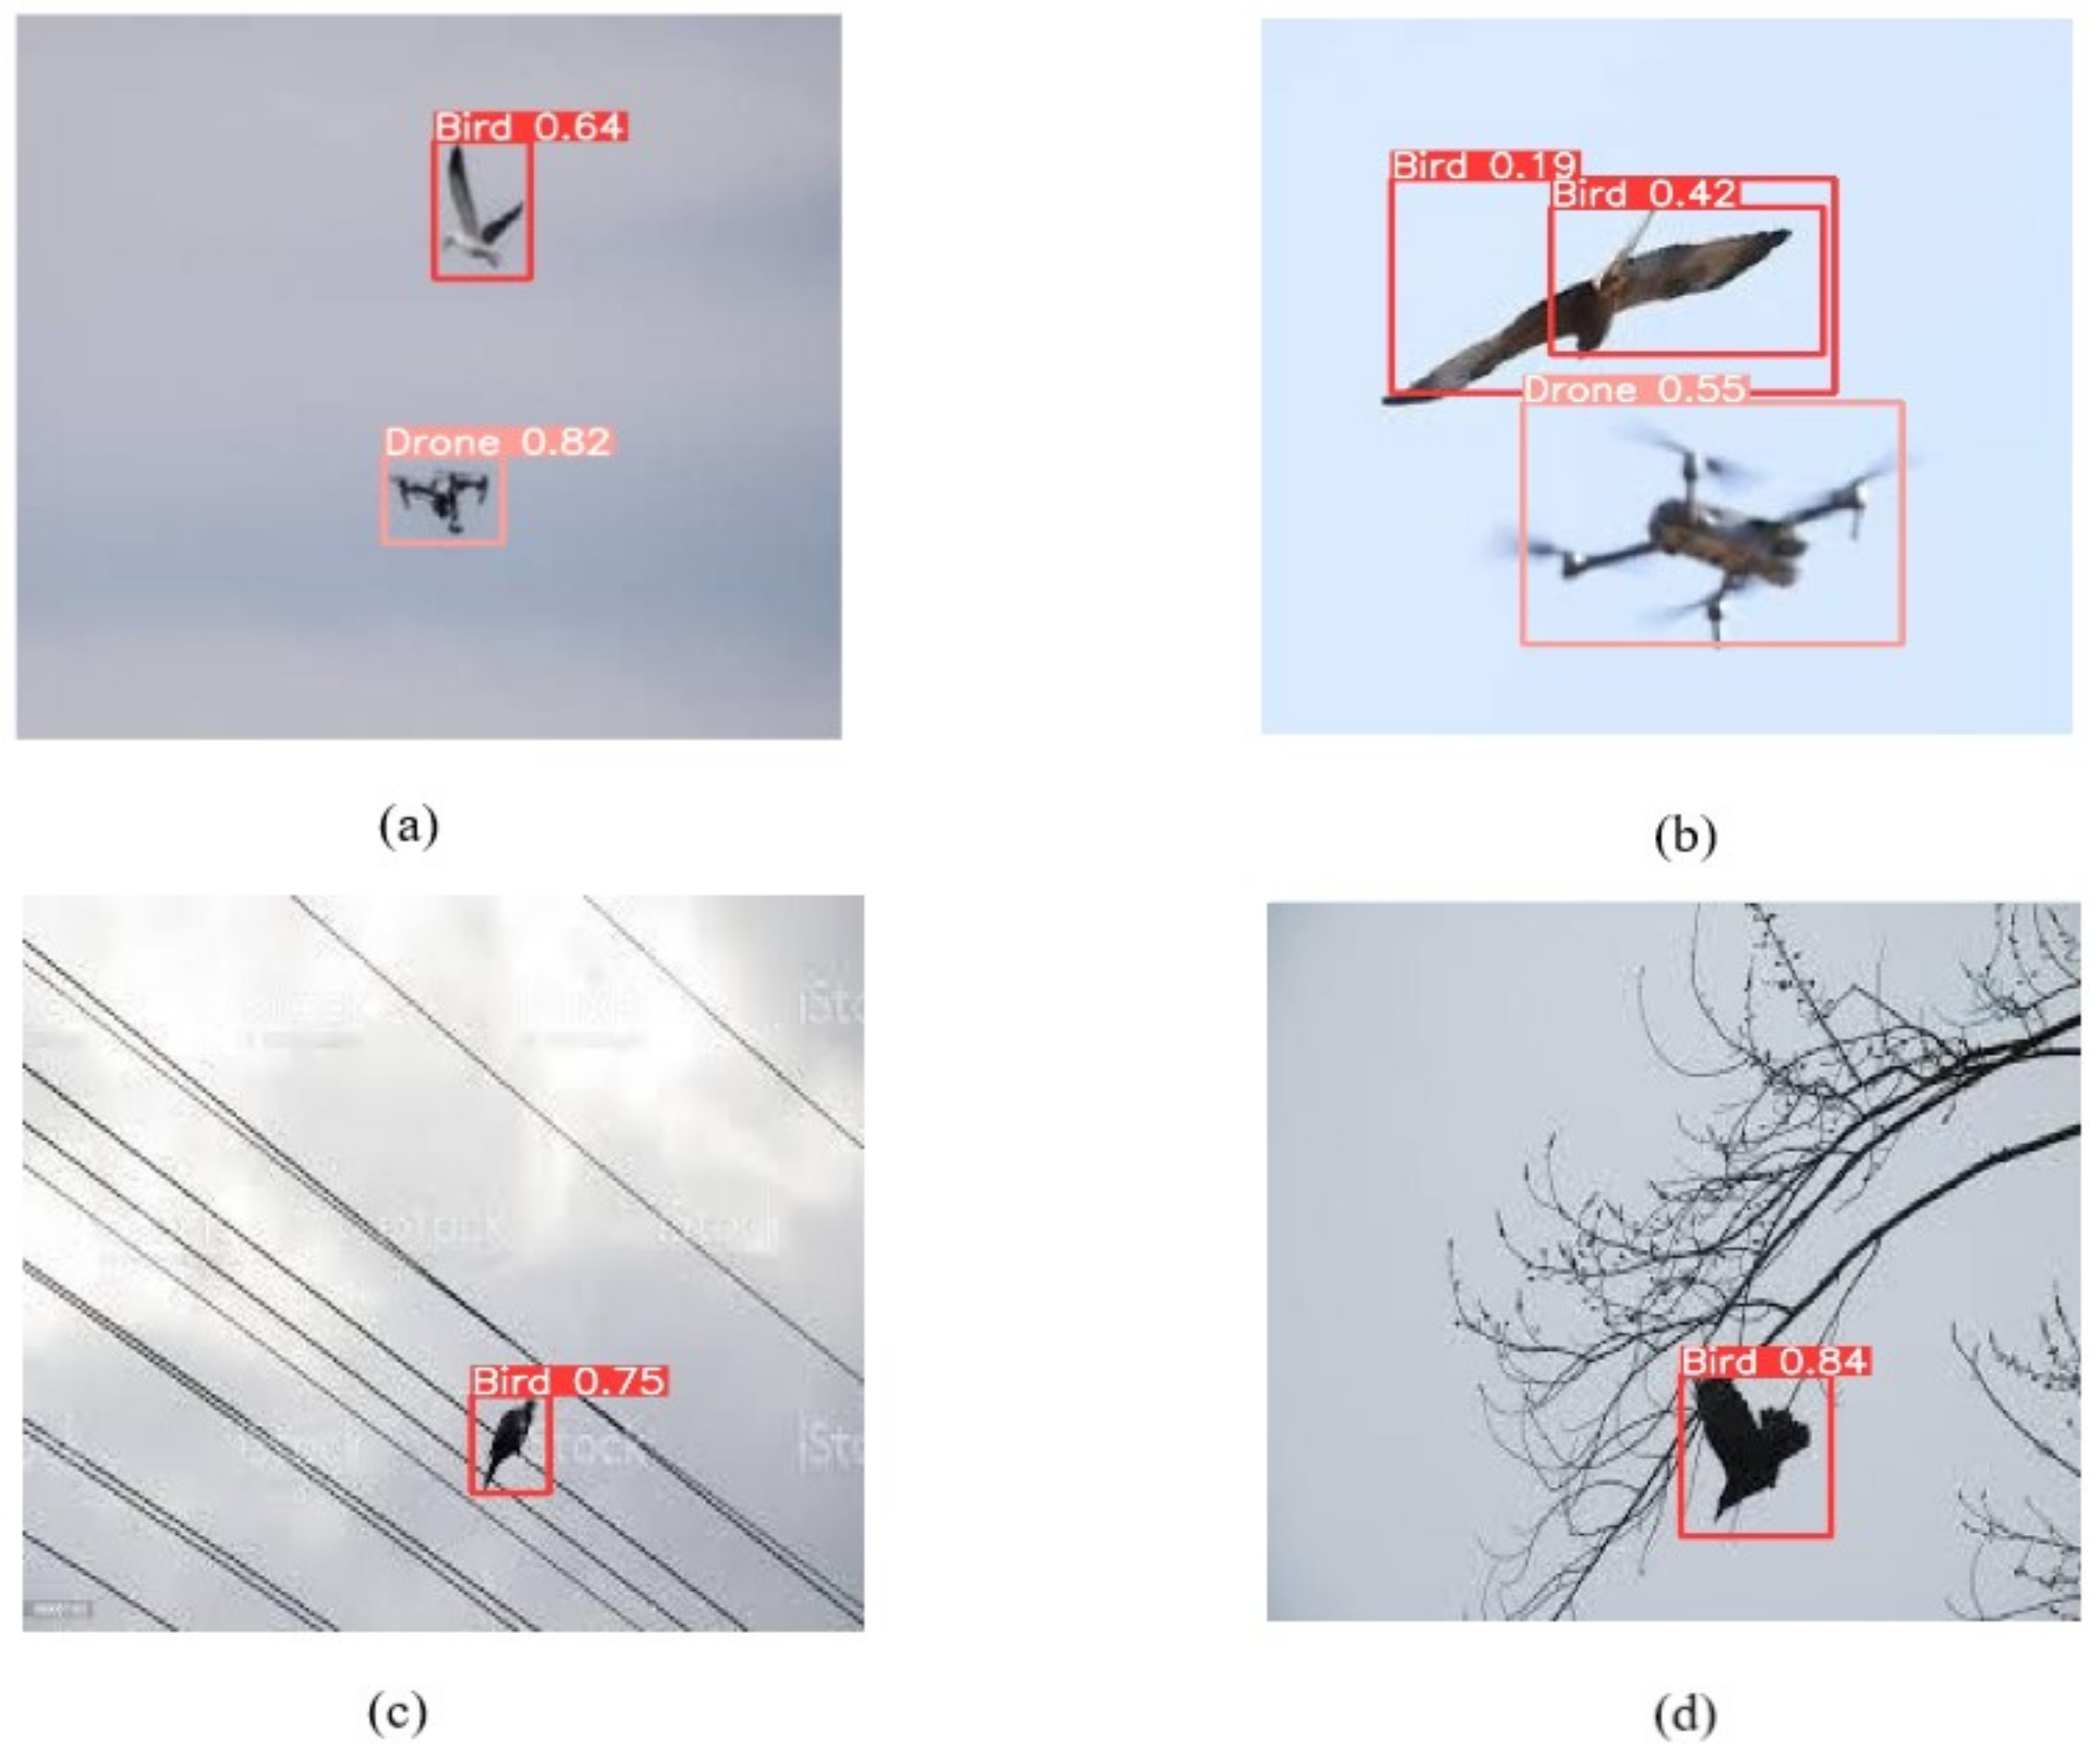
YOLOv5 with the hue-augmented dataset outperformed all other models with a mAP score of 96.7 and an IoU threshold value of 0.5. To further test this model’s recognition abilities in real-world scenarios, images consisting of birds and drones were used.
Figure 14 demonstrates that YOLOv5, when trained with the hue-augmented dataset, accurately identified and localized both drones and birds in every image. It can be inferred that this model not only outperforms other models in recognizing drones but also has the ability to distinguish between birds and drones, which is a very important requirement for a model to function effectively in the real world.

6. Conclusions

From the results obtained so far, we can infer that YOLOv5 is better than V7 in UAV detection, i.e., in terms of consistency of drone detection and obtaining higher confidence scores with very low numbers of false identifications. It can also be inferred that some image processing techniques have significantly improved the performance of the model. The mAP score obtained for YOLOv5 for hue augmentation was 96.7% [[email protected]], which was the highest among all of the comparisons (YOLOv5 and YOLOv7 models for different image augmentations, such as gray scaling, hue augmentation, and edge enhancement). From the distance-wise analysis for close, mid, and far ranges, it can be deduced that the YOLOv5 model rarely failed to identify the drone in close and mid ranges; moreover, it was able to differentiate birds from drones in these ranges, whereas it was hard to identify the drone at a far range, especially in different harsh backgrounds. The YOLOv7 model mostly failed to detect the drone in harsh backgrounds, irrespective of the distance. The confidence score for drone detection was observed to decrease steadily with distance, not considering special test cases. For clear backgrounds, the confidence scores for YOLOv5 were in the range of 75 to 92% in extreme cases, whereas it decreased to 45 to 80% in harsh backgrounds, such as forest backgrounds, as shown in the sample Figure 8 and Figure 10. One way to increase the detection accuracy in the case of forest background is to only alter the red and blue channels of the RGB image, which would enhance the objects other than the green background, making it easy for the model to detect different objects in forest terrain. On the contrary, if done in other backgrounds (e.g., the plane background), it could lead to poor performance of our model; therefore, to make the model perform more reliably in various terrains (and not just in one particular terrain, such as a forest), the alteration of red and blue channels cannot be incorporated. YOLOv7 produced results similar to YOLOv5 in close ranges for clear backgrounds. However, the results produced by the former were severely lower compared to the latter for larger distances or harsh backgrounds. The future scope of this study will include training the model for nighttime and other backgrounds/terrains (such as cities, mountains, etc.); we will conduct further work on different image pre-processing techniques or newer models.

Author Contributions

Conceptualization, V.D. and S.T.; methodology, R.T. and V.D.; software, V.D., A.S. and R.T.; validation, R.T., A.S. and V.D.; formal analysis, R.T.; investigation, V.D.; resources, V.D. and A.S.; data curation, A.S.; writing—original draft preparation, R.T., A.S. and V.D; writing—review and editing, V.D. and R.T.; visualization, A.S. and S.T.; supervision, S.T.; project administration, S.T.; All authors have read and agreed to the published version of the manuscript.

Funding

This research received no external funding.

Data Availability Statement

Conflicts of Interest

The authors declare no conflict of interest.

References

  1. Hassan, S.A.; Rahim, T.; Shin, S.Y. Real-time uav detection based on deep learning network. In Proceedings of the 2019 International Conference on Information and Communication Technology Convergence (ICTC), Jeju Island, Republic of Korea, 16–18 October 2019; pp. 630–632. [Google Scholar]
  2. Hu, Y.; Wu, X.; Zheng, G.; Liu, X. Object detection of UAV for anti-UAV based on improved YOLOv3. In Proceedings of the 2019 Chinese Control Conference (CCC), Guangzhou, China, 27–30 July 2019; pp. 8386–8390. [Google Scholar]
  3. Niu, R.; Qu, Y.; Wang, Z. UAV Detection Based on Improved YOLOv4 Object Detection Model. In Proceedings of the 2021 2nd International Conference on Big Data & Artificial Intelligence & Software Engineering (ICBASE), Zhuhai, China, 24–26 September 2021; pp. 25–29. [Google Scholar]
  4. Huang, Y.; Cui, H.; Ma, J.; Hao, Y. Research on an aerial object detection algorithm based on improved YOLOv5. In Proceedings of the 2022 3rd International Conference on Computer Vision, Image and Deep Learning & International Conference on Computer Engineering and Applications (CVIDL & ICCEA), Changchun, China, 20–22 May 2022; pp. 396–400. [Google Scholar]
  5. Cui, B.; Zhang, Y.; Li, J.; Liu, Z. Unmanned Aerial Vehicle (UAV) Object Detection in High-Resolution Image Based on Improved YOLOv5. In Proceedings of the CIBDA 2022—3rd International Conference on Computer Information and Big Data Applications, Chennai, India, 12–13 November 2022; pp. 1–4. [Google Scholar]
  6. Al-Qubaydhi, N.; Alenezi, A.; Alanazi, T.; Senyor, A.; Alanezi, N.; Alotaibi, B.; Alotaibi, M.; Razaque, A.; Abdelhamid, A.A.; Alotaibi, A. Detection of Unauthorized Unmanned Aerial Vehicles Using YOLOv5 and Transfer Learning. Electronics 2022, 11, 2669. [Google Scholar] [CrossRef]
  7. Aker, C.; Kalkan, S. Using deep networks for drone detection. In Proceedings of the 2017 14th IEEE International Conference on Advanced Video and Signal Based Surveillance (AVSS), Lecce, Italy, 29 August–1 September 2017; pp. 1–6. [Google Scholar]
  8. Nalamati, M.; Kapoor, A.; Saqib, M.; Sharma, N.; Blumenstein, M. Drone detection in long-range surveillance videos. In Proceedings of the 2019 16th IEEE International Conference on Advanced Video and Signal Based Surveillance (AVSS), Taipei, Taiwan, 18–21 September 2019; pp. 1–6. [Google Scholar]
  9. Liu, W.; Anguelov, D.; Erhan, D.; Szegedy, C.; Reed, S.; Fu, C.Y.; Berg, A.C. Ssd: Single shot multibox detector. In Proceedings of the European Conference on Computer Vision, Amsterdam, The Netherlands, 11–14 October 2016; pp. 21–37. [Google Scholar]
  10. Szegedy, C.; Vanhoucke, V.; Ioffe, S.; Shlens, J.; Wojna, Z. Rethinking the inception architecture for computer vision. In Proceedings of the Proceedings of the IEEE Conference on Computer Vision and Pattern Recognition, Las Vegas, NV, USA, 26 June–1 July 2016; pp. 2818–2826. [Google Scholar]
  11. He, K.; Zhang, X.; Ren, S.; Sun, J. Deep residual learning for image recognition. In Proceedings of the IEEE Conference on Computer Vision and Pattern Recognition, Las Vegas, NV, USA, 26 June–1 July 2016; pp. 770–778. [Google Scholar]
  12. Wang, C.; Tian, J.; Cao, J.; Wang, X. Deep Learning-Based UAV Detection in Pulse-Doppler Radar. IEEE Trans. Geosci. Remote. Sens. 2022, 60, 1–12. [Google Scholar] [CrossRef]
  13. Dadrass Javan, F.; Samadzadegan, F.; Gholamshahi, M.; Ashatari Mahini, F. A Modified YOLOv4 Deep Learning Network for Vision-Based UAV Recognition. Drones 2022, 6, 160. [Google Scholar] [CrossRef]
  14. Nie, W.; Han, Z.C.; Li, Y.; He, W.; Xie, L.B.; Yang, X.L.; Zhou, M. UAV Detection and Localization Based on Multi-Dimensional Signal Features. IEEE Sensors J. 2022, 22, 5150–5162. [Google Scholar] [CrossRef]
  15. Zheng, Y.; Chen, Z.; Lv, D.; Li, Z.; Lan, Z.; Zhao, S. Air-to-Air Visual Detection of Micro-UAVs: An Experimental Evaluation of Deep Learning. IEEE Robot. Autom. Lett. 2021, 6, 1020–1027. [Google Scholar] [CrossRef]
  16. Dong, Q.; Zou, Q. Visual UAV detection method with online feature classification. In Proceedings of the 2017 IEEE 2nd Information Technology, Networking, Electronic and Automation Control Conference (ITNEC), Chengdu, China, 15–17 December 2017; pp. 429–432. [Google Scholar] [CrossRef]
  17. Sun, P.; Ding, X. UAV image detection algorithm based on improved YOLOv5. In Proceedings of the 2022 IEEE 5th International Conference on Information Systems and Computer Aided Education (ICISCAE), Dalian, China, 23–25 September 2022; pp. 757–760. [Google Scholar] [CrossRef]
  18. Cheng, Q.; Wang, H.; Zhu, B.; Shi, Y.; Xie, B. A Real-Time UAV Target Detection Algorithm Based on Edge Computing. Drones 2023, 7, 95. [Google Scholar] [CrossRef]
  19. Aydin, B.; Singha, S. Drone Detection Using YOLOv5. Eng 2023, 4, 416–433. [Google Scholar] [CrossRef]
  20. Zhizhong, X.; Jingen, W.; Zhenghao, H.; Yuhui, S. Research on multi UAV target detection algorithm in the air based on improved CenterNet. In Proceedings of the 2020 International Conference on Big Data & Artificial Intelligence & Software Engineering (ICBASE), Bangkok, Thailand, 30 October–1 November 2020; pp. 367–372. [Google Scholar] [CrossRef]
  21. Lu, Z.; Yueping, P.; Zecong, Y.; Rongqi, J.; Tongtong, Z. Infrared Small UAV Target Detection Algorithm Based on Enhanced Adaptive Feature Pyramid Networks. IEEE Access 2022, 10, 115988–115995. [Google Scholar] [CrossRef]
  22. Huang, X.; Wang, Z.; Peng, Q.; Xu, H.; He, Z. LSS UAV target intelligent detection in urban complex environment. In Proceedings of the 2021 IEEE 3rd International Conference on Civil Aviation Safety and Information Technology (ICCASIT), Dali, China, 11–13 October 2021; pp. 648–650. [Google Scholar] [CrossRef]
  23. Ding, Y.; Qu, Y.; Zhang, Q.; Tong, J.; Yang, X.; Sun, J. Research on UAV Detection Technology of Gm-APD Lidar Based on YOLO Model. In Proceedings of the 2021 IEEE International Conference on Unmanned Systems (ICUS), Beijing, China, 15–17 October 2021; pp. 105–109. [Google Scholar] [CrossRef]
  24. Li, J.; Ye, D.H.; Kolsch, M.; Wachs, J.P.; Bouman, C.A. Fast and Robust UAV to UAV Detection and Tracking From Video. IEEE Trans. Emerg. Top. Comput. 2022, 10, 1519–1531. [Google Scholar] [CrossRef]
  25. Dataset Link. Available online: https://www.kaggle.com/datasets/dasmehdixtr/drone-dataset-uav (accessed on 20 December 2023).
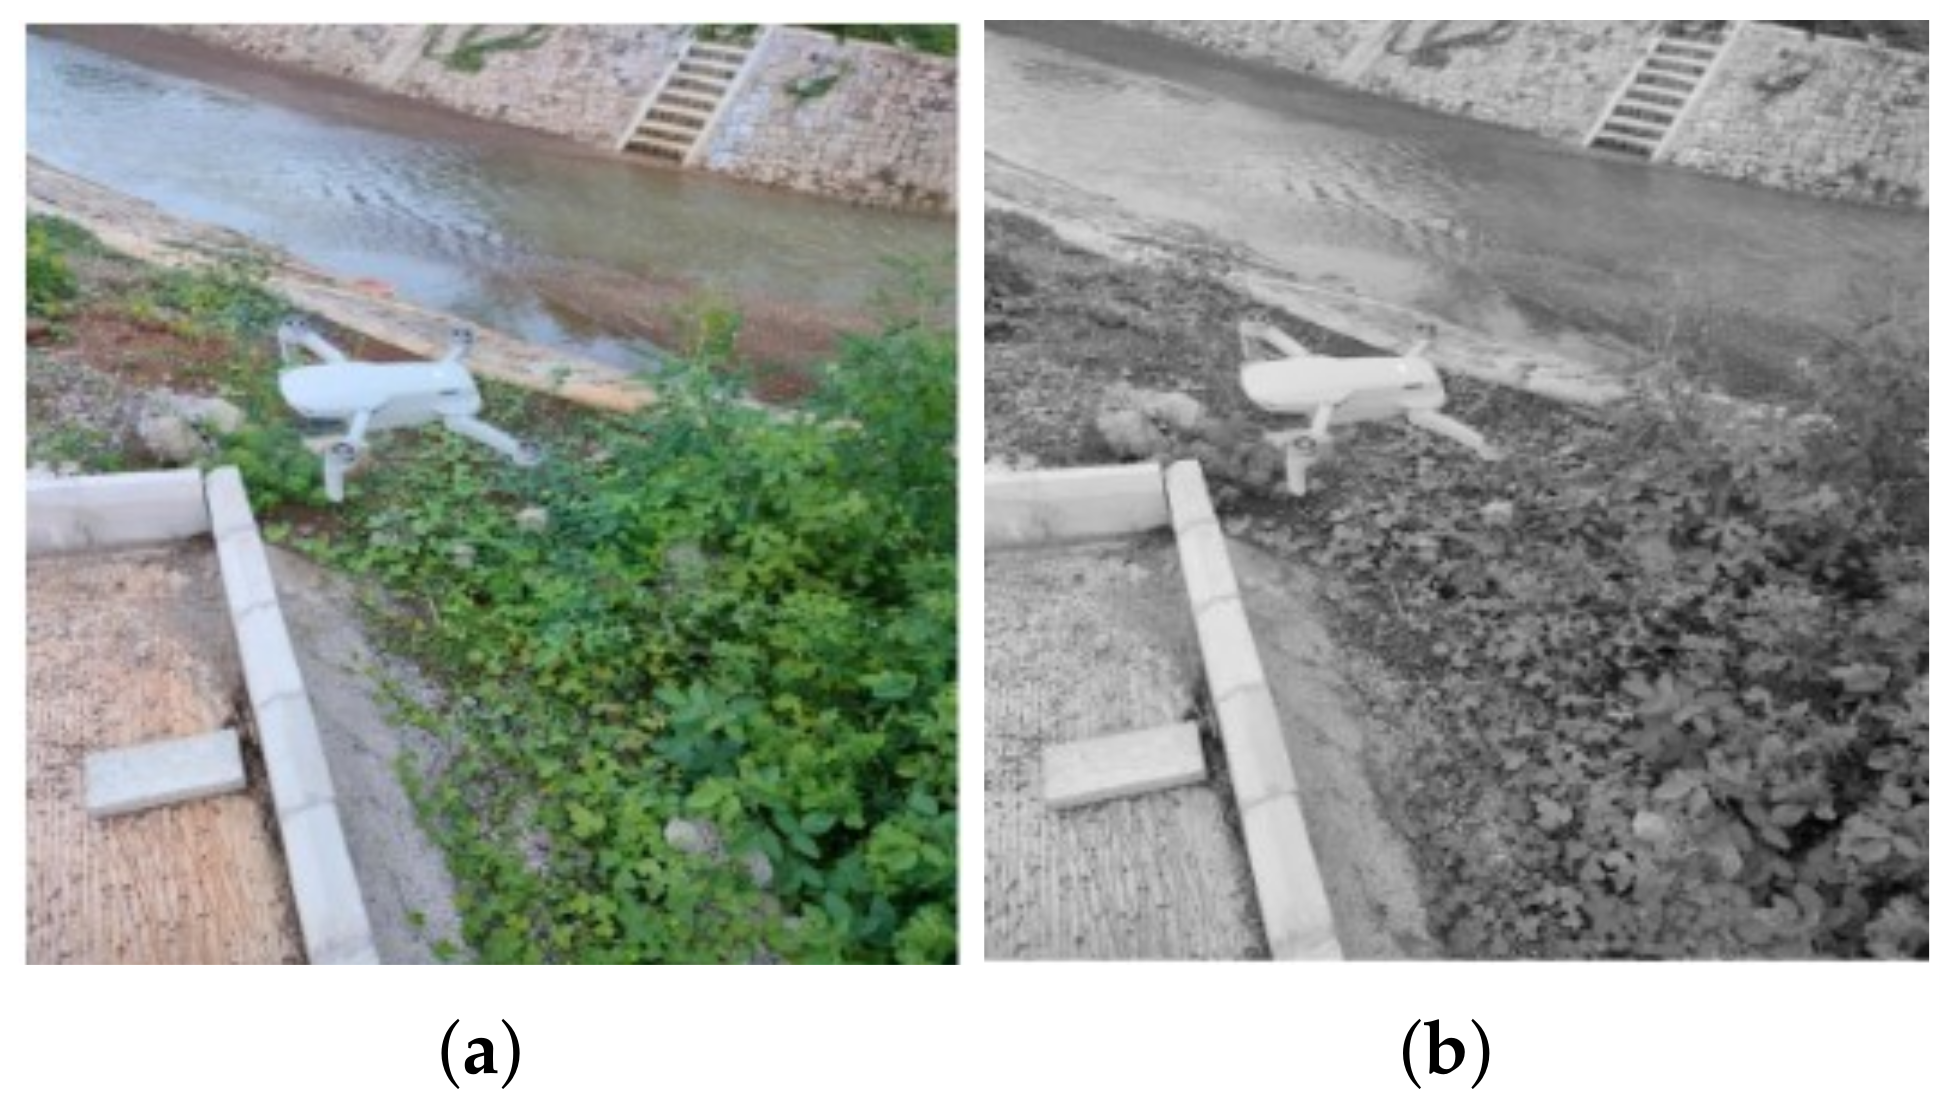
Figure 1. (a) Original RGB image; (b) grayscale image.
Drones 07 00174 g001
Figure 2. (a) original image; (b) hue-augmented image: −50 ; (c) hue-augmented image: +50 .
Drones 07 00174 g002
Figure 3. (a) Original image; (b) edge-enhanced image.
Drones 07 00174 g003
Figure 4. Intersection over union.
Drones 07 00174 g004
Figure 5. Workflow of YOLO models.
Drones 07 00174 g005
Figure 6. Edge enhancement filter masks.
Drones 07 00174 g006
Figure 7. YOLOv5 Hue augmentation validation curves; (a) precision vs. epoch curve; (b) recall vs. epoch curve; (c) mAP score at 0.5 IoU threshold vs. epoch curve; (d) mAP (0.5:0.95) vs. epoch curve.
Drones 07 00174 g007
Figure 8. Range: Close (3 to 6 feet/1 to 2 m). (a) RGB YOLOv5, confidence score = 0.83; (b) RGB YOLOv7, confidence score = 0.79; (c) hue YOLOv5, confidence score = 0.80; (d) hue YOLOv7, confidence score = 0.71; (e) grayscale YOLOv5, confidence score = 0.83; (f) grayscale YOLOv7, confidence score = 0.62; (g) edge enhancement mask −1 YOLOv5, confidence score = 0.83; (h) edge enhancement mask −1 YOLOv7, confidence score = 0.69; (i) edge enhancement mask −2 YOLOv5, confidence score = 0.79; (j) edge enhancement mask −2 YOLOV7, confidence score = 0.78.
Drones 07 00174 g008
Figure 9. Range: close (forest background). (a) RGB YOLOv5, confidence score = 0.80; (b) RGB YOLOv7, confidence score = 0.63; (c) hue YOLOv5, confidence score = 0.89; (d) hue YOLOv7, confidence score = NOT DETECTED; (e) grayscale YOLOv5, confidence score = 0.87; (f) grayscale YOLOv7, confidence score = NOT DETECTED; (g) edge enhancement mask −1 YOLOv5, confidence score = 0.87; (h) edge enhancement mask −1 YOLOv7, confidence score = NOT DETECTED; (i) edge enhancement mask −2 YOLOv5, confidence score = 0.89; (j) edge enhancement mask −2 YOLOV7, confidence score = NOT DETECTED.
Drones 07 00174 g009
Figure 10. Range: Mid (20 to 25 feet/6 to 8 m). (a) RGB YOLOv5, confidence score = 0.70; (b) RGB YOLOv7, confidence score = 0.63; (c) hue YOLOv5, confidence score = 0.78; (d) hue YOLOv7, confidence score = NOT DETECTED; (e) grayscale YOLOv5, confidence score = 0.83; (f) grayscale YOLOv7, confidence score = 0.47; (g) edge enhancement mask −1 YOLOv5, confidence score = 0.80; (h) edge enhancement mask −1 YOLOv7, confidence score = NOT DETECTED; (i) edge enhancement mask −2 YOLOv5, confidence score = 0.82; (j) edge enhancement mask −2 YOLOV7, confidence score = NOT DETECTED.
Drones 07 00174 g010
Figure 11. Range: Mid (Forest background). (a) RGB YOLOv5, confidence score = 0.84; (b) RGB YOLOv7, confidence score = NOT DETECTED; (c) hue YOLOv5, confidence score = 0.87; (d) hue YOLOv7, confidence score = NOT DETECTED; (e) grayscale YOLOv5, confidence score = 0.63; (f) grayscale YOLOv7, confidence score = NOT DETECTED; (g) edge enhancement mask −1 YOLOv5, confidence score = 0.88; (h) edge enhancement mask −1 YOLOv7, confidence score = NOT DETECTED; (i) edge enhancement mask −2 YOLOv5, confidence score = 0.69; (j) edge enhancement mask −2 YOLOv7, confidence score = NOT DETECTED.
Drones 07 00174 g011
Figure 12. Range: Far (Greater than 25 feet/8 m). (a) RGB YOLOv5, confidence score = 0.78; (b) RGB YOLOv7, confidence score = 0.79; (c) hue YOLOv5, confidence score = 0.82; (d) hue YOLOv7, confidence score = NOT DETECTED; (e) grayscale YOLOv5, confidence score = 0.92; (f) grayscale YOLOv7, confidence score = 0.60; (g) edge enhancement mask −1 YOLOv5, confidence score = 0.87; (h) edge enhancement mask −1 YOLOv7, confidence score = NOT DETECTED; (i) edge enhancement mask −2 YOLOv5, confidence score = 0.76; (j) edge enhancement mask −2 YOLOV7, confidence score = 0.56.
Drones 07 00174 g012
Figure 13. Range: Far. (a) RGB YOLOv5, confidence score = 0.37; (b) RGB YOLOv7, confidence score = NOT DETECTED; (c) hue YOLOv5, confidence score = 0.90; (d) hue YOLOv7, confidence score = NOT DETECTED; (e) grayscale YOLOv5, confidence score = 0.84; (f) grayscale YOLOv7, confidence score = 0.38; (g) edge enhancement mask −1 YOLOv5, confidence score = 0.69; (h) edge enhancement mask −1 YOLOv7, confidence score = NOT DETECTED; (i) edge enhancement mask −2 YOLOv5, confidence score = 0.60; (j) edge enhancement mask −2 YOLOV7, confidence score = 0.39.
Drones 07 00174 g013
Figure 14. Analysis of the hue-augmented YOLOv5 model’s capacity to distinguish between drones and birds: (a) hue YOLOv5 confidence score (bird) = 0.64, confidence score (drone) = 0.82; (b) hue YOLOv5 confidence score (bird) = 0.42, confidence score (drone) = 0.55; (c) hue YOLOv5 confidence score (bird) = 0.75; (d) hue YOLOv5 confidence score (bird) = 0.84.
Drones 07 00174 g014
Table 1. Model scores with different image augmentation techniques.
ModelImage AugmentationPrecisionRecallmAP Score
IoU Threshold
0.50.5:0.95
YOLOv5RGB93.192.795.758.3
Grayscale93.793.796.458.2
Hue95.095.696.761.4
Edge Enhancement Mask-194.491.194.958.5
Edge Enhancement Mask-194.289.194.760.1
YOLOv7RGB91.591.193.654.6
Grayscale82.877.483.544.7
Hue85.685.688.146.1
Edge Enhancement Mask-187.178.284.940
Edge Enhancement Mask-290.675.38742.39
Table 2. Confidence scores for the distance-wise analysis. ND: Not detected; EE mask-1: edge enhancement mask-1; EE mask-2: edge enhancement mask-2.
Sr No.ModelsImage
Pre-Processing
CloseMidFar
Figure no.
1.YOLOv5
(Confidence Scores)
8910111213
RGB0.830.800.700.840.780.37
Hue0.800.890.780.870.820.90
Grayscale0.830.870.830.630.920.84
EE mask-10.830.870.800.880.870.69
EE mask-20.790.890.820.690.760.60
2.YOLOv7
(Confidence Scores)
RGB0.790.630.63ND0.79ND
Hue0.71NDNDNDNDND
Grayscale0.62ND0.47ND0.600.38
EE mask-10.69NDNDNDNDND
EE mask-20.78NDNDND0.560.39
Disclaimer/Publisher’s Note: The statements, opinions and data contained in all publications are solely those of the individual author(s) and contributor(s) and not of MDPI and/or the editor(s). MDPI and/or the editor(s) disclaim responsibility for any injury to people or property resulting from any ideas, methods, instructions or products referred to in the content.