


Tree Branch Skeleton Extraction from Drone-Based Photogrammetric Point Cloud


Abstract
1. Introduction
- (1)
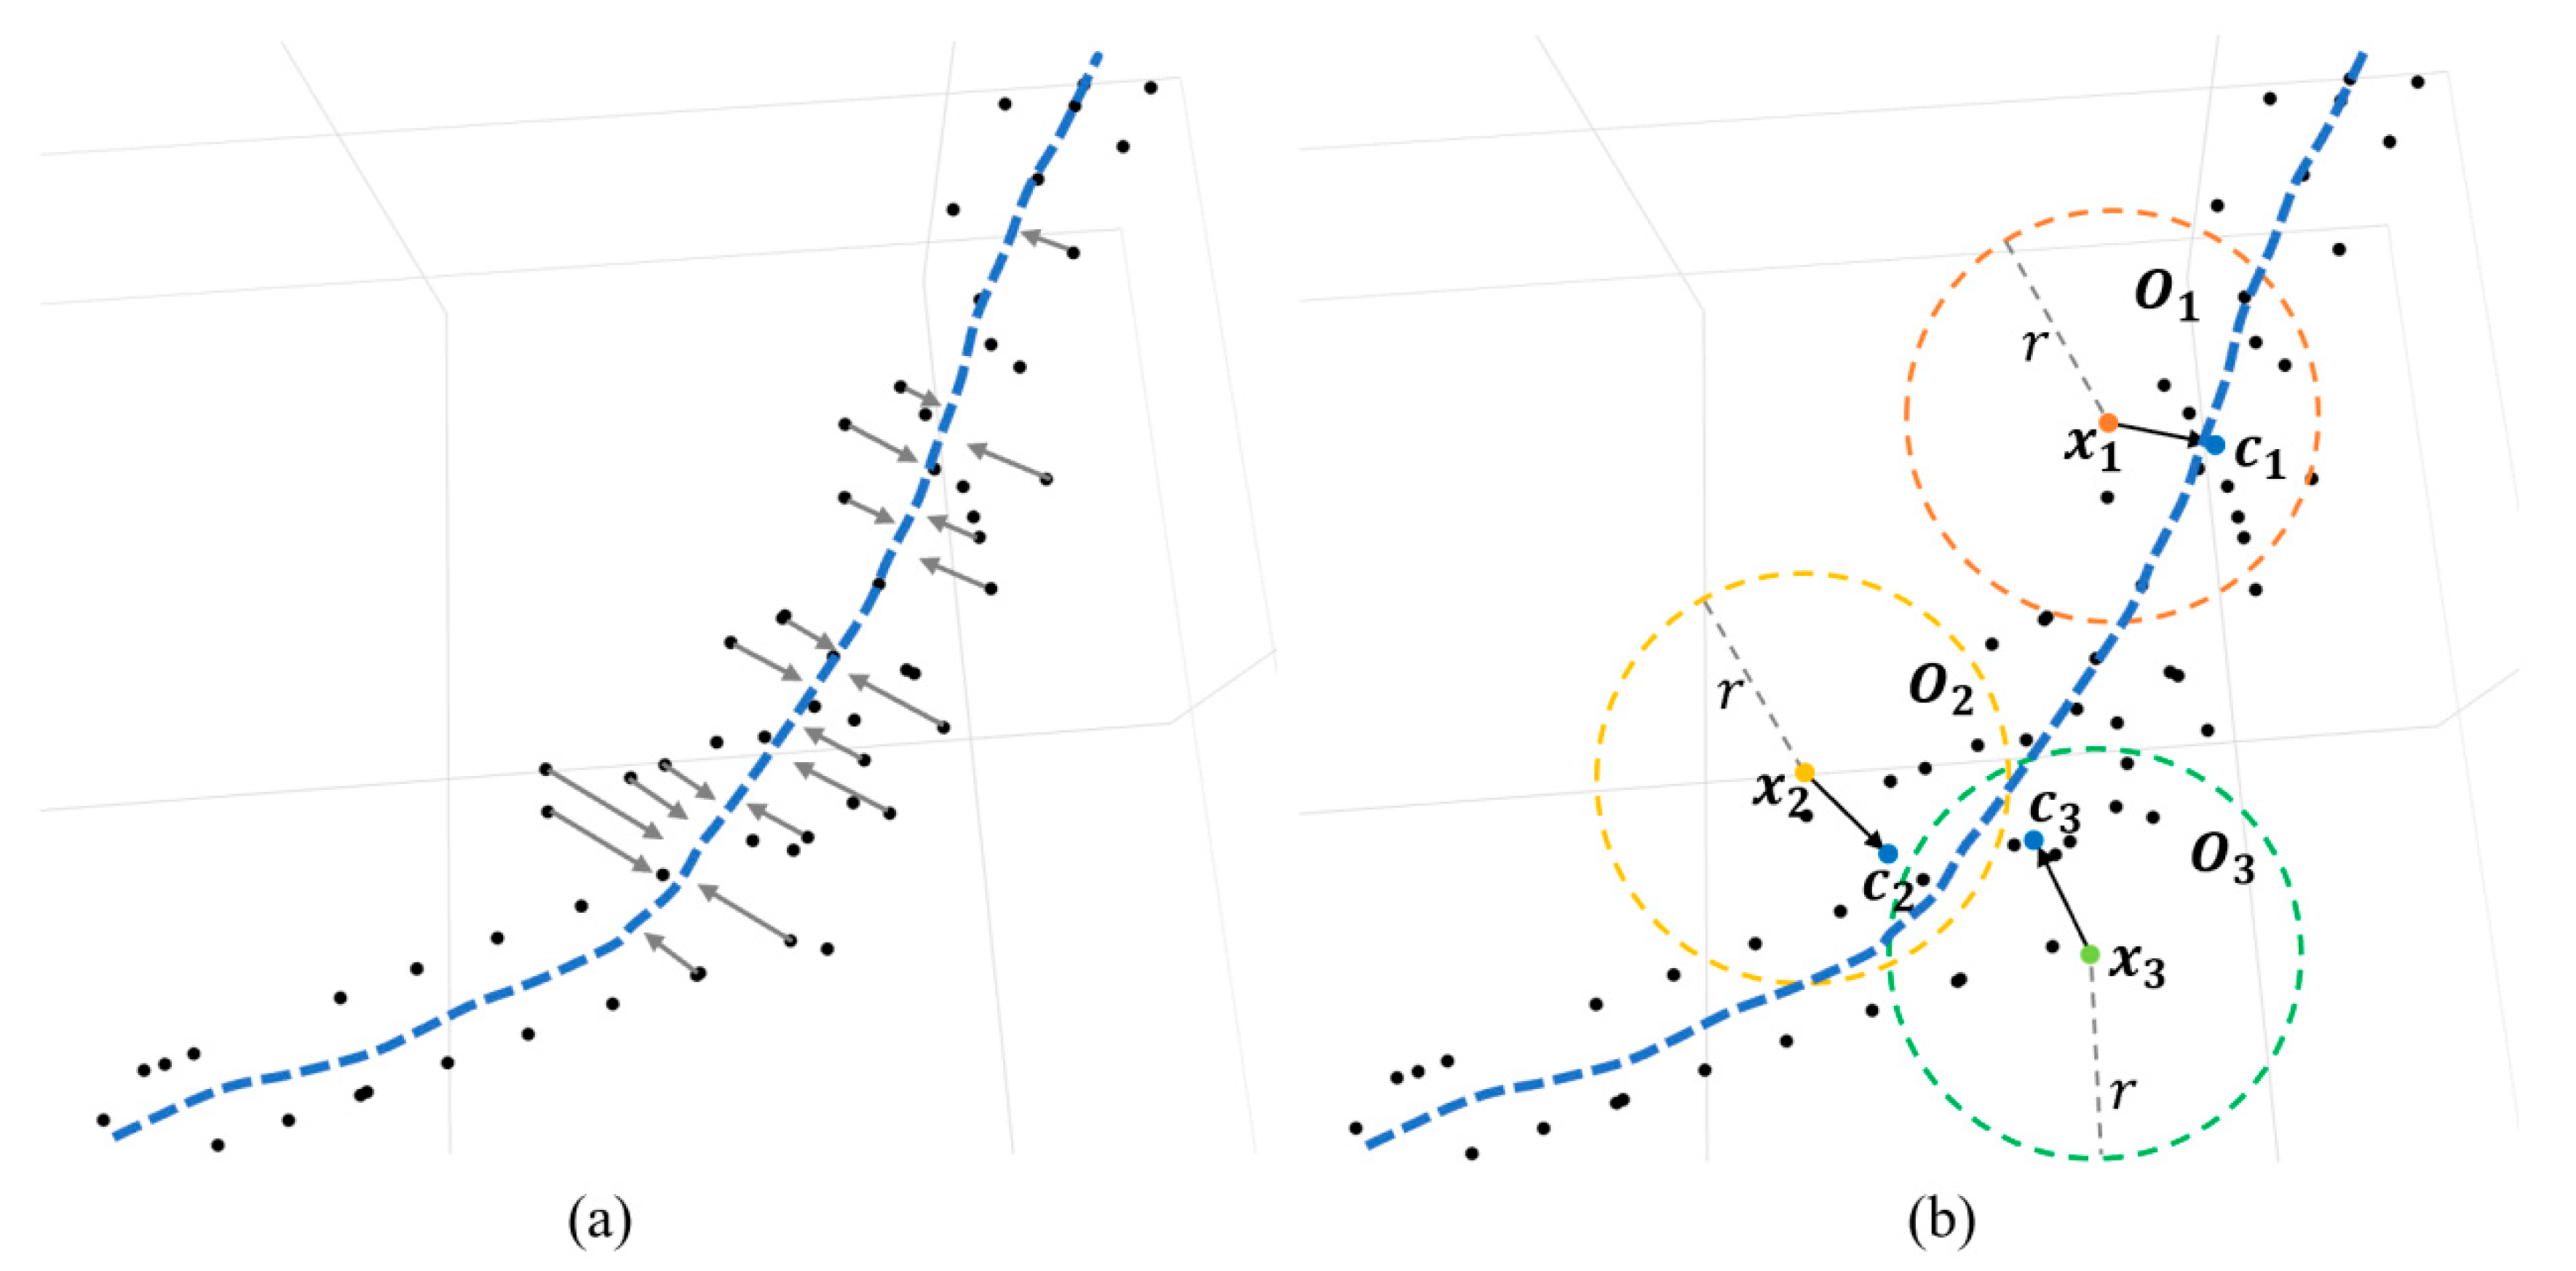
- To address the problem of low accuracy of existing algorithms in skeleton extraction for sparse point cloud data. In this paper, a spatial density-based regional point cloud aggregation algorithm is designed to aggregate sparse tree point cloud before skeleton point extraction, and the aggregated point cloud can describe the 3D skeleton morphology of branches, which can effectively improve the accuracy of subsequent skeleton point extraction.
- (2)
- To address the problem that the generic point cloud skeleton extraction algorithm is prone to broken branches and self-loops when the skeleton topology is connected, which leads to unrealistic tree point cloud skeleton extraction results. In this paper, we propose a skeleton topology connection method with spherical shrinkage from the outside to the root node, which can better adapt to the bifurcated tree structure, effectively avoiding the appearance of non-tree branch structure, and can effectively extract the initial skeleton of tree branches.
- (3)
- To objectively evaluate the skeleton extraction algorithm and thus verify the performance of the skeleton extraction algorithm on real tree branch point cloud. In this paper, based on the consideration of the characteristics of tree branch structure morphology, the metrics for evaluating the accuracy of skeleton morphology: FBP (F1-score of bifurcation point), FEP (F1-score of end point) and the metric for evaluating the accuracy of skeleton topology: HD (Hausdorff distance) were designed, which can reasonably evaluate the skeleton extraction performance of the algorithm.
- (4)
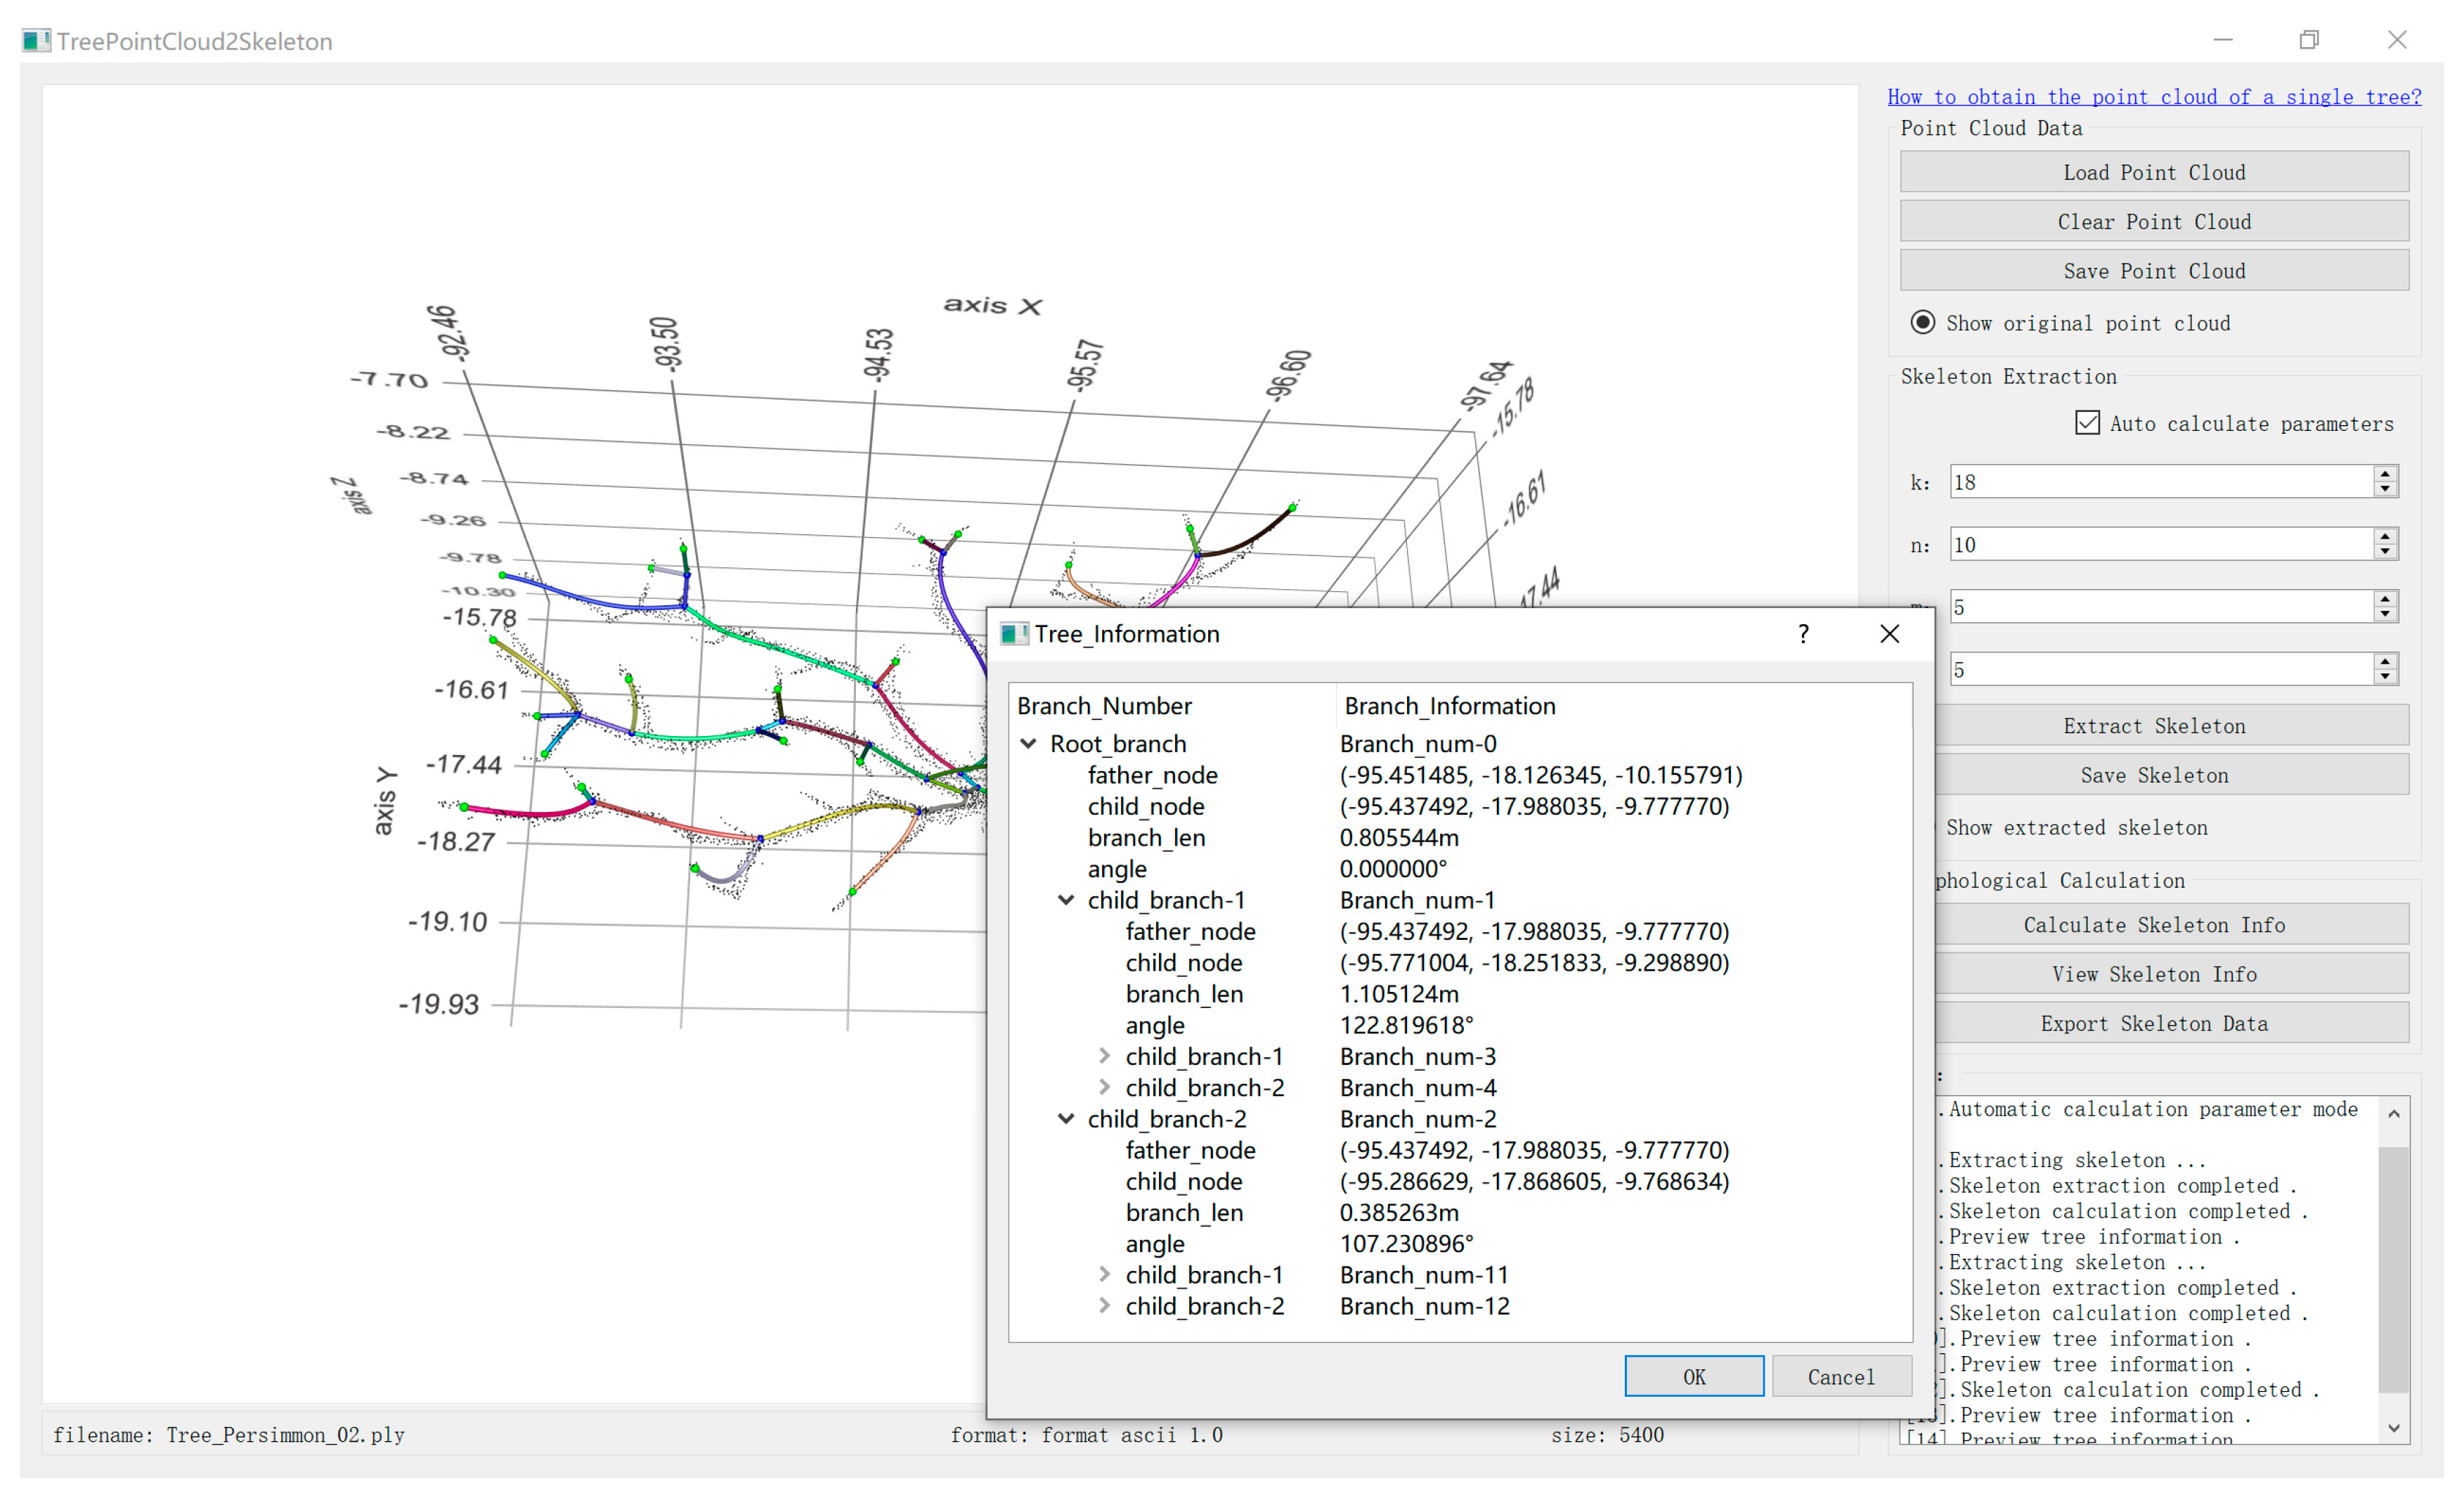
- To release an easy-to-use software application that helps the community to test the proposed algorithm and use it for other related applications.
2. Materials and Methods
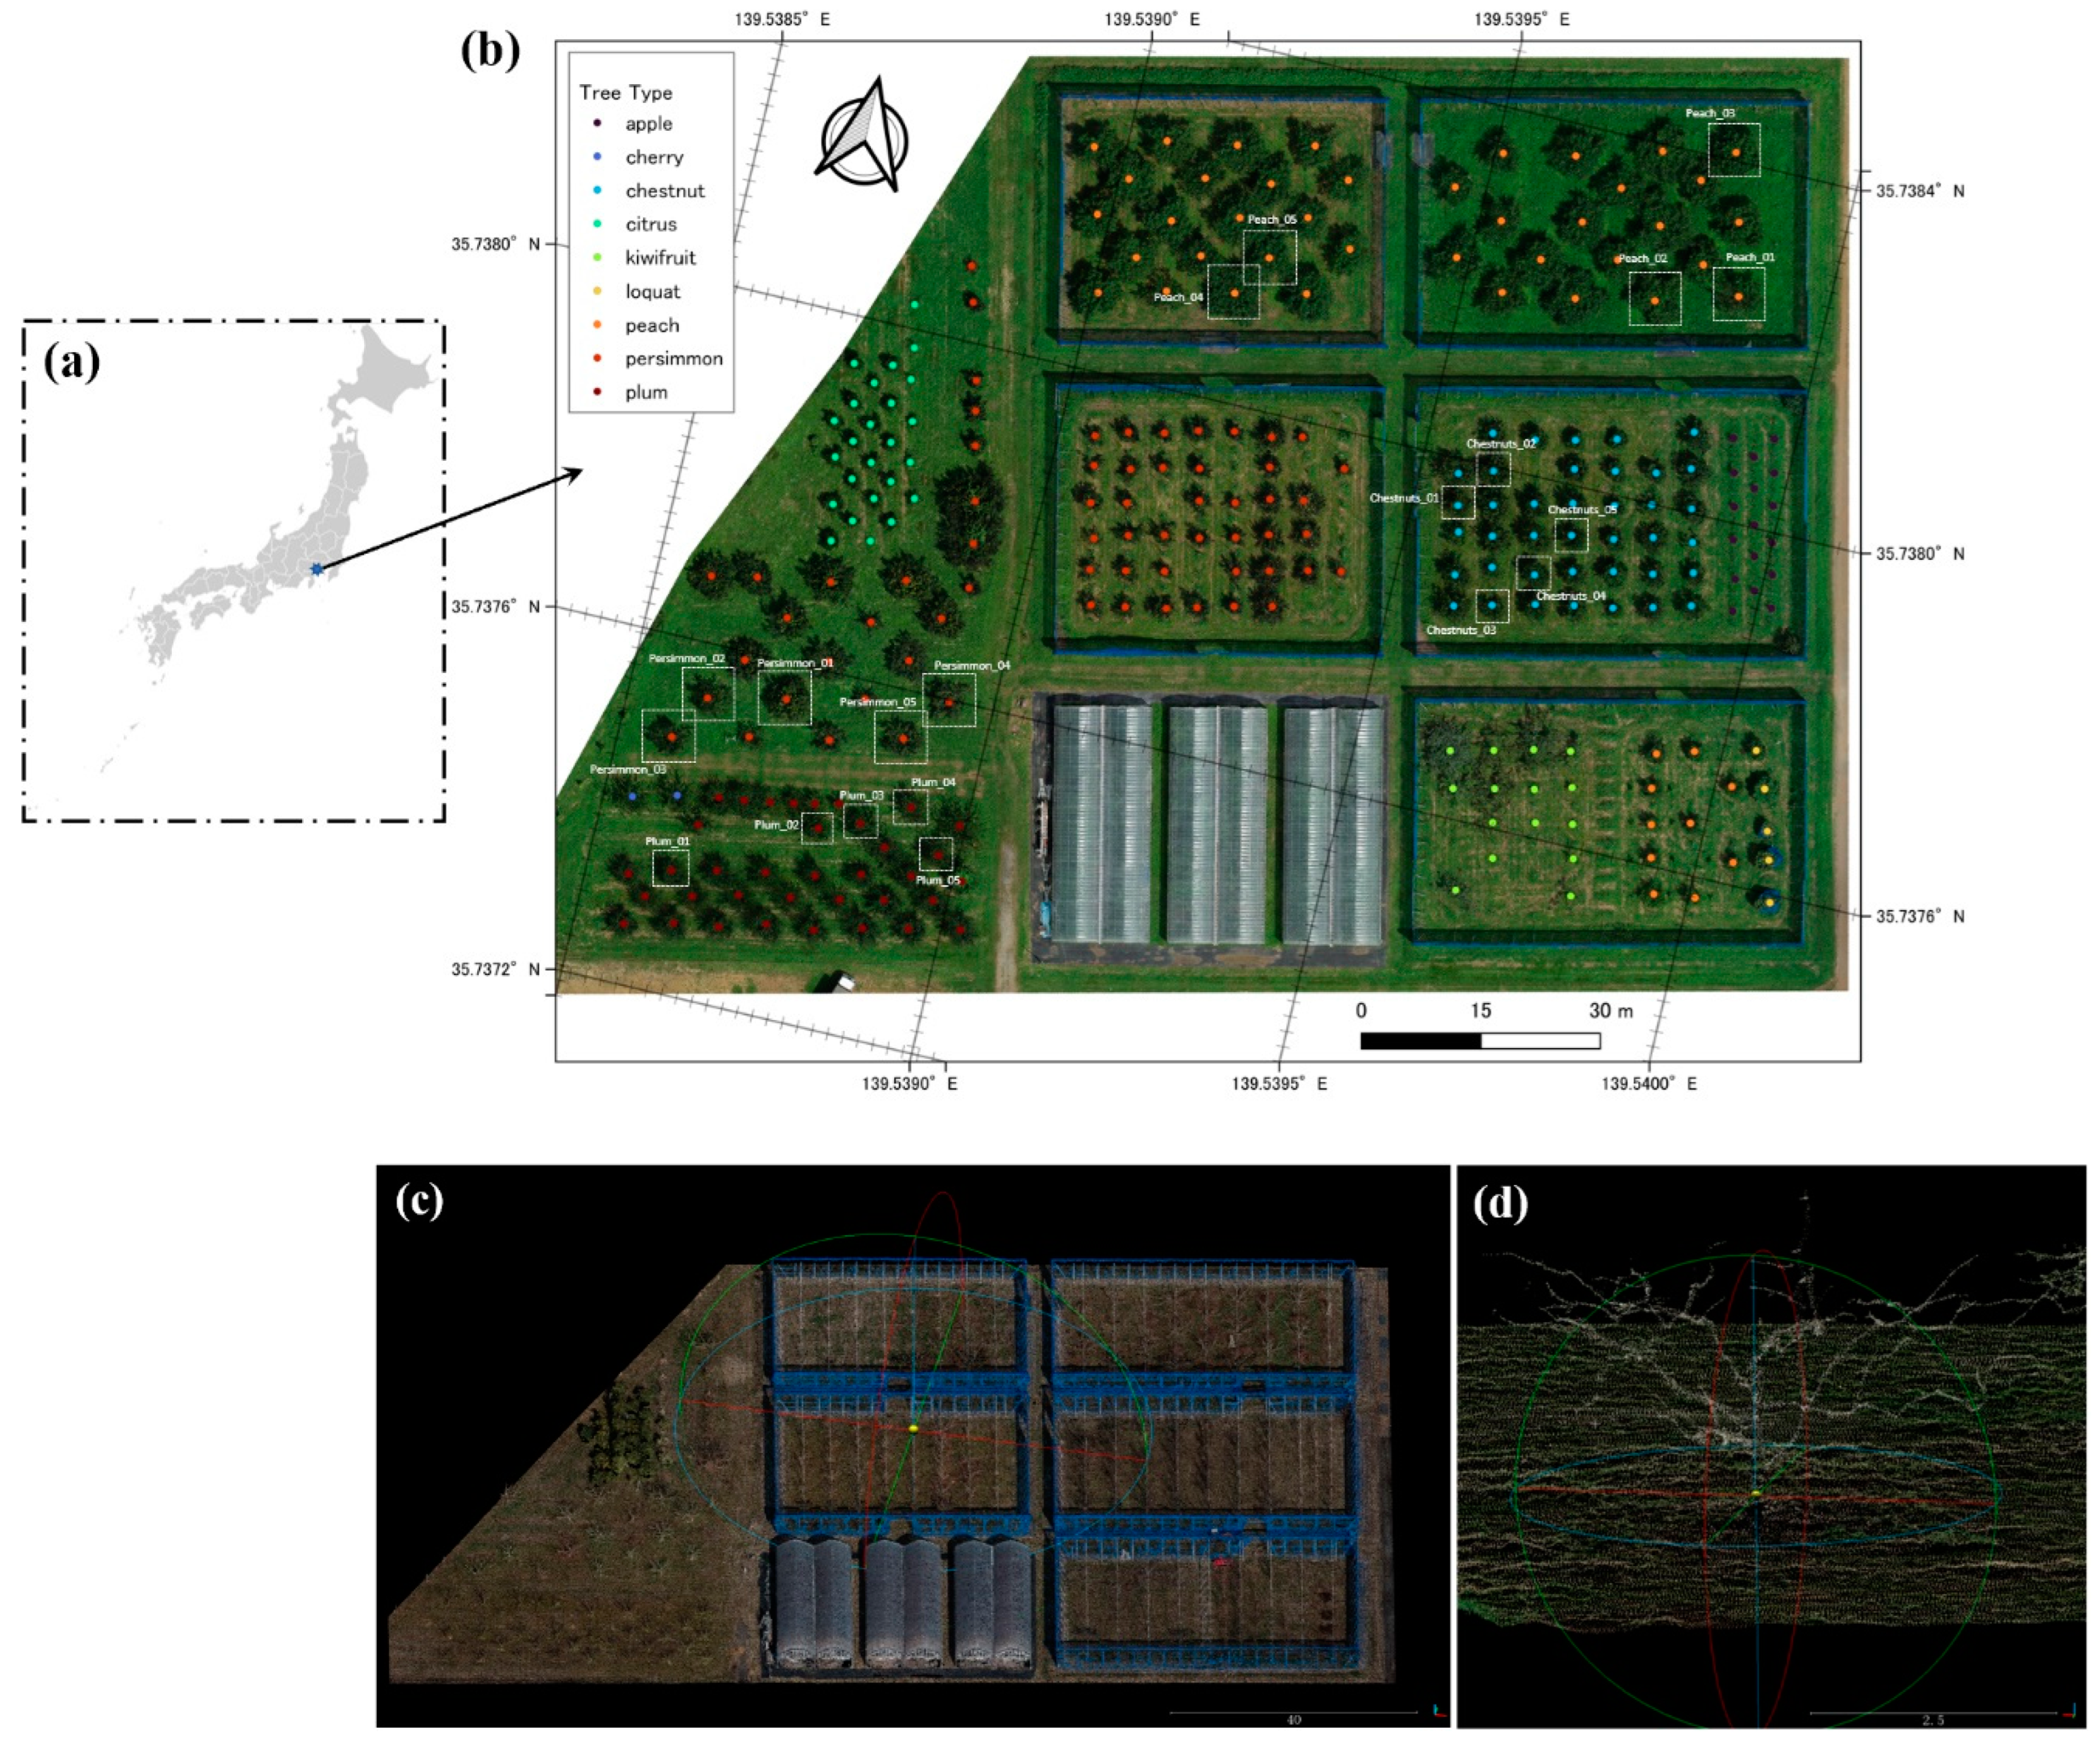
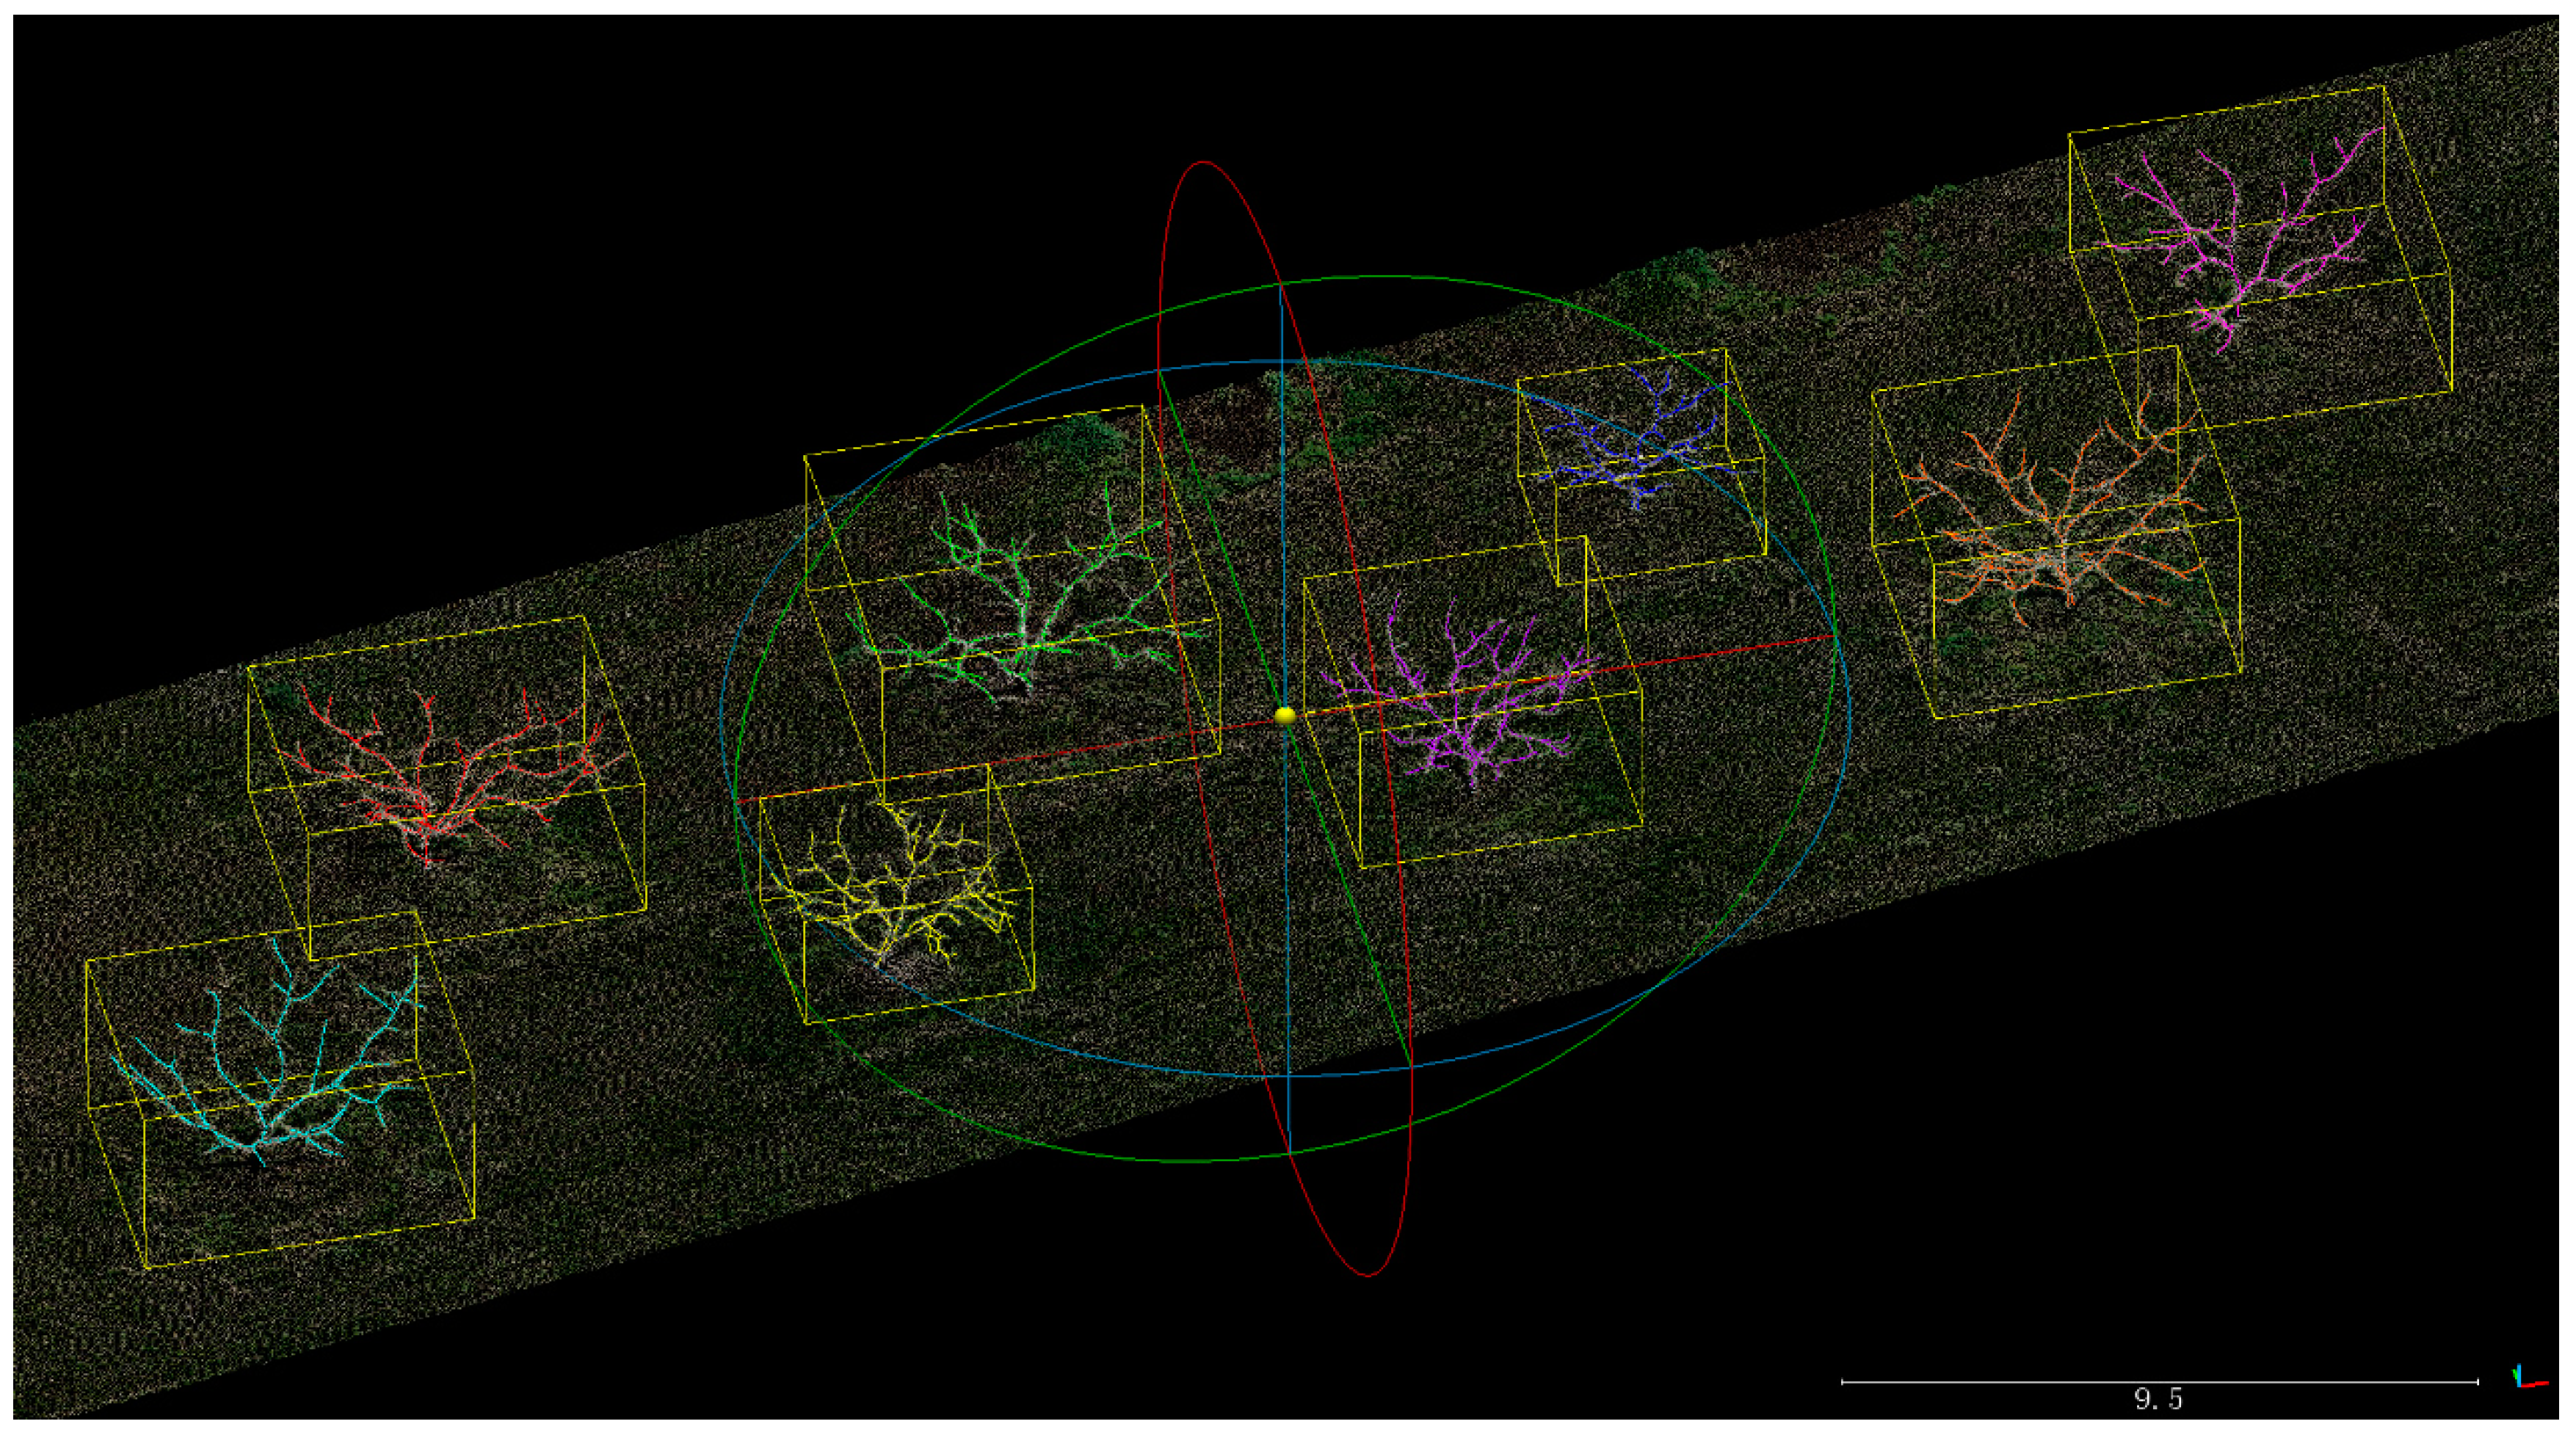
2.1. Data Acquisition
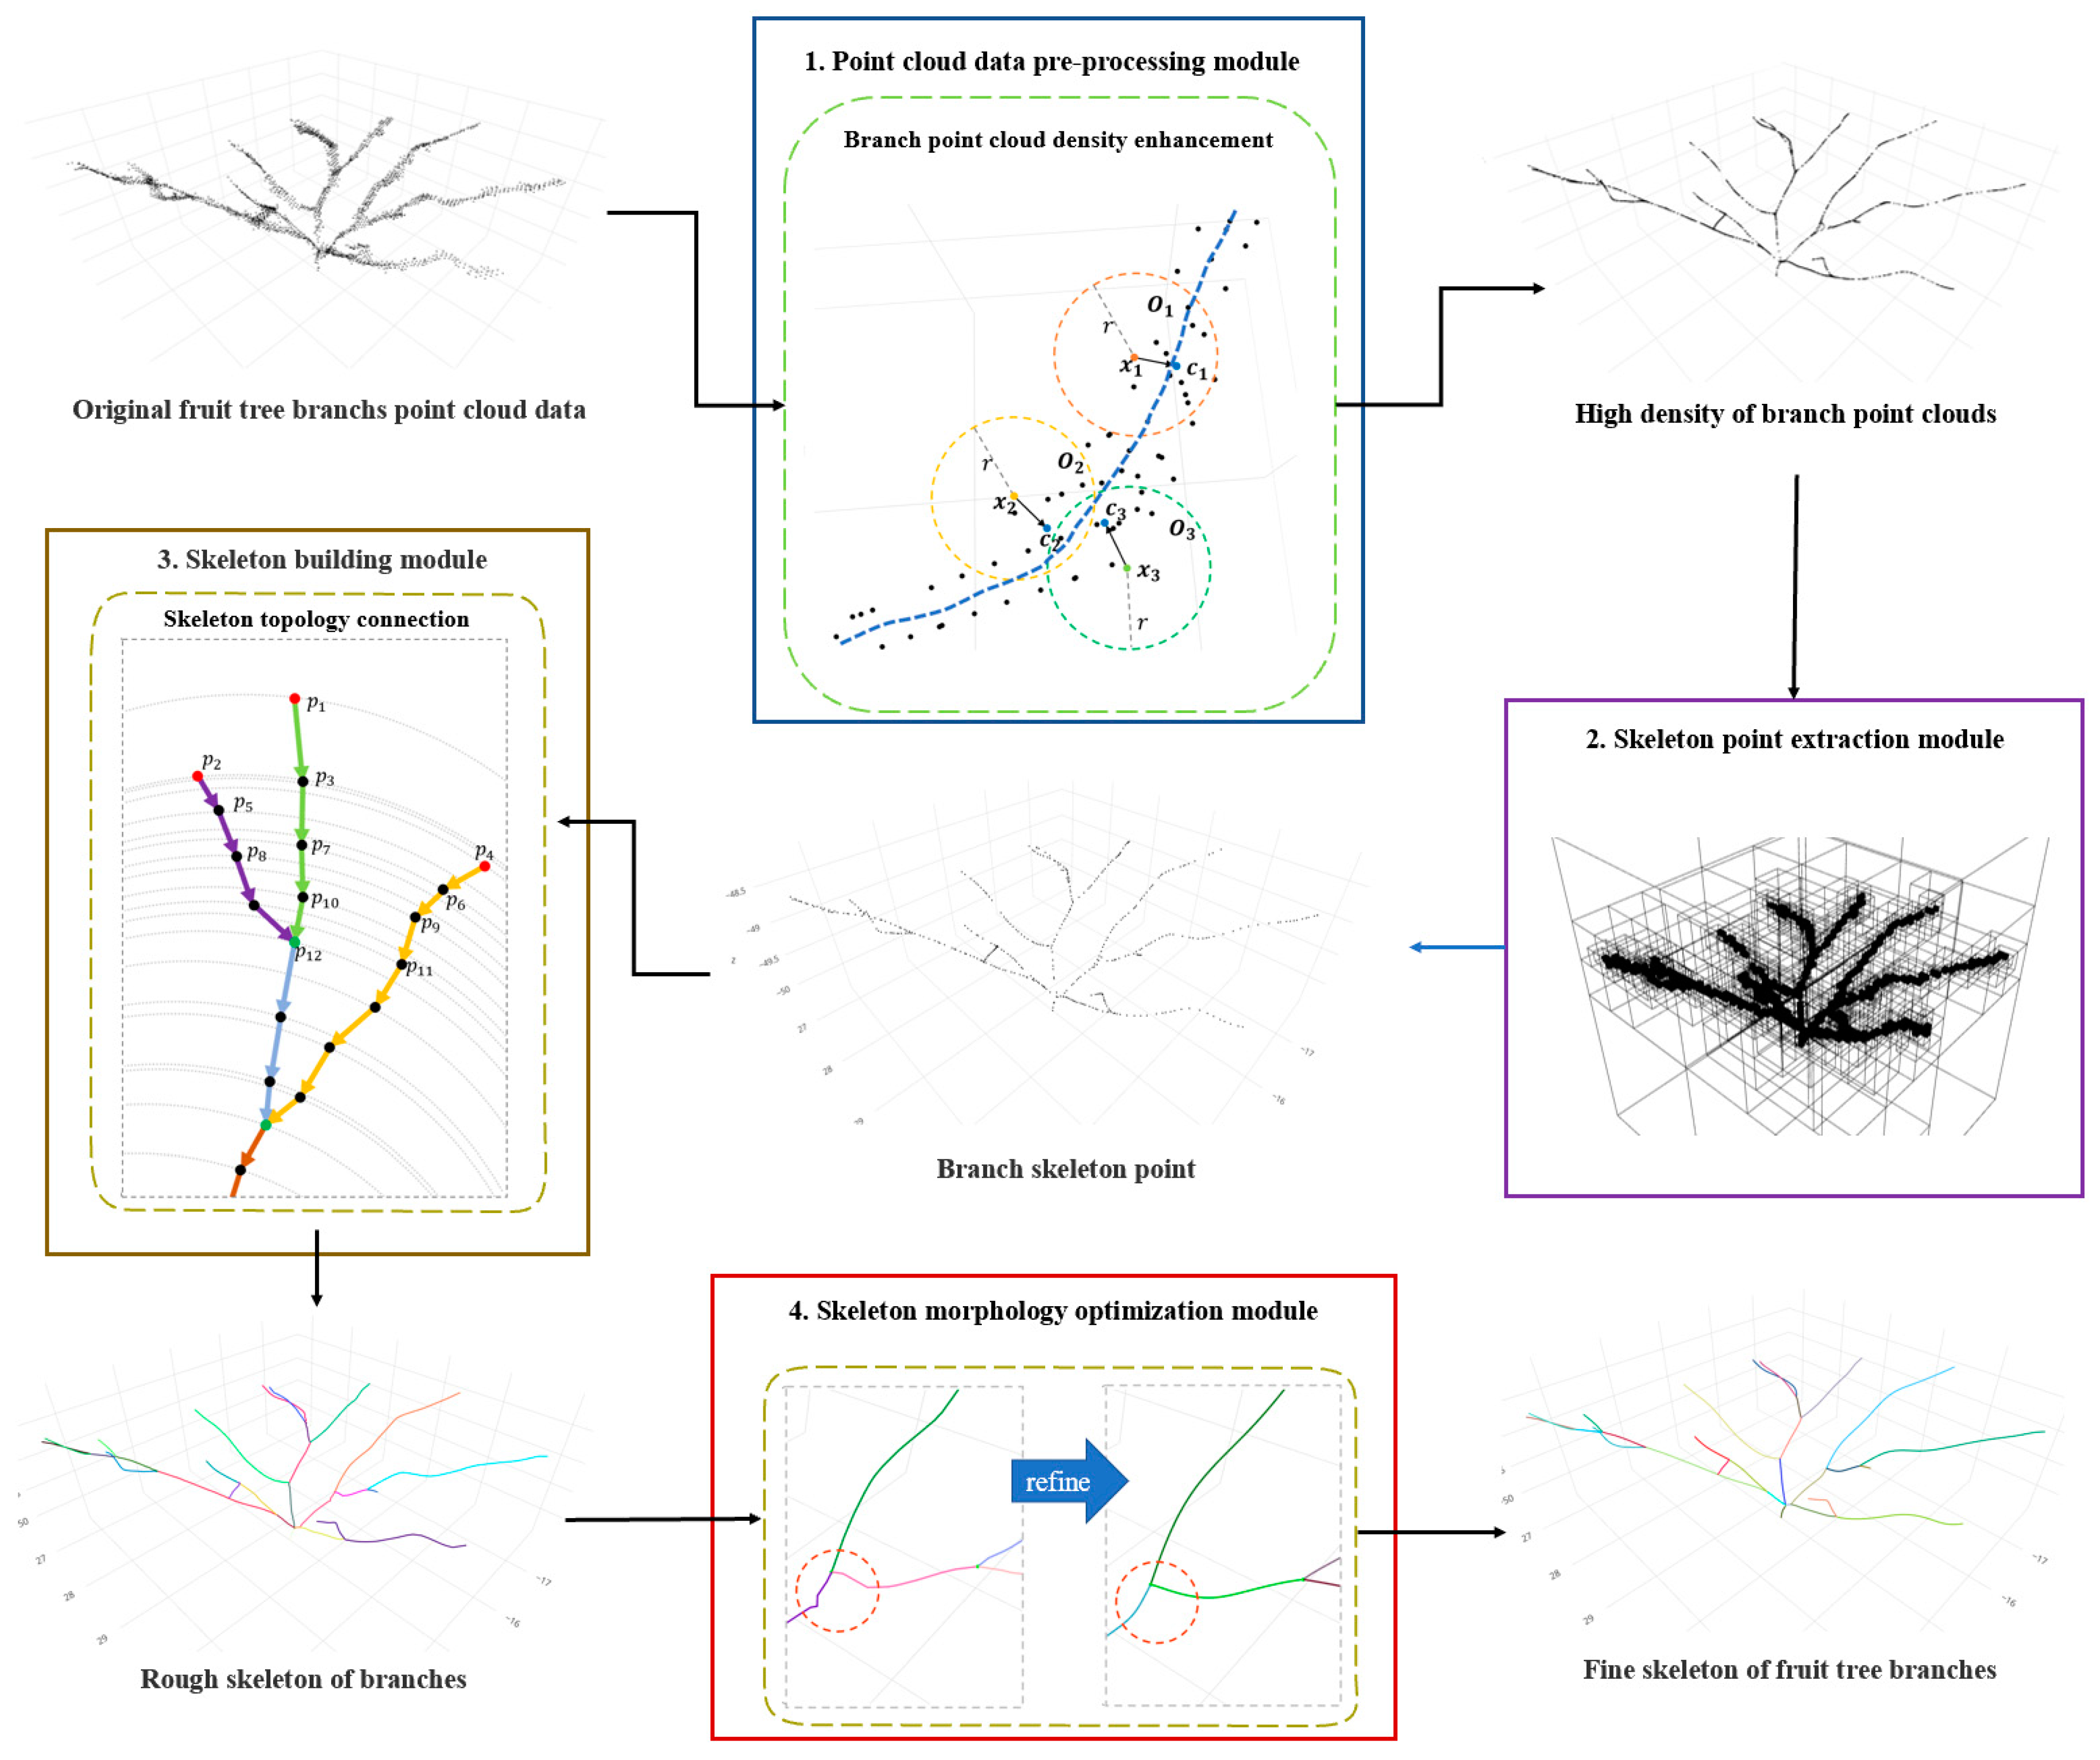
2.2. General Architecture of the Algorithm
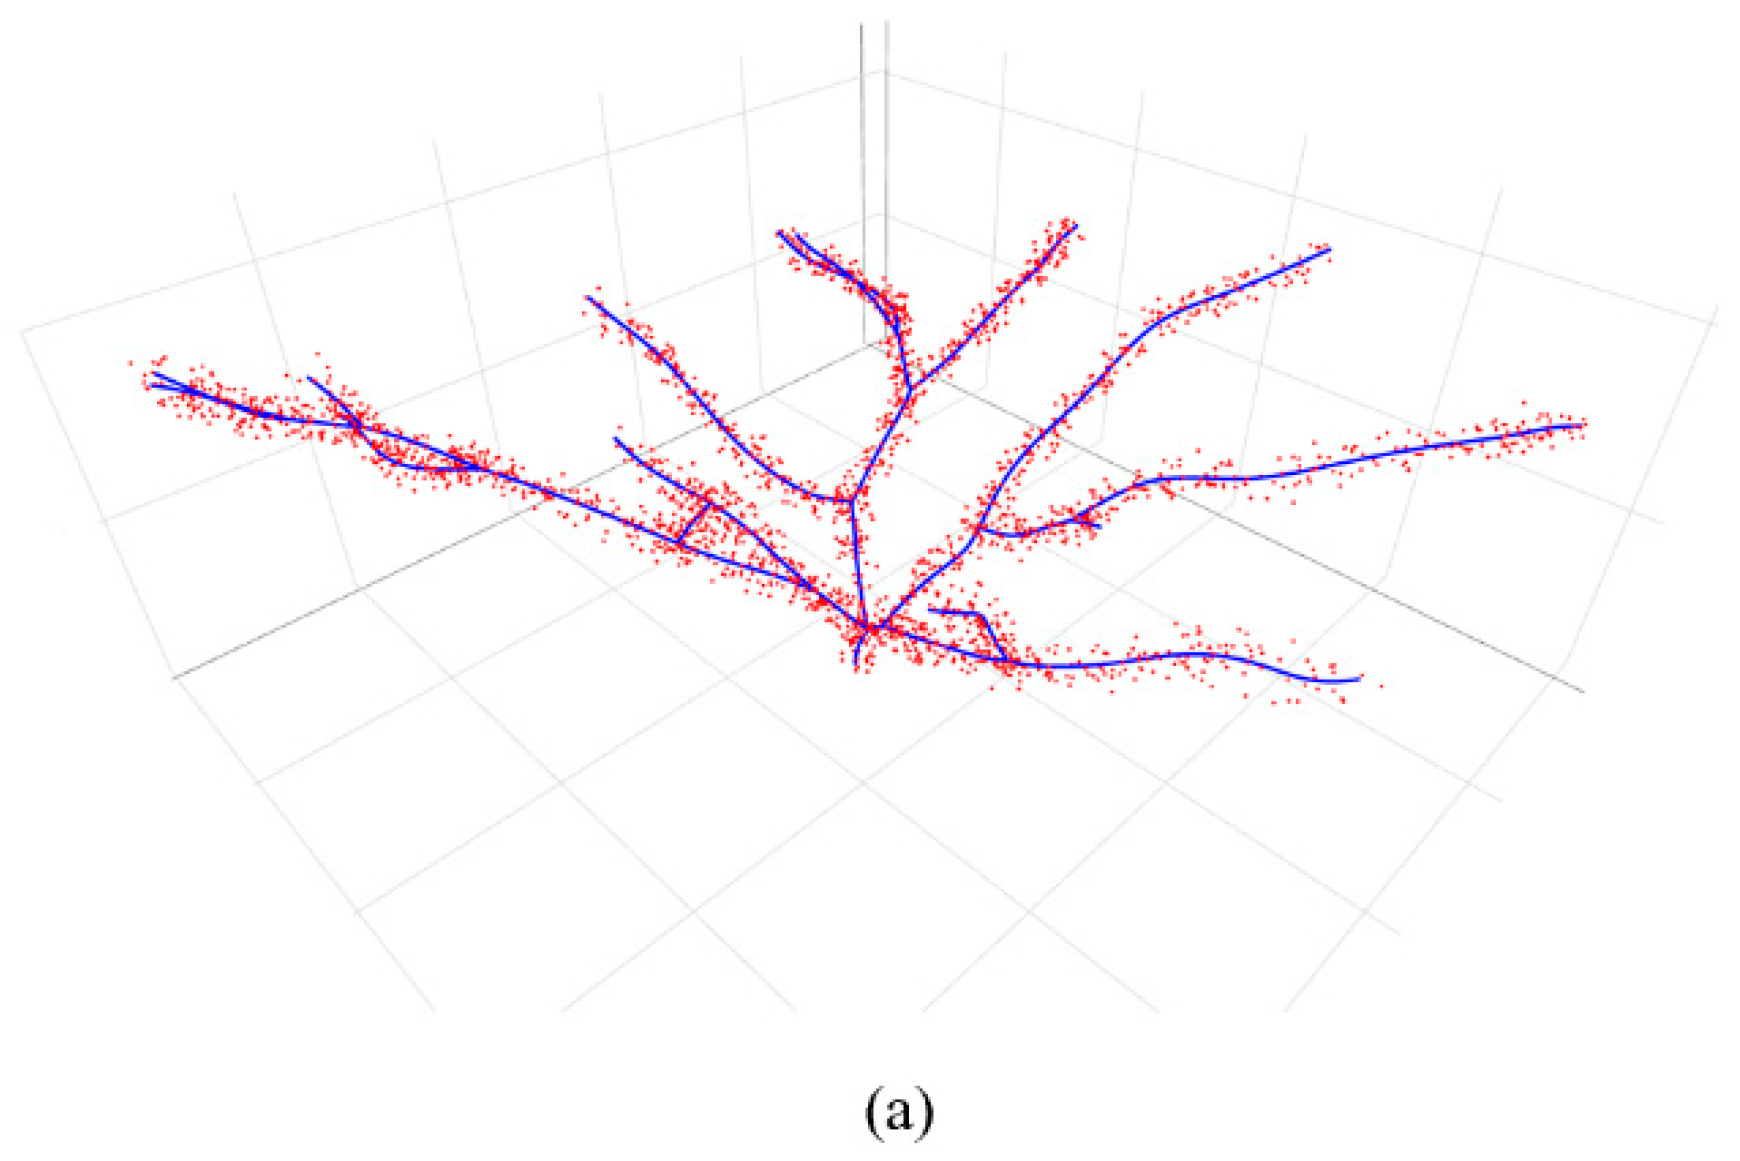
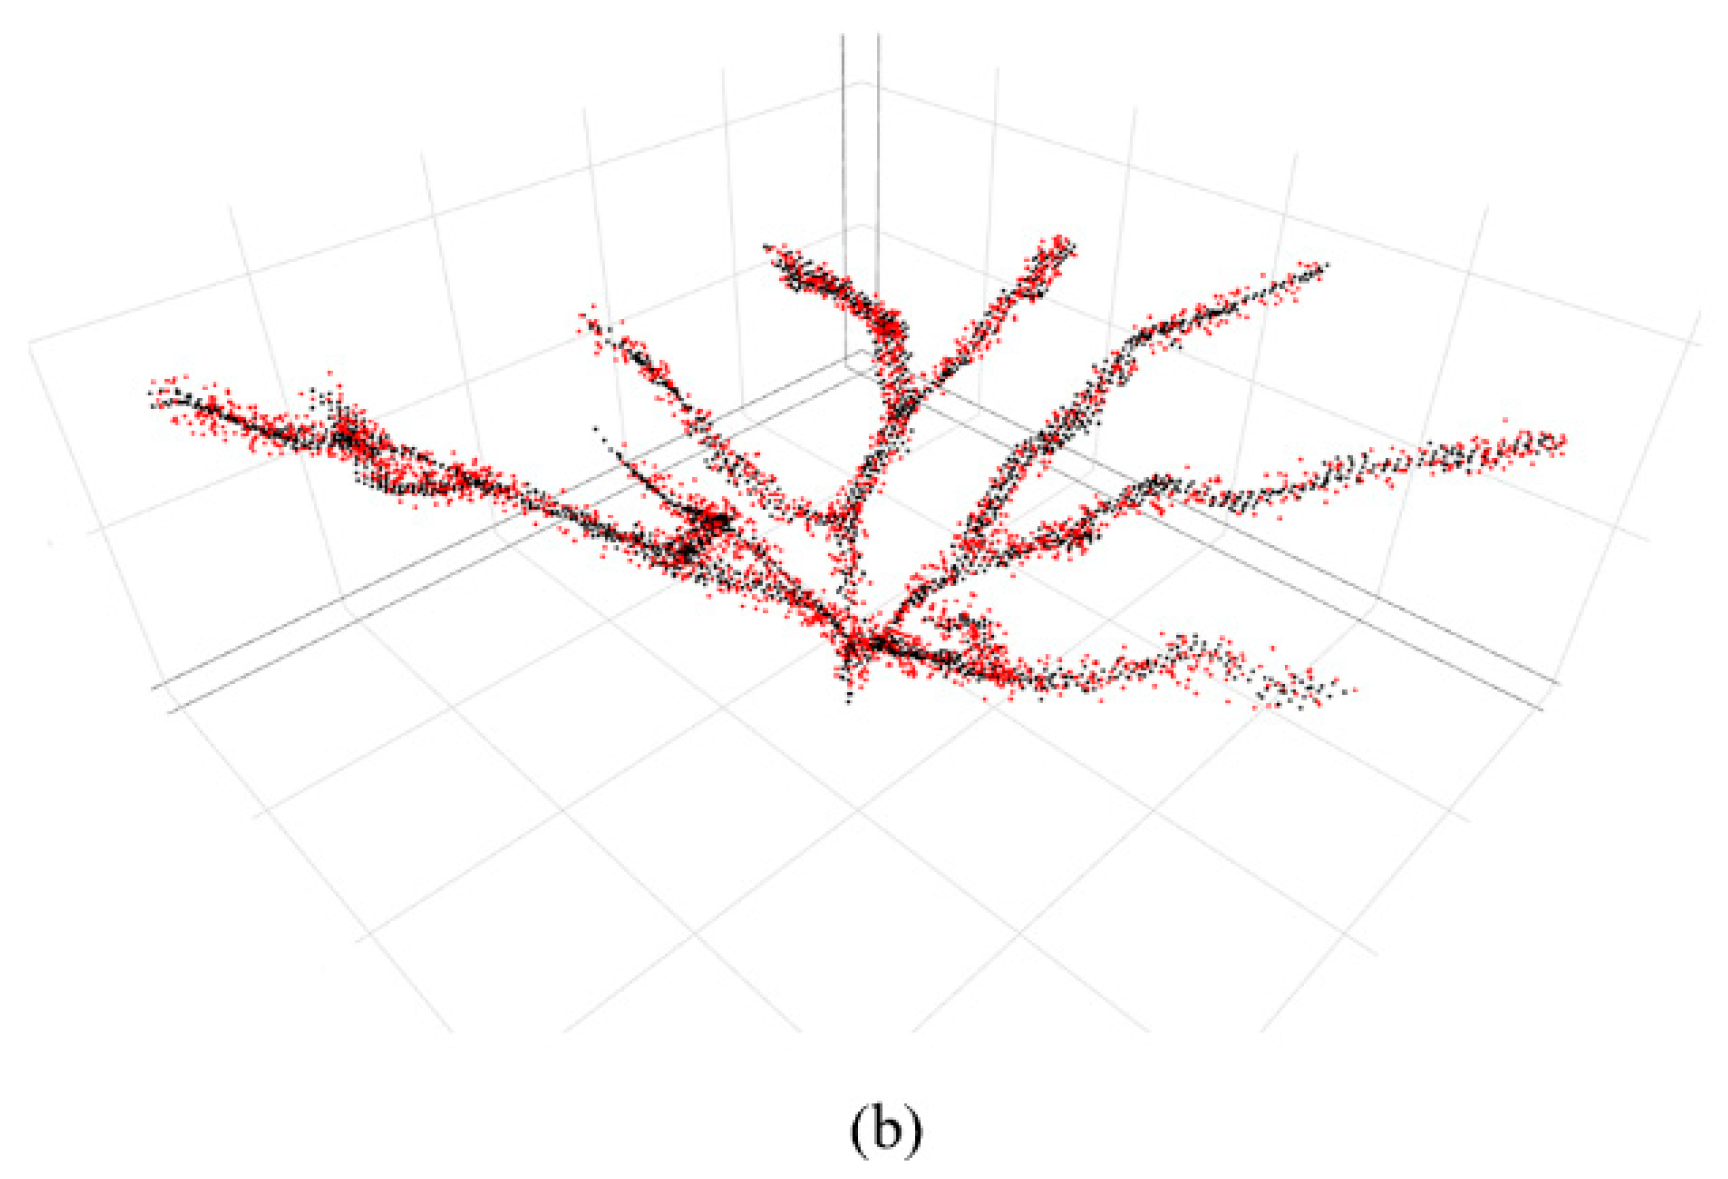
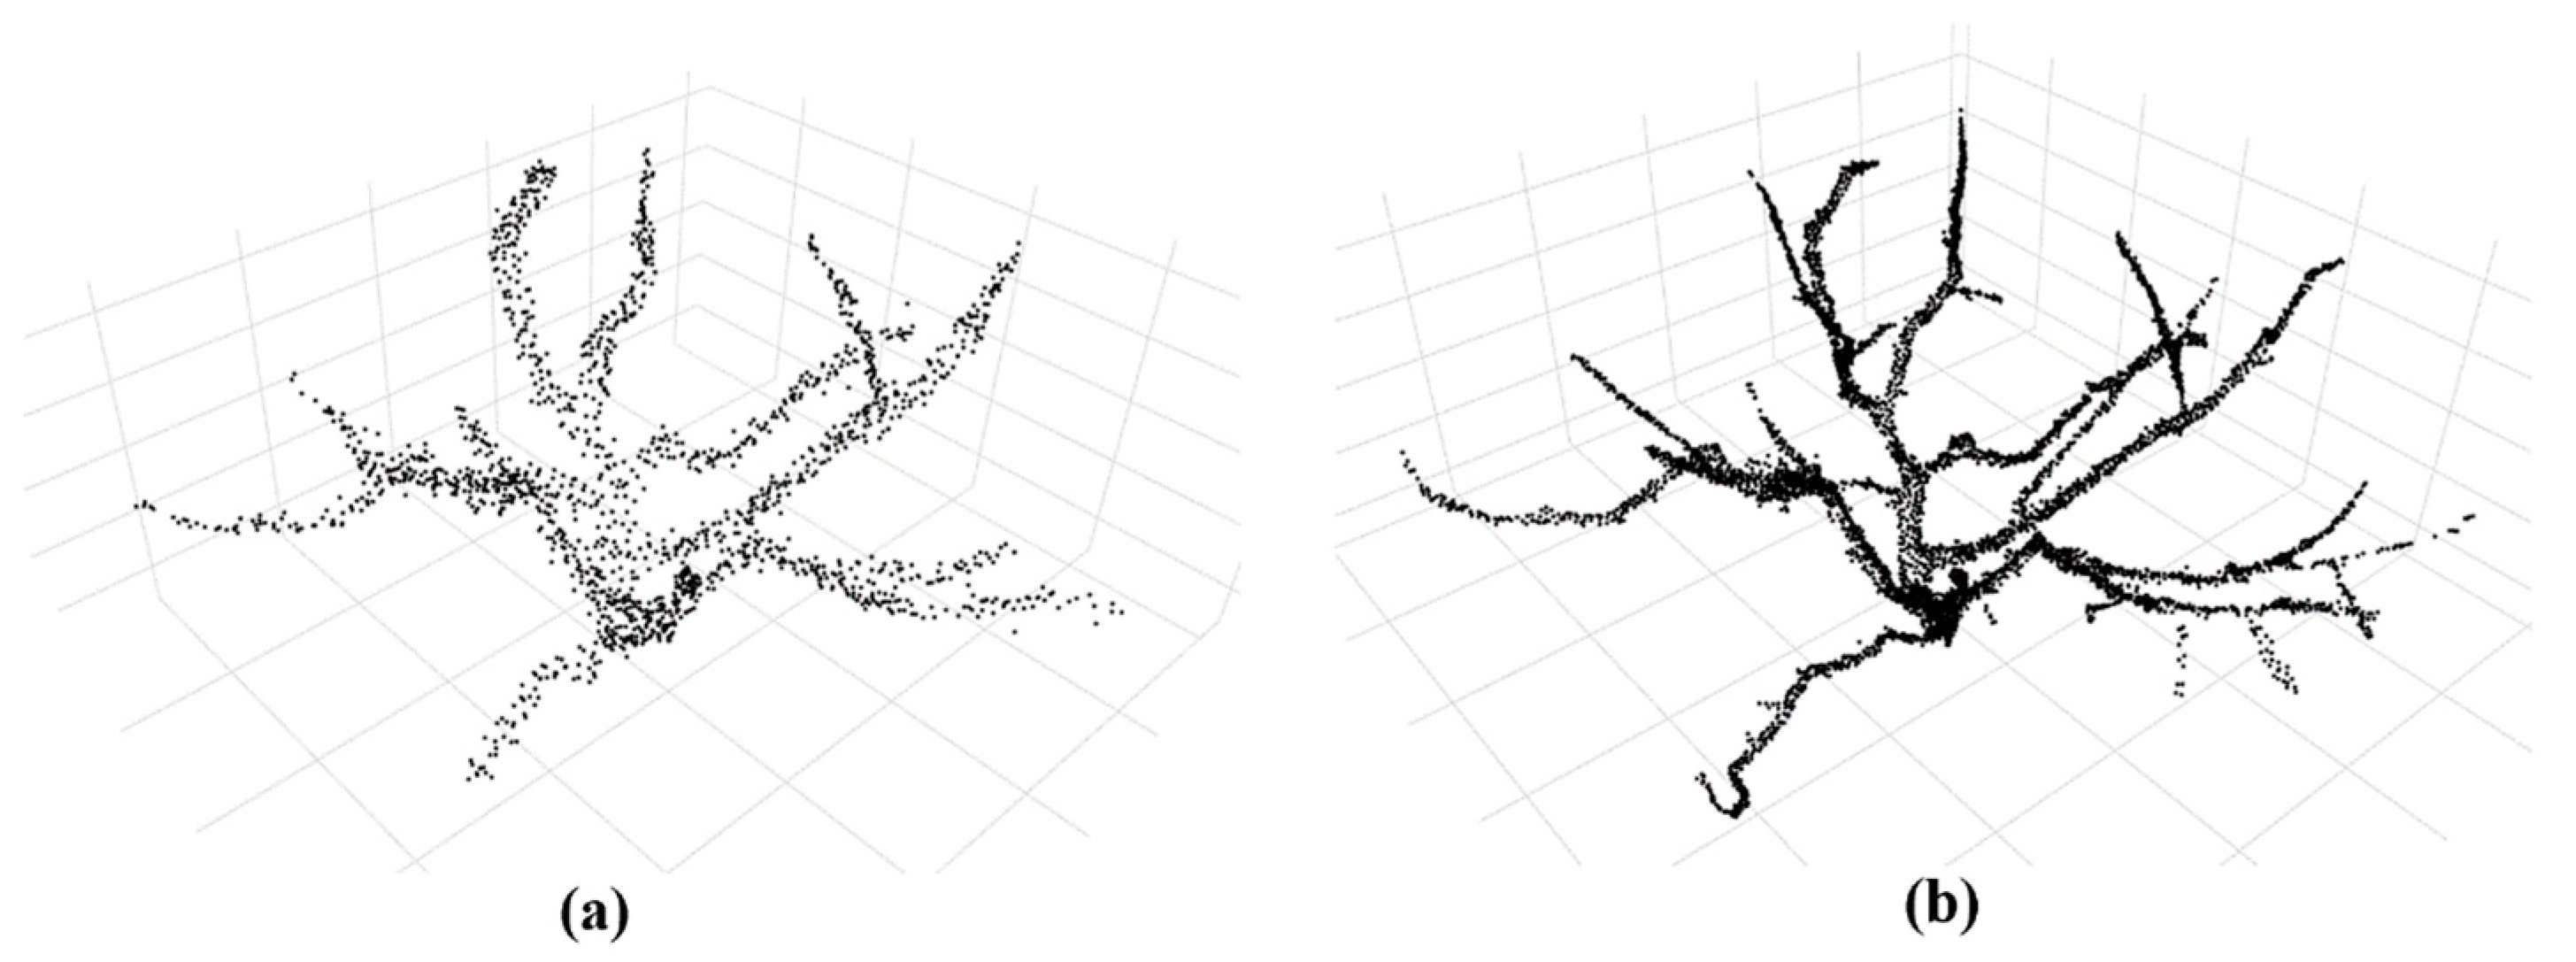
- Point cloud pre-processing module: this module first denoises the original branch point cloud data, and then aggregates the sparse branch point clouds using the regional point cloud aggregation method proposed in this study, which can form a dense point cloud that roughly describes the morphology of the branch skeleton and prepares for the subsequent skeleton point extraction.
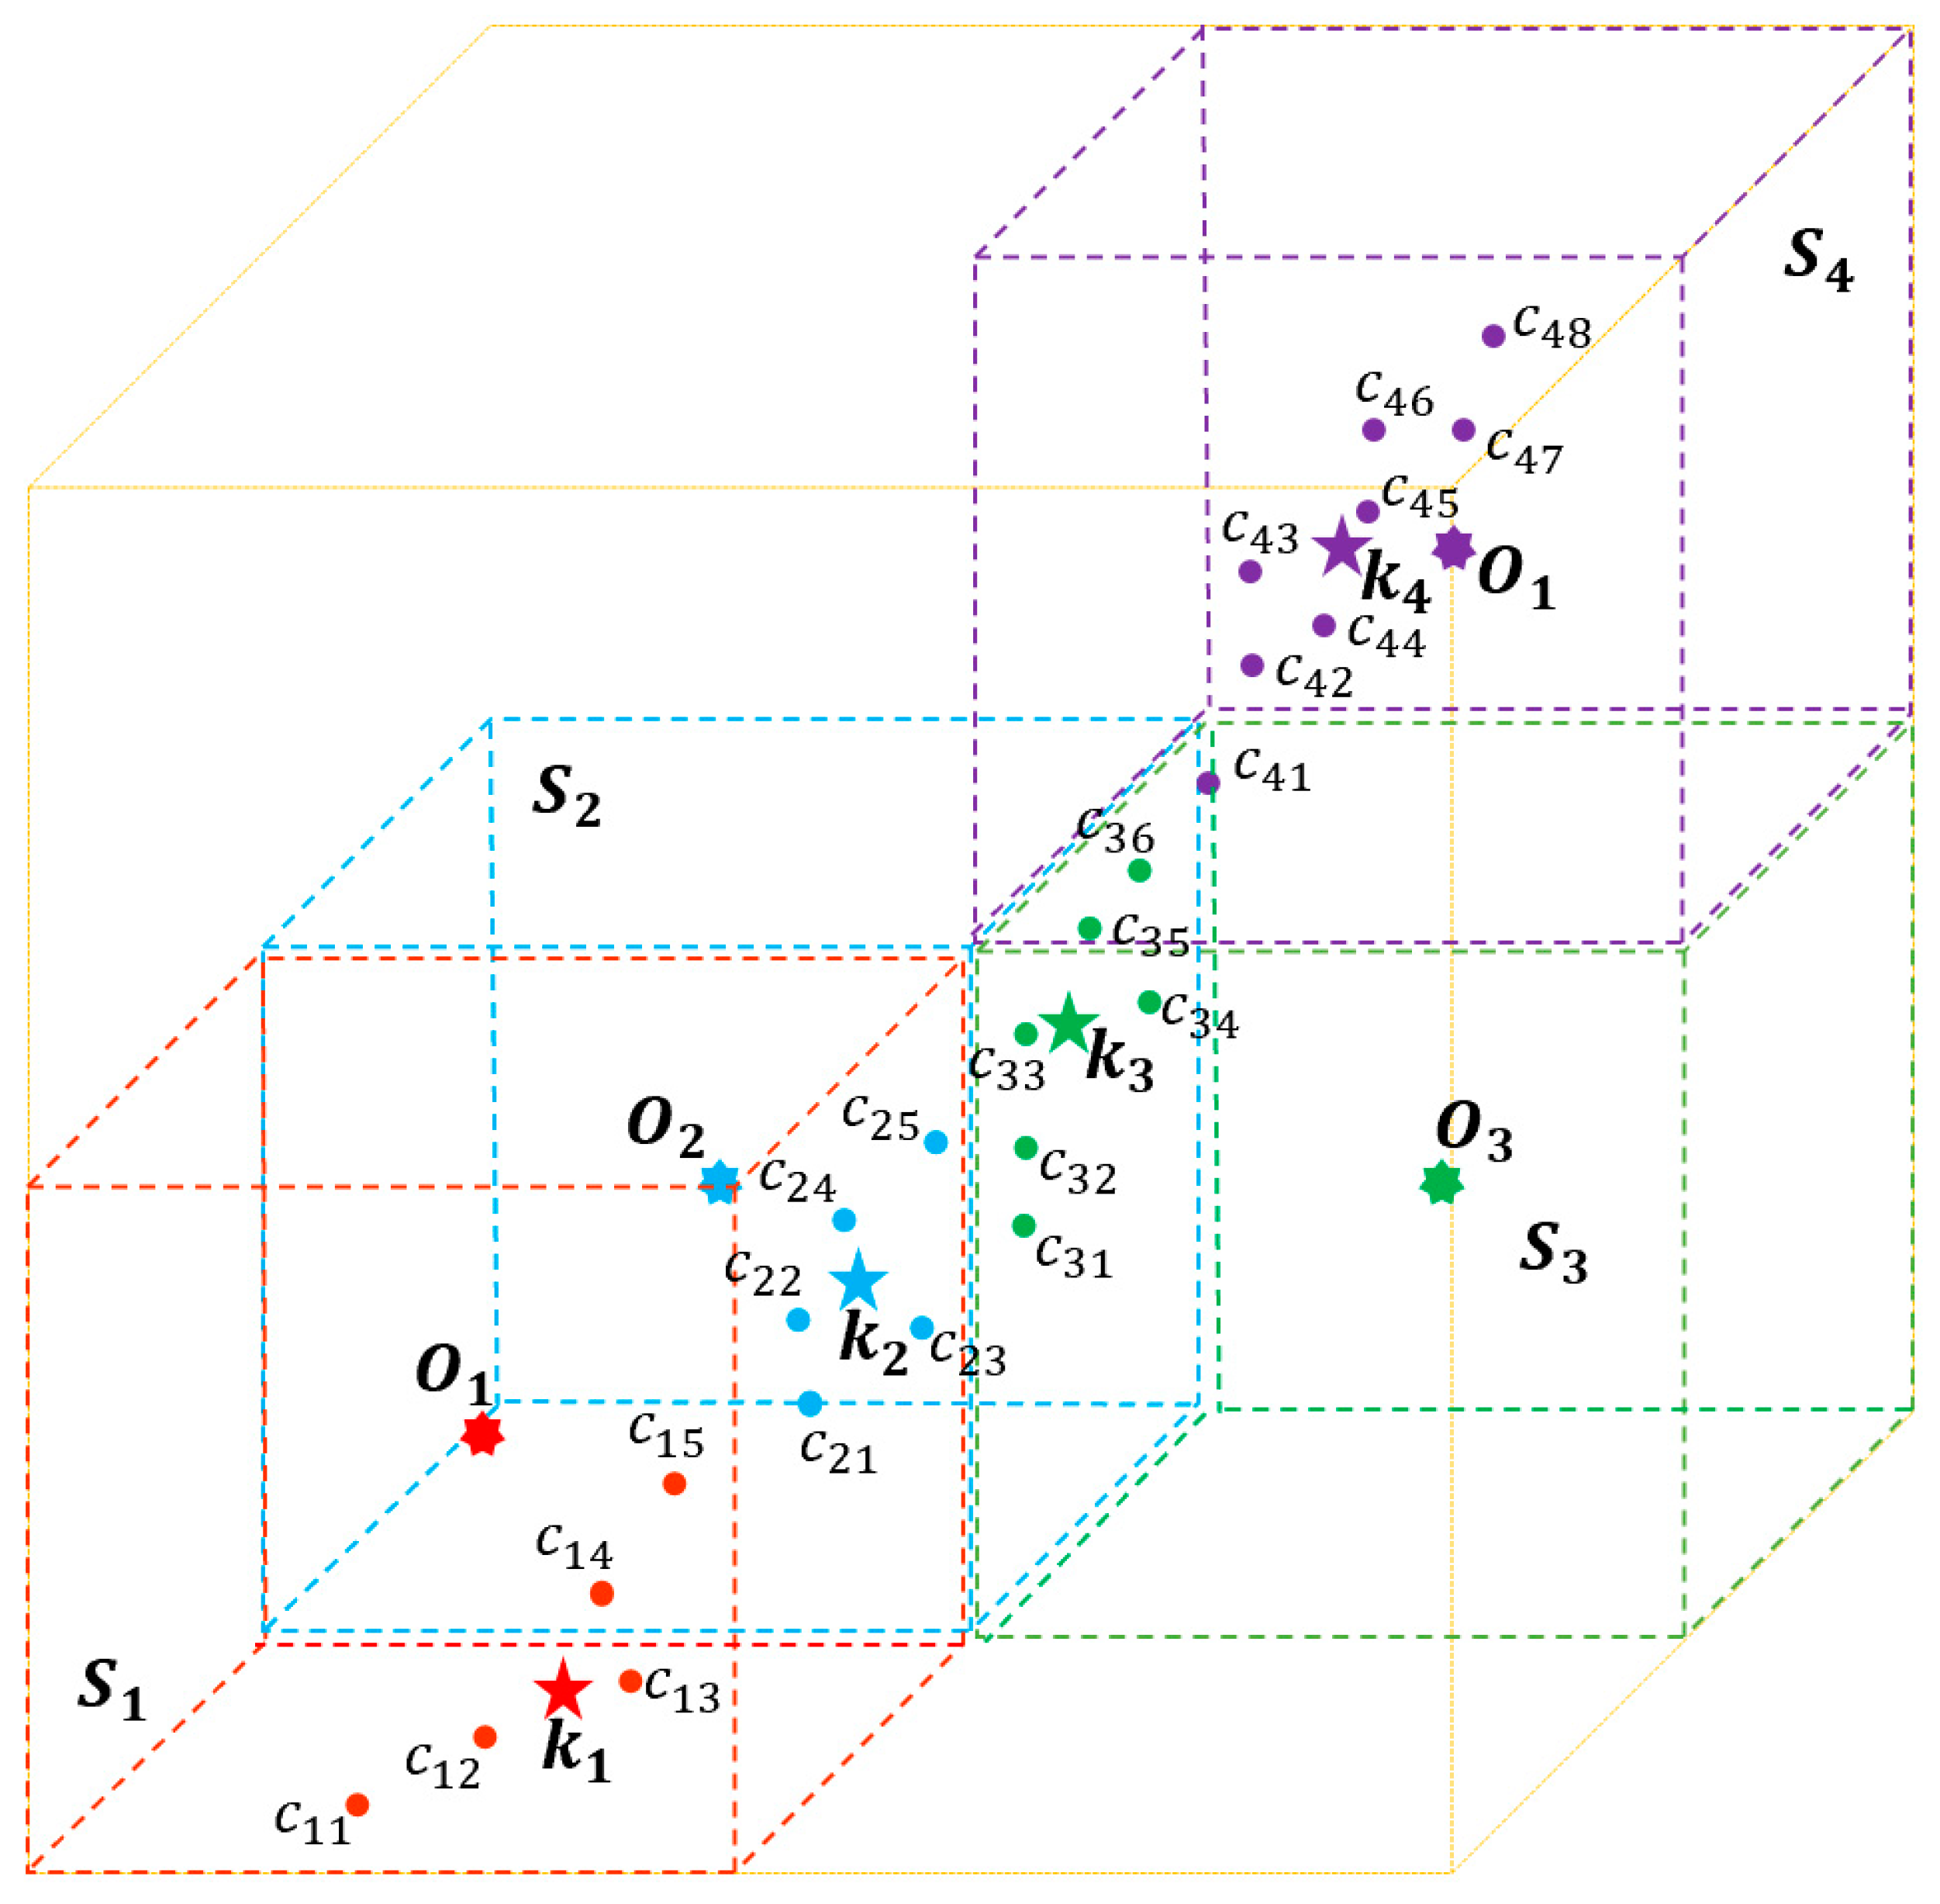
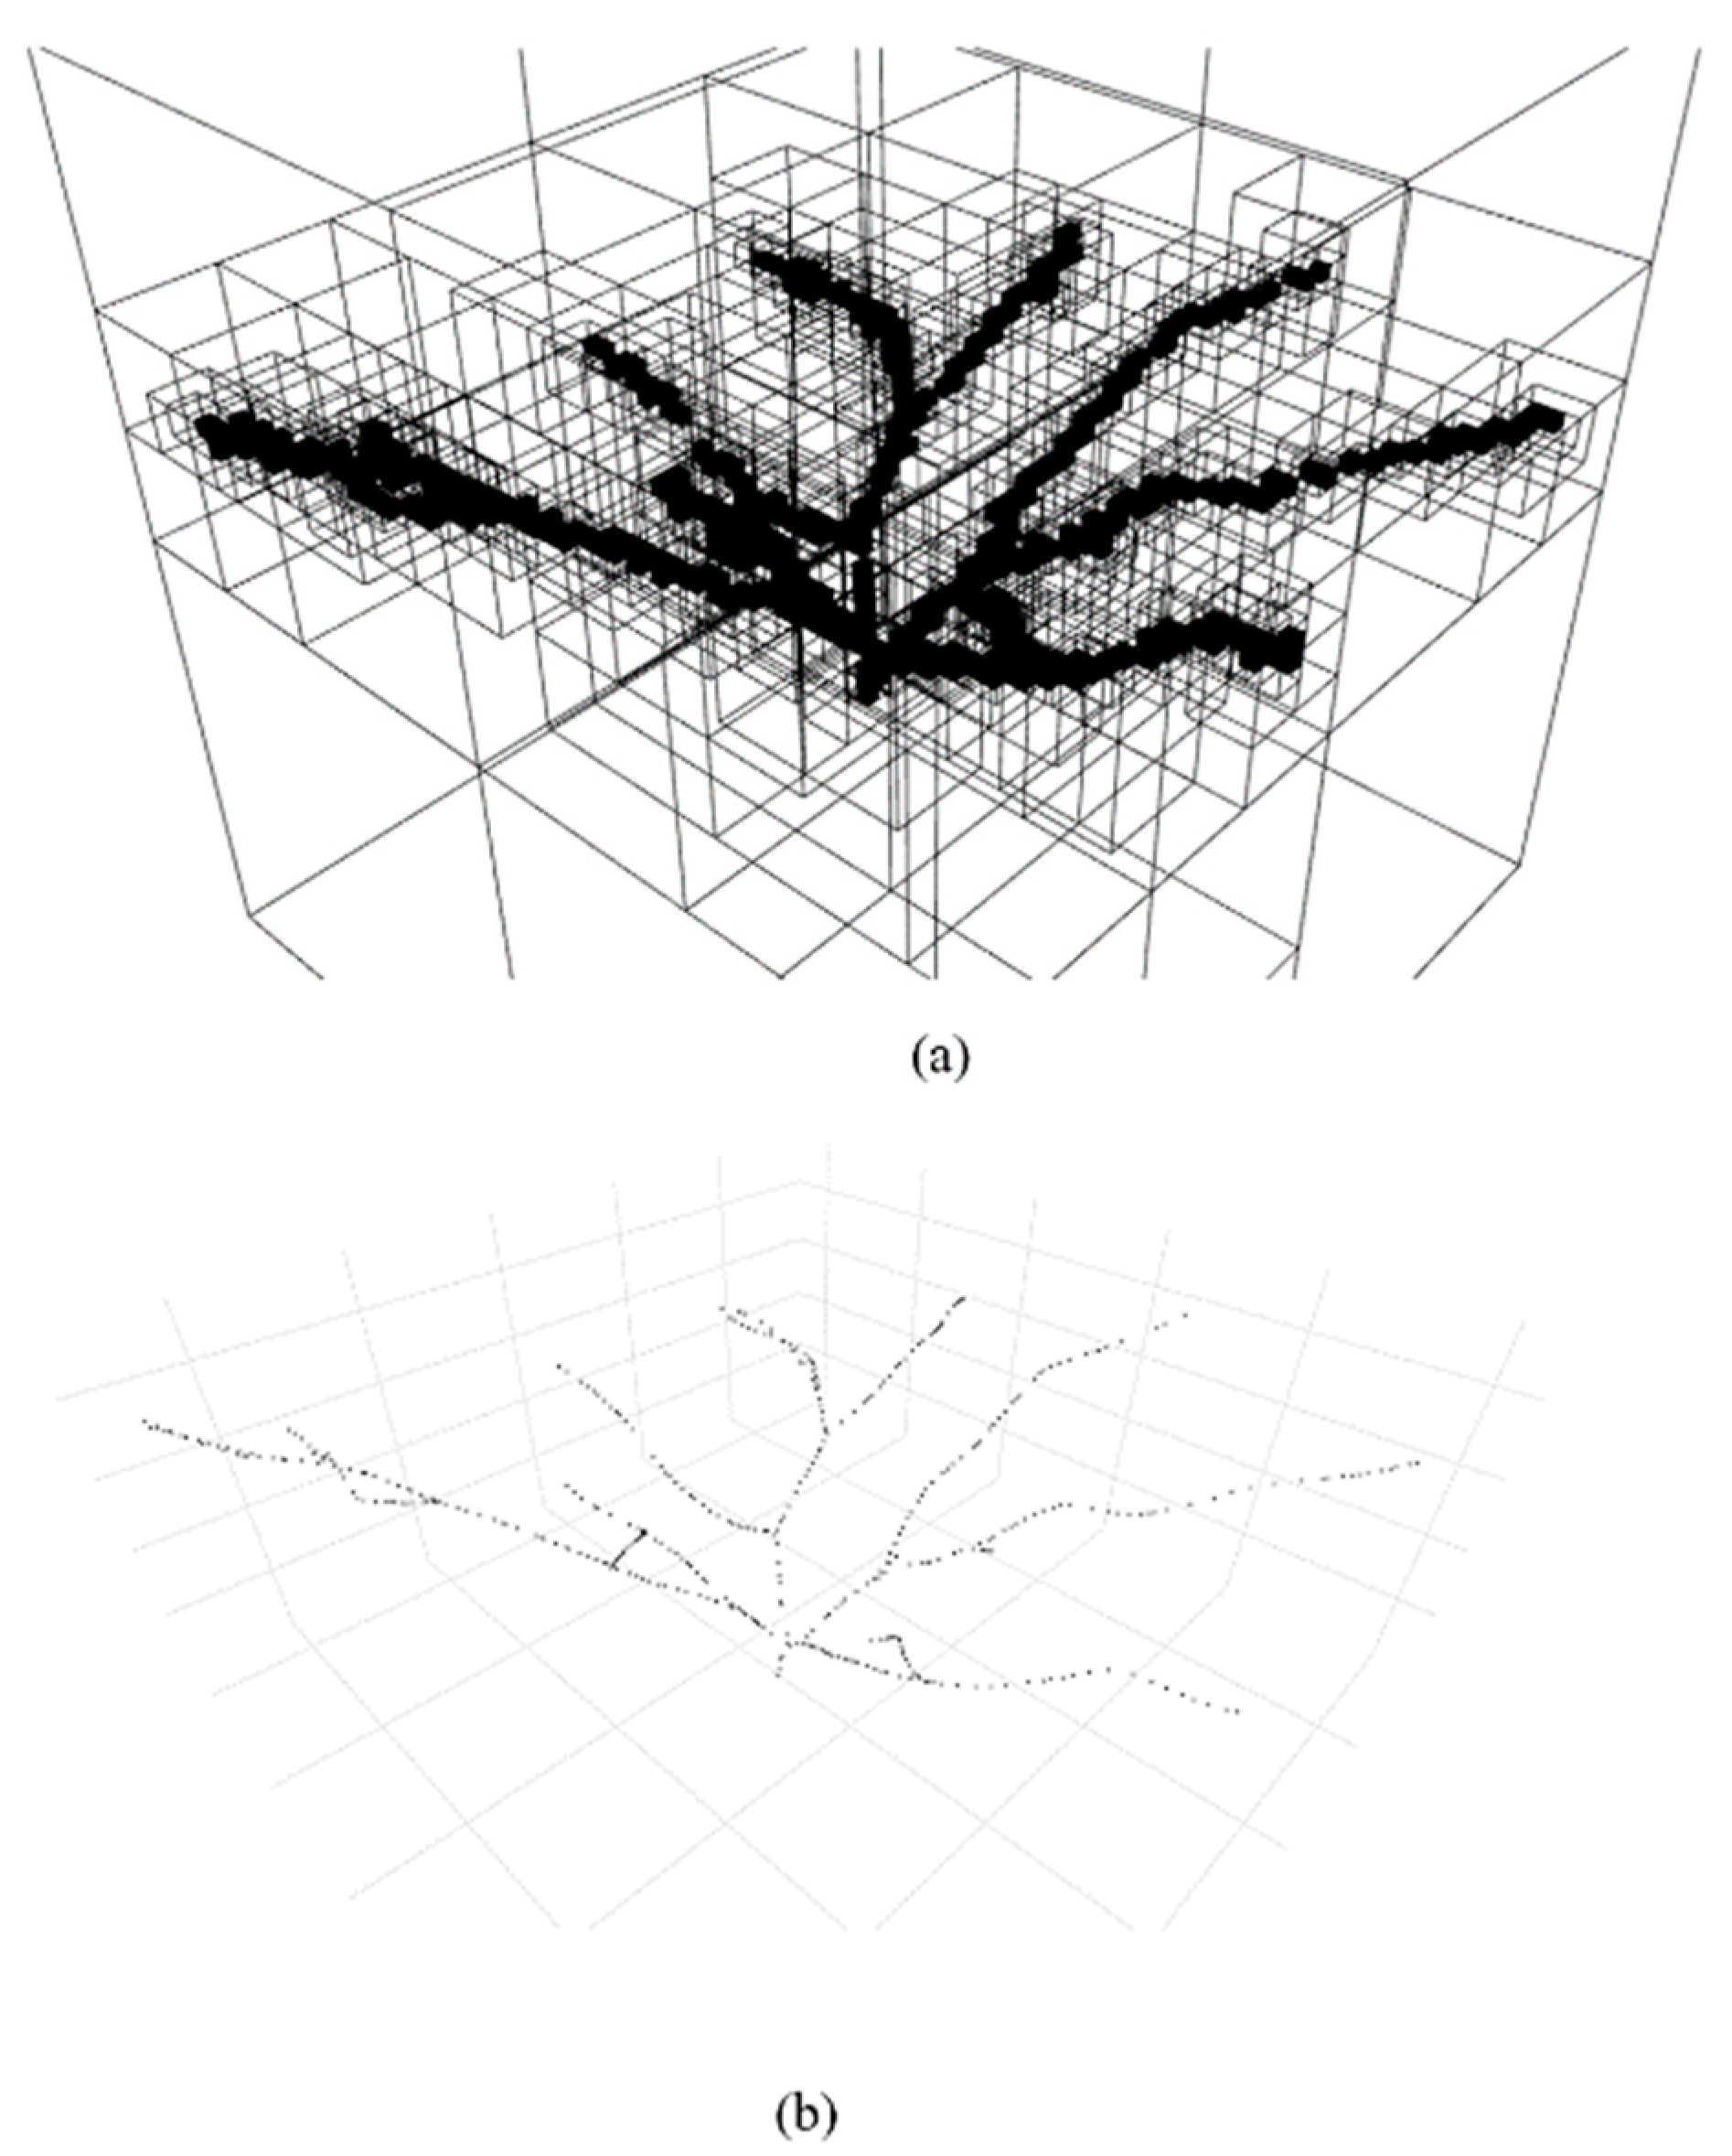
- Skeleton point extraction module: this module is based on the octree algorithm to spatially divide the clustered point cloud and extract the branch skeleton points in the divided subspace.
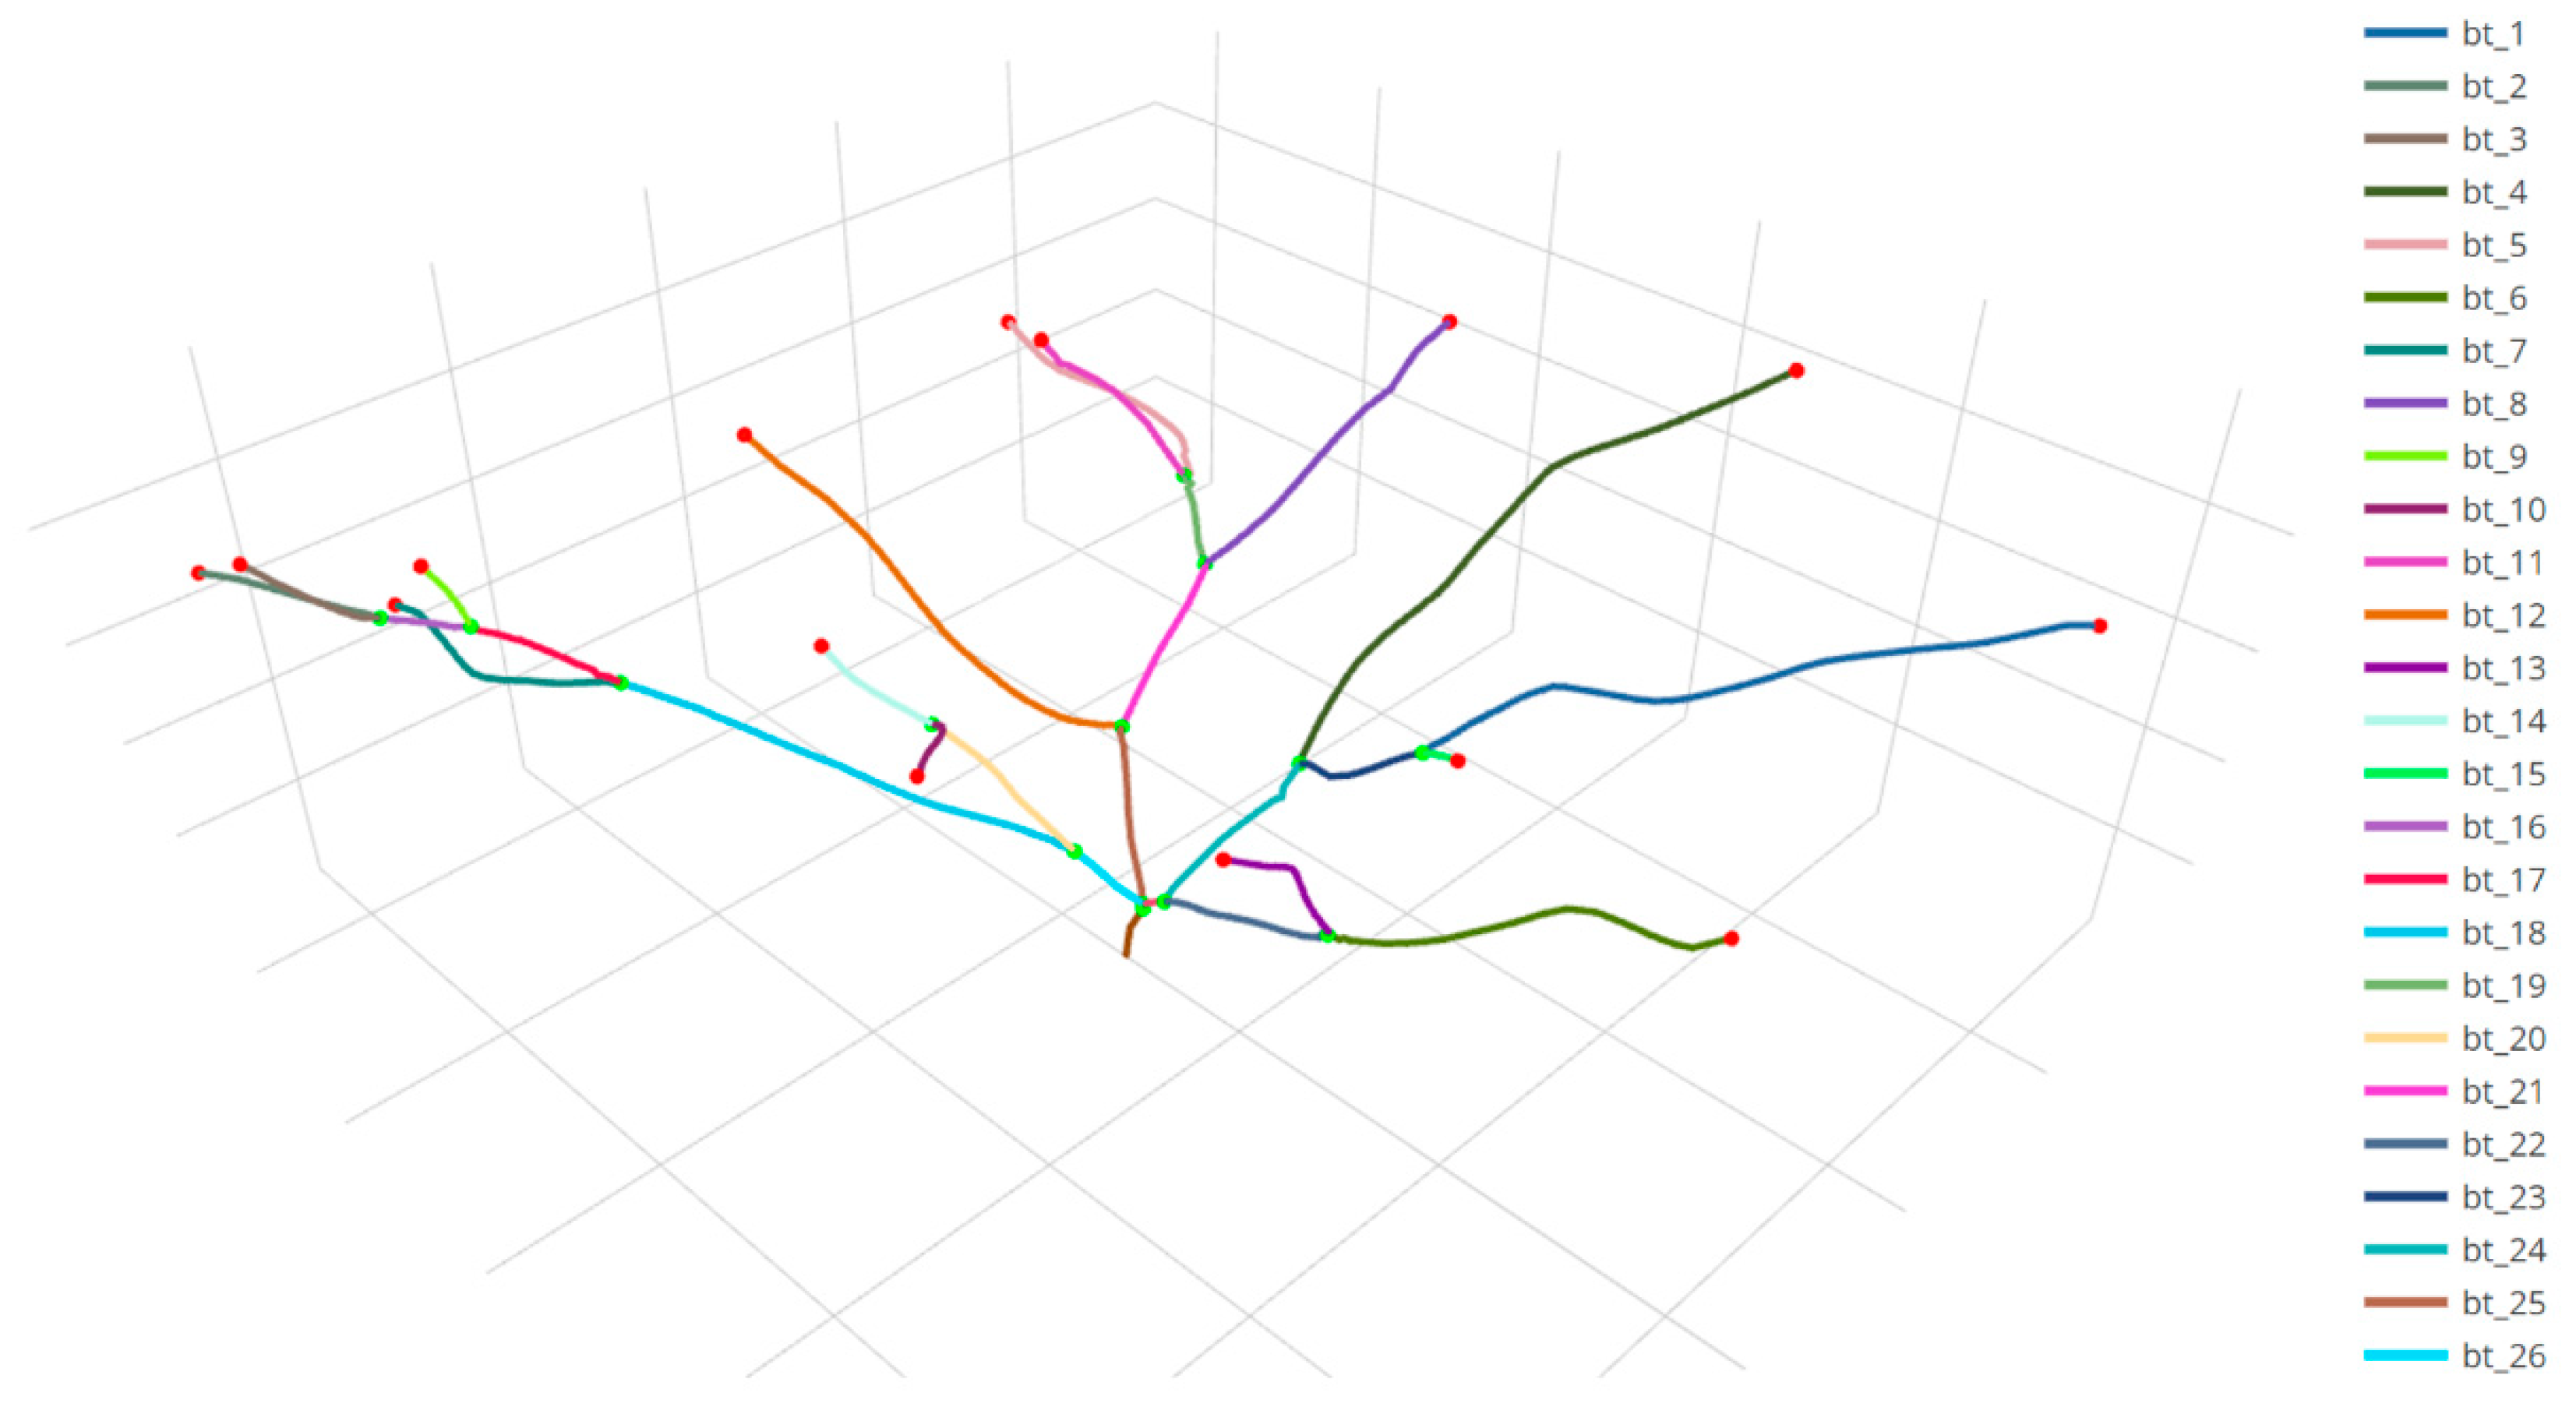
- Skeleton construction module: this module uses the spherical shrinkage based skeleton topology connection method proposed in this paper to form the thick skeleton of the branch.
- Branch skeleton morphology optimization module: this module fine-tunes the positioning of key points in the coarse skeleton first, and then smooths the branch coarse skeleton to output the final fine skeleton.
2.3. Point Cloud Pre-Processing Module
2.4. Skeleton Point Extraction Module
2.5. Skeleton Building Module
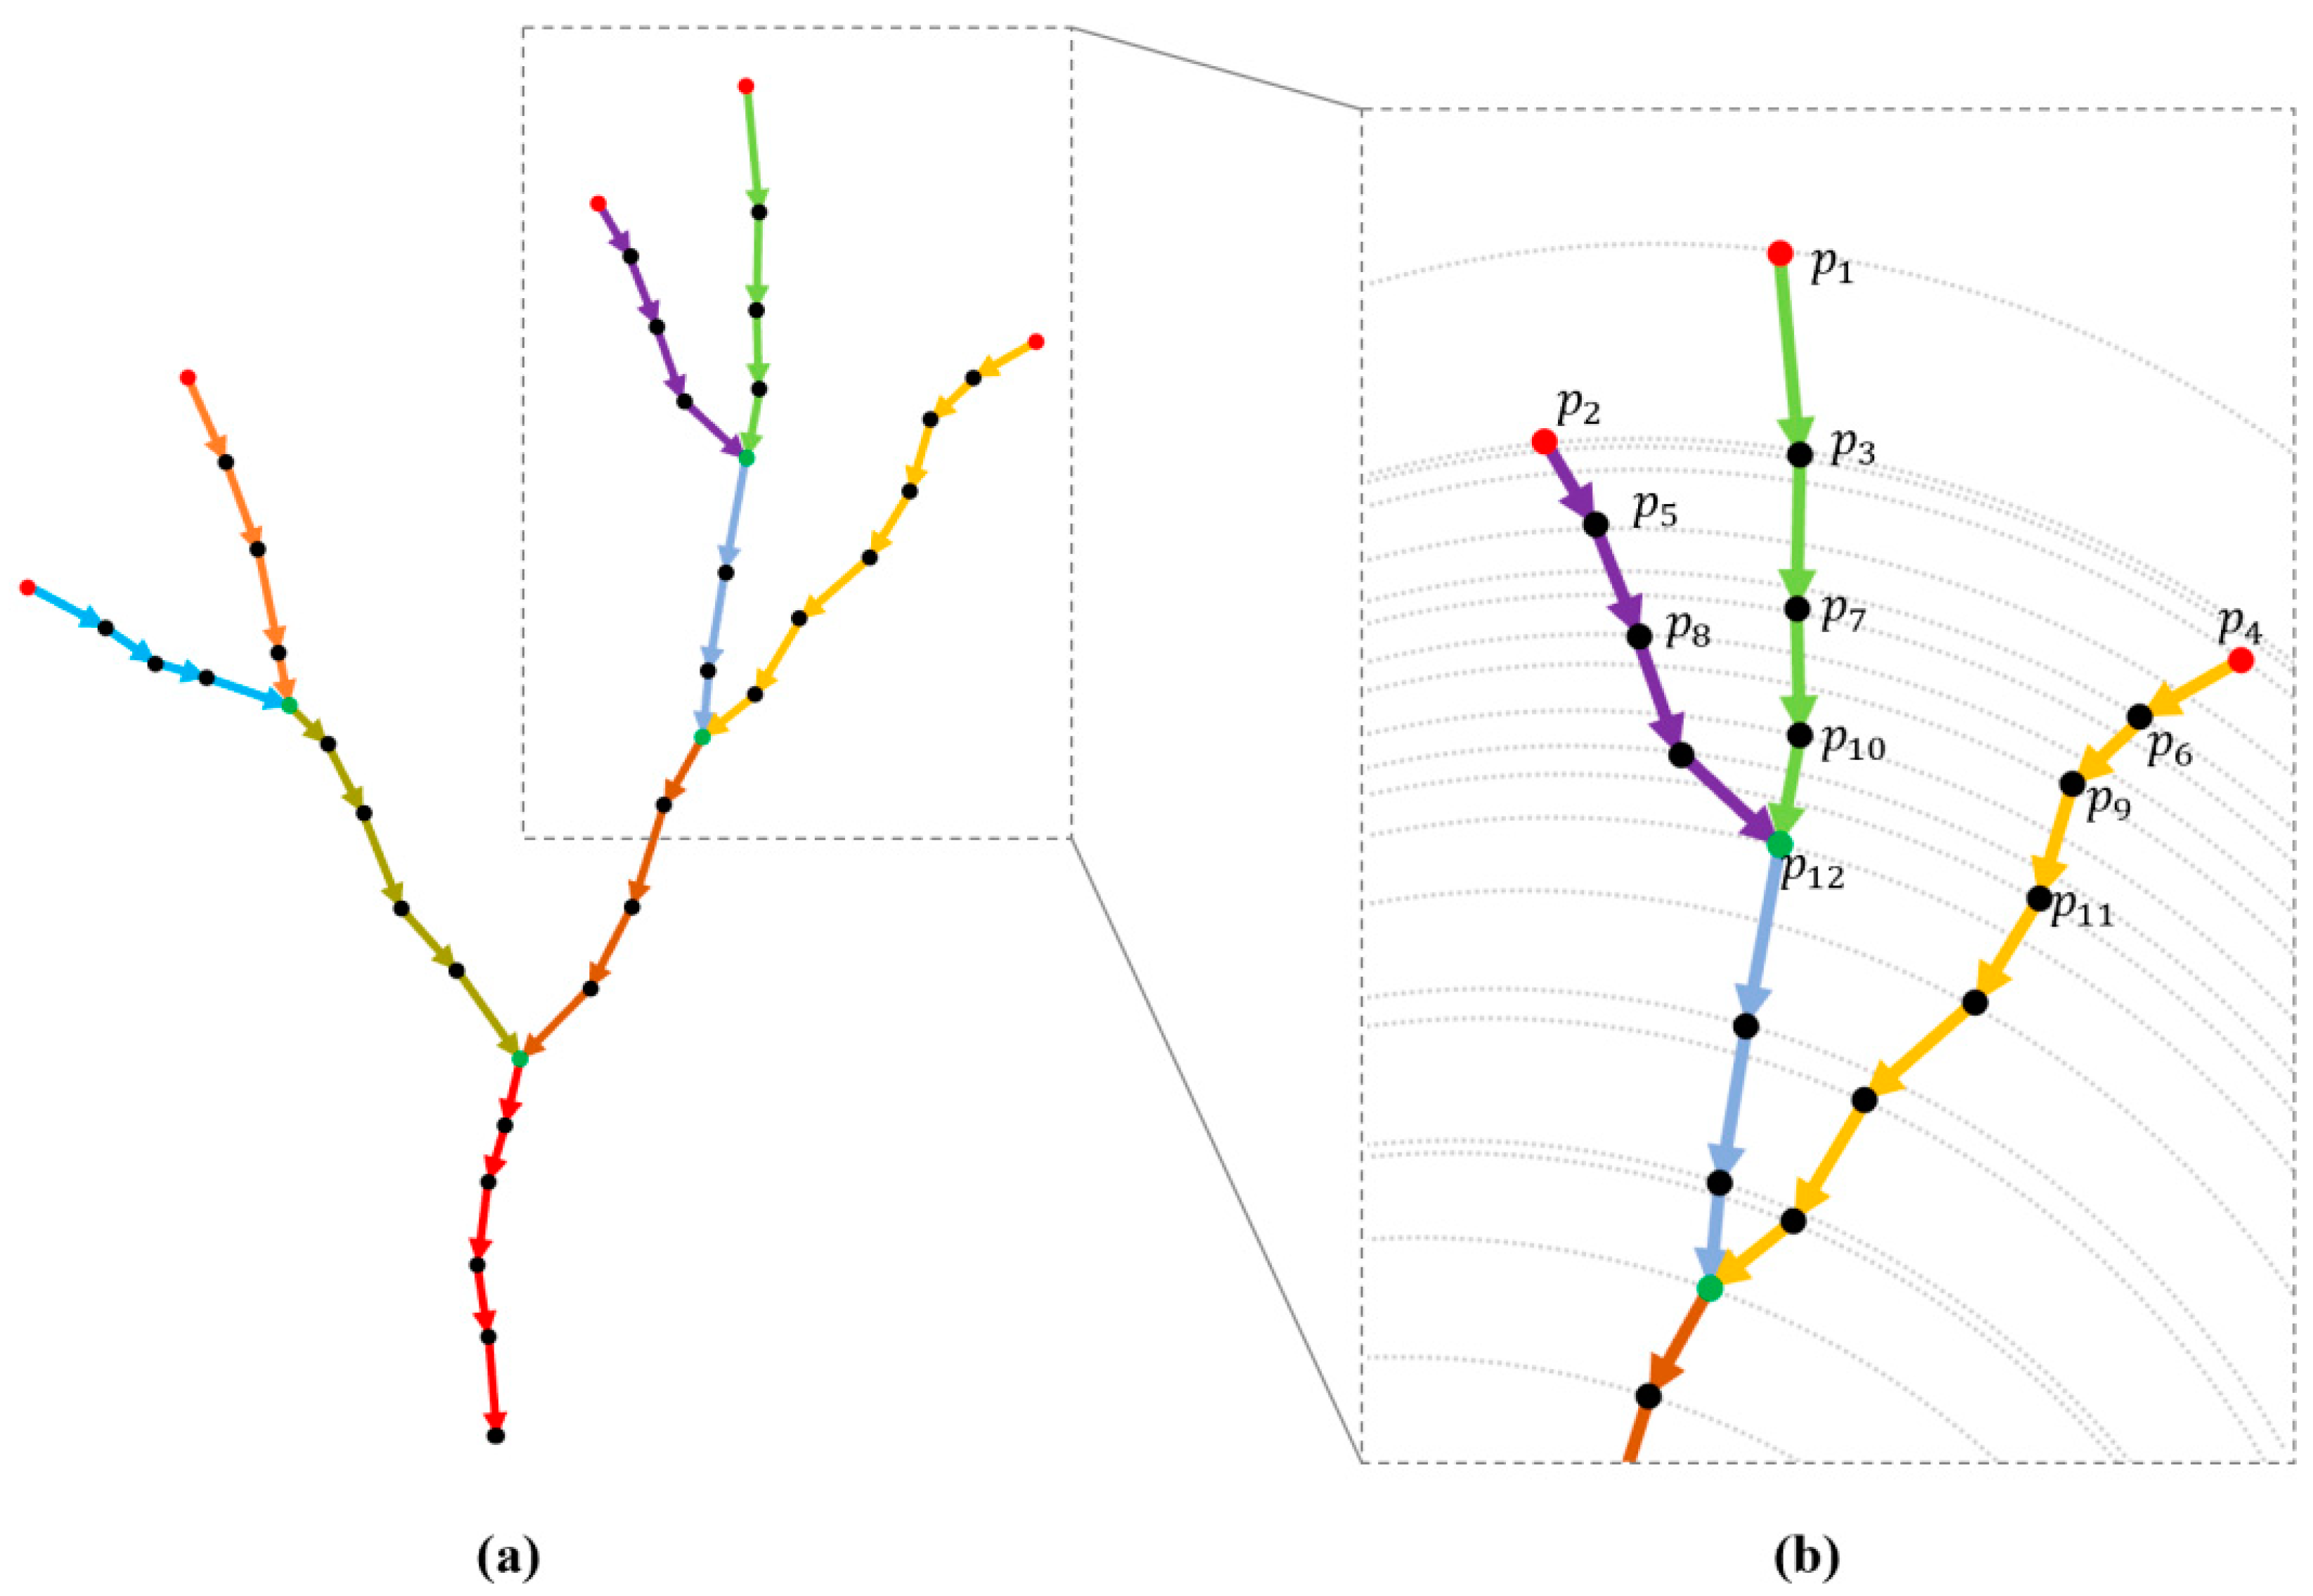
- (1)
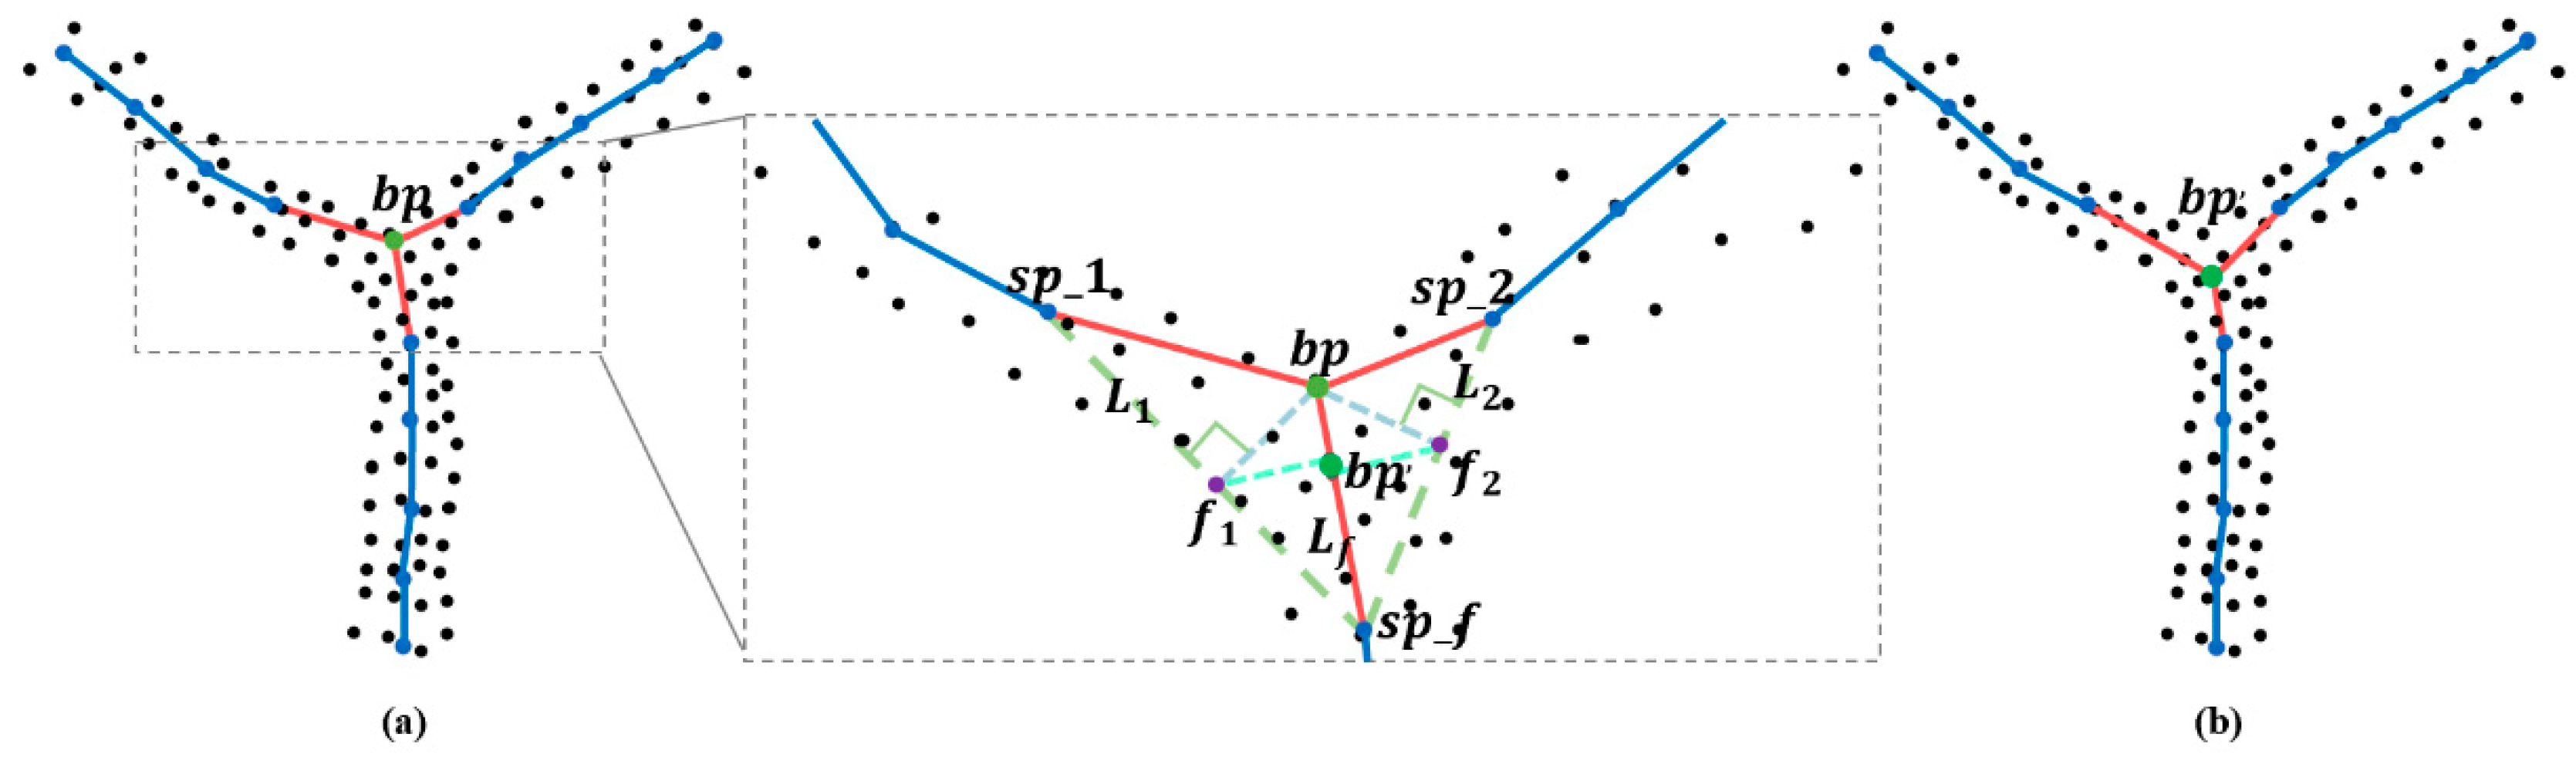
- Firstly, starting from the farthest skeleton point , make a ball with the radius of this point and the root node, connect this point with the nearest skeleton point which is located inside the sphere shell. Following this, select the next far point as the starting point, make a ball with the radius of this point and the root node, select the nearest skeleton point which is located inside the sphere shell to connect, and iterate the above process to traverse all skeleton points.
- (2)
- After all skeleton points are traversed, the of each skeleton point is calculated (: the number of connections between a skeleton point and other skeleton points around it. In this paper, we define for end points, for ordinary branch skeleton points, and for bifurcation points) to extract the end points and bifurcation points in the skeleton points, and calculate each skeleton segment of the branch according to the connection status between the skeleton points.
- (3)
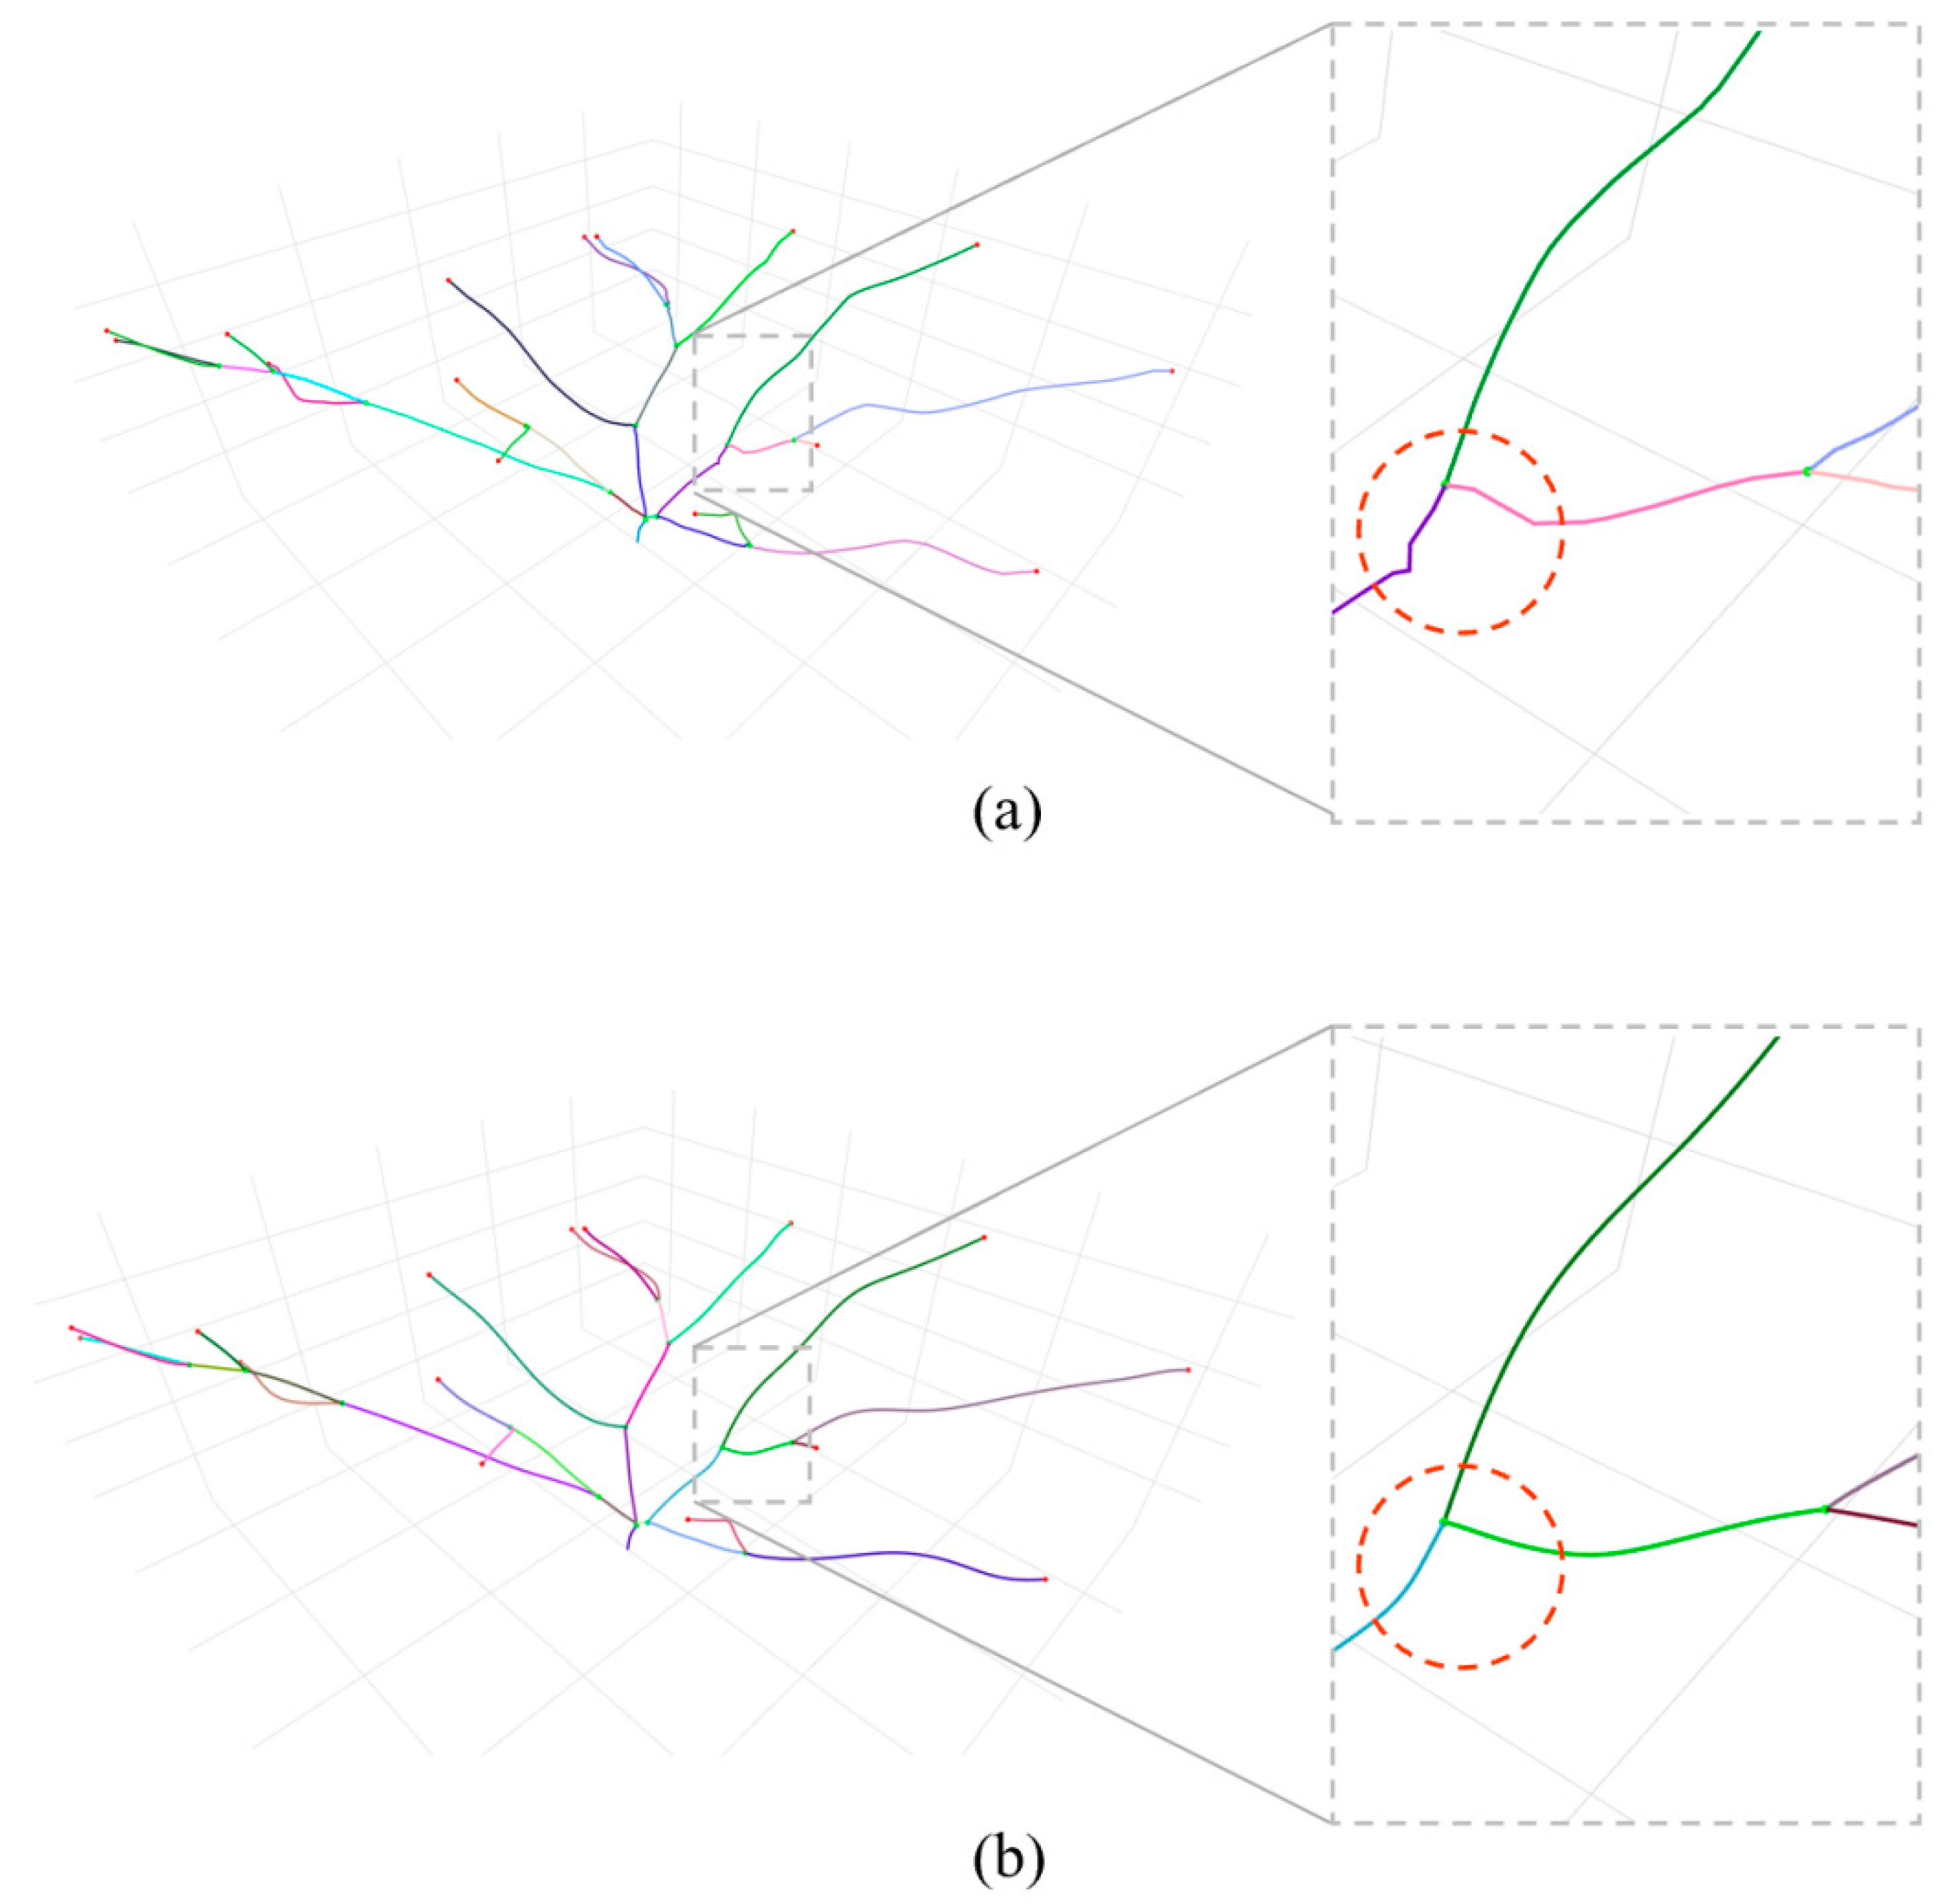
- Due to the possible redundancy of the extracted skeleton points, there may be shorter burr branches (skeleton segments containing fewer skeleton points) in the topologically connected skeleton. Set the threshold value . If the skeleton segment contains skeleton points greater than , the skeleton segment is retained, otherwise the skeleton segment is removed.
2.6. Skeleton Morphology Optimization Module
3. Results
3.1. Evaluation Metrics
3.1.1. Skeleton Topology Accuracy Metrics FBP and FEP
3.1.2. Skeleton Morphological Accuracy Metric HD
3.2. Comparison Experiments
3.2.1. Experimental Environment
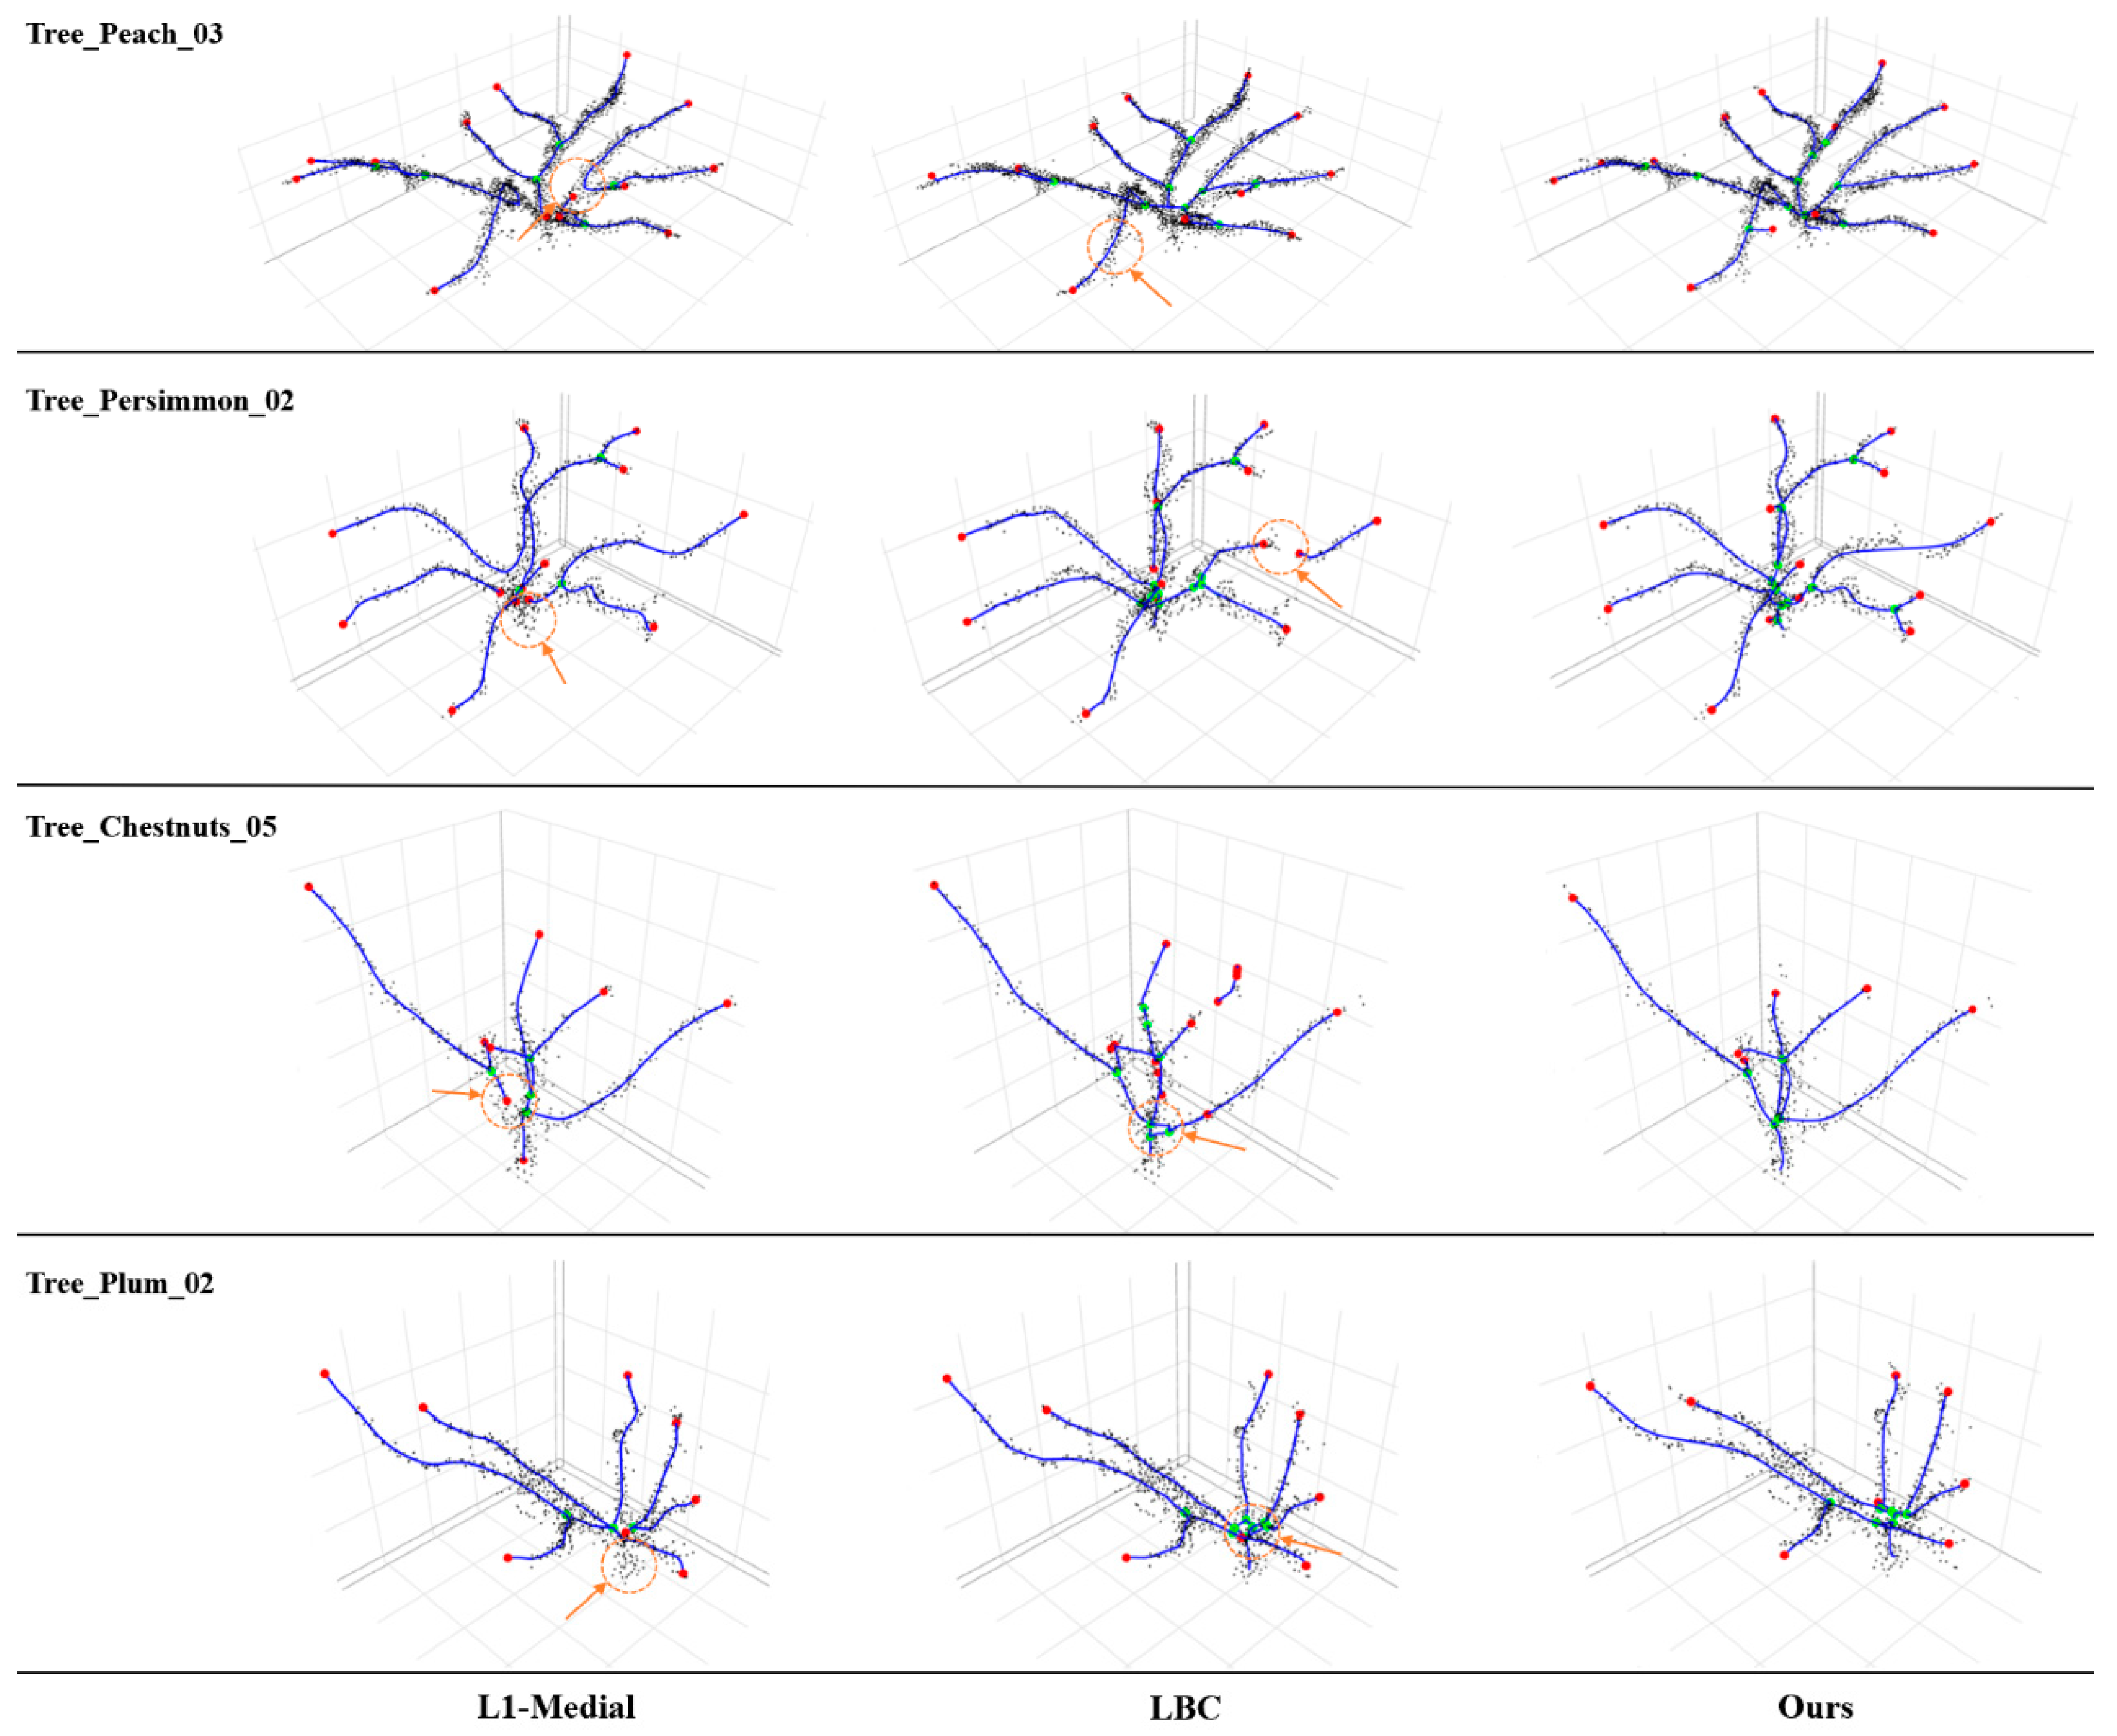
3.2.2. Comparison Experiments
4. Discussion and Conclusions
Author Contributions
Funding
Data Availability Statement
Acknowledgments
Conflicts of Interest
Appendix A. Branch and Trunk Skeleton Key Point Adjustment Strategy


Appendix B. Overview of Experimental Results
| Comparison Experiments | Experimental Content | Figures and Tables |
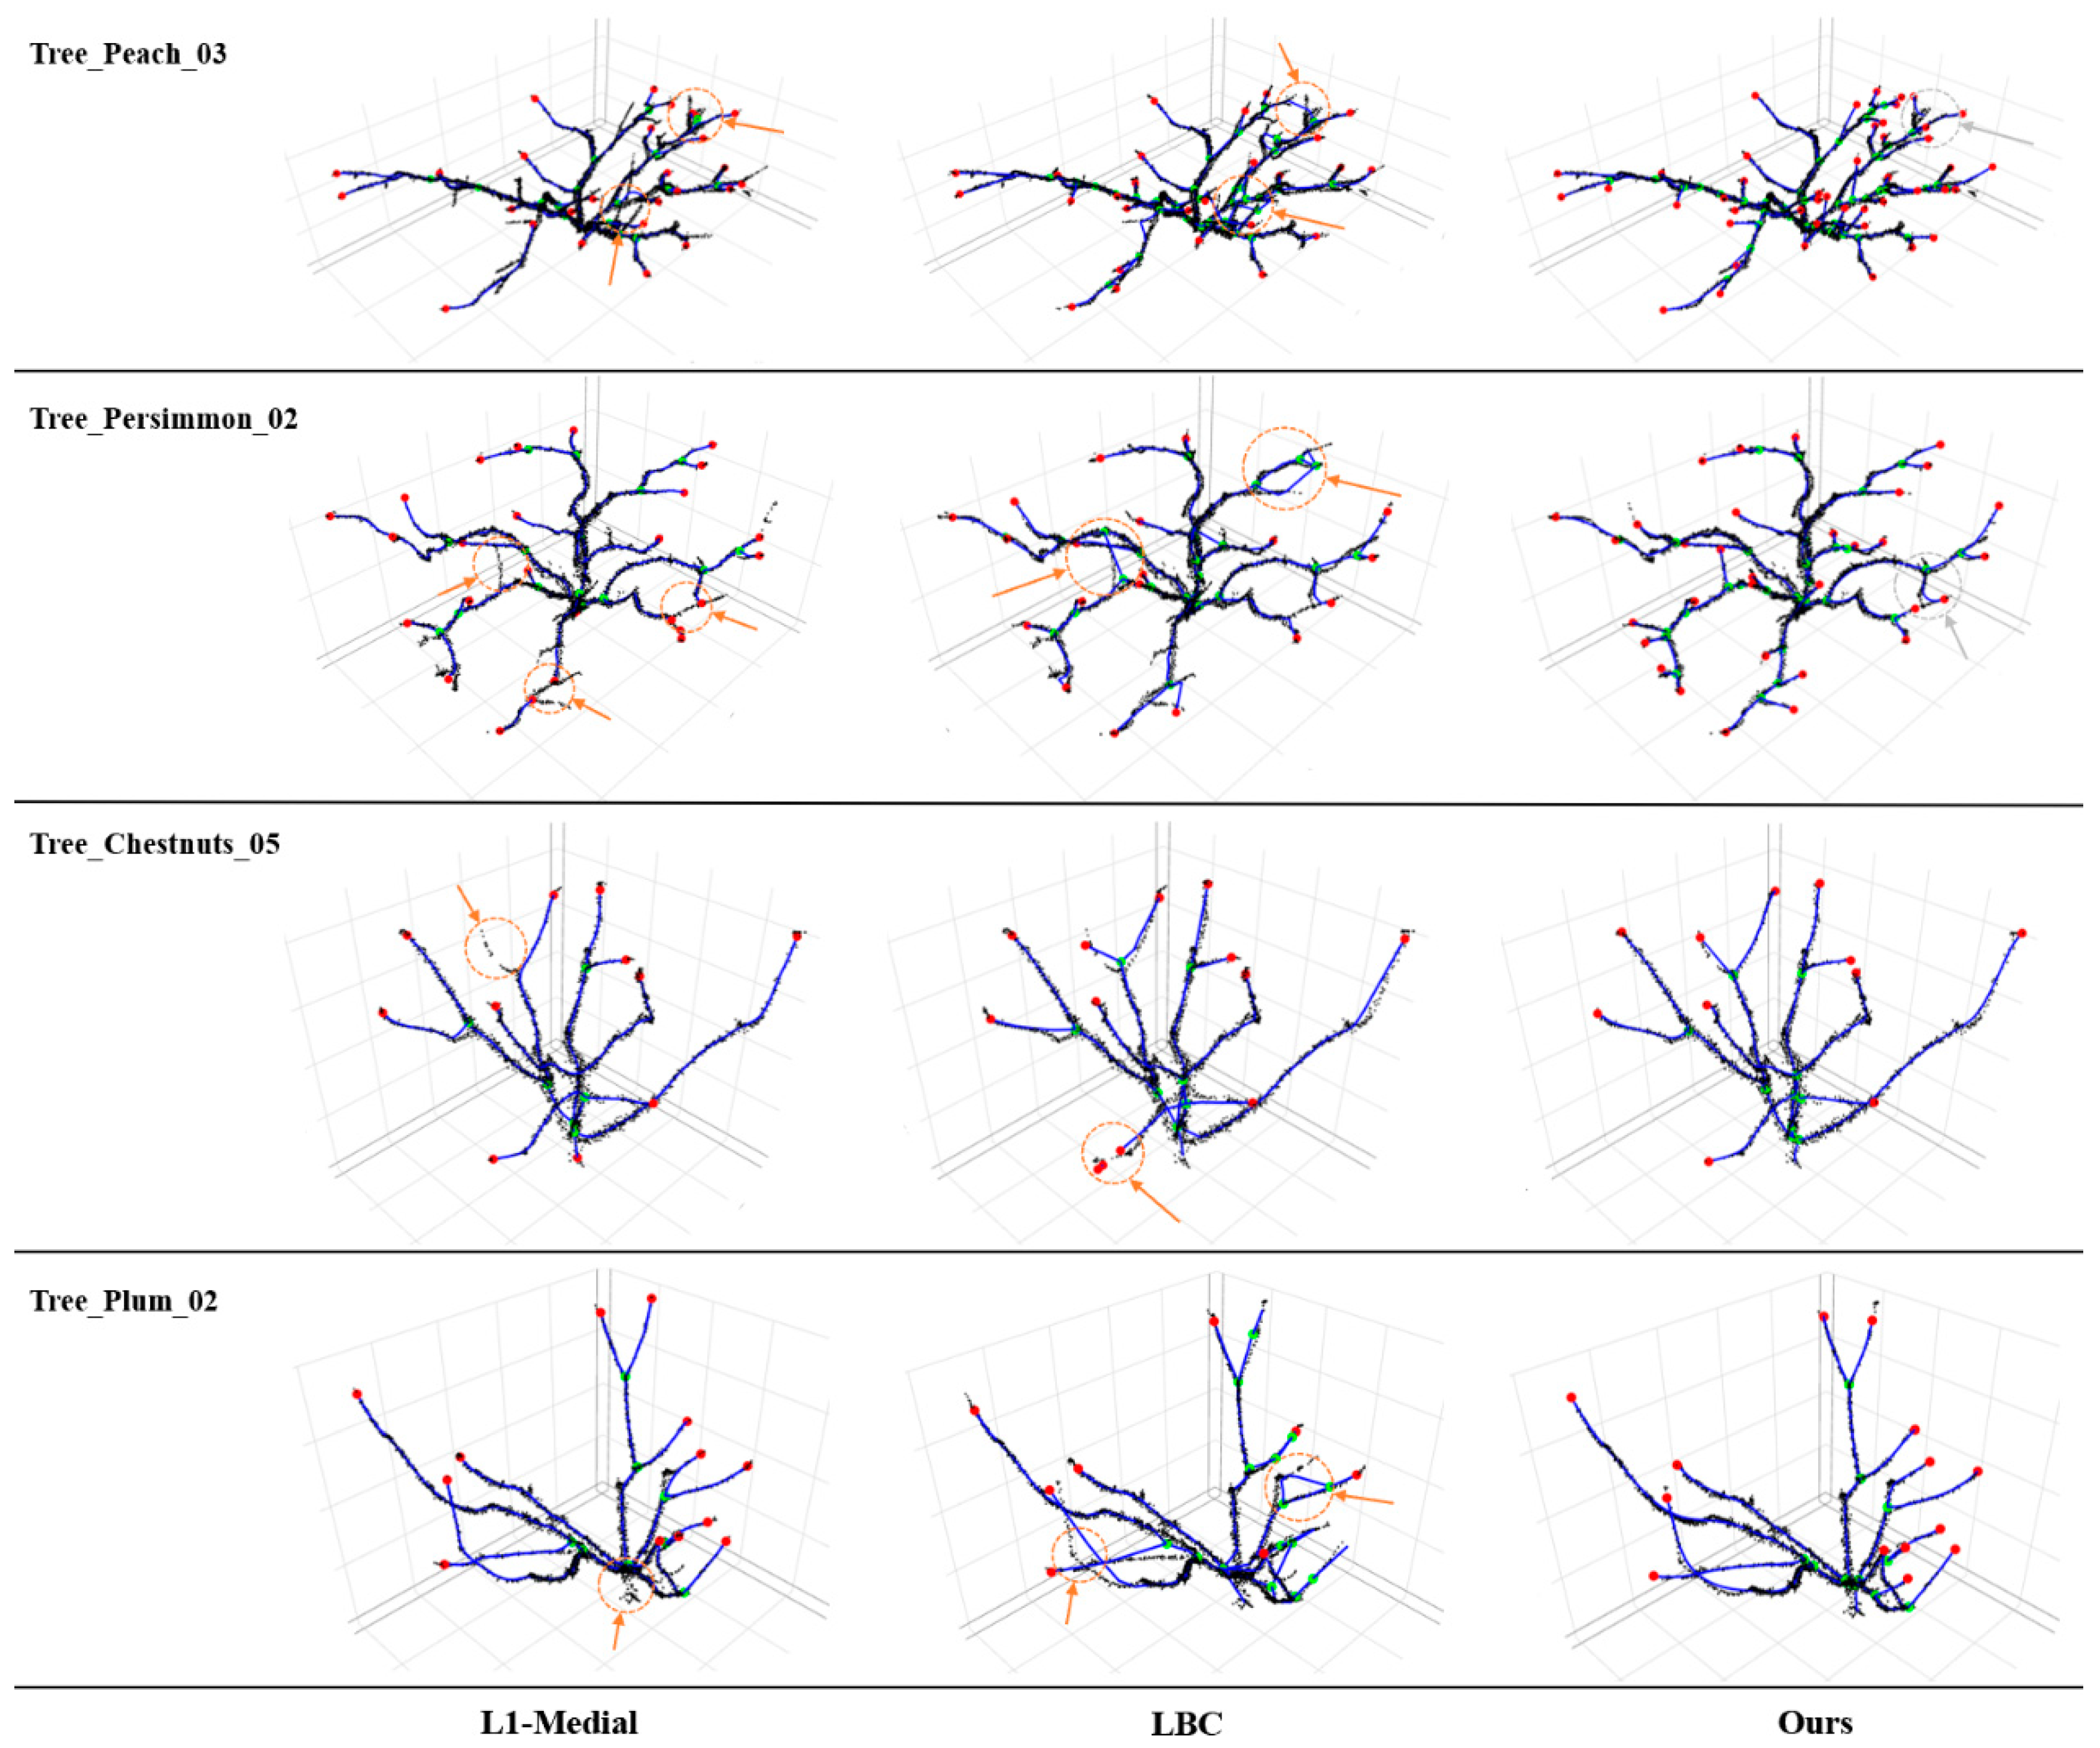
| (1) 50 m altitude comparison experiment | (1-1) Visual analysis of skeleton extraction effect at 50 m altitude | Figure 11 |
| (1-2) Metric analysis of skeleton extraction effect at 50 m altitude | Table 2 Exhibit 1-1 | |
| (1-3) Algorithm stability analysis (analysis of three 50 m altitude experimental metrics) | Appendix C Exhibit 3-1, 3-2, 3-3 Appendix C Exhibit 3-4 | |
| (2) 20 m altitude comparison experiment | (2-1) Visual analysis of skeleton extraction effect at 20 m altitude | Figure 12 |
| (2-2) Metric analysis of skeleton extraction effect at 20 m altitude | Table 2 Exhibit 3-1 | |
| (3) Analysis of experimental results at different altitudes | Analysis of the change of metrics from 50 m to 20 m experimental results | Table 2 Figure 13 Figure 14 |
Appendix C. The Detailed Comparative Experimental Results of This Article
| Tree_Species_Number | Metric | L1-Medial | LBC | Proposed | |
| Tree_Peach_01 | FBP | 66.67% | 58.82% | 85.71% | |
| FEP | 42.11% | 72.73% | 82.35% | ||
| HD | 0.0790 | 0.0756 | 0.0631 | ||
| Tree_Peach_02 | FBP | 81.82% | 76.00% | 85.71% | |
| FEP | 87.50% | 81.25% | 89.66% | ||
| HD | 0.0897 | 0.0399 | 0.0353 | ||
| Tree_Peach_03 | FBP | 66.67% | 47.62% | 76.19% | |
| FEP | 86.96% | 51.67% | 69.57% | ↓ | |
| HD | 0.0495 | 0.0584 | 0.0432 | ||
| Tree_Peach_04 | FBP | 72.00% | 50.00% | 81.48% | |
| FEP | 82.35% | 78.57% | 89.66% | ||
| HD | 0.0502 | 0.0734 | 0.0394 | ||
| Tree_Peach_05 | FBP | 66.67% | 55.56% | 88.89% | |
| FEP | 69.23% | 90.91% | 86.96% | ↓ | |
| HD | 0.0410 | 0.0398 | 0.0354 | ||
| Average_Peach | FBP | 70.76% | 57.60% | 83.60% | |
| FEP | 73.63% | 75.02% | 83.64% | ||
| HD | 0.0647 | 0.0574 | 0.0433 | ||
| Tree_Persimmon_01 | FBP | 42.86% | 62.50% | 80.00% | |
| FEP | 81.82% | 92.31% | 86.49% | ↓ | |
| HD | 0.1043 | 0.0479 | 0.0412 | ||
| Tree_Persimmon_02 | FBP | 58.52% | 55.17% | 68.97% | |
| FEP | 62.50% | 66.67% | 87.50% | ||
| HD | 0.0851 | 0.0772 | 0.0750 | ||
| Tree_Persimmon_03 | FBP | 58.82% | 66.67% | 85.71% | |
| FEP | 53.33% | 86.96% | 86.96% | ||
| HD | 0.0963 | 0.0535 | 0.0461 | ||
| Tree_Persimmon_04 | FBP | 80.00% | 70.59% | 78.26% | ↓ |
| FEP | 34.48% | 55.17% | 77.42% | ||
| HD | 0.0809 | 0.0709 | 0.0739 | ↑ | |
| Tree_Persimmon_05 | FBP | 50.00% | 35.71% | 60.87% | |
| FEP | 75.86% | 35.71% | 88.89% | ||
| HD | 0.0725 | 0.0658 | 0.0547 | ||
| Average_Persimmon | FBP | 58.04% | 58.13% | 74.76% | |
| FEP | 61.60% | 67.36% | 85.45% | ||
| HD | 0.0878 | 0.0630 | 0.0582 | ||
| Tree_Chestnuts_01 | FBP | 23.16% | 31.58% | 46.15% | |
| FEP | 40.00% | 22.22% | 47.06% | ||
| HD | 0.0909 | 0.1132 | 0.0647 | ||
| Tree_Chestnuts_02 | FBP | 22.22% | 12.50% | 33.33% | |
| FEP | 47.06% | 38.10% | 40.67% | ↓ | |
| HD | 0.1582 | 0.1743 | 0.1406 | ||
| Tree_Chestnuts_03 | FBP | 33.33% | 55.17% | 55.17% | |
| FEP | 34.48% | 47.62% | 58.82% | ||
| HD | 0.0591 | 0.0605 | 0.0807 | ↑ | |
| Tree_Chestnuts_04 | FBP | 40.00% | 12.50% | 22.22% | ↓ |
| FEP | 53.33% | 19.05% | 46.15% | ||
| HD | 0.1325 | 0.0953 | 0.1023 | ↑ | |
| Tree_Chestnuts_05 | FBP | 50.00% | 40.00% | 72.73% | |
| FEP | 37.50% | 40.00% | 50.00% | ||
| HD | 0.1250 | 0.0728 | 0.0662 | ||
| Average_Chestnuts | FBP | 33.74% | 30.35% | 45.92% | |
| FEP | 42.48% | 33.40% | 48.54% | ||
| HD | 0.1094 | 0.1032 | 0.0909 | ||
| Tree_Plum_01 | FBP | 36.36% | 28.57% | 42.86% | |
| FEP | 70.59% | 52.17% | 58.82% | ↓ | |
| HD | 0.0845 | 0.1023 | 0.0818 | ||
| Tree_Plum_02 | FBP | 22.22% | 54.55% | 61.54% | |
| FEP | 66.67% | 26.67% | 66.67% | ||
| HD | 0.1365 | 0.1036 | 0.0770 | ||
| Tree_Plum_03 | FBP | 60.00% | 26.67% | 57.14% | ↓ |
| FEP | 30.77% | 11.11% | 56.92% | ||
| HD | 0.1611 | 0.0773 | 0.0993 | ↑ | |
| Tree_Plum_04 | FBP | 25.00% | 9.52% | 40.00% | |
| FEP | 71.43% | 50.00% | 66.67% | ↓ | |
| HD | 0.1154 | 0.1147 | 0.0683 | ||
| Tree_Plum_05 | FBP | 60.00% | 42.86% | 60.00% | |
| FEP | 61.54% | 42.11% | 61.54% | ||
| HD | 0.129 | 0.136 | 0.109 | ||
| Average_Plum | FBP | 40.72% | 32.43% | 52.31% | |
| FEP | 60.20% | 36.41% | 62.12% | ||
| HD | 0.1184 | 0.1068 | 0.0871 | ||
| Average_Total | FBP | 50.82% | 44.63% | 64.15% | |
| FEP | 59.48% | 53.05% | 69.94% | ||
| HD | 0.0951 | 0.0826 | 0.0699 | ||
| Tree_Species_Number | Metric | L1-Medial | LBC | Proposed | |
| Tree_Peach_01 | FBP | 61.54% | 58.82% | 85.71% | |
| FEP | 66.67% | 72.73% | 82.35% | ||
| HD | 0.0781 | 0.0716 | 0.0628 | ||
| Tree_Peach_02 | FBP | 66.67% | 76.00% | 85.71% | |
| FEP | 85.71% | 81.25% | 89.66% | ||
| HD | 0.0927 | 0.0417 | 0.0367 | ||
| Tree_Peach_03 | FBP | 63.16% | 42.11% | 72.73% | |
| FEP | 83.33% | 51.67% | 66.67% | ↓ | |
| HD | 0.0483 | 0.0563 | 0.0453 | ||
| Tree_Peach_04 | FBP | 72.00% | 59.26% | 88.89% | |
| FEP | 80.00% | 81.48% | 89.66% | ||
| HD | 0.0579 | 0.0397 | 0.0359 | ||
| Tree_Peach_05 | FBP | 66.67% | 52.63% | 88.89% | |
| FEP | 76.92% | 90.91% | 86.96% | ↓ | |
| HD | 0.0635 | 0.0372 | 0.0332 | ||
| Average_Peach | FBP | 66.01% | 57.76% | 84.39% | |
| FEP | 78.53% | 75.61% | 83.06% | ||
| HD | 0.0698 | 0.0493 | 0.0428 | ||
| Tree_Persimmon_01 | FBP | 60.00% | 52.94% | 80.00% | |
| FEP | 95.00% | 91.89% | 89.47% | ↓ | |
| HD | 0.1129 | 0.0547 | 0.0450 | ||
| Tree_Persimmon_02 | FBP | 60.00% | 46.67% | 69.57% | |
| FEP | 68.57% | 73.33% | 76.47% | ||
| HD | 0.0805 | 0.0798 | 0.0703 | ||
| Tree_Persimmon_03 | FBP | 53.33% | 72.73% | 66.67% | |
| FEP | 54.55% | 86.96% | 86.96% | ||
| HD | 0.1277 | 0.0706 | 0.0504 | ||
| Tree_Persimmon_04 | FBP | 78.79% | 75.86% | 75.86% | ↓ |
| FEP | 66.67% | 66.67% | 90.91% | ||
| HD | 0.0784 | 0.0689 | 0.0694 | ↑ | |
| Tree_Persimmon_05 | FBP | 70.00% | 34.48% | 60.87% | |
| FEP | 81.48% | 35.71% | 88.89% | ||
| HD | 0.0710 | 0.0646 | 0.0503 | ||
| Average_Persimmon | FBP | 64.42% | 56.54% | 70.59% | |
| FEP | 73.25% | 70.91% | 86.54% | ||
| HD | 0.0972 | 0.0677 | 0.0571 | ||
| Tree_Chestnuts_01 | FBP | 23.16% | 31.58% | 46.15% | |
| FEP | 40.00% | 22.22% | 47.06% | ||
| HD | 0.1017 | 0.1078 | 0.0650 | ||
| Tree_Chestnuts_02 | FBP | 22.22% | 11.77% | 33.33% | |
| FEP | 47.06% | 42.11% | 40.67% | ↓ | |
| HD | 0.1563 | 0.1708 | 0.1418 | ||
| Tree_Chestnuts_03 | FBP | 33.33% | 55.17% | 55.17% | |
| FEP | 34.48% | 47.62% | 58.82% | ||
| HD | 0.0573 | 0.0619 | 0.0791 | ↑ | |
| Tree_Chestnuts_04 | FBP | 40.00% | 10.53% | 22.22% | ↓ |
| FEP | 53.33% | 17.39% | 46.15% | ||
| HD | 0.1265 | 0.0922 | 0.1086 | ↑ | |
| Tree_Chestnuts_05 | FBP | 50.00% | 41.67% | 50.00% | |
| FEP | 37.50% | 40.00% | 50.00% | ||
| HD | 0.1293 | 0.0747 | 0.0658 | ||
| Average_Chestnuts | FBP | 33.74% | 30.14% | 41.38% | |
| FEP | 42.48% | 33.87% | 48.54% | ||
| HD | 0.1121 | 0.1015 | 0.0921 | ||
| Tree_Plum_01 | FBP | 36.36% | 28.57% | 42.86% | |
| FEP | 70.59% | 52.17% | 58.82% | ↓ | |
| HD | 0.0864 | 0.0865 | 0.0793 | ||
| Tree_Plum_02 | FBP | 22.22% | 50.00% | 76.92% | |
| FEP | 70.59% | 37.50% | 66.67% | ||
| HD | 0.1018 | 0.0987 | 0.0750 | ||
| Tree_Plum_03 | FBP | 60.00% | 37.50% | 57.14% | ↓ |
| FEP | 30.77% | 11.11% | 56.92% | ||
| HD | 0.1736 | 0.0801 | 0.0984 | ↑ | |
| Tree_Plum_04 | FBP | 25.00% | 9.52% | 36.36% | |
| FEP | 71.43% | 50.00% | 66.67% | ↓ | |
| HD | 0.1113 | 0.1320 | 0.0656 | ||
| Tree_Plum_05 | FBP | 60.00% | 42.86% | 60.00% | |
| FEP | 66.67% | 42.11% | 72.34% | ||
| HD | 0.1701 | 0.1382 | 0.1186 | ||
| Average_Plum | FBP | 40.72% | 33.69% | 54.66% | |
| FEP | 62.01% | 38.58% | 64.28% | ||
| HD | 0.1216 | 0.1071 | 0.0874 | ||
| Average_Total | FBP | 51.22% | 44.53% | 62.75% | |
| FEP | 64.07% | 54.74% | 70.61% | ||
| HD | 0.1002 | 0.0814 | 0.0698 | ||
| Tree_Species_Number | Metric | L1-Medial | LBC | Proposed | |
| Tree_Peach_01 | FBP | 76.92% | 58.82% | 85.71% | |
| FEP | 66.67% | 63.64% | 82.35% | ||
| HD | 0.0786 | 0.0692 | 0.0651 | ||
| Tree_Peach_02 | FBP | 83.33% | 76.00% | 88.00% | |
| FEP | 85.71% | 81.25% | 89.66% | ||
| HD | 0.0880 | 0.0407 | 0.0390 | ||
| Tree_Peach_03 | FBP | 63.16% | 38.10% | 76.19% | |
| FEP | 76.92% | 51.67% | 69.57% | ↓ | |
| HD | 0.0490 | 0.0521 | 0.0456 | ||
| Tree_Peach_04 | FBP | 69.57% | 46.15% | 81.48% | |
| FEP | 78.57% | 85.71% | 89.66% | ||
| HD | 0.0557 | 0.0650 | 0.0343 | ||
| Tree_Peach_05 | FBP | 80.00% | 44.44% | 88.89% | |
| FEP | 80.00% | 90.91% | 86.96% | ↓ | |
| HD | 0.0512 | 0.0392 | 0.0333 | ||
| Average_Peach | FBP | 74.60% | 52.70% | 84.05% | |
| FEP | 77.58% | 74.64% | 83.64% | ||
| HD | 0.0669 | 0.0532 | 0.0435 | ||
| Tree_Persimmon_01 | FBP | 53.85% | 56.25% | 80.00% | |
| FEP | 81.82% | 91.89% | 89.47% | ↓ | |
| HD | 0.0505 | 0.0533 | 0.0489 | ||
| Tree_Persimmon_02 | FBP | 60.00% | 57.14% | 69.57% | |
| FEP | 62.07% | 75.00% | 76.47% | ||
| HD | 0.0817 | 0.0797 | 0.0723 | ||
| Tree_Persimmon_03 | FBP | 57.14% | 66.67% | 66.67% | |
| FEP | 60.87% | 86.96% | 86.96% | ||
| HD | 0.1213 | 0.0739 | 0.0557 | ||
| Tree_Persimmon_04 | FBP | 78.79% | 68.97% | 75.86% | ↓ |
| FEP | 90.91% | 60.00% | 90.91% | ||
| HD | 0.0977 | 0.0681 | 0.0685 | ↑ | |
| Tree_Persimmon_05 | FBP | 55.56% | 31.25% | 60.87% | |
| FEP | 62.86% | 35.71% | 88.89% | ||
| HD | 0.0800 | 0.0688 | 0.0422 | ||
| Average_Persimmon | FBP | 61.07% | 56.06% | 70.59% | |
| FEP | 0.7170 | 0.6991 | 0.8654 | ||
| HD | 0.0862 | 0.0687 | 0.0575 | ||
| Tree_Chestnuts_01 | FBP | 16.67% | 40.00% | 42.86% | |
| FEP | 33.33% | 21.05% | 66.67% | ||
| HD | 0.0921 | 0.0904 | 0.0625 | ||
| Tree_Chestnuts_02 | FBP | 22.22% | 11.77% | 33.33% | |
| FEP | 47.06% | 40.00% | 40.67% | ↓ | |
| HD | 0.1513 | 0.1542 | 0.1458 | ||
| Tree_Chestnuts_03 | FBP | 33.33% | 55.17% | 55.17% | |
| FEP | 34.48% | 47.62% | 58.82% | ||
| HD | 0.0656 | 0.0685 | 0.0776 | ↑ | |
| Tree_Chestnuts_04 | FBP | 40.00% | 9.52% | 22.22% | ↓ |
| FEP | 53.33% | 17.39% | 46.15% | ||
| HD | 0.1189 | 0.0790 | 0.0977 | ↑ | |
| Tree_Chestnuts_05 | FBP | 66.67% | 41.67% | 66.67% | |
| FEP | 50.00% | 42.86% | 50.00% | ||
| HD | 0.1036 | 0.0870 | 0.0669 | ||
| Average_Chestnuts | FBP | 35.78% | 31.63% | 44.05% | |
| FEP | 43.64% | 33.78% | 52.46% | ||
| HD | 0.1039 | 0.0958 | 0.0901 | ||
| Tree_Plum_01 | FBP | 36.36% | 26.09% | 42.86% | |
| FEP | 68.52% | 50.00% | 58.82% | ↓ | |
| HD | 0.0867 | 0.0973 | 0.0810 | ||
| Tree_Plum_02 | FBP | 22.22% | 50.00% | 76.92% | |
| FEP | 66.67% | 25.00% | 72.34% | ||
| HD | 0.1060 | 0.1252 | 0.0609 | ||
| Tree_Plum_03 | FBP | 60.00% | 31.53% | 57.14% | ↓ |
| FEP | 30.77% | 11.11% | 47.09% | ||
| HD | 0.1412 | 0.0793 | 0.0870 | ↑ | |
| Tree_Plum_04 | FBP | 25.00% | 9.52% | 36.36% | |
| FEP | 71.43% | 50.00% | 66.67% | ↓ | |
| HD | 0.1341 | 0.1242 | 0.0976 | ||
| Tree_Plum_05 | FBP | 44.44% | 28.57% | 57.14% | |
| FEP | 66.67% | 42.11% | 66.67% | ||
| HD | 0.1794 | 0.1518 | 0.1018 | ||
| Average_Plum | FBP | 37.61% | 29.14% | 54.09% | |
| FEP | 60.81% | 35.64% | 62.32% | ||
| HD | 0.1295 | 0.1155 | 0.0857 | ||
| Average_Total | FBP | 52.26% | 42.38% | 63.20% | |
| FEP | 63.43% | 53.49% | 71.24% | ||
| HD | 0.0966 | 0.0833 | 0.0692 | ||
| Tree_Species_Number | Metric | L1-Medial | LBC | Proposed |
| Tree_Peach_01 | FBP | 0.0783 | 0.0000 | 0.0000 |
| FEP | 0.1418 | 0.0525 | 0.0000 | |
| HD | 0.0004 | 0.0032 | 0.0013 | |
| Tree_Peach_02 | FBP | 0.0922 | 0.0000 | 0.0132 |
| FEP | 0.0103 | 0.0000 | 0.0000 | |
| HD | 0.0024 | 0.0009 | 0.0019 | |
| Tree_Peach_03 | FBP | 0.0203 | 0.0478 | 0.0200 |
| FEP | 0.0508 | 0.0000 | 0.0167 | |
| HD | 0.0006 | 0.0032 | 0.0013 | |
| Tree_Peach_04 | FBP | 0.0141 | 0.0674 | 0.0428 |
| FEP | 0.0191 | 0.0359 | 0.0000 | |
| HD | 0.0040 | 0.0175 | 0.0026 | |
| Tree_Peach_05 | FBP | 0.0770 | 0.0576 | 0.0000 |
| FEP | 0.0555 | 0.0000 | 0.0000 | |
| HD | 0.0112 | 0.0014 | 0.0012 | |
| Average_Peach | FBP | 0.0430 | 0.0288 | 0.0040 |
| FEP | 0.0260 | 0.0049 | 0.0033 | |
| HD | 0.0025 | 0.0041 | 0.0004 | |
| Tree_Persimmon_01 | FBP | 0.0868 | 0.0485 | 0.0000 |
| FEP | 0.0761 | 0.0024 | 0.0173 | |
| HD | 0.0338 | 0.0036 | 0.0039 | |
| Tree_Persimmon_02 | FBP | 0.0085 | 0.0557 | 0.0035 |
| FEP | 0.0364 | 0.0441 | 0.0637 | |
| HD | 0.0024 | 0.0015 | 0.0024 | |
| Tree_Persimmon_03 | FBP | 0.0281 | 0.0350 | 0.1100 |
| FEP | 0.0405 | 0.0000 | 0.0000 | |
| HD | 0.0166 | 0.0110 | 0.0048 | |
| Tree_Persimmon_04 | FBP | 0.0070 | 0.0361 | 0.0139 |
| FEP | 0.2831 | 0.0577 | 0.0779 | |
| HD | 0.0105 | 0.0015 | 0.0029 | |
| Tree_Persimmon_05 | FBP | 0.1032 | 0.0231 | 0.0000 |
| FEP | 0.0955 | 0.0000 | 0.0000 | |
| HD | 0.0048 | 0.0022 | 0.0063 | |
| Average_Persimmon | FBP | 0.0319 | 0.0109 | 0.0241 |
| FEP | 0.0633 | 0.0183 | 0.0063 | |
| HD | 0.0059 | 0.0030 | 0.0006 | |
| Tree_Chestnuts_01 | FBP | 0.0375 | 0.0486 | 0.0190 |
| FEP | 0.0385 | 0.0067 | 0.1132 | |
| HD | 0.0059 | 0.0119 | 0.0014 | |
| Tree_Chestnuts_02 | FBP | 0.0000 | 0.0042 | 0.0000 |
| FEP | 0.0000 | 0.0201 | 0.0000 | |
| HD | 0.0035 | 0.0108 | 0.0027 | |
| Tree_Chestnuts_03 | FBP | 0.0000 | 0.0000 | 0.0000 |
| FEP | 0.0000 | 0.0000 | 0.0000 | |
| HD | 0.0044 | 0.0043 | 0.0015 | |
| Tree_Chestnuts_04 | FBP | 0.0000 | 0.0151 | 0.0000 |
| FEP | 0.0000 | 0.0096 | 0.0000 | |
| HD | 0.0068 | 0.0087 | 0.0055 | |
| Tree_Chestnuts_05 | FBP | 0.0962 | 0.0096 | 0.1177 |
| FEP | 0.0722 | 0.0165 | 0.0000 | |
| HD | 0.0138 | 0.0077 | 0.0005 | |
| Average_Chestnuts | FBP | 0.0118 | 0.0080 | 0.0228 |
| FEP | 0.0067 | 0.0025 | 0.0226 | |
| HD | 0.0042 | 0.0039 | 0.0010 | |
| Tree_Plum_01 | FBP | 0.0000 | 0.0143 | 0.0000 |
| FEP | 0.0119 | 0.0126 | 0.0000 | |
| HD | 0.0012 | 0.0081 | 0.0013 | |
| Tree_Plum_02 | FBP | 0.0000 | 0.0262 | 0.0888 |
| FEP | 0.0226 | 0.0679 | 0.0328 | |
| HD | 0.0189 | 0.0141 | 0.0088 | |
| Tree_Plum_03 | FBP | 0.0000 | 0.0543 | 0.0000 |
| FEP | 0.0000 | 0.0000 | 0.0568 | |
| HD | 0.0163 | 0.0015 | 0.0068 | |
| Tree_Plum_04 | FBP | 0.0000 | 0.0000 | 0.0210 |
| FEP | 0.0000 | 0.0000 | 0.0000 | |
| HD | 0.0122 | 0.0086 | 0.0178 | |
| Tree_Plum_05 | FBP | 0.0898 | 0.0825 | 0.0165 |
| FEP | 0.0296 | 0.0000 | 0.0540 | |
| HD | 0.0270 | 0.0086 | 0.0084 | |
| Average_Plum | FBP | 0.0180 | 0.0235 | 0.0123 |
| FEP | 0.0092 | 0.0152 | 0.0120 | |
| HD | 0.0057 | 0.0050 | 0.0009 | |
| Average_Total | FBP | 0.0075 | 0.0127 | 0.0071 |
| FEP | 0.0249 | 0.0088 | 0.0065 | |
| HD | 0.0026 | 0.0010 | 0.0004 |
| Tree_Species_Number | Metric | L1-Medial | LBC | Proposed | |
| Tree_Peach_01 | FBP | 55.56% | 59.38% | 82.35% | |
| FEP | 62.30% | 62.30% | 81.69% | ||
| HD | 0.0741 | 0.0751 | 0.0651 | ||
| Tree_Peach_02 | FBP | 65.71% | 73.56% | 81.25% | |
| FEP | 63.93% | 65.00% | 79.25% | ||
| HD | 0.1025 | 0.0862 | 0.1002 | ↑ | |
| Tree_Peach_03 | FBP | 60.61% | 72.73% | 83.72% | |
| FEP | 71.11% | 71.80% | 71.11% | ↓ | |
| HD | 0.0503 | 0.0557 | 0.0387 | ||
| Tree_Peach_04 | FBP | 51.52% | 70.73% | 92.31% | |
| FEP | 61.54% | 62.34% | 89.58% | ||
| HD | 0.0909 | 0.0547 | 0.0339 | ||
| Tree_Peach_05 | FBP | 67.93% | 80.65% | 91.89% | |
| FEP | 63.64% | 65.63% | 95.12% | ||
| HD | 0.0656 | 0.0775 | 0.0350 | ||
| Average_Peach | FBP | 60.26% | 71.41% | 86.30% | |
| FEP | 64.50% | 65.41% | 83.35% | ||
| HD | 0.0762 | 0.0698 | 0.0546 | ||
| Tree_Persimmon_01 | FBP | 75.00% | 83.08% | 82.35% | |
| FEP | 75.00% | 68.85% | 88.57% | ||
| HD | 0.0855 | 0.0612 | 0.0675 | ↑ | |
| Tree_Persimmon_02 | FBP | 61.22% | 70.18% | 87.50% | |
| FEP | 55.74% | 59.26% | 89.55% | ||
| HD | 0.1263 | 0.0713 | 0.0589 | ||
| Tree_Persimmon_03 | FBP | 80.00% | 65.39% | 79.25% | ↓ |
| FEP | 81.36% | 46.81% | 93.55% | ||
| HD | 0.0860 | 0.0713 | 0.0424 | ||
| Tree_Persimmon_04 | FBP | 63.16% | 60.47% | 80.77% | |
| FEP | 83.64% | 47.83% | 89.66% | ||
| HD | 0.0937 | 0.0836 | 0.0394 | ||
| Tree_Persimmon_05 | FBP | 64.62% | 80.00% | 93.98% | |
| FEP | 57.83% | 84.71% | 88.89% | ||
| HD | 0.1205 | 0.0567 | 0.0554 | ||
| Average_Persimmon | FBP | 68.80% | 71.82% | 84.77% | |
| FEP | 70.71% | 61.49% | 90.04% | ||
| HD | 0.0996 | 0.0688 | 0.0527 | ||
| Tree_Chestnuts_01 | FBP | 28.57% | 66.67% | 60.00% | ↓ |
| FEP | 38.46% | 31.58% | 69.57% | ||
| HD | 0.0659 | 0.0686 | 0.0532 | ||
| Tree_Chestnuts_02 | FBP | 66.67% | 62.50% | 66.67% | |
| FEP | 34.78% | 57.14% | 81.67% | ||
| HD | 0.1004 | 0.0701 | 0.0321 | ||
| Tree_Chestnuts_03 | FBP | 53.33% | 70.59% | 84.12% | |
| FEP | 66.67% | 42.11% | 91.74% | ||
| HD | 0.0554 | 0.0532 | 0.0336 | ||
| Tree_Chestnuts_04 | FBP | 66.67% | 50.00% | 94.74% | |
| FEP | 47.62% | 43.48% | 85.24% | ||
| HD | 0.0967 | 0.0560 | 0.0291 | ||
| Tree_Chestnuts_05 | FBP | 80.00% | 35.29% | 94.12% | |
| FEP | 90.00% | 50.00% | 90.00% | ||
| HD | 0.0405 | 0.0521 | 0.0483 | ↑ | |
| Average_Chestnuts | FBP | 59.05% | 57.01% | 79.93% | |
| FEP | 55.51% | 44.86% | 83.64% | ||
| HD | 0.0708 | 0.0600 | 0.0393 | ||
| Tree_Plum_01 | FBP | 66.67% | 32.00% | 69.57% | |
| FEP | 92.31% | 57.14% | 88.89% | ↓ | |
| HD | 0.1284 | 0.0604 | 0.0575 | ||
| Tree_Plum_02 | FBP | 57.14% | 71.43% | 82.35% | |
| FEP | 75.00% | 53.33% | 77.78% | ||
| HD | 0.0415 | 0.0544 | 0.0285 | ||
| Tree_Plum_03 | FBP | 58.82% | 84.21% | 72.73% | ↓ |
| FEP | 75.00% | 60.00% | 75.00% | ||
| HD | 0.1100 | 0.1007 | 0.0441 | ||
| Tree_Plum_04 | FBP | 70.59% | 73.68% | 95.24% | |
| FEP | 70.00% | 50.00% | 78.26% | ||
| HD | 0.1113 | 0.0630 | 0.0407 | ||
| Tree_Plum_05 | FBP | 73.68% | 60.00% | 90.00% | |
| FEP | 76.92% | 43.48% | 88.00% | ||
| HD | 0.0621 | 0.0893 | 0.0454 | ||
| Average_Plum | FBP | 65.38% | 64.26% | 81.98% | |
| FEP | 77.85% | 52.79% | 81.59% | ||
| HD | 0.0970 | 0.0736 | 0.0432 | ||
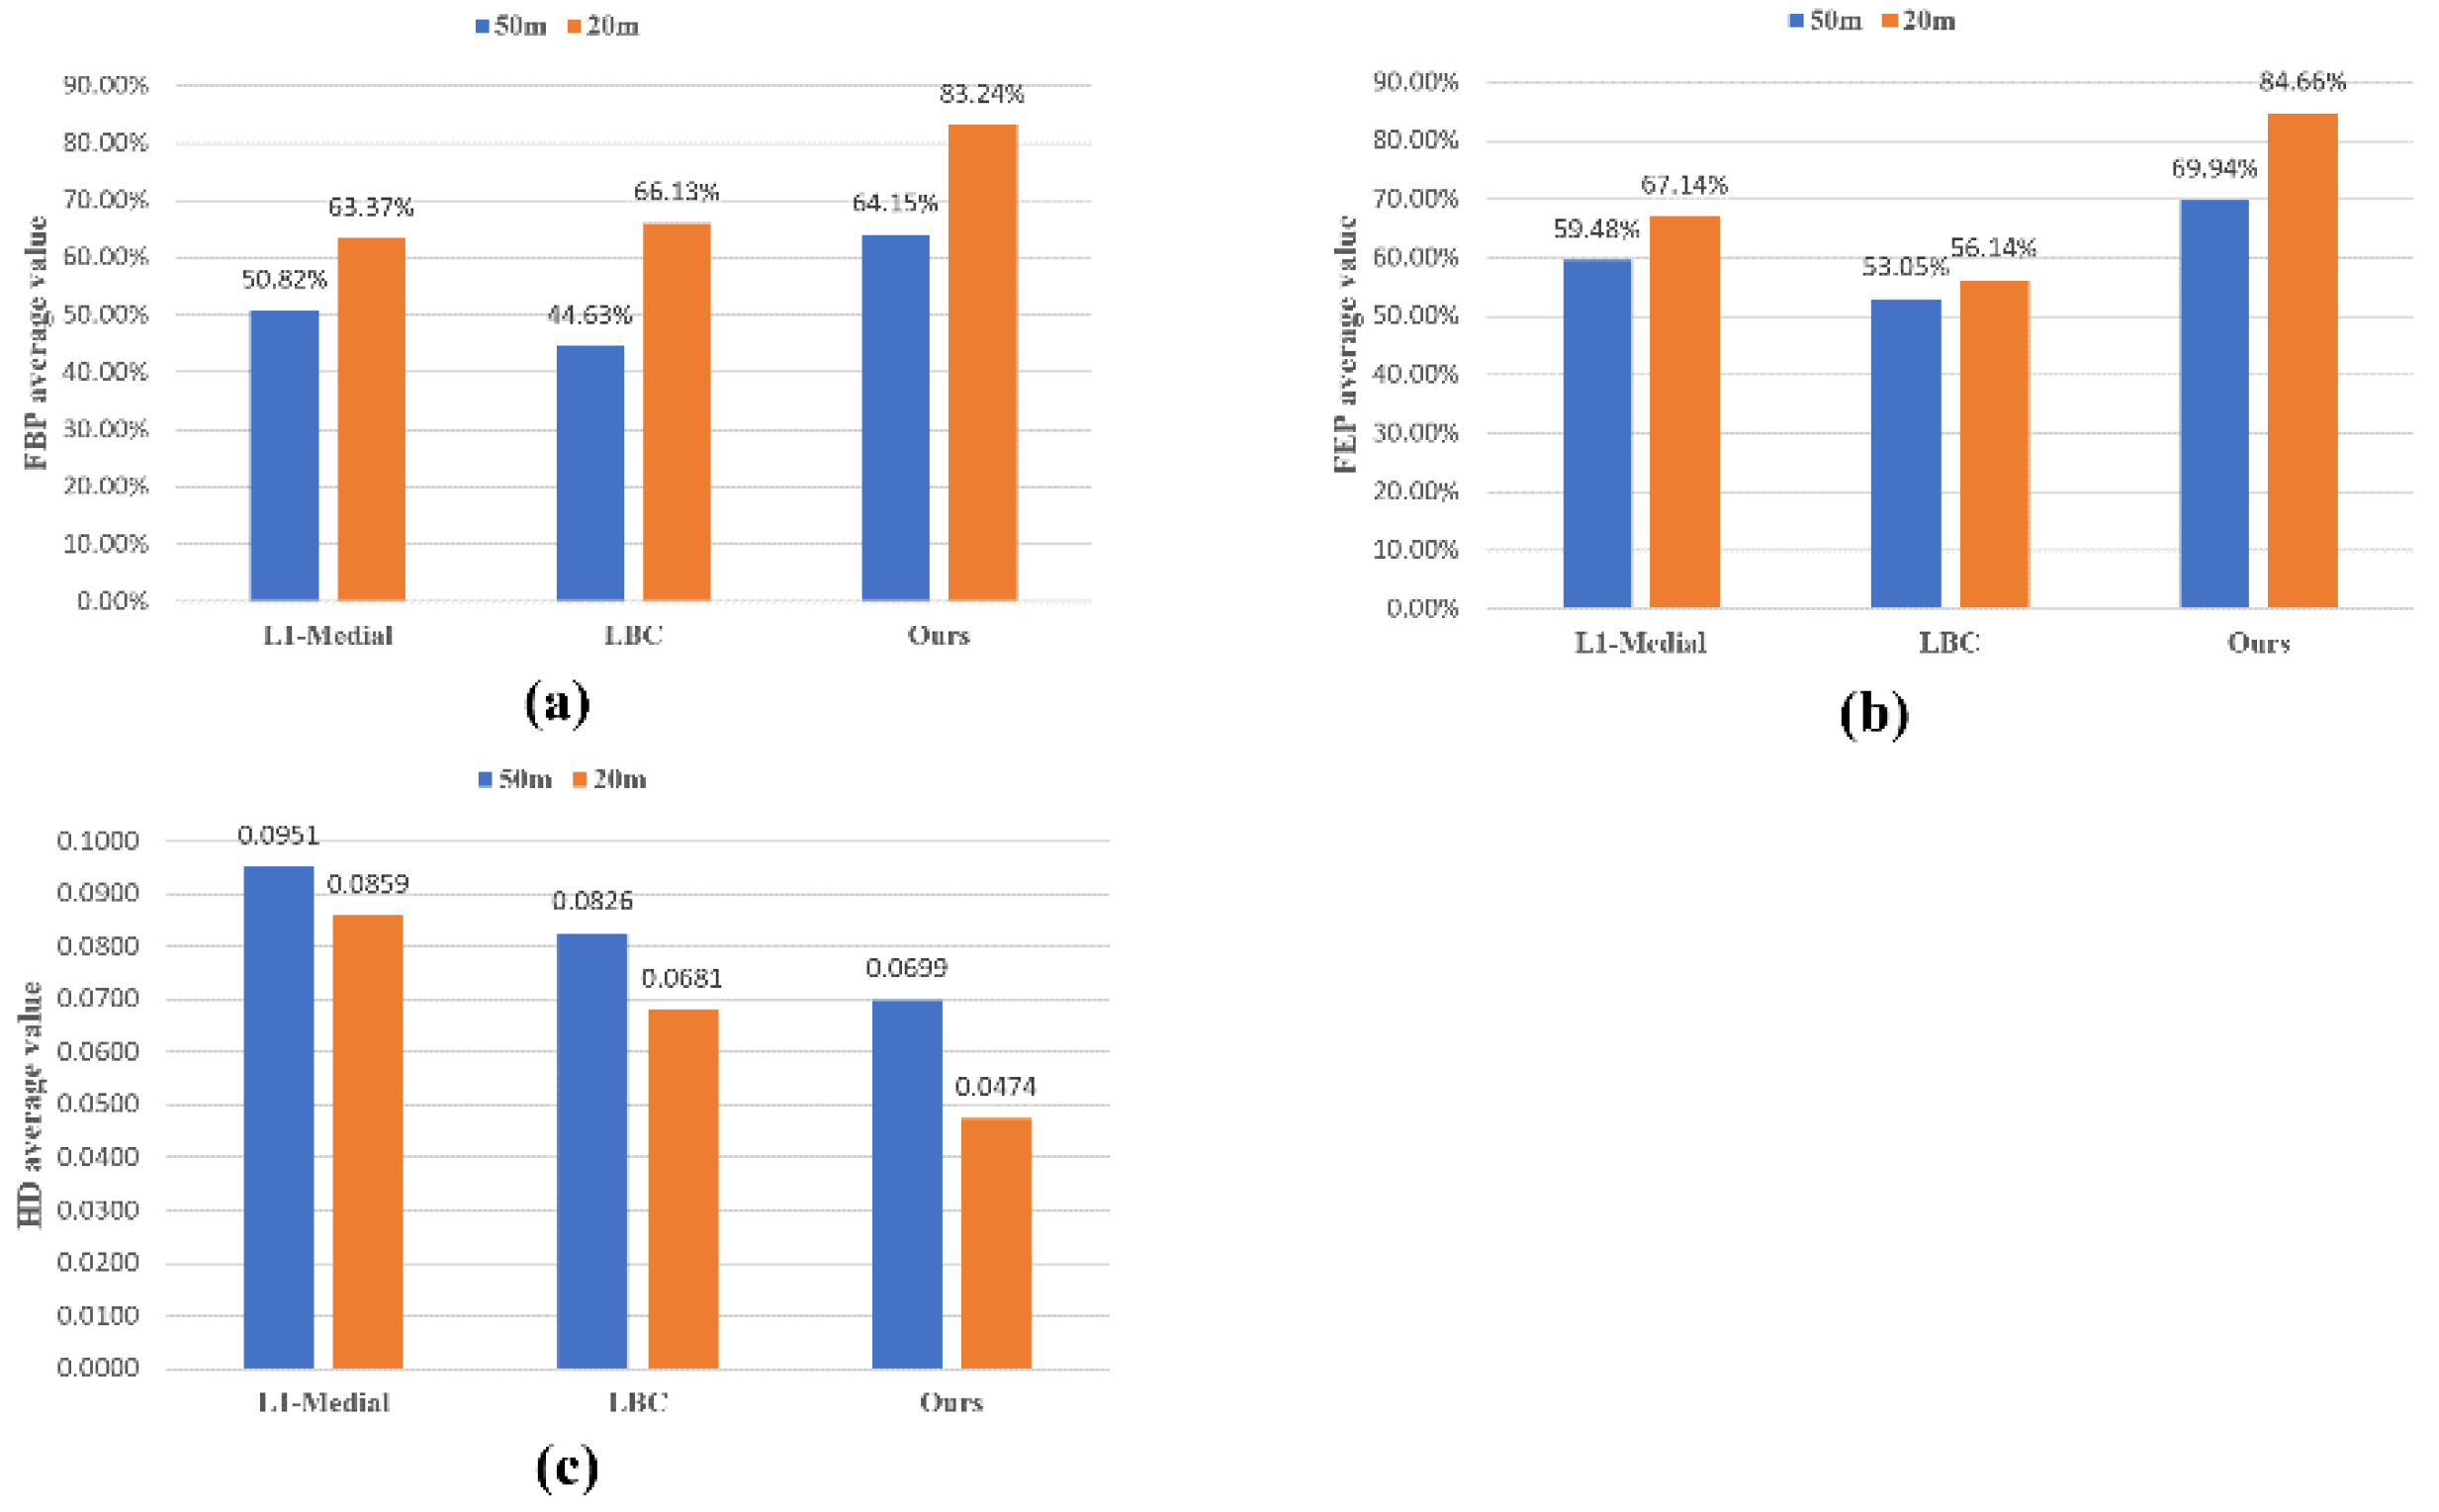
| Average_Total | FBP | 63.37% | 66.13% | 83.24% | |
| FEP | 67.14% | 56.14% | 84.66% | ||
| HD | 0.0859 | 0.0681 | 0.0474 | ||
References
- Xu, H.; Gossett, N.; Chen, B. Knowledge and heuristic-based modeling of laser-scanned trees. ACM Trans. Graph. (TOG) 2007, 26, 19-es. [Google Scholar] [CrossRef]
- Wang, Z.; Zhang, L.; Fang, T.; Mathiopoulos, P.T.; Qu, H.; Chen, D.; Wang, Y. A structure-aware global optimization method for reconstructing 3-D tree models from terrestrial laser scanning data. IEEE Trans. Geosci. Remote Sens. 2014, 52, 5653–5669. [Google Scholar] [CrossRef]
- Livny, Y.; Yan, F.; Olson, M.; Chen, B.; Zhang, H.; El-Sana, J. Automatic reconstruction of tree skeletal structures from point clouds. In ACM SIGGRAPH Asia 2010 Papers; Association for Computing Machinery: New York, NY, USA, 2010; pp. 1–8. [Google Scholar]
- Alexander, B.; Lindenbergh, R.; Menenti, M. SkelTre. Vis. Comput. 2010, 26, 1283–1300. [Google Scholar]
- Andrea, T.; Zhang, H.; Cohen-Or, D. Curve skeleton extraction from incomplete point cloud. In ACM SIGGRAPH 2009 Papers; Association for Computing Machinery: New York, NY, USA, 2009; pp. 1–9. [Google Scholar]
- Huang, H.; Wu, S.; Cohen-Or, D.; Gong, M.; Zhang, H.; Li, G.; Chen, B. L1-medial skeleton of point cloud. ACM Trans. Graph. 2013, 32, 1–8. [Google Scholar]
- Mei, J.; Zhang, L.; Wu, S.; Wang, Z.; Zhang, L. 3D tree modeling from incomplete point clouds via optimization and L1-MST. Int. J. Geogr. Inf. Sci. 2017, 31, 999–1021. [Google Scholar] [CrossRef]
- Song, C.; Pang, Z.; Jing, X.; Xiao, C. Distance field guided $$ L_1 $$ L1-median skeleton extraction. Vis. Comput. 2018, 34, 243–255. [Google Scholar] [CrossRef]
- Bin, L.; Wang, Q.; Fan, X. An Optimized L1-Medial Skeleton Extraction Algorithm. In Proceedings of the 2021 IEEE International Conference on Industrial Application of Artificial Intelligence (IAAI), Harbin, China, 24–26 December 2021; IEEE: Piscataway, NJ, USA, 2021. [Google Scholar]
- Cao, J.; Tagliasacchi, A.; Olson, M.; Zhang, H.; Su, Z. Point cloud skeletons via laplacian based contraction. In Proceedings of the 2010 Shape Modeling International Conference, mAix-en-Provence, France, 21–23 June 2010; IEEE: Piscataway, NJ, USA, 2010. [Google Scholar]
- Su, Z.; Zhao, Y.; Zhao, C.; Guo, X.; Li, Z. Skeleton extraction for tree models. Math. Comp. Model. 2011, 54, 1115–1120. [Google Scholar] [CrossRef]
- He, G.Z. The Trees Skeleton Extraction Based on point cloud Contraction. In Applied Mechanics and Materials; Trans Tech Publications Ltd.: Wollerau, Switzerland, 2014; Volume 475. [Google Scholar]
- Wu, S.; Wen, W.; Xiao, B.; Guo, X.; Du, J.; Wang, C.; Wang, Y. An accurate skeleton extraction approach from 3D point clouds of maize plants. Front. Plant. Sci. 2019, 10, 248. [Google Scholar] [CrossRef]
- Li, Y.; Su, Y.; Zhao, X.; Yang, M.; Hu, T.; Zhang, J.; Liu, J.; Liu, M.; Guo, Q. Retrieval of tree branch architecture attributes from terrestrial laser scan data using a Laplacian algorithm. Agri. Forest Meteor. 2020, 284, 107874. [Google Scholar] [CrossRef]
- Jianling, Z.; Liu, J.; Zhang, M. Curve skeleton extraction via k-nearest-neighbors based contraction. Int. J. Appl. Math. Comp. Sci. 2020, 30, 123–132. [Google Scholar]
- Lou, L.; Liu, Y.; Shen, M.; Han, J.; Corke, F.; Doonan, J.H. Estimation of branch angle from 3D point cloud of plants. In Proceedings of the 2015 International Conference on 3D Vision, Lyon, France, 19–22 October 2015; IEEE: Piscataway, NJ, USA, 2015. [Google Scholar]
- Yinxi, G.; Yang, Y.; Yang, X. Three-dimensional reconstruction of the virtual plant branching structure based on terrestrial lidar technologies and L-system. Int. Arch. Photogram. Remote Sens. Spatial Inf. Sci. 2018, 42, 3. [Google Scholar]
- Fu, L.; Liu, J.; Zhou, J.; Zhang, M.; Lin, Y. Tree skeletonization for raw point cloud exploiting cylindrical shape prior. IEEE Access 2020, 8, 27327–27341. [Google Scholar] [CrossRef]
- Dell, M.; Stone, C.; Osborn, J.; Glen, M.; McCoull, C.; Rimbawanto, A.; Tjahyono, B.; Mohammed, C. Detection of necrotic foliage in a young Eucalyptus pellita plantation using unmanned aerial vehicle RGB photography–a demonstration of concept. Aust. Forest. 2019, 82, 79–88. [Google Scholar] [CrossRef]
- Maimaitijiang, M.; Sagan, V.; Sidike, P.; Maimaitiyiming, M.; Hartling, S.; Peterson, K.T.; Maw, M.J.; Shakoor, N.; Mockler, T.; Fritschi, F.B. Vegetation metric weighted canopy volume model (CVMVI) for soybean biomass estimation from unmanned aerial system-based RGB imagery. ISPRS J. Photogram. Remote Sens. 2019, 151, 27–41. [Google Scholar] [CrossRef]
- González-Jaramillo, V.; Fries, A.; Bendix, J. AGB estimation in a tropical mountain forest (TMF) by means of RGB and multispectral images using an unmanned aerial vehicle (UAV). Remote Sens. 2019, 11, 1413. [Google Scholar] [CrossRef]
- Ester, M.; Kriegel, H.P.; Sander, J.; Xu, X. A density-based algorithm for discovering clusters in large spatial databases with noise. Inkdd 1996, 96, 226–231. [Google Scholar]
- Cornea, N.D.; Silver, D.; Min, P. Curve-skeleton properties, applications, and algorithms. IEEE Trans. Nisual. Comp. Graphics 2007, 13, 530. [Google Scholar] [CrossRef]
- Meagher, D. Geometric modeling using octree encoding. Comp. Graphics Image Process. 1982, 19, 129–147. [Google Scholar] [CrossRef]
- Francisco, Y.; Silwal, A.; Kantor, G. Visual 3d reconstruction and dynamic simulation of fruit trees for robotic manipulation. In Proceedings of the IEEE/CVF Conference on Computer Vision and Pattern Recognition Workshops, Seattle, WA, USA, 13–19 June 2020. [Google Scholar]
- Josh, H.M.L.; Yam, Y. A skeletonization technique based on delaunay triangulation and piecewise bezier interpolation. In Proceedings of the 2007 6th International Conference on Information, Communications & Signal Processing, Singapore, 10–13 December 2007; IEEE: Piscataway, NJ, USA, 2007. [Google Scholar]
- Facundo, M. Gromov-Hausdorff distances in Euclidean spaces. In Proceedings of the 2008 IEEE Computer Society Conference on Computer Vision and Pattern Recognition Workshops, Anchorage, AK, USA, 23–28 June 2008; IEEE: Piscataway, NJ, USA, 2008. [Google Scholar]
- Krause, S.; Sanders, T.G.; Mund, J.P.; Greve, K. UAV-based photogrammetric tree height measurement for intensive forest 737 monitoring. Remote Sens. 2019, 11, 758. [Google Scholar] [CrossRef]
- Sun, G.; Wang, X.; Yang, H.; Zhang, X. A canopy information measurement method for modern standardized apple orchards 739 based on UAV multimodal information. Sensors 2020, 20, 2985. [Google Scholar] [CrossRef]
- Lefsky, M.A.; Cohen, W.B.; Harding, D.J.; Parker, G.G.; Acker, S.A.; Gower, S.T. Lidar remote sensing of above-ground biomass in 741 three biomes. Glob. Ecol. Biogeogr. 2002, 11, 393–399. [Google Scholar] [CrossRef]
- Lambert, M.; Ung, C.; Raulier, F. Canadian national tree aboveground biomass equations. Can. J. For. Res. 2005, 35, 1996–2018. [Google Scholar] [CrossRef]
- Hilker, T.; van Leeuwen, M.; Coops, N.C.; Wulder, M.A.; Newnham, G.J.; Jupp, D.L.; Culvenor, D.S. Comparing canopy metrics 745 derived from terrestrial and airborne laser scanning in a Douglas-fir dominated forest stand. Trees 2010, 24, 819–832. [Google Scholar] [CrossRef]
- Liu, J.; Zhang, X.; Li, H.; Dai, M. Creation of tree models from freehand sketches by building 3D skeleton point cloud. In International Conference on Technologies for E-Learning and Digital Entertainment; Springer: Berlin/Heidelberg, Germany, 2010. [Google Scholar]
- Preuksakarn, C.; Boudon, F.; Ferraro, P.; Durand, J.B.; Nikinmaa, E.; Godin, C. Reconstructing plant architecture from 3D laser scanner data. In Proceedings of the 6th International Workshop on Functional-Structural Plant Models, Davis, CA, USA, 12–17 September 2010. [Google Scholar]
- Guo, J.; Jiang, H.; Benes, B.; Deussen, O.; Zhang, X.; Lischinski, D.; Huang, H. Inverse procedural modeling of branching structures by inferring L-systems. ACM Trans. Graph. 2020, 39, 1–13. [Google Scholar] [CrossRef]
- Dobson, D.; Dong, H.; van der Horst, N.; Langhorst, L.; van der Vaart, J.; Wu, Z. Tree Reconstruction from a Point Cloud Using an L-System. Master’s Thesis, Technische Universiteit Delft, Delft, The Netherlands, 2021. [Google Scholar]


| Tree Type | Number of Individuals |
|---|---|
| Apple | 17 |
| Cherry | 2 |
| Chestnut | 86 |
| Citrus | 25 |
| Kiwifruit | 15 |
| Loquat | 5 |
| Peach | 51 |
| Persimmon | 95 |
| Plum | 46 |
| 50 m | 20 m | Variation | ||||||||
|---|---|---|---|---|---|---|---|---|---|---|
| Tree_Species_Number | Metric | L1-Medial | LBC | Proposed | L1-Medial | LBC | Proposed | L1-Medial | LBC | Proposed |
| Average_Peach | FBP | 70.76% | 57.60% | 83.60% | 60.26% | 70.41% | 86.30% | −10.50% | 13.81% | 2.71% |
| FEP | 73.63% | 75.02% | 83.64% | 64.50% | 65.41% | 83.35% | −9.13% | −9.61% | −0.29% | |
| HD | 0.0647 | 0.0574 | 0.0433 | 0.0762 | 0.0698 | 0.0546 | 0.0115 | 0.0124 | 0.0113 | |
| Average_Persimmon | FBP | 58.04% | 58.13% | 74.76% | 68.80% | 70.82% | 84.77% | 10.76% | 13.69% | 10.01% |
| FEP | 61.60% | 67.36% | 85.45% | 70.71% | 61.49% | 90.04% | 9.11% | −5.87% | 4.59% | |
| HD | 0.0878 | 0.063 | 0.0582 | 0.0996 | 0.0688 | 0.0527 | 0.0118 | 0.0058 | −0.0055 | |
| Average_Chestnuts | FBP | 33.74% | 30.35% | 45.92% | 59.05% | 56.01% | 79.93% | 25.31% | 26.66% | 34.01% |
| FEP | 42.48% | 33.40% | 48.54% | 55.51% | 44.86% | 83.64% | 13.03% | 11.46% | 35.10% | |
| HD | 0.1094 | 0.1032 | 0.0909 | 0.0708 | 0.06 | 0.0393 | −0.0386 | −0.0432 | −0.0516 | |
| Average_Plum | FBP | 40.72% | 32.43% | 52.31% | 65.38% | 63.26% | 81.98% | 24.66% | 31.83% | 29.67% |
| FEP | 60.20% | 36.41% | 62.12% | 77.85% | 52.79% | 81.59% | 17.65% | 16.38% | 19.46% | |
| HD | 0.1184 | 0.1068 | 0.0871 | 0.097 | 0.0736 | 0.0432 | −0.0215 | −0.0332 | −0.0439 | |
| Average_Total | FBP | 50.82% | 44.63% | 64.15% | 63.37% | 61.13% | 83.24% | 12.56% | 21.50% | 19.10% |
| FEP | 59.48% | 53.05% | 69.94% | 67.14% | 56.14% | 84.66% | 7.67% | 3.09% | 14.72% | |
| HD | 0.0951 | 0.0826 | 0.0699 | 0.0859 | 0.0681 | 0.0474 | −0.0092 | −0.0146 | −0.0224 | |
Disclaimer/Publisher’s Note: The statements, opinions and data contained in all publications are solely those of the individual author(s) and contributor(s) and not of MDPI and/or the editor(s). MDPI and/or the editor(s) disclaim responsibility for any injury to people or property resulting from any ideas, methods, instructions or products referred to in the content. |
© 2023 by the authors. Licensee MDPI, Basel, Switzerland. This article is an open access article distributed under the terms and conditions of the Creative Commons Attribution (CC BY) license (https://creativecommons.org/licenses/by/4.0/).
Share and Cite
Zhang, W.; Peng, X.; Cui, G.; Wang, H.; Takata, D.; Guo, W. Tree Branch Skeleton Extraction from Drone-Based Photogrammetric Point Cloud. Drones 2023, 7, 65. https://doi.org/10.3390/drones7020065
Zhang W, Peng X, Cui G, Wang H, Takata D, Guo W. Tree Branch Skeleton Extraction from Drone-Based Photogrammetric Point Cloud. Drones. 2023; 7(2):65. https://doi.org/10.3390/drones7020065
Chicago/Turabian StyleZhang, Wenli, Xinyu Peng, Guoqiang Cui, Haozhou Wang, Daisuke Takata, and Wei Guo. 2023. "Tree Branch Skeleton Extraction from Drone-Based Photogrammetric Point Cloud" Drones 7, no. 2: 65. https://doi.org/10.3390/drones7020065
APA StyleZhang, W., Peng, X., Cui, G., Wang, H., Takata, D., & Guo, W. (2023). Tree Branch Skeleton Extraction from Drone-Based Photogrammetric Point Cloud. Drones, 7(2), 65. https://doi.org/10.3390/drones7020065