Review

The Use of UAVs for Morphological Coastal Change Monitoring—A Bibliometric Analysis

Communication and Society Research Centre, Department of Geography, University of Minho, 4810-058 Guimarães, Portugal
*
Author to whom correspondence should be addressed.
Drones 2023, 7(10), 629; https://doi.org/10.3390/drones7100629
Submission received: 15 June 2023 / Revised: 27 September 2023 / Accepted: 6 October 2023 / Published: 9 October 2023
(This article belongs to the Section Drones in Ecology)

Abstract

:
The use of unmanned aerial vehicles (UAVs) in many fields of expertise has increased over recent years. As such, UAVs used for monitoring coastline changes are also becoming more frequent, more practical, and more effective, whether for conducting academic work or for business and administrative activities. This study thus addresses the use of unmanned aerial vehicles (UAVs) for monitoring changing coastlines, in particular morphological coastal changes caused by rising sea levels, reductions in sediment load, or changes produced by engineering infrastructure. For this objective, a bibliometric analysis was conducted on the basis of 160 research articles published in the last 20 years, using the Web of Science database. The analysis shows that the countries leading the way in researching coastline changes with UAVs are the United States, France, South Korea, and Spain. In addition, this study provides data on the most influential publications and authors on this topic and on research trends. It further highlights the value addition made by UAVs to monitoring coastline changes.

1. Introduction

1.1. The Importance of Coastal Monitoring

The coastal zone is the interface between the land and water [1] and its position is very dynamic. It changes frequently due to multiple factors, which are also responsible for different coastal processes, namely the specificities of waves, the characteristics of sediments, the shape of beaches, inter alia [2]. In addition to natural processes, there are also human factors that can cause erosion or accretion, such as the construction of dams and reservoirs, dredging, mining, and water and sand extraction [3,4].
Over the years, the coastal population has grown considerably, with a concentration of large social and economic centres in these areas. Most of this growth has been very rapid and poorly planned, subjecting these regions to a great deal of urban and industrial pressure [5].
In relation to coastal vulnerability, coastal accretion results in less vulnerable coastlines thanks to sediment deposition on the beaches. On the other hand, eroding coastlines are more vulnerable due to the loss of materials on the beaches. Furthermore, healthy coastlines are paramount to maintaining ecosystems [6,7,8] and quality of life along the coast [9,10], as they provide protection from storms and for endangered habitats of many animal and plant species. A coastline in a poor state is regarded as a social and economic threat for millions of people who live and work there.
Consequently, monitoring morphological coastline changes is very important as it helps to identify the nature and dynamics of the processes that cause such changes and to assess and monitor risk areas to help protect people and property [2].

1.2. Coastal Monitoring Methods

Over time, coastal monitoring methodologies have changed in line with the technological advances that have emerged. Coastal monitoring methods involving conventional techniques, such as classical surveying and topography equipment, beach profile analysis, and tide analysis, are mostly costly and labour-intensive [11]. At present, remote sensing is one of the most successful and effective methods for coastal mapping. Satellite images are a good solution for analysing larger areas [12] due to their extensive coverage capability. However, the use of satellite images offers some challenges, either because many images cannot be used because they are filled with clouds or the spatial resolution is very low. On the other hand, higher quality satellite images (with higher spatial resolution) are very expensive [13]. Another increasingly used method is laser mapping, e.g., LiDAR. The results of this method are of excellent quality due to the very high resolution of the data obtained and, compared to UAV photogrammetry, are as good or even better, although its main drawback is the high cost of the equipment [14]. Another method of remote sensing is aerial mapping and photogrammetry using UAVs. Unmanned aerial vehicles (also currently referred to as unoccupied or uncrewed) are quite versatile tools, and the fact that there are different types of UAVs, with different characteristics, makes them adapt quite effectively to different working environments, which, in the case of coastal areas, are quite irregular.

1.3. Increasing Use of UAVs and Their Advantages

Thanks to their characteristics, UAVs are visibly the most effective, practical, and cost-effective method and are increasingly used in many fields of knowledge. In recent years, the use of UAVs as tools for 2D and 3D mapping, topography, and measurements has experienced significant development [15,16,17] and their potential for coastal studies grew thanks to the high spatial resolution of the images produced [18,19]. The key advantages of UAVs relate to the low purchase and use costs (compared to other tools); the possibility to quickly plan and prepare flights in the field with the help of GPS-supported control points; the fact that most UAVs transmit images in real time, which allows for repeating the work in case of failure or error; and the low safety risks in case of accident, because the flight equipment is very light [20].
Consequently, we used quantitative and bibliometric methods to analyse the state-of-the-art of research on the use of UAVs to monitor coastline changes. Bibliometric analysis is particularly needed given that the knowledge on the use of UAVs for coastal monitoring is scattered and fragmented. This study contributes to the extant literature in this scientific area, as it concerns constantly evolving technology, with growing potential for coastal monitoring. The success of this bibliometric analysis depends, of course, on clarifying the main research topics in the literature on which this study is based. As previously mentioned, this technology is constantly evolving. Therefore, it is important to understand the path mapped out, the current intellectual structure, and what is to come, which assist in determining the studies and relevant issues on the potential of UAVs to monitor coastline changes.

2. Materials and Methods

The present research study conducts a bibliometric analysis to explore the use of UAVs for monitoring coastline changes. Such quantitative analysis provides data on the intellectual structure of the knowledge domain and the status quo, hot topics, and future research directions that can be followed on this topic [21,22,23]. Bibliometric analysis examines the existing literature through large data sets to find hidden patterns of written communication and the evolution of the area of knowledge by applying statistical and mathematical methods [24,25]. Bibliometric analysis brings new knowledge to light supported by the strength of the quantitative data from this type of analysis [26]. By using bibliometrics, this study aspires to better understand the patterns and foci of existing research [27].
The analysis comprises five steps: study design, data collection and selection, data analysis, data visualisation, and interpretation [28,29,30,31].

2.1. Data Selection and Screening

The bibliographic information about the published literature was sourced from the Web of Science (WoS). We chose this database because it is very comprehensive and offers a broad coverage of academic work produced globally in a wide range of knowledge areas, besides harbouring a large collection of thousands of indexed journals.
To pick the documents of interest for this study, we had to select the words with relevance to the topic in question. That covered the largest number of published papers, considering some assumptions, such as the fact that a concept may have different terminologies. For example, drones are also called unmanned aerial vehicles, remotely piloted air vehicles, or even unmanned airborne systems (Table 1).
The asterisk “*” allows the search engine to search for the same word in different conjugations; for example, “coast* survey*” can be “coastal survey” or “coastal surveying”. These criteria were applied to the Topic field, which only searches for words in the Title, Abstract, Author Keywords, and Keywords Plus. The search was conducted in November 2022 and yielded 181 results.
Next, additional criteria were used to filter some data to obtain a more realistic data set that was fit for purpose. For this reason, the terms “satellite” and “satellite imagery”, which are strongly related to coastal change monitoring, were also excluded. Had these terms not been set aside, the search would have resulted in 237 publications, or, in other words, 56 more publications.
The first filter applied was the time interval of the publications—the search was restricted to publications from 2002 to 2022. This timeline makes sense, because the study addresses a method that uses relatively recent technology and thus must focus on a more updated bibliography.
The second filter concerns the type of publication and, in this case, Article, Proceedings Paper, and Early Access were selected.
The third filter in this research corresponds to the citation topics. Citation topics are citation clusters that are prompted by algorithms developed by CWTS, Leiden. These citation topics are divided into 3 hierarchical levels: Macro-Topics (10); Meso-Topics (326); and Micro-Topics (2444). In this study, the citation topics were filtered at the hierarchical level of Meso-Topics. The following Meso-Topics were excluded from the 15 drawn from the previously filtered documents:
-
3.2 Marine Biology;
-
3.60 Herbicides, Pesticides & Ground Poisoning;
-
4.116 Robotics;
-
4.17 Computer Vision & Graphics;
-
4.46 Distributed & Real Time Computing;
-
8.283 Archaeometry;
-
8.93 Archaeology.
This filter resulted in 160 publications, which will provide the bibliographic framework for this bibliometric analysis. These are a relatively small number of publications compared to other bibliometric analyses [32,33]. However, this study focuses on a very specific topic and, as such, the search was also quite concrete and restricted.

2.2. Data Analysis

These documents were subsequently analysed using bibliometric analysis techniques—performance analysis and scientific mapping. A descriptive analysis of performance was carried out using the bibliometrix package [34] by R Studio software (version 2023.09.0+463) to examine different research field evaluation indicators, as it has proven to be an effective and flexible tool for analysing and visualising bibliographic data [35,36,37].
VOSviewer (https://www.vosviewer.com/) was employed for network visualisation [38] in the studies conducted by Chen et al. [39] and Jumansyah et al. [40], demonstrating its effectiveness in this type of analysis. VOSviewer uses networks built on bibliometric information. This type of tool facilitates the identification of knowledge gaps and opportunities for collaboration. The outputs generated by VOSviewer consist of mental maps representing networks. The elements are represented as nodes, denoting institutions or keywords, while the relationships between them are depicted as lines, representing connections. These connections indicate the frequency or strength of the relationships between these elements. These networks offer valuable insights: (i) they shed light on the structure of the scientific community, enabling the identification of research groups, centres of excellence, and emerging themes and (ii) they facilitate the visualization of connections across different research areas.

3. Results and Discussion

The evolution of publications in the current literature on the use of UAVs for monitoring coastline changes was analysed. Figure 1 shows the timeline of the research.
The number of publications has grown remarkably since 2018. Before 2018, annual publications had peaked in 2016 at 10. There are 47 publications between 2002 and 2017 in the WoS database, accounting for about 30% of the literature base of this study. The remaining 70% are publications between 2018 and 2022. For this reason, the analysis was divided into two periods. The first period, between 2002 and 2017, which we call the development phase, had relatively few published articles. The second period, from 2018 to 2022, corresponds to the growth phase. The increase in publications was exponential during these years, confirming that researchers were evermore committed to using UAVs for coastline monitoring [41,42]. Annual publications reached a peak in 2020 and have been decreasing ever since. As monitoring coastline changes with UAVs involves field work carried out in real time, the COVID-19 pandemic limited field work and may be the reason for fewer papers being published in 2021 and 2022.

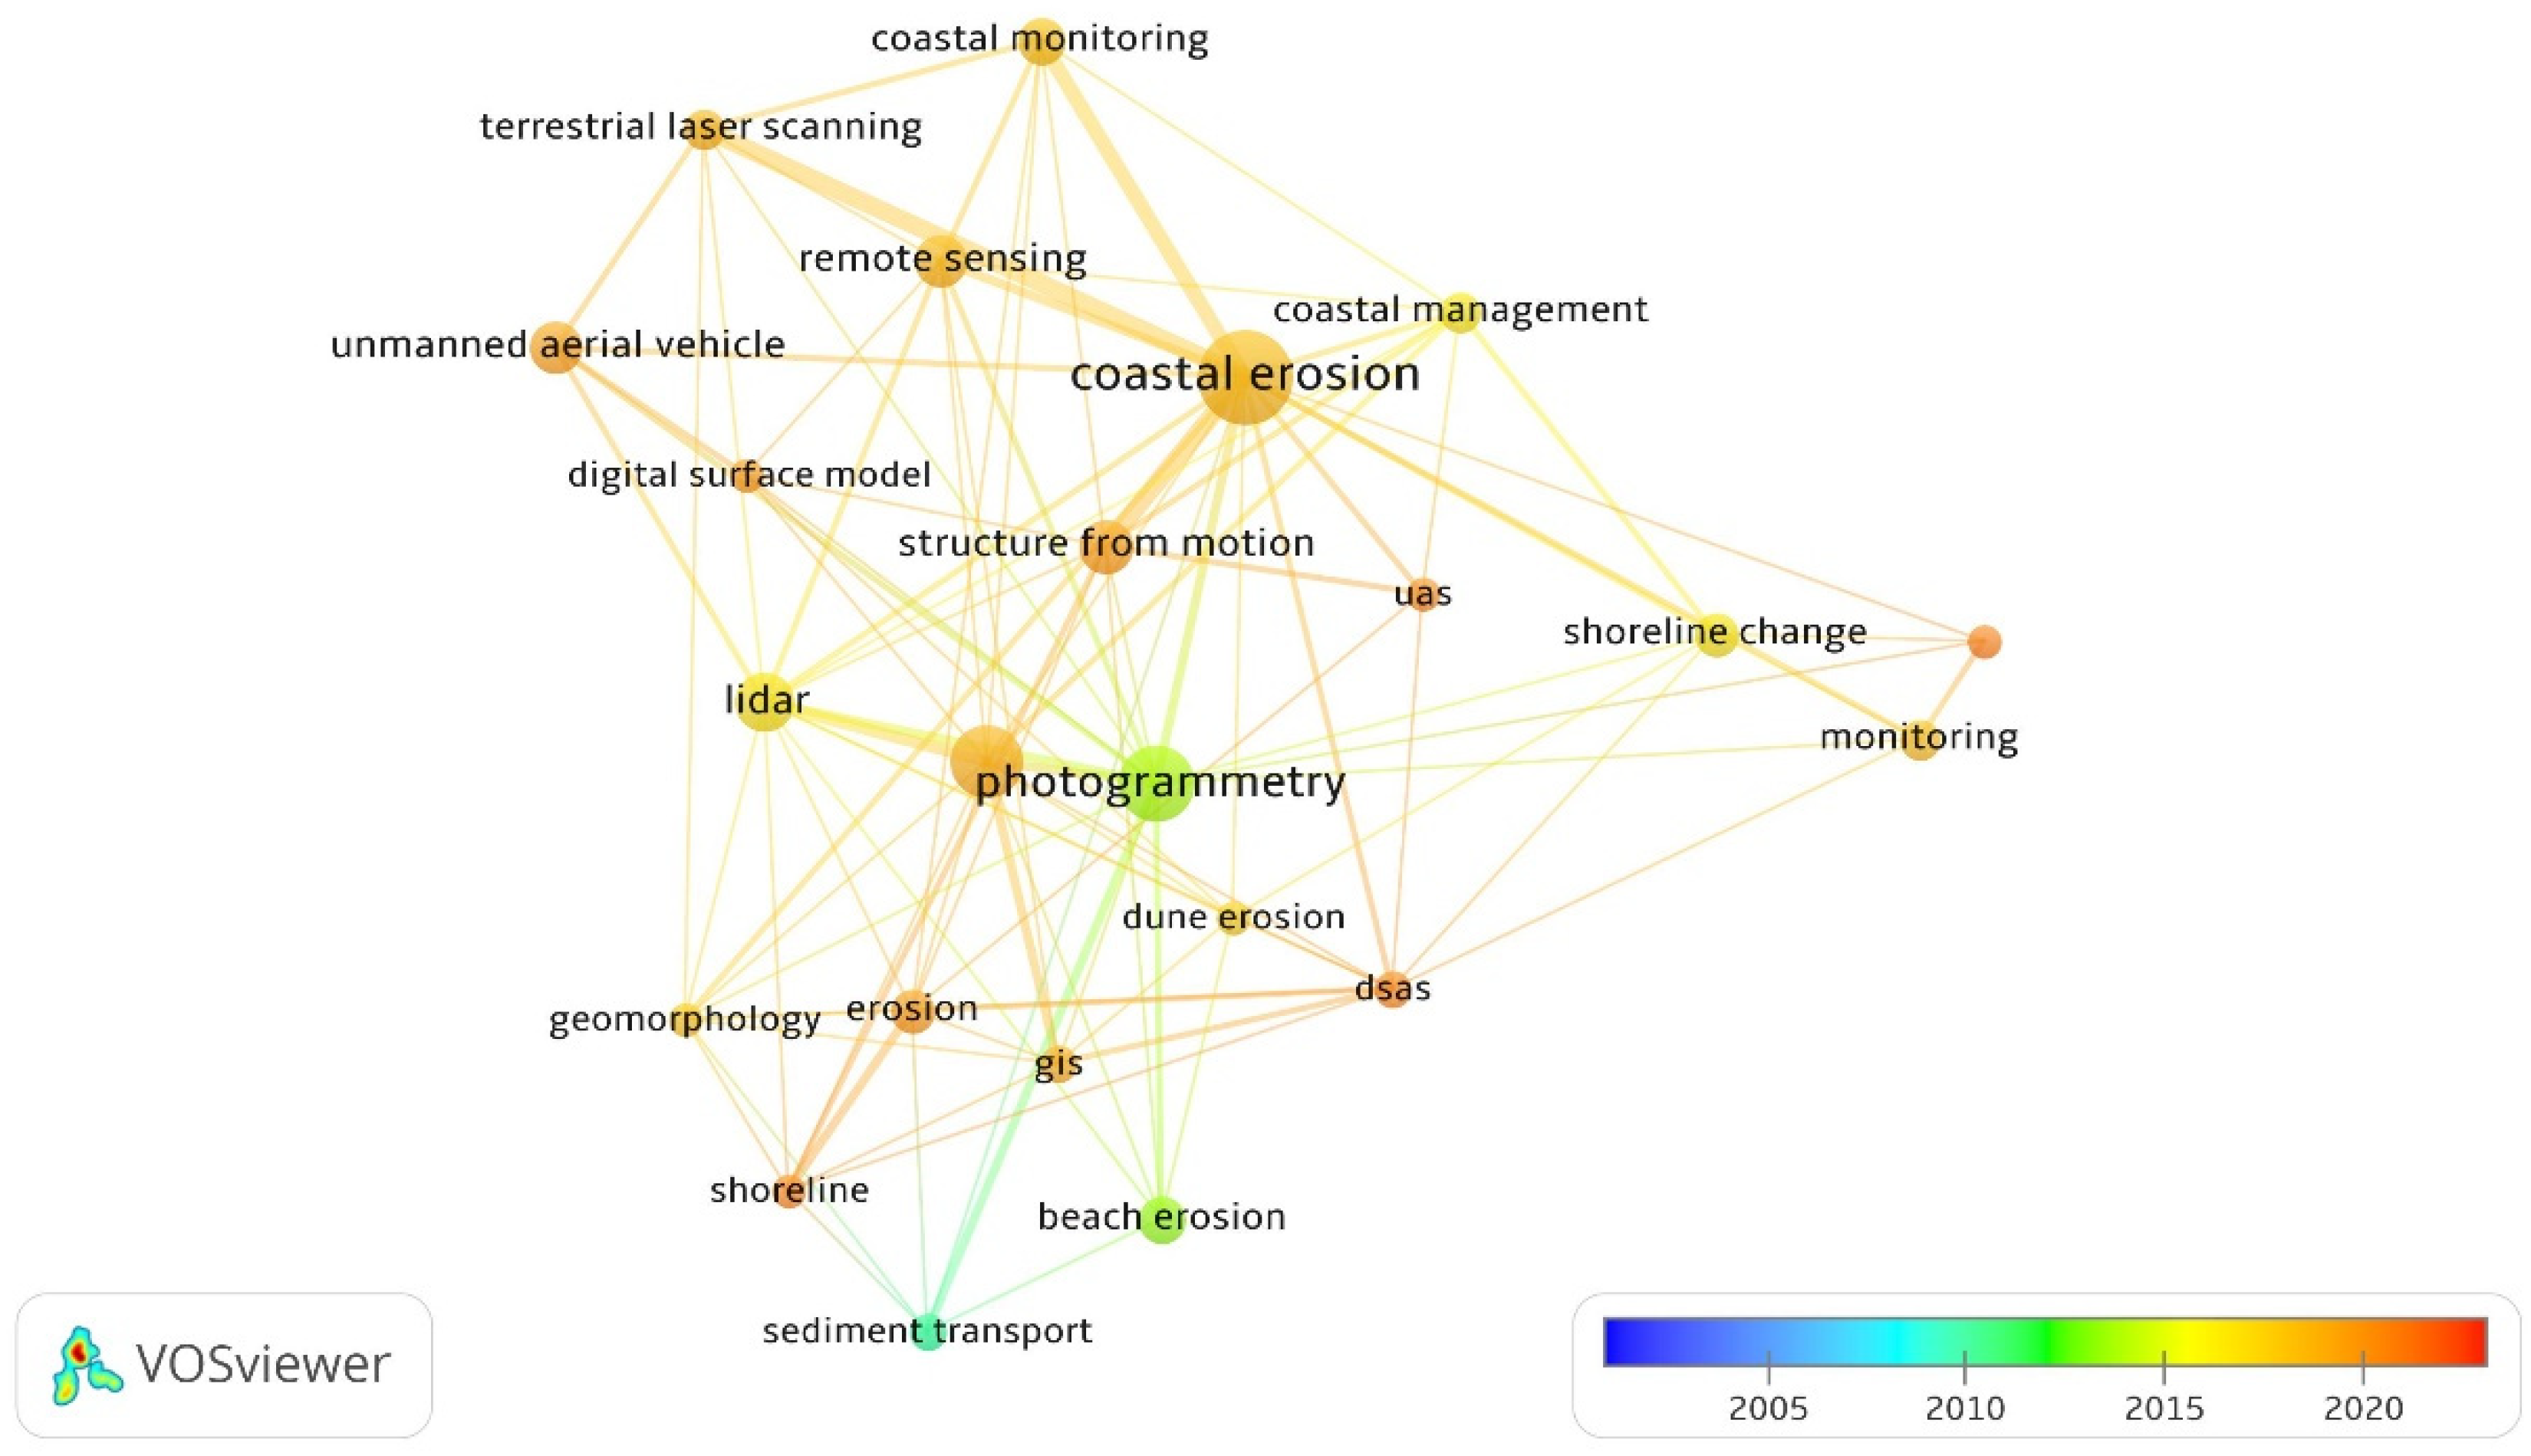
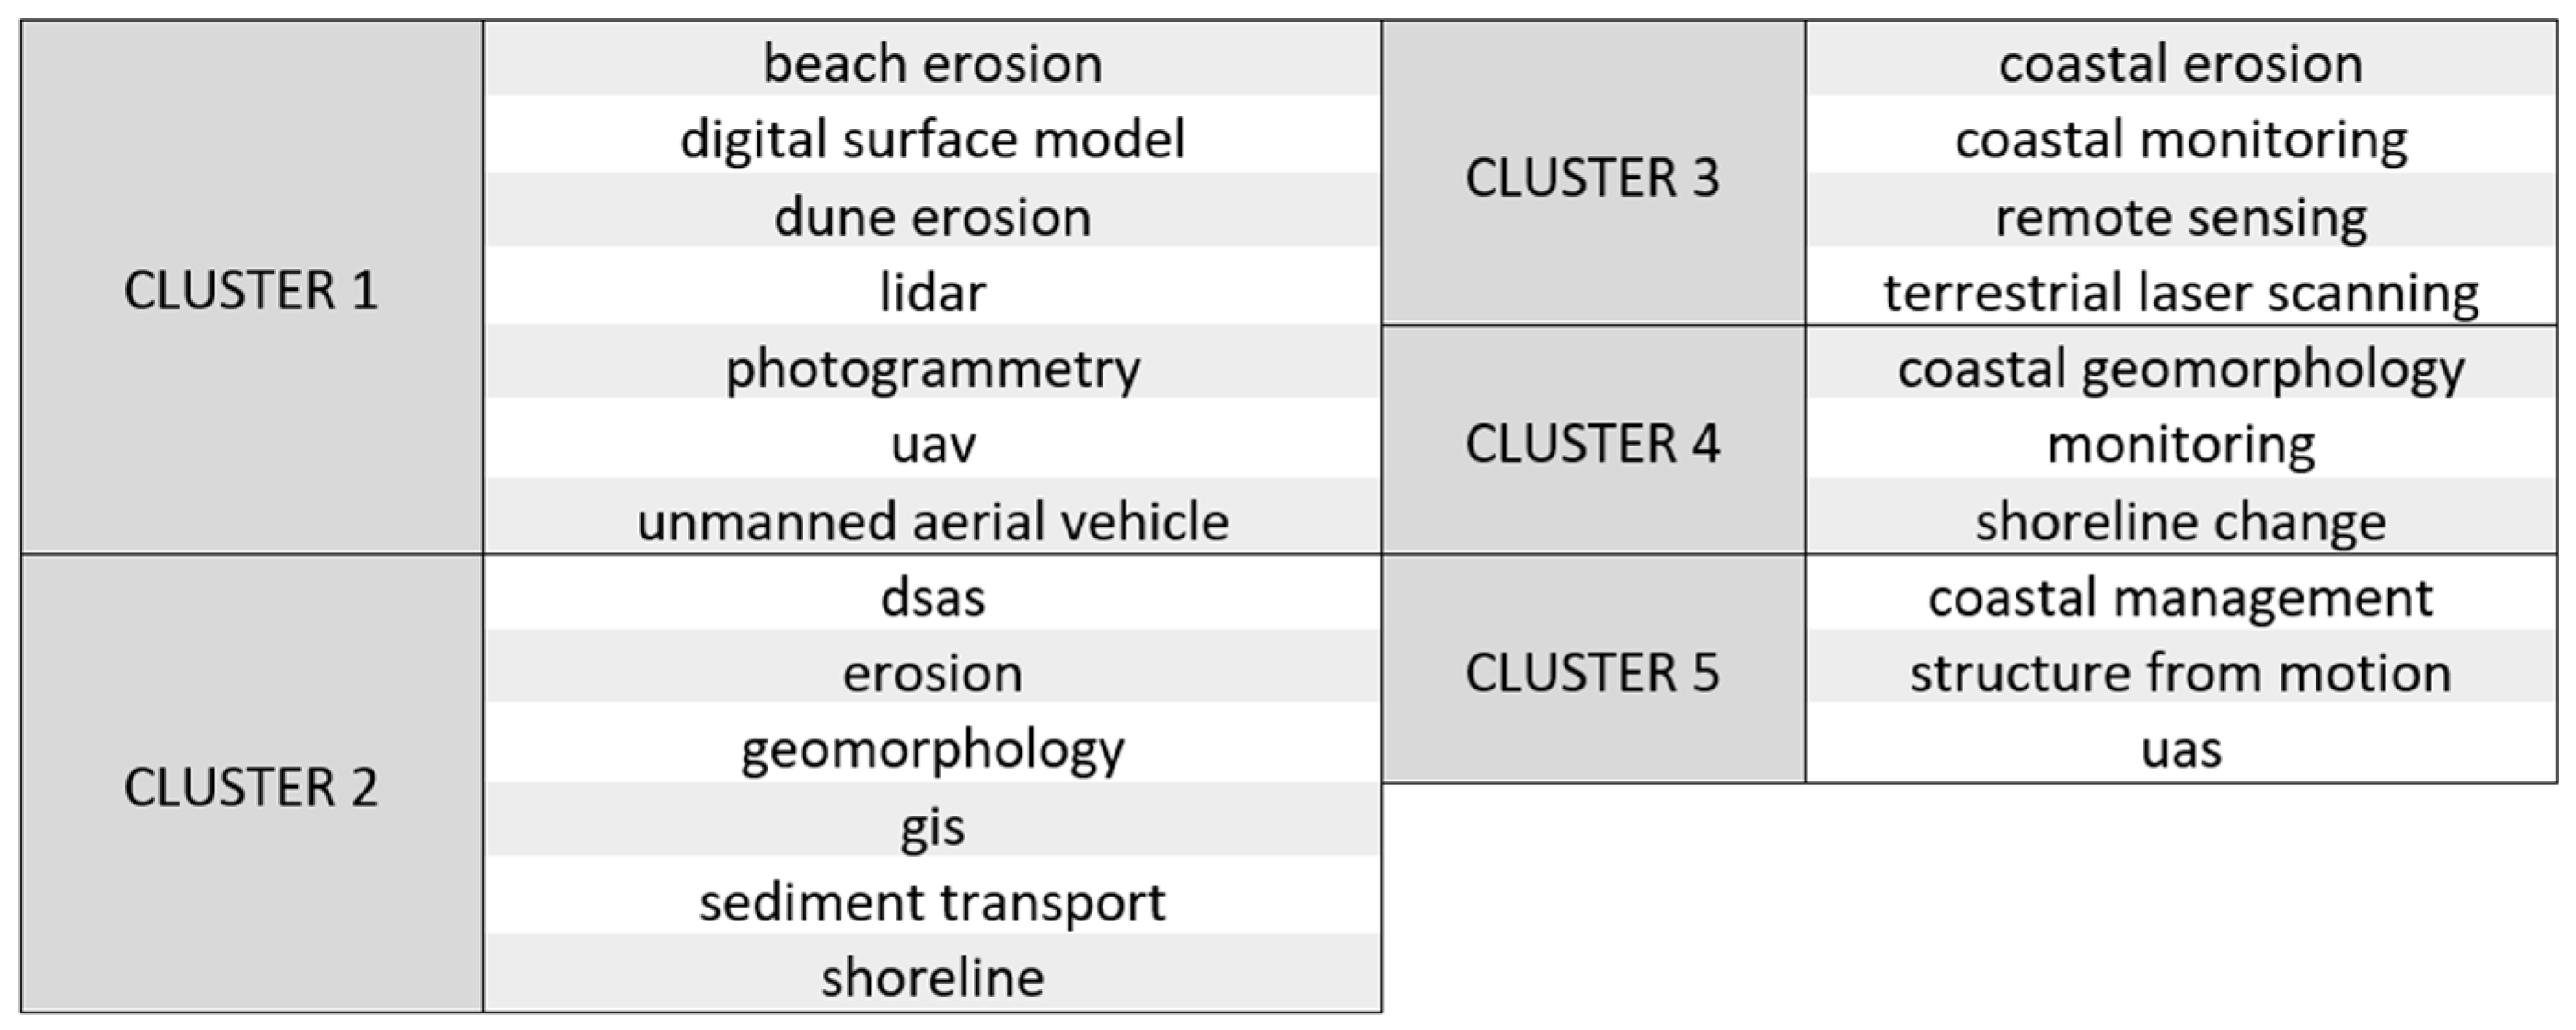
3.1. Keyword Analysis

The authors’ choice of keywords significantly impacts the way the article is represented and disseminated in scientific communities. Keywords identify the key research topics and determine the potential for an article to succeed or fail [43,44]. Keyword analysis concerns the compilation of the keywords of all related publications in a given scientific area and is a tool for highlighting broader research trends.
As previously mentioned, keyword analysis in this study was also carried out in two different periods of time (2002–2017 and 2018–2022). By doing so, it was clear that the information was more complete, which allowed us to ascertain the most popular topics in each period, as presented in Table 2.
Some inconsistencies in this analysis were eliminated by mixing keywords, for example “uav” and “unmanned aerial vehicle” or “lidar” and “laser scanning”, which have the same meaning.
Table 2 shows that the keyword “coastal erosion” was frequently used in both periods of the analysis, hinting at the importance of this geomorphological phenomenon in scientific studies. The analysis also underlines the emergence of a new concept: “structure from motion”. This concept refers to a photogrammetric technique for creating 3D structures from 2D image sequences that may be coupled [45]. The fact that this concept became very popular since 2018 explains why the keyword “photogrammetry” appeared less frequently in the last period.
Another conclusion that can be drawn from this analysis is related to the growing use of the keyword “lidar”. This technology has aroused growing interest among scientific researchers due to its ability to produce results with high spatial resolution and relative ease [46,47]. Monitoring studies, of the coastline or otherwise, using LiDAR tools have increased slightly. Since these tools can be coupled with drones, the two terms are closely connected, thus highlighting yet another advantage of using UAVs—the ability to carry different equipment that is more effective and adaptable to each study objective.
This analysis traces the use of the keyword “dsas” from 2018 to 2022. DSAS (Digital Shoreline Analysis System) is a plugin developed by USGS in the early 1990s [48] that enables the quantitative assessment of shoreline changes over time using spatial data. However, it was an obsolete tool that was developed over the years, and only boasted a strong presence from 2016 onwards. Nowadays, due to improvements added to the plugin, it can be used for other applications [49].
Figure 2 illustrates the keyword network using VOSviewer and the keyword clusters.
Only keywords shown at least five times were used for this analysis. Each cluster represents the keywords that were most frequently used together. In the keyword network, the width of the line represents the strength of the link between each keyword with other keywords. Thus, the keywords with the strongest links are “coastal erosion” with “structure from motion” and “coastal erosion” with “terrestrial laser scanning”. The size of the circles in the keyword network represents the frequency with which each keyword was used. The variation in the use of keywords over the years is also visible in the keyword network, as the title at the bottom right suggests. The years of most intense bibliographic output in this scientific area are also the years when the keywords were most frequent.

3.2. Influential Authors

In this section, we ascertained the most influential authors. To this end, the most cited authors and those with the most prominent publications were analysed.
The 160 publications included in this bibliometric analysis represent 607 authors. Once more, these authors were analysed over two periods of time (2002–2017 and 2018–2022). This division allowed us to track the most influential authors in these two periods when scientific production was quite different in quantitative terms. This analysis allows us to point out key authors among few publications and key authors among many publications.
Table 3 highlights the 10 authors with most references in the two periods of analysis.
The most cited authors who published between 2002 and 2017 have more citations but fewer publications compared to the most cited authors who published between 2018 and 2022. This shows that scientific publications in this field of research grew exponentially since 2018, consequently distributing citations across more publications and more authors. Until 2017, the rate of publications was relatively low, so few publications had a high number of citations.
Of the 607 authors, only 18 published three or more papers, and, among these 18 authors, only 2 have more than 100 citations. Consequently, these are the top authors concerning the use of UAVs for monitoring coastline changes. These figures show that authors do not publish very often on this topic.

3.3. Citation Analysis

Citation analysis involves studying the impact of the papers. Although prone to some errors of analysis (i.e., citation bias, self-citation), it is probably the most traditional method used in bibliometrics as an approximate measure of scientific quality, particularly in the case of individual researchers, and the rankings of universities and institutions [50,51].
The citations also reflect the importance and strength of the papers’ contributions to the literature on a specific topic [52]. Citation analysis was carried out herein to identify the most influential studies on monitoring shoreline changes using UAVs. Table 4 lists the 10 papers with the most citations for the periods 2002–2017 and 2018–2022.
The articles by Harwin and Lucieer [53] and Gonçalves and Henriques [20] were the most cited among those published from 2002 to 2017, with 414 and 334 citations, respectively.
Harwin and Lucieer [53] assessed the accuracy of the point clouds generated on the basis of the field survey points. The authors used the TerraLuma UAV with an RTK GPS to acquire Ground Control Points (GCP) across the South Australian coastline. In this study, the distribution and number of GCPs varied in order to determine the best method. When the GCP targets are well positioned, i.e., they are large (greater than 10 cm in diameter) and have a visibly different colour from the surrounding landscape, the results are more accurate. Assessing the accuracy of the point clouds was an essential step to show that drones can be used for environmental monitoring, namely the geomorphological changes in the Earth’s surface. In particular, the study of coastal erosion requires 3D point clouds with decimetric accuracy, and the authors claim that geomorphological changes cannot be monitored using traditional aerial surveying or satellite sensing. The authors also found some limitations of this method, namely lower accuracy of the point clouds in areas where dense vegetation or homogeneous texture hindered penetration.
The authors found that by flying at an altitude of 50 metres and with an overlap of 70% to 90%, they were able to obtain a point cloud with 2.5 cm to 4 cm accuracy. This paper is extremely important, because it provides meaningful insight on the method to be applied in drone mapping for obtaining data with a high accuracy. This paper by Harwin and Lucieer [53] presents a methodology with wide applicability in several scientific areas that use aerial mapping (i.e., mining, farming, habitat mapping, etc.), which explains the high number of citations in this publication.
The second most cited publication by Gonçalves and Henriques [20] addresses the use of UAVs for mapping and monitoring sand dunes and beaches. A very light, fixed-wing drone (SwingletCam) was used in this study. Agisoft Metashape 1.7 software helped to align the images, extract the point clouds, build the digital surface model and produce orthophotos. As in the most cited paper [53], for this trial GCPs were mapped with a differential GPS receiver for higher positional accuracy. This study was carried out in two sensitive areas of the northwest coast of Portugal. This methodology allowed the authors to obtain DTMs with a vertical accuracy of about 3.5 cm to 5 cm, very similar to the resolution of the orthorectified image (3.2–4.5 cm). Gonçalves and Henriques [20] concluded that unmanned aerial vehicles can replace many of the conventional flights, with the advantage of low data acquisition costs, without any loss in the quality of topographic data and aerial images. Similarly to the paper previously analysed, these authors also underscore some limitations of the use of drones in coastal areas, mainly due to adverse weather conditions that are often an obstacle to carrying out aerial surveys. Stronger winds, for example, mean that deadlines must be extended, which creates pressure on financial and human resources. This paper is widely cited due to the high level of detail in the way it describes the methodology used and explains and justifies the results obtained. Consequently, it served as a basis for many subsequent works.
In the second period of analysis (2018–2022), the article with the most references was by Laporte-Fauret et al. [54]. Its authors proposed a low-cost and replicable approach for monitoring changes in the morphology of coastal dunes, which, combined with a simple, effective, and permanent installation of GCPs, can be applied to routine mapping for monitoring the morphological changes in dunes, particularly after each storm. To this end, Laporte-Fauret et al. [54] used DJI Phantom 4 to remotely detect 4 km of coastline, which translated into 1 km2. The results produced a digital terrain model with a vertical error of 0.5 m. The authors note that by using automatic flight plans it is possible to replicate exactly the same flight lines in multiple surveys with high temporal resolution. This paper analyses the detailed morphological evolution over a 6-month period in winter, and the results show a coastline that is constantly changing according to sea conditions and wind processes.

3.4. Co-Citations Analysis

According to Gmur [70], document co-citation analysis offers a means of identifying similar publications and groups them together. A careful analysis of a cluster may reveal a common field of research among the publications. To identify related thematic areas and the intellectual patterns of the publications, the co-citation of literature on the use of drones for coastal change monitoring was searched. Small [71] thus recommended co-citation analysis for studying the most influential research in a scientific field. In order to limit the cluster to the most significant papers [24], we decided on a co-citation threshold of 10, which means that at least two papers must have been cited together in 10 or more different publications. The clusters were also forged with a minimum size of 1 and without any method for merging smaller clusters with larger ones. This resulted in six clusters based on the similarities between the studies and their intellectual structure. Table 5 shows the breakdown of publications by cluster.
CLUSTER 1—This cluster includes 11 publications, only two of which were prior to 2015. They focus on the following key topics: the morphodynamics of sand dunes, the optimisation of the use of Ground Control Points, and high-resolution surveys conducted using low-cost drones.
On the morphodynamics of sand dunes, Patrick Hesp [75] provides an overview of the formation, geomorphology, and evolution of sand dunes in a range of conditions. This publication describes how the advance or retreat of the sea, wind conditions, the amount and type of vegetation, and sediment transport rates impact the structure of dunes. This cluster includes yet another publication on the morphodynamics of the dune system. The key lesson learnt from this publication is that, although systematic, it is almost impossible to predict the natural conditions of dune systems [72]. In the cluster, some of the most cited references in articles in the WoS database also address the sub-topic of high-resolution surveys. The authors state that the use of drones is a method well suited to research groups intending to monitor coastline changes, as they deliver results with high resolution and accuracy levels, reaching centimetre values [55,77]. Furthermore, these authors consider that, since it is a low-cost method, it is also an opportunity for developing countries lacking in data. This cluster also refers to some authors who, in their publications, apply methodologies related to the use of drones and coastal monitoring. Also noteworthy are the authors who present new distribution and operating techniques for optimising GCPs in order to obtain more accurate topography data [18,20,74,76,77].
CLUSTER 2—This cluster includes eight publications. The main sub-theme is the SfM (structure-from-motion) technique. According to some authors, the SfM technique allows for point cloud data to be obtained with centimetre-level precision through aerial surveys using drones. The SfM technique is mostly used for 3D modelling. However, if the target is the land surface, this technique may not be used, as it does not have the capability to penetrate vegetation [53,85]. Some authors with papers included in this cluster have used their studies to compare the results of aerial surveys using drones with those of LiDAR surveying. These authors consider that there are advantages and disadvantages to both approaches. As far as light is concerned, LiDAR fails where woodland is abundant or in caves and there is not enough sunlight. In some cases, the investment in such an expensive tool as LiDAR is thus not practical or cost-efficient. The authors assume that this may be the main strength of drone surveys: the fact that the drone is an affordable way to obtain results of high quality and scientific accuracy. On the other hand, in favourable environments, LiDAR can deliver more accurate and precise results [79,80].
CLUSTER 3—The three most cited publications in this cluster discuss coastal mapping techniques, digitization and correction of old aerial photographs, and techniques for shoreline detection, among other topics. Concerning coastline detection, the authors identified some methods for tracking shorelines based on scientific criteria, e.g., aerial photographs, coastlines using GPS, remote sensing, multispectral images, LiDAR, and microwave sensors [86].
CLUSTER 4—In this cluster, three publications explore new equipment and drones and discuss the state of the art in the use of drones for coastal change monitoring. On the state of the art of this scientific approach, a publication in this cluster addresses several methods previously used to monitor the coastline via aerial surveys: fixed-wing drones, rotary-wing drones, air balloons, and kites. The author highlights the multiple capabilities of drones, especially rotary-wing drones, in various scientific areas. The author refers to drones as a tool that is easy to come by, easy to fly and use, cheap, and practical for data acquisition, among others advantages [89].

3.5. Country and Academic Institution Analysis

Through this analysis, we sought to map the geographic distribution of researchers (and their academic institutions) who fostered the use of drones for monitoring shoreline changes. The diversity of countries and academic institutions is remarkable. In the first period of analysis, the United States of America (USA), France, the United Kingdom, Greece, and Italy are the five top countries with the highest number of publications in this field of research between 2002 and 2017, as shown in Table 6.
However, taking a closer look at the number of citations of publications in this same period, we see that some countries with fewer publications have more citations than countries with more publications. This may reflect the quality of research in some countries such as Australia, the USA, and Canada, which are suffering from coastal erosion [92].
In the second period of analysis (2018–2022), the USA and France are still leaders in the research area in terms of the number of publications. Countries such as South Korea, Spain, Italy, and Portugal have published exponentially more papers in the WoS database. However, we must highlight Portugal and Spain as the countries with the highest average number of citations per paper from 2018 to 2022.
Since most researchers are linked to a university, it is also important to look into the universities that have contributed the most and the best to the knowledge on using drones for coastal surveying.
The analysis carried out using the Biblioshiny package of R-Studio’s bibliometrix library shows that the University of Coimbra (Portugal) published the most papers (14) in the WoS database between 2002 and 2022, followed by the Université de Bordeaux (France) and the Universidad de Cádiz (Spain), both with 11 papers published. Table 7 provides the top 15 universities worldwide in terms of number of published papers.

3.6. Article’s Sources Analysis

The selection of articles presented in this study includes a wide range of journals. As described in Table 8 and Table 9, the Journal of Coastal Research has published the most papers on the use of drones for coastal monitoring since 2002. However, it does not have the highest number of citations. Between 2002 and 2017, Geomorphology was the journal with the most citations, i.e., 547 citations in only two articles. From 2018 to 2022, the number of publications in this scientific area grew exponentially.
Analysing Table 7 and Table 8, it can be seen that the number of articles published in most of these journals more than doubled. Between 2018 and 2022, the journal with the most articles was Journal of Coastal Research (13 articles), followed by Remote Sensing and Earth Surface Processes and Landforms (10 and 7 articles, respectively). Regarding the number of citations, Remote Sensing was visibly the journal with the most citations (126), followed by Science of the Total Environment, with 113 citations in five articles.

3.7. Limitations and Potentials of UAVs for Coastal Monitoring

The current study conducted a comprehensive analysis of the intellectual structure of research on the use of drones for coastal change surveying, resulting in new insight for future research. A careful review of the selected articles and the use of citation and co-citation analysis techniques allowed us to point out the research topics with the highest impact. In turn, this helped us conclude that drones must be used more efficiently in order to take more advantage of this technology for faster and more accurate and economical surveys. Thus, the current study found that this technology has some barriers that prevent the most effective use of drones. Such barriers are described in Table 10.
In addition to the limitations, the authors of the reviewed documents identified advantages of using UAVs to monitor coastal change over other methods and other technologies (Table 11).
In fact, the advantages identified by different authors show the potential of these instruments for collecting data with high quality and resolution in very diverse operating conditions and when applied to different areas of research, as well as their high potential for interoperability with many other technologies and systems. The UAV industry is also expanding and the growth in this sector and the prospect of sales show that there is a growing market for this type of technology [103].
Consequently, future research on drones should address these barriers by conducting empirical research to find alternatives and/or solutions for coastal surveying with drones. However, the range of advantages they offer will be a huge incentive to overcome the few existing obstacles, given the investment being made by the industry, offering solutions for a wide range of possible application areas and at a constantly decreasing cost.
A final consideration related to this work is that it has some limitations. Firstly, it is important to note that the findings were determined right from the start through the choice of terms used to select the documents on which this work was based. It is extremely difficult to choose the perfect term from several that identify and concern the use of drones for monitoring coastline changes. In addition, by choosing the Web of Science database other databases, such as Scopus, were automatically excluded. These two situations were confirmed in Section 3.4. Co-Citation Analysis, where we address the articles that match the research carried out for this work but that are not part of the cluster of articles analysed herein. This is due to the fact that the keywords in some of these publications are different to those that were applied in this study, or because they are documents indexed in other databases, such as Scopus. Consequently, some documents are not included in this study, which may lead to some distancing from the reality of monitoring coastline changes using a drone. Potential bibliometric analyses could consider other databases, or other terms, or even other types of documents, such as conference papers, chapters, and books.
Despite these limitations, all 160 papers that served as the basis for this work were reviewed in order to exclude potentially unsuitable documents; thus, the research questions were answered with the appropriate scientific consistency. Therefore, the current bibliometric review helps bring to light the ties between publications and explores the intellectual structure of the research field. Furthermore, it traces the links between the different aspects of the literature, such as keywords, authors, affiliations, and countries.

4. Conclusions

The current study summarised and reviewed the existing literature on the use of UAVs for monitoring shoreline changes, although it was based on a small sample of publications, due to the specific nature of the topic covered in this study, which may have had some influence on the obtained results. Using bibliometric techniques, we sought to enhance knowledge of the intellectual structure of research on the use of drones in coastal change monitoring. In short, this analysis provides significant input by identifying and discussing the most frequent keywords, most cited authors and publications, and the journals, institutions, and countries with the most contributions to this topic. This analysis also provides suggestions for future research. Consequently, the following are our main conclusions:
-
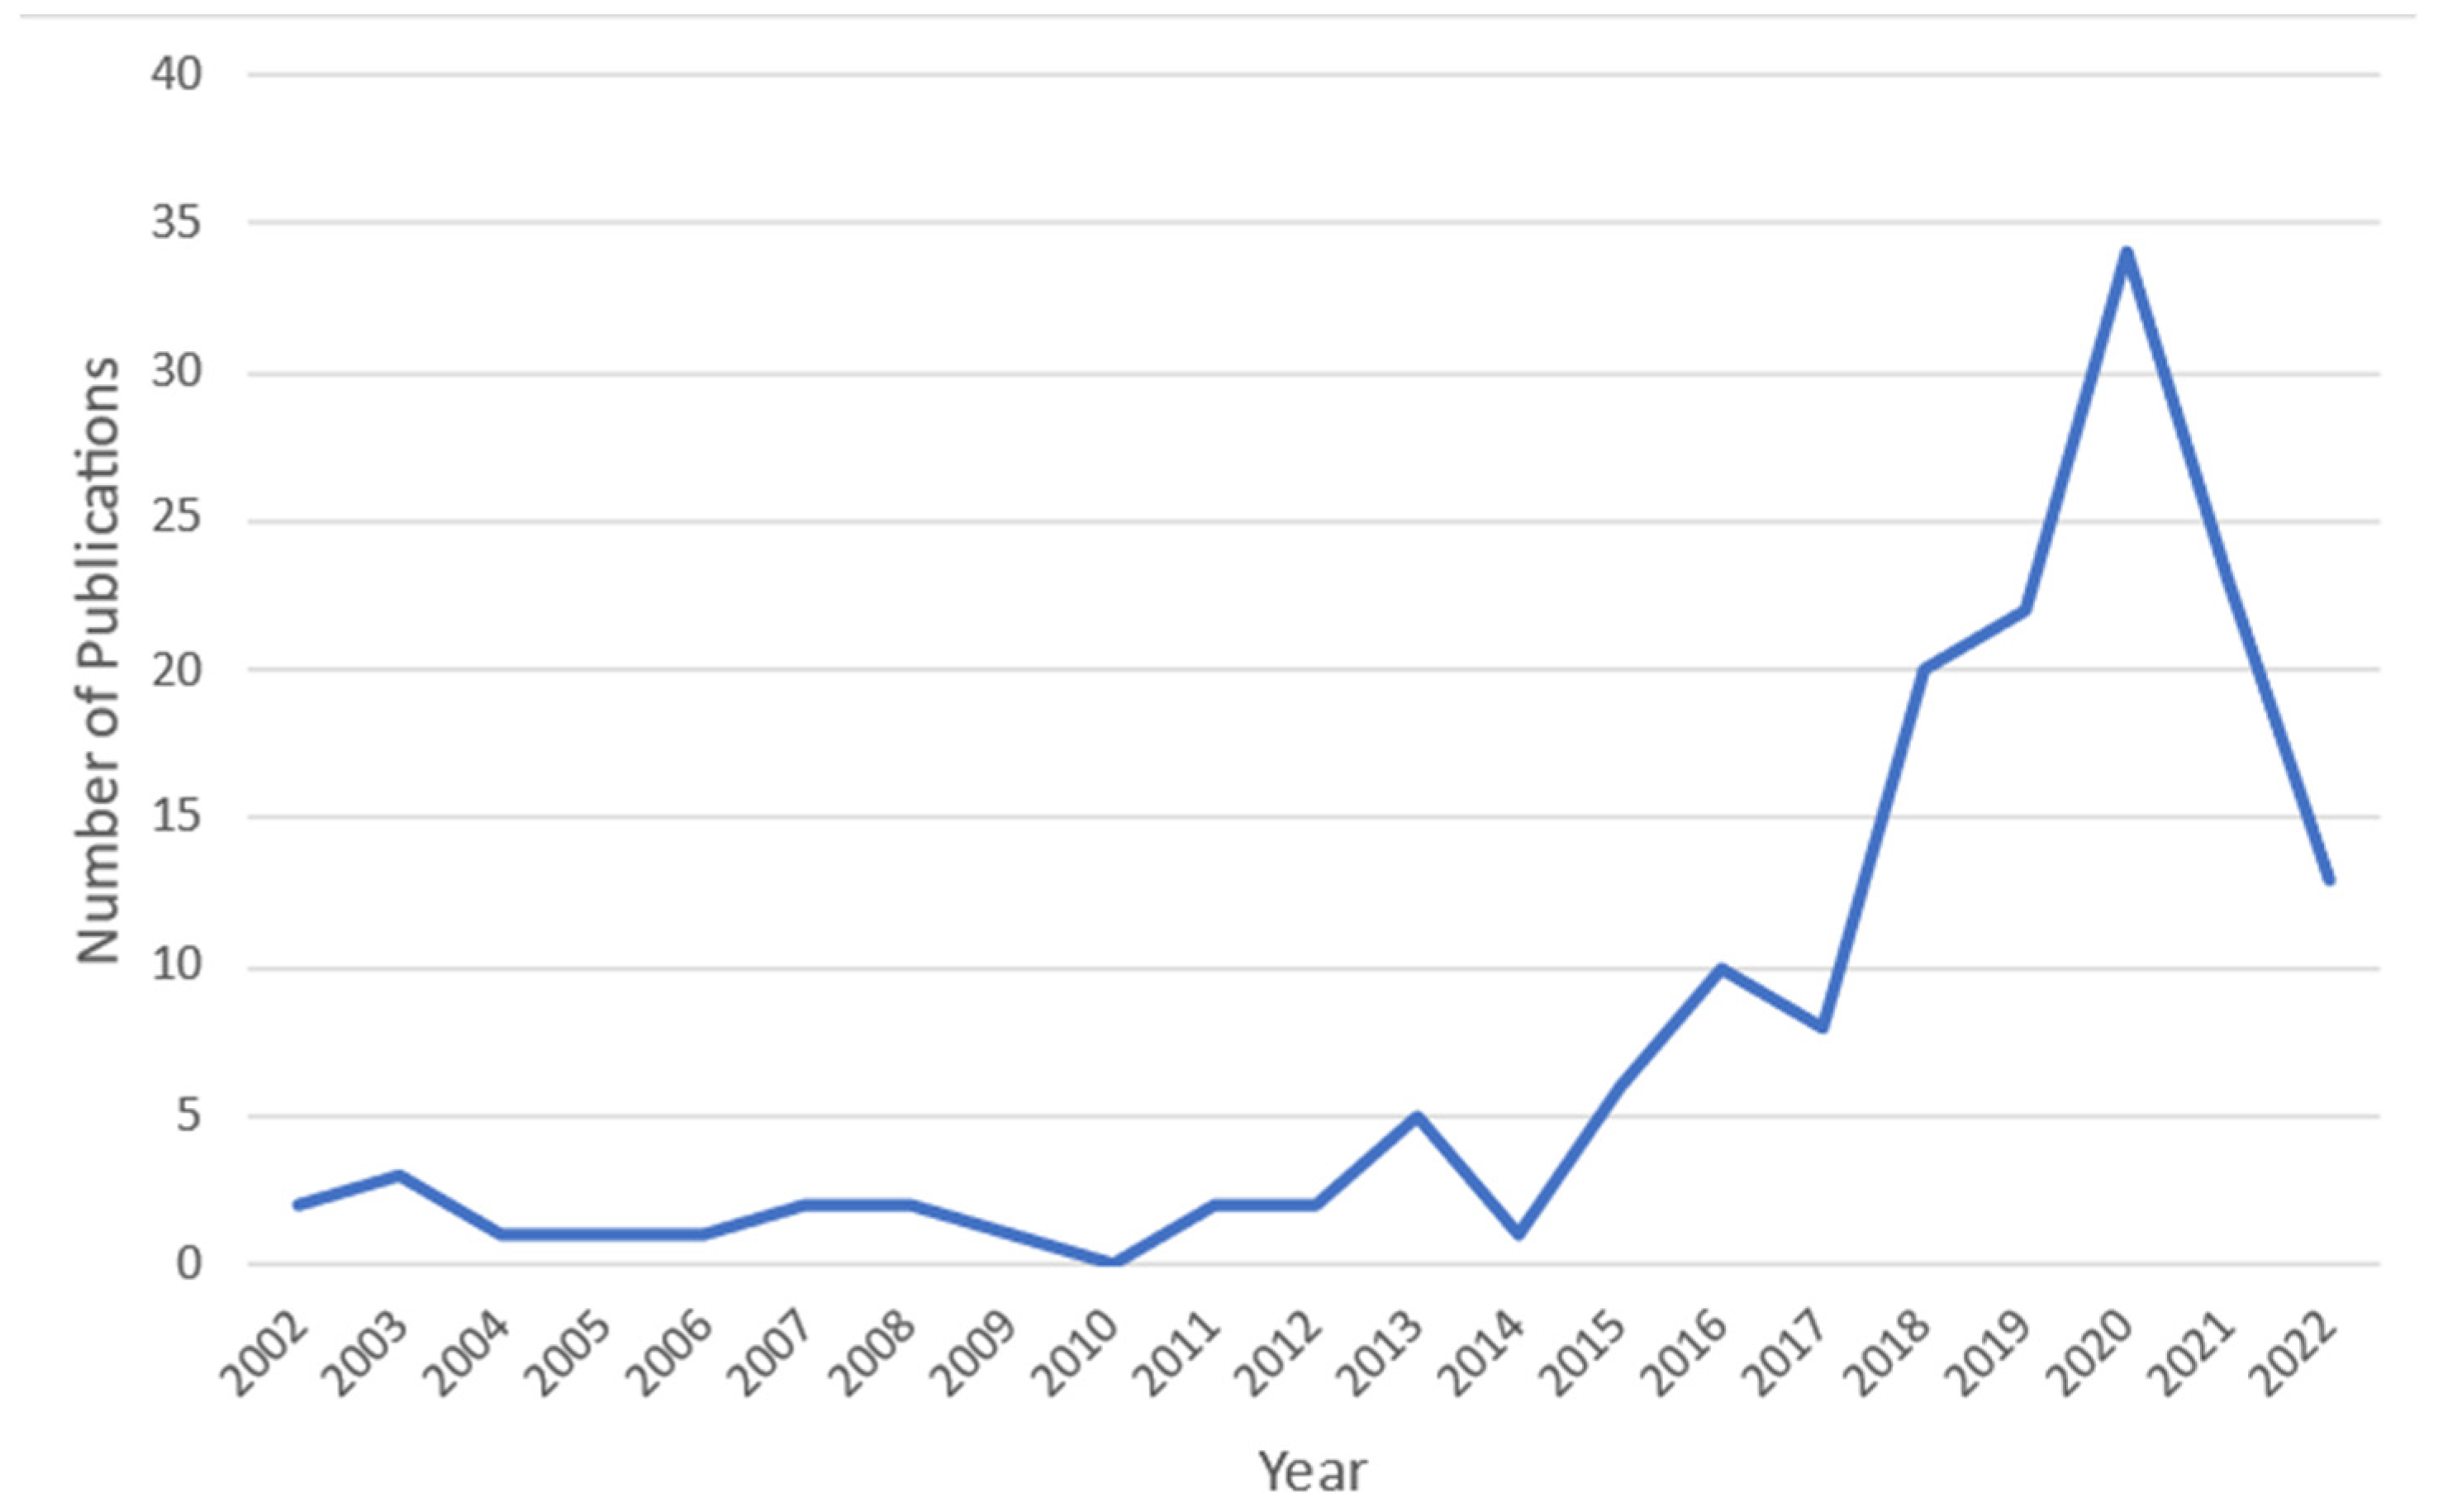
Overall, the literature has grown rapidly and attracted great attention from researchers in recent years, as the number of publications since 2017 suggests. It is believed that this topic is at its highest level in terms of innovation. However, it is important to highlight the advent of a new technology strongly linked to the use of drones for coastal monitoring: LiDAR [102].
-
This review found that the literature has evolved from the development of new coastal change monitoring methods using UAVs to suggestions for minimising errors and optimising results, and later to the incorporation of sensors and other technologies in drones (multispectral cameras, infrared, LiDAR, etc.)
-
Research on the use of drones for coastal change surveying is mainly related to the topographic/geomorphological monitoring of coastal areas in conjunction with 3D mapping. Some of the most influential studies in these areas of knowledge include [20,42,53,58,104]. These studies have developed key contributions for the use of drones for coastal change surveying.
-
The current bibliometric analysis allows us to conclude that, regarding the methodology, most of the publications reviewed were based on real-life case studies, which allows us to infer that the use of drones for monitoring shoreline changes is feasible and delivers sound, qualitative, and quantitative results.
-
Although there are still some limitations to their use in coastal change research (as well as in other areas of research), the potential of these technologies, the advantages they offer over other methodologies, and the interest revealed by the scientific community (as well as the investment being made by industry) reinforce their importance and guarantee their increasingly intensive and widespread use.

Author Contributions

Conceptualization, J.N. and A.V.; Methodology, Validation, and Formal Analysis, J.N.; Investigation and Resources, J.N., A.V., A.B.-G., S.S., S.F. and T.M.; Software, J.N., S.S. and S.F.; Data Curation and Writing—Original Draft Preparation, J.N.; Writing—Review and Editing, A.V. and A.B.-G.; Visualization and Supervision, A.V.; Project Administration, A.V.; Funding Acquisition, A.V. All authors have read and agreed to the published version of the manuscript.

Funding

This research was funded by the European Regional Development Fund—Climate Change Resilient Tourism in Protected Areas of Northern Portugal (CLICTOUR—Project, NORTE-01-0145-FEDER-000079).

Data Availability Statement

Not applicable.

Acknowledgments

The authors appreciate the support from the Communication and Society Research Centre (CECS) of the University of Minho.

Conflicts of Interest

The authors declare no conflict of interest.

References

  1. Dolan, R.; Fenster, M.S.; Holme, S.J. Temporal Analysis of Shoreline Recession and Accretion. J. Coast. Res. 1991, 7, 723–744. [Google Scholar]
  2. Misra, A.; Balaji, R. A Study on the Shoreline Changes and LAND-Use/Land-Cover along the South Gujarat Coastline. Procedia Eng. 2015, 116, 381–389. [Google Scholar] [CrossRef]
  3. Dias, J.M.A. Estudo de Avaliação Da Situação Ambiental e Propostas de Salvaguarda Para a Faixa Costeira Portuguesa; Relatório: Lisboa, Portugal, 1993. [Google Scholar]
  4. Salghuna, N.N.; Bharathvaj, S.A. Shoreline Change Analysis for Northern Part of the Coromandel Coast. Aquat. Procedia 2015, 4, 317–324. [Google Scholar] [CrossRef]
  5. Gonçalves, G.; Santos, S.; Duarte, D.; Gomes, J. Monitoring Local Shoreline Changes by Integrating UASs, Airborne LiDAR, Historical Images and Orthophotos. In Proceedings of the 5th International Conference on Geographical Information Systems Theory, Applications and Management, Crete, Greece, 3–5 May 2019; SCITEPRESS—Science and Technology Publications: Setúbal, Portugal, 2019; pp. 126–134. [Google Scholar]
  6. Filatova, T.; Voinov, A.; van der Veen, A. Land Market Mechanisms for Preservation of Space for Coastal Ecosystems: An Agent-Based Analysis. Environ. Model. Softw. 2011, 26, 179–190. [Google Scholar] [CrossRef]
  7. Spalding, M.D.; McIvor, A.L.; Beck, M.W.; Koch, E.W.; Möller, I.; Reed, D.J.; Rubinoff, P.; Spencer, T.; Tolhurst, T.J.; Wamsley, T.V.; et al. Coastal Ecosystems: A Critical Element of Risk Reduction. Conserv. Lett. 2014, 7, 293–301. [Google Scholar] [CrossRef]
  8. Liquete, C.; Piroddi, C.; Drakou, E.G.; Gurney, L.; Katsanevakis, S.; Charef, A.; Egoh, B. Current Status and Future Prospects for the Assessment of Marine and Coastal Ecosystem Services: A Systematic Review. PLoS ONE 2013, 8, e67737. [Google Scholar] [CrossRef]
  9. Jaafar, S.N.; Yusoff, M.M.; Hua, A.K.; Ping, O.W. How Possible the Coastal Erosion and Coastal Deposition to Influenced on the Life Quality of Kemeruk Residents? A Structure Equation Model Study. Int. J. Acad. Res. Environ. Geogr. 2018, 5, 59–69. [Google Scholar]
  10. Gu, M.; Wong, P.P. Residents’ Perception of Tourism Impacts: A Case Study of Homestay Operators in Dachangshan Dao, North-East China. Tour. Geogr. 2006, 8, 253–273. [Google Scholar] [CrossRef]
  11. Short, A.D.; Trembanis, A.C. Decadal Scale Patterns in Beach Oscillation and Rotation Narrabeen Beach, Australia—Time Series, PCA and Wavelet Analysis. J. Coast. Res. 2004, 20, 523–532. [Google Scholar] [CrossRef]
  12. Saito, K.; Spence, R.J.S.; Going, C.; Markus, M. Using High-Resolution Satellite Images for Post-Earthquake Building Damage Assessment: A Study Following the 26 January 2001 Gujarat Earthquake. Earthq. Spectra 2004, 20, 145–169. [Google Scholar] [CrossRef]
  13. Tan, Z.; Di, L.; Zhang, M.; Guo, L.; Gao, M. An Enhanced Deep Convolutional Model for Spatiotemporal Image Fusion. Remote Sens. 2019, 11, 2898. [Google Scholar] [CrossRef]
  14. Bio, A.; Bastos, L.; Granja, H.; Pinho, J.L.S.; Gonçalves, J.A.; Henriques, R.; Madeira, S.; Magalhães, A.; Rodrigues, D. Methods for Coastal Monitoring and Erosion Risk Assessment: Two Portuguese Case Studies. Rev. Gestão Costeira Integr. 2015, 15, 47–63. [Google Scholar] [CrossRef]
  15. Barry, P.; Coakley, R. Accuracy of Uav Photogrammetry Compared with Network RTK GPS. Int. Arch. Photogramm. Remote Sens. 2013, 2, 2731. [Google Scholar]
  16. Haala, N.; Cramer, M.; Weimer, F.; Trittler, M. Performance Test on UAV-Based Photogrammetric Data Collection. Int. Arch. Photogramm. Remote Sens. Spat. Inf. Sci. 2012, XXXVIII-1/C22, 7–12. [Google Scholar] [CrossRef]
  17. Vallet, J.; Panissod, F.; Strecha, C.; Tracol, M. Photogrammetric Performance of an Ultra Light Weight Swinglet “UAV”. Int. Arch. Photogramm. Remote Sens. Spat. Inf. Sci. 2012, XXXVIII-1/C22, 253–258. [Google Scholar] [CrossRef]
  18. Turner, I.L.; Harley, M.D.; Drummond, C.D. UAVs for Coastal Surveying. Coast. Eng. 2016, 114, 19–24. [Google Scholar] [CrossRef]
  19. Gonçalves, J.A.; Bastos, L.; Perez, B.; Magalhães, A. Monitoring of Beaches and Sand Dunes Using Digital Aerial Photography with Direct Georreferencing. In Proceedings of the ISPRS TC VII Symposium—100 Years ISPRS, Part B, Vienna, Austria, 5–7 July 2010; pp. 228–232. [Google Scholar]
  20. Gonçalves, J.A.; Henriques, R. UAV Photogrammetry for Topographic Monitoring of Coastal Areas. ISPRS J. Photogramm. Remote Sens. 2015, 104, 101–111. [Google Scholar] [CrossRef]
  21. Arora, S.D.; Chakraborty, A. Intellectual Structure of Consumer Complaining Behavior (CCB) Research: A Bibliometric Analysis. J. Bus. Res. 2021, 122, 60–74. [Google Scholar] [CrossRef]
  22. Kapoor, K.K.; Tamilmani, K.; Rana, N.P.; Patil, P.; Dwivedi, Y.K.; Nerur, S. Advances in Social Media Research: Past, Present and Future. Inf. Syst. Front. 2018, 20, 531–558. [Google Scholar] [CrossRef]
  23. Mishra, D.; Luo, Z.; Jiang, S.; Papadopoulos, T.; Dubey, R. A Bibliographic Study on Big Data: Concepts, Trends and Challenges. Bus. Process Manag. J. 2017, 23, 555–573. [Google Scholar] [CrossRef]
  24. Small, H. Visualizing Science by Citation Mapping. J. Am. Soc. Inf. Sci. 1999, 50, 799–813. [Google Scholar] [CrossRef]
  25. Tahai, A.; Rigsby, J.T. Information Processing Using Citations to Investigate Journal Influence in Accounting. Inf. Process. Manag. 1998, 34, 341–359. [Google Scholar] [CrossRef]
  26. Casillas, J.; Acedo, F. Evolution of the Intellectual Structure of Family Business Literature: A Bibliometric Study of FBR. Fam. Bus. Rev. 2007, 20, 141–162. [Google Scholar] [CrossRef]
  27. Thelwall, M. Bibliometrics to Webometrics. J. Inf. Sci. 2008, 34, 605–621. [Google Scholar] [CrossRef]
  28. Folharini, S.; Vieira, A.; Bento-Gonçalves, A.; Silva, S.; Marques, T.; Novais, J. Bibliometric Analysis on Wildfires and Protected Areas. Sustainability 2023, 15, 8536. [Google Scholar] [CrossRef]
  29. dos Santos, S.M.B.; Bento-Gonçalves, A.; Vieira, A. Research on Wildfires and Remote Sensing in the Last Three Decades: A Bibliometric Analysis. Forests 2021, 12, 604. [Google Scholar] [CrossRef]
  30. Zhang, H.; Huang, M.; Qing, X.; Li, G.; Tian, C. Bibliometric Analysis of Global Remote Sensing Research during 2010–2015. ISPRS Int. J. Geo-Inf. 2017, 6, 332. [Google Scholar] [CrossRef]
  31. Zupic, I.; Čater, T. Bibliometric Methods in Management and Organization. Organ. Res. Methods 2015, 18, 429–472. [Google Scholar] [CrossRef]
  32. Xie, H.; Zhang, Y.; Wu, Z.; Lv, T. A Bibliometric Analysis on Land Degradation: Current Status, Development, and Future Directions. Land 2020, 9, 28. [Google Scholar] [CrossRef]
  33. Nita, A. Empowering Impact Assessments Knowledge and International Research Collaboration—A Bibliometric Analysis of Environmental Impact Assessment Review Journal. Environ. Impact Assess. Rev. 2019, 78, 106283. [Google Scholar] [CrossRef]
  34. Aria, M.; Cuccurullo, C. Bibliometrix: An R-Tool for Comprehensive Science Mapping Analysis. J. Informetr. 2017, 11, 959–975. [Google Scholar] [CrossRef]
  35. Rodríguez-Soler, R.; Uribe-Toril, J.; De Pablo Valenciano, J. Worldwide Trends in the Scientific Production on Rural Depopulation, a Bibliometric Analysis Using Bibliometrix R-Tool. Land Use Policy 2020, 97, 104787. [Google Scholar] [CrossRef]
  36. Bakır, M.; Özdemir, E.; Akan, Ş.; Atalık, Ö. A Bibliometric Analysis of Airport Service Quality. J. Air Transp. Manag. 2022, 104, 102273. [Google Scholar] [CrossRef]
  37. Yakath Ali, N.S.; Yu, C.; See, K.F. Four Decades of Airline Productivity and Efficiency Studies: A Review and Bibliometric Analysis. J. Air Transp. Manag. 2021, 96, 102099. [Google Scholar] [CrossRef]
  38. van Eck, N.J.; Waltman, L. Software Survey: VOSviewer, a Computer Program for Bibliometric Mapping. Scientometrics 2010, 84, 523–538. [Google Scholar] [CrossRef] [PubMed]
  39. Chen, M.; Zhang, Y.; Dong, L.; Guo, X. Bibliometric Analysis of Stroke and Quality of Life. Front. Neurol. 2023, 14, 1143713. [Google Scholar] [CrossRef]
  40. Jumansyah, R.; Dewi, N.P.; Soegoto, E.S.; Luckyardi, S.; Alshiqi, S. Modeling Islamic Marketing Research Using VOSviewer Application: A Bibliometric Analysis. J. East. Eur. Cent. Asian Res. 2023, 10, 31–45. [Google Scholar] [CrossRef]
  41. Ventura, D.; Bonifazi, A.; Gravina, M.F.; Ardizzone, G.D. Unmanned Aerial Systems (UASs) for Environmental Monitoring: A Review with Applications in Coastal Habitats. In Aerial Robots—Aerodynamics, Control and Applications; InTech: London, UK, 2017. [Google Scholar]
  42. Papakonstantinou, A.; Topouzelis, K.; Pavlogeorgatos, G. Coastline Zones Identification and 3D Coastal Mapping Using UAV Spatial Data. ISPRS Int. J. Geo-Inf. 2016, 5, 75. [Google Scholar] [CrossRef]
  43. Uddin, A.; Singh, V.K.; Pinto, D.; Olmos, I. Scientometric Mapping of Computer Science Research in Mexico. Scientometrics 2015, 105, 97–114. [Google Scholar] [CrossRef]
  44. Day, R.A. How to Write and Publish Scientific Papers. Mem. Inst. Oswaldo Cruz 1998, 93, 423–424. [Google Scholar] [CrossRef]
  45. Iglhaut, J.; Cabo, C.; Puliti, S.; Piermattei, L.; O’Connor, J.; Rosette, J. Structure from Motion Photogrammetry in Forestry: A Review. Curr. For. Rep. 2019, 5, 155–168. [Google Scholar] [CrossRef]
  46. Mallet, C.; Bretar, F. Full-Waveform Topographic Lidar: State-of-the-Art. ISPRS J. Photogramm. Remote Sens. 2009, 64, 1–16. [Google Scholar] [CrossRef]
  47. Baltsavias, E.P. A Comparison between Photogrammetry and Laser Scanning. ISPRS J. Photogramm. Remote Sens. 1999, 54, 83–94. [Google Scholar] [CrossRef]
  48. Kale, M.M.; Ataol, M.; Tekkanat, İ.S. Assessment of Shoreline Alterations Using a Digital Shoreline Analysis System: A Case Study of Changes in the Yeşilırmak Delta in Northern Turkey from 1953 to 2017. Environ. Monit. Assess. 2019, 191, 398. [Google Scholar] [CrossRef] [PubMed]
  49. Sheeja, P.S.; Ajay Gokul, A.J. Application of Digital Shoreline Analysis System in Coastal Erosion Assessment. Int. J. Eng. Sci. Comput. 2016, 6, 7876–7883. [Google Scholar]
  50. Weingart, P. Impact of Bibliometrics upon the Science System: Inadvertent Consequences? Scientometrics 2005, 62, 117–131. [Google Scholar] [CrossRef]
  51. Waltman, L.; Calero-Medina, C.; Kosten, J.; Noyons, E.C.M.; Tijssen, R.J.W.; van Eck, N.J.; van Leeuwen, T.N.; van Raan, A.F.J.; Visser, M.S.; Wouters, P. The Leiden Ranking 2011/2012: Data Collection, Indicators, and Interpretation. J. Am. Soc. Inf. Sci. Technol. 2012, 63, 2419–2432. [Google Scholar] [CrossRef]
  52. Sharma, R.; Shishodia, A.; Gunasekaran, A.; Min, H.; Munim, Z.H. The Role of Artificial Intelligence in Supply Chain Management: Mapping the Territory. Int. J. Prod. Res. 2022, 60, 7527–7550. [Google Scholar] [CrossRef]
  53. Harwin, S.; Lucieer, A. Assessing the Accuracy of Georeferenced Point Clouds Produced via Multi-View Stereopsis from Unmanned Aerial Vehicle (UAV) Imagery. Remote Sens. 2012, 4, 1573–1599. [Google Scholar] [CrossRef]
  54. Laporte-Fauret, Q.; Marieu, V.; Castelle, B.; Michalet, R.; Bujan, S.; Rosebery, D. Low-Cost UAV for High-Resolution and Large-Scale Coastal Dune Change Monitoring Using Photogrammetry. J. Mar. Sci. Eng. 2019, 7, 63. [Google Scholar] [CrossRef]
  55. Gonçalves, G.; Andriolo, U.; Pinto, L.; Bessa, F. Mapping Marine Litter Using UAS on a Beach-Dune System: A Multidisciplinary Approach. Sci. Total Environ. 2020, 706, 135742. [Google Scholar] [CrossRef] [PubMed]
  56. Brasington, J.; Langham, J.; Rumsby, B. Methodological Sensitivity of Morphometric Estimates of Coarse Fluvial Sediment Transport. Geomorphology 2003, 53, 299–316. [Google Scholar] [CrossRef]
  57. Lin, Y.-C.; Cheng, Y.-T.; Zhou, T.; Ravi, R.; Hasheminasab, S.; Flatt, J.; Troy, C.; Habib, A. Evaluation of UAV LiDAR for Mapping Coastal Environments. Remote Sens. 2019, 11, 2893. [Google Scholar] [CrossRef]
  58. Guisado-Pintado, E.; Jackson, D.W.T.; Rogers, D. 3D Mapping Efficacy of a Drone and Terrestrial Laser Scanner over a Temperate Beach-Dune Zone. Geomorphology 2019, 328, 157–172. [Google Scholar] [CrossRef]
  59. Lantuit, H.; Pollard, W.H. Fifty Years of Coastal Erosion and Retrogressive Thaw Slump Activity on Herschel Island, Southern Beaufort Sea, Yukon Territory, Canada. Geomorphology 2008, 95, 84–102. [Google Scholar] [CrossRef]
  60. Ruessink, B.G.; Arens, S.M.; Kuipers, M.; Donker, J.J.A. Coastal Dune Dynamics in Response to Excavated Foredune Notches. Aeolian Res. 2018, 31, 3–17. [Google Scholar] [CrossRef]
  61. Forbes, D.L.; Parkes, G.S.; Manson, G.K.; Ketch, L.A. Storms and Shoreline Retreat in the Southern Gulf of St. Lawrence. Mar. Geol. 2004, 210, 169–204. [Google Scholar] [CrossRef]
  62. Le Mauff, B.; Juigner, M.; Ba, A.; Robin, M.; Launeau, P.; Fattal, P. Coastal Monitoring Solutions of the Geomorphological Response of Beach-Dune Systems Using Multi-Temporal LiDAR Datasets (Vendée Coast, France). Geomorphology 2018, 304, 121–140. [Google Scholar] [CrossRef]
  63. Fletcher, C.; Rooney, M.; Barbee, M.; Lim, S.C.; Richmond, B. Mapping Shoreline Change Using Digital Orthophotogrammetry on Maui, Hawaii. J. Coast. Res. 2003, 38, 106–124. [Google Scholar]
  64. Westoby, M.J.; Lim, M.; Hogg, M.; Pound, M.J.; Dunlop, L.; Woodward, J. Cost-Effective Erosion Monitoring of Coastal Cliffs. Coast. Eng. 2018, 138, 152–164. [Google Scholar] [CrossRef]
  65. Warrick, J.A.; Ritchie, A.C.; Schmidt, K.M.; Reid, M.E.; Logan, J. Characterizing the Catastrophic 2017 Mud Creek Landslide, California, Using Repeat Structure-from-Motion (SfM) Photogrammetry. Landslides 2019, 16, 1201–1219. [Google Scholar] [CrossRef]
  66. Thornton, E.B.; Sallenger, A.; Sesto, J.C.; Egley, L.; McGee, T.; Parsons, R. Sand Mining Impacts on Long-Term Dune Erosion in Southern Monterey Bay. Mar. Geol. 2006, 229, 45–58. [Google Scholar] [CrossRef]
  67. Gonçalves, G.R.; Pérez, J.A.; Duarte, J. Accuracy and Effectiveness of Low Cost UASs and Open Source Photogrammetric Software for Foredunes Mapping. Int. J. Remote Sens. 2018, 39, 5059–5077. [Google Scholar] [CrossRef]
  68. Norcross, Z.M.; Fletcher, C.H.; Merrifield, M. Annual and Interannual Changes on a Reef-Fringed Pocket Beach: Kailua Bay, Hawaii. Mar. Geol. 2002, 190, 553–580. [Google Scholar] [CrossRef]
  69. Pikelj, K.; Ruzic, I.; Ilic, S.; James, M.R.; Kordic, B. Implementing an Efficient Beach Erosion Monitoring System for Coastal in Croatia. Ocean Coast. Manag. 2018, 156, 223–238. [Google Scholar] [CrossRef]
  70. Gmür, M. Co-Citation Analysis and the Search for Invisible Colleges: A Methodological Evaluation. Scientometrics 2003, 57, 27–57. [Google Scholar] [CrossRef]
  71. Small, H. Co-Citation in the Scientific Literature: A New Measure of the Relationship between Two Documents. J. Am. Soc. Inf. Sci. 1973, 24, 265–269. [Google Scholar] [CrossRef]
  72. Wright, L.; Short, A. Morphodynamic Variability of Surf Zones and Beaches: A Synthesis. Mar. Geol. 1984, 56, 93–118. [Google Scholar] [CrossRef]
  73. Brunier, G.; Fleury, J.; Anthony, E.J.; Gardel, A.; Dussouillez, P. Close-Range Airborne Structure-from-Motion Photogrammetry for High-Resolution Beach Morphometric Surveys: Examples from an Embayed Rotating Beach. Geomorphology 2016, 261, 76–88. [Google Scholar] [CrossRef]
  74. Casella, E.; Rovere, A.; Pedroncini, A.; Stark, C.P.; Casella, M.; Ferrari, M.; Firpo, M. Drones as Tools for Monitoring Beach Topography Changes in the Ligurian Sea (NW Mediterranean). Geo-Marine Lett. 2016, 36, 151–163. [Google Scholar] [CrossRef]
  75. Hesp, P. Foredunes and Blowouts: Initiation, Geomorphology and Dynamics. Geomorphology 2002, 48, 245–268. [Google Scholar] [CrossRef]
  76. James, M.R.; Robson, S.; D’Oleire-Oltmanns, S.; Niethammer, U. Optimising UAV Topographic Surveys Processed with Structure-from-Motion: Ground Control Quality, Quantity and Bundle Adjustment. Geomorphology 2017, 280, 51–66. [Google Scholar] [CrossRef]
  77. Long, N.; Millescamps, B.; Guillot, B.; Pouget, F.; Bertin, X. Monitoring the Topography of a Dynamic Tidal Inlet Using UAV Imagery. Remote Sens. 2016, 8, 387. [Google Scholar] [CrossRef]
  78. Scarelli, F.M.; Sistilli, F.; Fabbri, S.; Cantelli, L.; Barboza, E.G.; Gabbianelli, G. Seasonal Dune and Beach Monitoring Using Photogrammetry from UAV Surveys to Apply in the ICZM on the Ravenna Coast (Emilia-Romagna, Italy). Remote Sens. Appl. Soc. Environ. 2017, 7, 27–39. [Google Scholar] [CrossRef]
  79. Fonstad, M.A.; Dietrich, J.T.; Courville, B.C.; Jensen, J.L.; Carbonneau, P.E. Topographic Structure from Motion: A New Development in Photogrammetric Measurement. Earth Surf. Process. Landf. 2013, 38, 421–430. [Google Scholar] [CrossRef]
  80. James, M.R.; Robson, S. Straightforward Reconstruction of 3D Surfaces and Topography with a Camera: Accuracy and Geoscience Application. J. Geophys. Res. Earth Surf. 2012, 117, F03017. [Google Scholar] [CrossRef]
  81. James, M.R.; Robson, S. Mitigating Systematic Error in Topographic Models Derived from UAV and Ground-Based Image Networks. Earth Surf. Process. Landf. 2014, 39, 1413–1420. [Google Scholar] [CrossRef]
  82. Mancini, F.; Dubbini, M.; Gattelli, M.; Stecchi, F.; Fabbri, S.; Gabbianelli, G. Using Unmanned Aerial Vehicles (UAV) for High-Resolution Reconstruction of Topography: The Structure from Motion Approach on Coastal Environments. Remote Sens. 2013, 5, 6880–6898. [Google Scholar] [CrossRef]
  83. Rosser, N.J.; Petley, D.N.; Lim, M.; Dunning, S.A.; Allison, R.J. Terrestrial Laser Scanning for Monitoring the Process of Hard Rock Coastal Cliff Erosion. Q. J. Eng. Geol. Hydrogeol. 2005, 38, 363–375. [Google Scholar] [CrossRef]
  84. Snavely, N.; Seitz, S.M.; Szeliski, R. Modeling the World from Internet Photo Collections. Int. J. Comput. Vis. 2008, 80, 189–210. [Google Scholar] [CrossRef]
  85. Westoby, M.J.; Brasington, J.; Glasser, N.F.; Hambrey, M.J.; Reynolds, J.M. ‘Structure-from-Motion’ Photogrammetry: A Low-Cost, Effective Tool for Geoscience Applications. Geomorphology 2012, 179, 300–314. [Google Scholar] [CrossRef]
  86. Boak, E.H.; Turner, I.L. Shoreline Definition and Detection: A Review. J. Coast. Res. 2005, 214, 688–703. [Google Scholar] [CrossRef]
  87. Crowell, M.; Leatherman, S.P.; Buckley, M.K. Historical Shoreline Change: Error Analysis and Mapping Accuracy. J. Coast. Res. 1991, 7, 839–852. [Google Scholar]
  88. Moore, L.J. Shoreline Mapping Techniques. J. Coast. Res. 2000, 16, 111–124. [Google Scholar]
  89. Klemas, V.V. Coastal and Environmental Remote Sensing from Unmanned Aerial Vehicles: An Overview. J. Coast. Res. 2015, 315, 1260–1267. [Google Scholar] [CrossRef]
  90. Colomina, I.; Molina, P. Unmanned Aerial Systems for Photogrammetry and Remote Sensing: A Review. ISPRS J. Photogramm. Remote Sens. 2014, 92, 79–97. [Google Scholar] [CrossRef]
  91. Wheaton, J.M.; Brasington, J.; Darby, S.E.; Sear, D.A. Accounting for Uncertainty in DEMs from Repeat Topographic Surveys: Improved Sediment Budgets. Earth Surf. Process. Landf. 2009, 35, 135–156. [Google Scholar] [CrossRef]
  92. Chapman, D.M. Coastal Erosion and the Sediment Budget, with Special Reference to the Gold Coast, Australia. Coast. Eng. 1980, 4, 207–227. [Google Scholar] [CrossRef]
  93. Masroor, R.; Naeem, M.; Ejaz, W. Resource Management in UAV-Assisted Wireless Networks: An Optimization Perspective. Ad Hoc Netw. 2021, 121, 102596. [Google Scholar] [CrossRef]
  94. Huang, Y.B.; Thomson, S.J.; Hoffmann, W.C.; Lan, Y.B.; Fritz, B.K. Development and Prospect of Unmanned Aerial Vehicle Technologies for Agricultural Production Management. Int. J. Agric. Biol. Eng. 2013, 6, 1–10. [Google Scholar] [CrossRef]
  95. Tsouros, D.C.; Bibi, S.; Sarigiannidis, P.G. A Review on UAV-Based Applications for Precision Agriculture. Information 2019, 10, 349. [Google Scholar] [CrossRef]
  96. Hardin, P.J.; Hardin, T.J. Small-Scale Remotely Piloted Vehicles in Environmental Research. Geogr. Compass 2010, 4, 1297–1311. [Google Scholar] [CrossRef]
  97. Laliberte, A.S.; Rango, A.; Herrick, J.E. Unmanned Aerial Vehicles for Rangeland Mapping and Monitoring: A Comparison of Two Systems. In Proceedings of the ASPRS Annual Conference Proceedings, Tampa, FL, USA, 7–11 May 2007. [Google Scholar]
  98. Nebiker, S.; Annen, A.; Scherrer, M.; Oesch, D.A. Light-Weight Multispectral Sensor for Micro UAV—Opportunities for Very High Resolution Airborne Remote Sensing. Int. Arch. Photogramm. Remote Sens. Spat. Inf. Sci. 2008, XXXVII, 1193–1200. [Google Scholar]
  99. Hardin, P.J.; Jensen, R.R. Small-Scale Unmanned Aerial Vehicles in Environmental Remote Sensing: Challenges and Opportunities. GIScience Remote Sens. 2011, 48, 99–111. [Google Scholar] [CrossRef]
  100. Laliberte, A.S.; Rango, A. Image Processing and Classification Procedures for Analysis of Sub-Decimeter Imagery Acquired with an Unmanned Aircraft over Arid Rangelands. GISci. Remote Sens. 2011, 48, 4–23. [Google Scholar] [CrossRef]
  101. Warrick, J.A.; Ritchie, A.C.; Adelman, G.; Adelman, K.; Limber, P.W. New Techniques to Measure Cliff Change from Historical Oblique Aerial Photographs and Structure-from-Motion Photogrammetry. J. Coast. Res. 2017, 33, 39–55. [Google Scholar] [CrossRef]
  102. Nikolakopoulos, K.G.; Sardelianos, D.; Fakiris, E.; Papatheodorou, G. New Perspectives in Coastal Monitoring. In Earth Resources and Environmental Remote Sensing/GIS Applications X; Schulz, K., Nikolakopoulos, K.G., Michel, U., Eds.; SPIE: Washington, DC, USA, 2019; p. 1. [Google Scholar]
  103. Laghari, A.A.; Jumani, A.K.; Laghari, R.A.; Nawaz, H. Unmanned Aerial Vehicles: A Review. Cogn. Robot. 2023, 3, 8–22. [Google Scholar] [CrossRef]
  104. Chen, B.; Yang, Y.; Wen, H.; Ruan, H.; Zhou, Z.; Luo, K.; Zhong, F. High-Resolution Monitoring of Beach Topography and Its Change Using Unmanned Aerial Vehicle Imagery. Ocean Coast. Manag. 2018, 160, 103–116. [Google Scholar] [CrossRef]
Figure 1. Annual distribution of publications. Source: Web of Science.
Drones 07 00629 g001
Figure 2. Knowledge clusters in the use of UAVs for monitoring coastline changes. Source: VOSViewer.
Drones 07 00629 g002aDrones 07 00629 g002b
Table 1. Keywords criteria for search on the Web of Science database.
Search OperatorsKeyword Query
ORdrone*
“unmanned aerial vehicle*”
“uav”
“unmanned aircraft system*”
“uas”
“remotely piloted aircraft*”
“rpa*”
“structure from motion”
“photogrammetry”
“digital photogrammetry”
“aerial photogrammetry”
AND
OR“beach erosion”
“coastline chang*”
“shoreline chang*”
“coast* erosion”
“shoreline monitoring”
“coast* survey*”
“beach dune*”
“shoreline erosion”
“topograph* monitoring”
NOT“satellite”
NOT“satellite imagery”
Original formula: (drone* OR “unmanned aerial vehicle*” OR “uav” OR “unmanned aircraft system*” OR “uas” OR “remotely piloted aircraft*” OR “rpa*” OR “structure from motion” OR “photogrammetry” OR “digital photogrammetry” OR “aerial photogrammetry”) AND (“beach erosion” OR “coastline chang*” OR “shoreline chang*” OR “coast* erosion” OR “shoreline monitoring” OR “coast* survey*” OR “beach dune*” OR “shoreline erosion” OR “topograph* monitoring”) NOT “satellite” NOT “satellite imagery”.
Table 2. List of most frequently used keywords. Source: Web of Science.
Rank2002–2017Occurrences2018–2022Occurrences
1photogrammetry14coastal erosion26
2coastal erosion9uav23
3lidar5lidar14
4monitoring8structure from motion11
5uav5photogrammetry9
6beach erosion4shoreline9
7coastal3erosion8
8coastal management3dune7
9gps3remote sensing7
10sediment transport3dsas6
Table 3. Most cited authors between 2002 and 2017 and 2018 and 2022. Source: Web of Science.
Rank2002–2017CitationsPublications2018–2022CitationsOccurrences
1Steve Harwin4141David Rosebery10426
2Arko Lucieer4141Quentin Laport-Fauret10123
3José A. Gonçalves3341Stephane Bujan9914
4Renato Henriques3341Vincent Marieu8711
5James Brasington3311Gil Gonçalves849
6Joe Langham3311Bruno Castelle809
7Barbara Rumsby3311Umberto Andriolo788
8Christopher D. Drummond2321Filipa Bessa787
9Mitchell D. Harley2321Derek W. Jackson607
10Ian Turner2321David Rogers606
Table 4. Most cited documents. Source: Web of Science.
Rank2002–20172018–2022
DocumentReferenceCitationsDocumentCitationsReference
1Harwin and Lucieer (2012)[53]414Laporte-Fauret et al. (2019)80[54]
2Gonçalves and Henriques (2015)[20]334Gonçalves et al. (2020)55[55]
3Brasington et al. (2003)[56]331Lin et al. (2019)51[57]
4Turner et al. (2016)[18]232Guisado-Pintado et al. (2019)49[58]
5Lantuit and Pollard (2008)[59]216Ruessink et al. (2018)49[60]
6Forbes et al. (2004)[61]156Le Mauff et al. (2018)46[62]
7Fletcher et al. (2003)[63]150Westoby et al. (2018)45[64]
8Papakonstantinou et al. (2016)[42]74Warrick et al. (2019)35[65]
9Thornton et al. (2006)[66]56Gonçalves et al. (2018)35[67]
10Norcross et al. (2002)[68]55Pikelj et al. (2018)27[69]
Table 5. Clustering of influential publications on coastline change monitoring with drones. Source: Web of Science.
ClusterBroad ThemeReferences
1Sand dune morphodynamics; high-resolution surveys; optimizing GCPs; use of low-cost drones for beach monitoring[18,20,42,54,72,73,74,75,76,77,78]
2Comparison of results with LiDAR; 3D reconstruction; structure-from-motion techniques; error minimization[53,79,80,81,82,83,84,85]
3Coastal mapping; shoreline detection; digitization and correction of old aerial photographs[86,87,88]
4New equipment and drones; state-of-the-art overview[89,90,91]
Table 6. Top 10 most productive countries. Source: Web of Science.
Rank2002–20172018–2022
CountriesPublicationsCitationsCountriesPublicationsCitations
1USA30414USA66120
2France2043France51189
3United Kingdom19381South Korea4021
4Greece994Spain35130
5Italy93Italy2728
6Turkey910Portugal24119
7Australia8648Australia2257
8Canada8372Brazil1911
9South Korea825Japan1921
10Romania70United Kingdom1761
Table 7. Top 15 most productive institutions. Source: Web of Science.
Rank2002–2022
InstitutionsCountryArticles
1Universidade de CoimbraPortugal14
2Université de BordeauxFrance11
3Universidad de CádizSpain11
4Northumbria UniversityUnited Kingdom10
5Universidad de Santiago de CompostelaSpain10
6Deakin UniversityAustralia7
7Université de Bretagne OccidentaleFrance7
8Kangwon National UniversitySouth Korea6
9Purdue UniversityUnited States6
10University of Cape CoastGhana6
11Universidade Federal do Rio Grande do SulBrazil6
12University of WindsorCanada6
13Norsk Institutt for KulturminneforskningNorway5
14Seoul National UniversitySouth Korea5
15Universidad de ExtremaduraSpain5
Table 8. Top 10 journals between 2002 and 2017. Source: Web of Science.
Rank2002–2022
JournalsPublicationsCitations
1Journal of Coastal Research6243
2Marine Geology4295
3Fresenius Environmental Bulletin227
4Geomorphology2547
5ISPRS Journal of Photogrammetry and Remote Sensing2388
6Remote Sensing2430
7ICCSCE 2013116
8Acta Montanistica Slovaca13
9ISPRS International Journal of Geo-Information174
10Coastal Engineering1232
Table 9. Top 10 journals between 2018 and 2022. Source: Web of Science.
Rank2018–2022
JournalsPublicationsCitations
1Journal of Coastal Research1352
2Remote Sensing10126
3Earth Surface Processes and Landforms745
4Geomorphology5111
5Science of the Total Environment5113
6Water439
7Coastal Engineering354
8Drones329
9Journal of Marine Science and Engineering390
10International Journal of Remote Sensing241
Table 10. Barriers to the use of UAVs in coastal monitoring.
BarrierDescription
Implementation costsThis may be the case for researchers or institutions with limited financial means [93].
Labour knowledge and expertiseIn most cases, experienced pilots and skilled people are needed to fly the drones in hazardous situations or adverse conditions [94,95].
Engine power and flight durationDrones cannot be operated for long hours or cover broad areas [96,97].
Stability, reliability, and manoeuvrabilityDrones are not stable in adverse weather conditions [96,97].
Payload limitations and sensor qualityDue to their weight, drones cannot carry heavy loads, making it difficult to attach cameras and sensors [98].
RegulationDrones can pose a threat to public safety, so rules are being tightened [99,100].
Table 11. Advantages in the use of UAVs compared to other methods.
BarrierDescription
Mobility and accessibilityUAVs are highly mobile and can be easily transported to remote or hard-to-reach coastal areas. This makes it possible to monitor coastal sites that may be inaccessible by terrestrial methods [79,82].
Cost effectivenessCompared to manned aircraft or satellite imagery, UAVs are relatively more affordable in terms of acquisition and operating costs. This allows organizations with limited budgets to carry out regular monitoring [20,54].
High spatial resolutionUAVs can capture high-resolution images, allowing the detection of minute details in coastal landscapes, such as small-scale erosion, changes in vegetation, and sedimentation patterns [15,20].
Agility and flexibilityUAVs can be quickly mobilised and reconfigured for different types of sensors such as RGB or multispectral cameras, and LiDAR depending on monitoring needs. This provides significant flexibility [62,90].
Real-time monitoringData captured by UAVs can be processed and analysed in real time or immediately after the flight, enabling a rapid response to unforeseen coastal events such as storms [14,18].
SafetyOperating UAVs is generally safer than sending people into potentially dangerous areas, such as unstable cliffs or erosive beaches. This reduces the risk for the monitoring team [41,101].
Digital data storageData captured by UAVs are stored digitally rather than physically, making them easier to share, analyse, and archive in the long term. This is especially useful for long-term studies and historical comparisons [16,64].
Integration with other advanced technologiesDue to georeferencing capabilities, data collected by UAVs can be easily integrated into geographic information systems (GIS) and processed with advanced techniques such as machine learning and spatial analysis [64,102].
Disclaimer/Publisher’s Note: The statements, opinions and data contained in all publications are solely those of the individual author(s) and contributor(s) and not of MDPI and/or the editor(s). MDPI and/or the editor(s) disclaim responsibility for any injury to people or property resulting from any ideas, methods, instructions or products referred to in the content.

