Article

Experimental Connectivity Analysis for Drones in Greenhouses

1
Information Technology Group, Wageningen University and Research, 6706KN Wageningen, The Netherlands
2
Netherlands Organisation for Applied Scientific Research, 2597AK Den Haag, The Netherlands
*
Author to whom correspondence should be addressed.
Drones 2023, 7(1), 24; https://doi.org/10.3390/drones7010024
Submission received: 7 November 2022 / Revised: 14 December 2022 / Accepted: 21 December 2022 / Published: 29 December 2022

Abstract

:
This study aims to explore the communication capabilities for video crucial applications of two commercial drones—the Parrot AR.Drone 2.0 and the Parrot Anafi—in a greenhouse environment. Experiments were conducted on Received Signal Strength (RSS), Round-Trip Time (RTT) and the throughput on 802.11n at the 2.4 GHz network. From the experiments, it was found that none of the UAVs have an isotropic radiation pattern. Indoor measurements close to the roof and the ground were more prone to signal degradation. Even though the RTT of the Parrot Anafi was higher than that of the AR.Drone 2.0, the Anafi in almost all cases managed to achieve higher throughput and lower path loss, proving its superiority for video application. In addition, the maximum distance that the Parrot Anafi could fly in the greenhouse without any video quality loss was 110 m, while the AR.Drone 2.0 was hardly able to reach 30 m. Finally, the effect of the propellers has an insignificant impact on the UAV connection characteristics in all tested scenarios.

1. Introduction

As the population of our planet is increasing steadily, the global food demand follows the same trend. The agricultural sector not only has to produce more to cover the increasing food consumption, but this should be accomplished in a more sustainable way than before [1]. In the last few years, precision agriculture has introduced many technological advancements, so farmers have a an increasingly extensive toolset in hand in order to boost crop production. Unmanned Aerial Vehicles (UAVs) have a prominent position in farmers’ toolkits. UAVs are being used in many fields of agriculture including mapping, plant stress detection, biomass and field nutrient estimation, weed management, chemical spraying, and finally in geo-referencing [2].
Although the vast majority of agricultural applications are outdoors, some efforts to use UAV in greenhouse operations have been reported. In [3], the authors present a methodology for automatic pest detection and classification using a Support Vector Machine with images acquired by a UAV and an IP camera. Moreover, a ground and aerial robotic system was proposed by [4] to measure temperature, humidity, CO2, and luminosity in the greenhouses from Almeria (Spain). In [5], a benchmark for different visual simultaneous localization and mapping (VSLAM) algorithms was carried out in a barn and a greenhouse. In previous works, the communication problems between the UAVs and ground station have not been addressed. A plant pollination concept with the use of nano-copters is presented by [6]; however, no technical details were included in their research.
In general, the lack of indoor applications can be justified mainly due to limitations that exist in indoor environments. For example, for navigating a UAV outdoors, localization can be achieved simply by using GPS. However, GPS is not an option for indoor applications. Therefore, to achieve indoor localization, different approaches have been proposed, which in some cases involve more sophisticated sensors such as lidars and cameras. It is well known that these sensors produce large amounts of data, and the data processing is computationally expensive. In order to reduce the onboard processing workload, it is a common practice to assign these calculations to the ground controller or even to a remote computing cloud service; however, a reliable connection is required.
A stable connection between the UAV and the control unit is an important aspect of indoor navigation. On one hand, the UAV should be able to receive navigation commands, and on the other hand, it should send back to the controller its current state. Thus, the real-time data from the built-in sensors should be transmitted reliably. Taking into account that UAVs use Radio Frequency (RF) signals, indoor farms are ambient complex systems, and phenomena such as reflection, absorption, diffraction, scattering and interference can cause attenuation or signal loss. As a result, the connection can become unreliable. The RF signal propagation is also affected by the environmental conditions, the material properties, and the incident angles. In addition, as the use of technology in the agricultural sector is becoming more and more popular, other wireless devices possibly transmit in the same spectrum, causing signal interference.
This is especially the case for UAVs that use Wi-Fi for their communications. Since different technologies may share the same Wi-Fi spectrum, disturbances are not unlikely. For example, in [7], the effect of the adjacent-channel interference in IEEE 802.11 WLANs has been studied, and in [8], the interference between Wi-Fi and ZigBee networks has been studied.
In the past, many researchers have tried to study RF signal propagation in different construction materials. A list of materials has been analyzed over a wide range of frequencies in [9]. In a similar way, in [10], the propagation losses were studied, but this time the specific frequency bands of 2.4 GHz and 5 GHz were chosen as part of the IEEE 802.11 standard for Wi-Fi applications. Despite the fact that these studies reveal the behavior of the RF signals on different building materials, these data cannot directly be translated into solid conclusions for entire constructions.
Another area that other studies have focused on is the Wi-Fi evaluation in different buildings. In [11], the relation between RSS and throughput of an IEEE 802.11g network was analyzed in an office building, and the results showed that the throughput was not affected proportionally when the RSS changed. The authors of [12] performed an experimental propagation comparison between Wi-Fi and Super Wi-Fi networks indoors, proving that Super Wi-Fi can improve the network performance thanks to better signal propagation in indoor environments. In [13], the propagation topology of a house at 2.4 GHz was examined by comparing experimental measurements with indoor path models. Finally, in order to evaluate Wi-Fi networks, the authors of [14,15] proposed methods for generating Wi-Fi heat-maps. However, none of these studies specifically focused on the connection capabilities of UAVs in greenhouse environment.
A few studies have been directed at experimentally analyzing UAV-to-UAV and UAV-to-Ground 802.11 network links [16,17,18,19,20], where the impact of distance over the signal strength and the throughput were studied. Similarly, in [21], the open space propagation was studied using Ultra-Wide-band (UWB) modules. In addition, the effect of the antenna orientation and the path loss was studied empirically.
Other researchers approached the RF propagation by involving models. For instance, the authors of [22] have developed a generalized RF model for Air-to-Ground path loss in urban environments. There are several studies that attempted the performance analysis of UAV ad hoc networks. For example, in [23], a model is proposed that uses Markov chain. Furthermore, in [24], model simulations show that the impact of directional antennas increases the overall network performance. Different radio technologies have also been evaluated in UAV applications. In [25], for instance, the performance of a 60 GHz mmWave network using off-the-shelf radio modules is explored throughout experimental measurements. However, in all cases described above, UAVs were employed for signal propagation analysis and connectivity evaluation; the main focus was not on the connection capabilities of the UAV but instead on air-to-air and air-to-ground networks outdoors.
The effectiveness of 802.11n networks in contexts of high data rates was studied in [26,27]. Throughput loss due to interference and high packet loss rate was reported even in cases where the received signal strength level was high. Furthermore, it was found that the throughput performance is significantly affected by the number of receiving antennas and interference caused by other transiting 802.11g networks around. These two papers do not focus specifically on UAV or airborne communication but provided generalized conclusions about the performance of 802.11n networks. Finally, in [28] the performance of 802.11n networks in airborne application was evaluated empirically, using a fixed-wing UAV configuration. The authors claimed that the theoretical performance of these networks differed dramatically to the empirical performance due to the automatic rate adaptation mechanism of the 802.11n standard and especially when the mobility of the UAV increased. The above research, however, was conducted only outdoors, and a fixed-wing UAV was used.
This study is an attempt to empirically explore the performance of the 802.11n on UAV applications in greenhouses. The influence of the greenhouse construction on the Wi-Fi communication between a UAV and the controller unit was studied. For this reason, experimental measurements were conducted using two commercial quad rotor drones in different indoor and outdoor scenarios. Furthermore, the capabilities of both UAVs have been explored by generating their radiation patterns. Finally, their maximum flying distances in an open space and in the greenhouse environment was compared. The acquired data are publicly available.

2. Materials and Methods

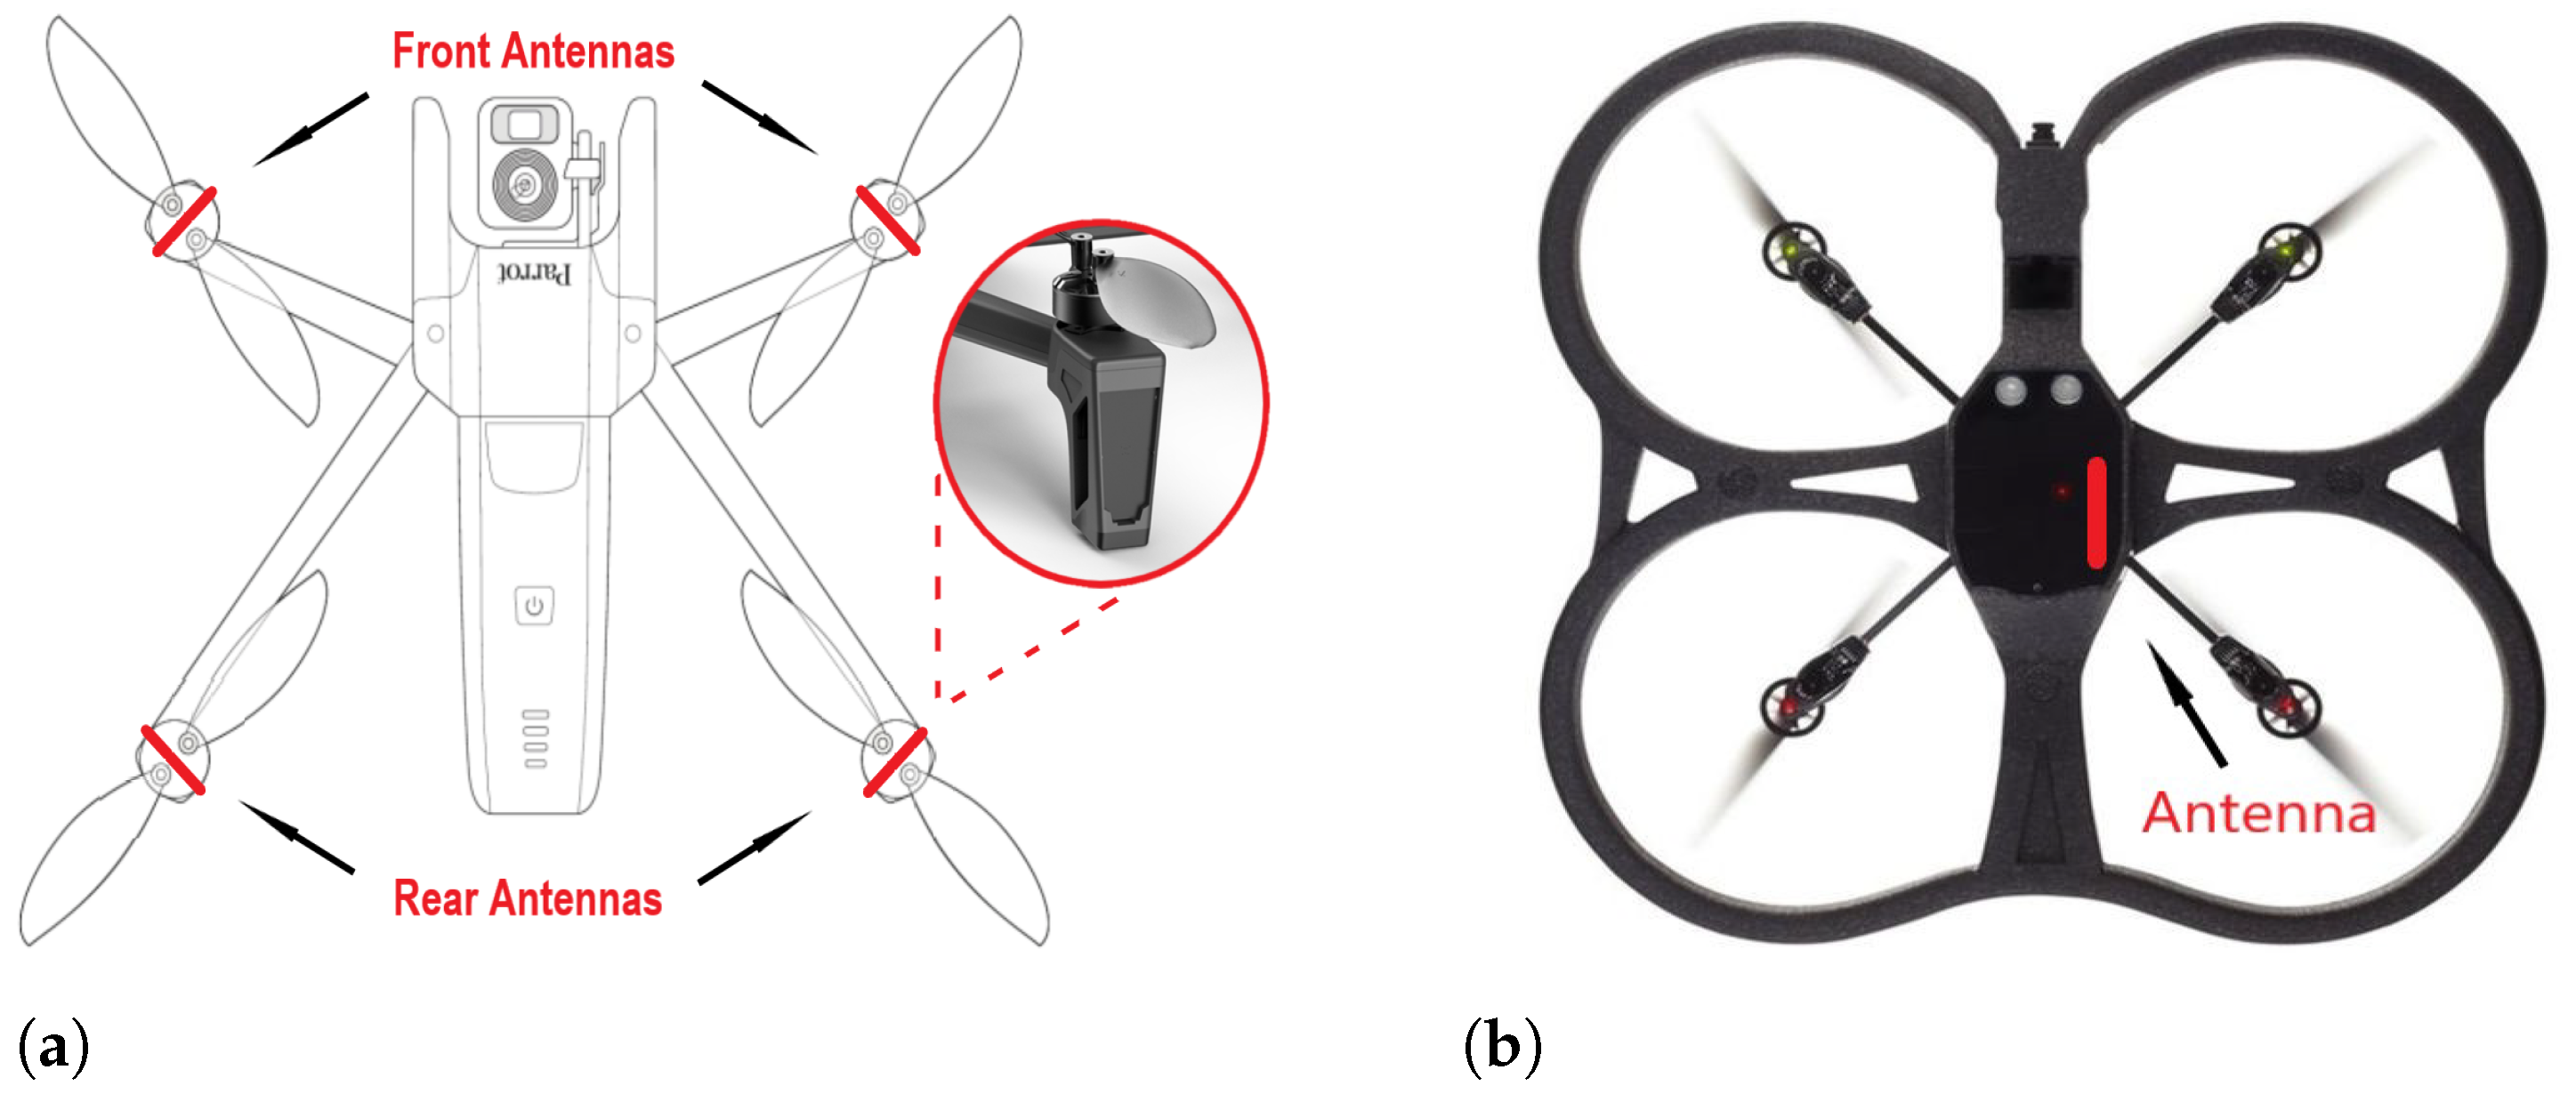
The UAVs used in this study were the AR.Drone 2.0 and the Anafi which were both developed by the French company Parrot. The AR.Drone 2.0 is an inexpensive, Linux-based drone while the Parrot Anafi is a professional platform with extended features. Both drones are equipped with several sensors including Inertia Measurement Unit (IMU), magnetometer, ultrasonic altimeter, and pressure sensor, and each one has two cameras. Finally, they both comply with the 802.11n standard for sending and receiving commands and data to the control unit.
As a control unit, an ASUS X510UNR laptop, which is equipped with a built-in Wi-Fi adapter based on the Intel 8265 chipset was used. Furthermore, the laptop was configured to run Ubuntu 18.04 LTS. In order to ensure that the connection between a UAV and a controller unit is reliable, the connection quality was evaluated. For this reason, three different indoor and outdoor experiments were conducted, measuring packet round-trip time, throughput, and signal strength. The data acquisition was achieved by using python and the built-in Linux utilities ping and iwlist.
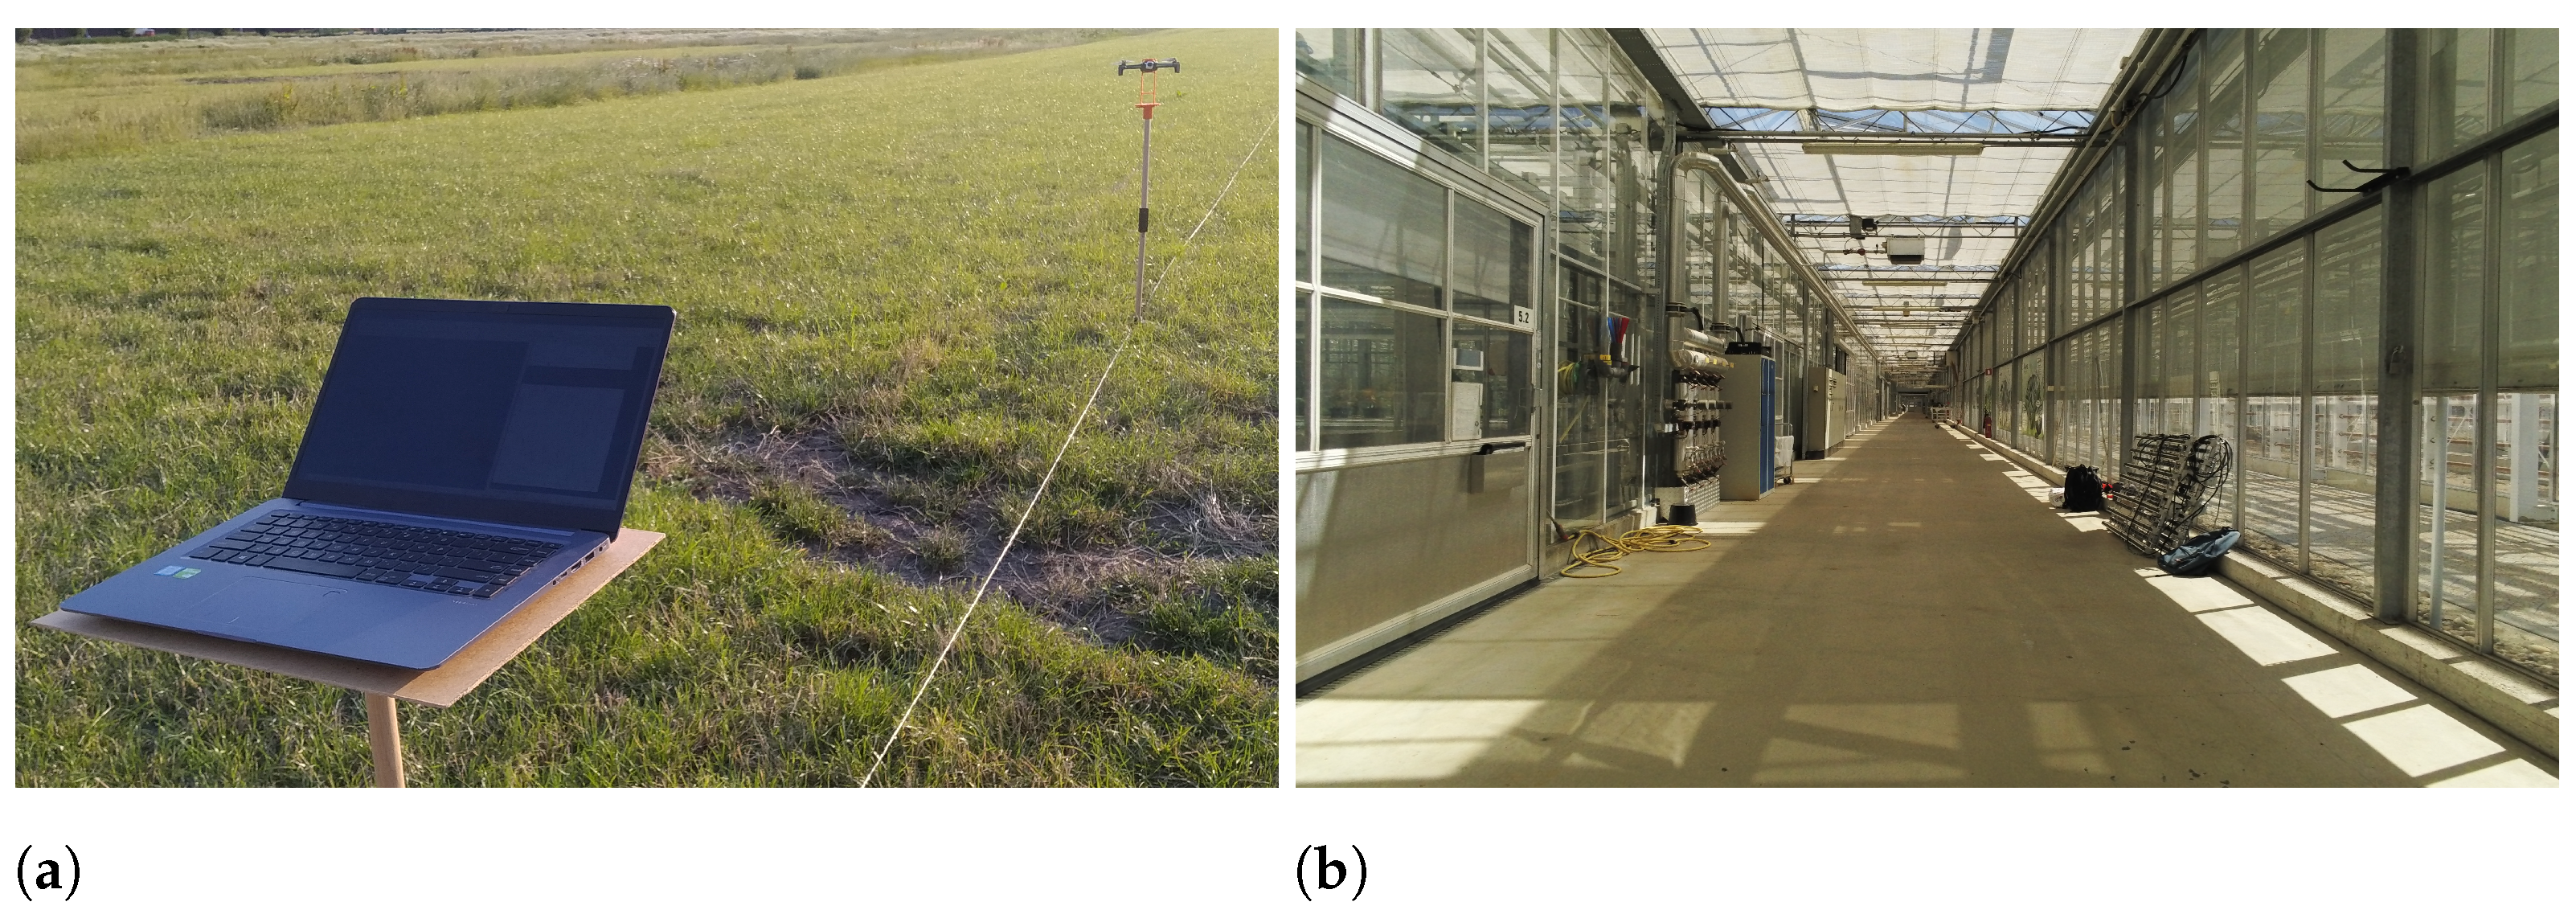
The outdoor experiments were carried out in an open field in Papendorp (The Netherlands), a location with minimal Wi-Fi network presence. Regarding the indoor scenarios, the greenhouse facility in the Wageningen University campus was used. It is worth mentioning that the same equipment and tools were used in all experiments involving no additional components for enhancing the communication capabilities of the UAVs or the controller PC such as external antennas; however the setup differs.

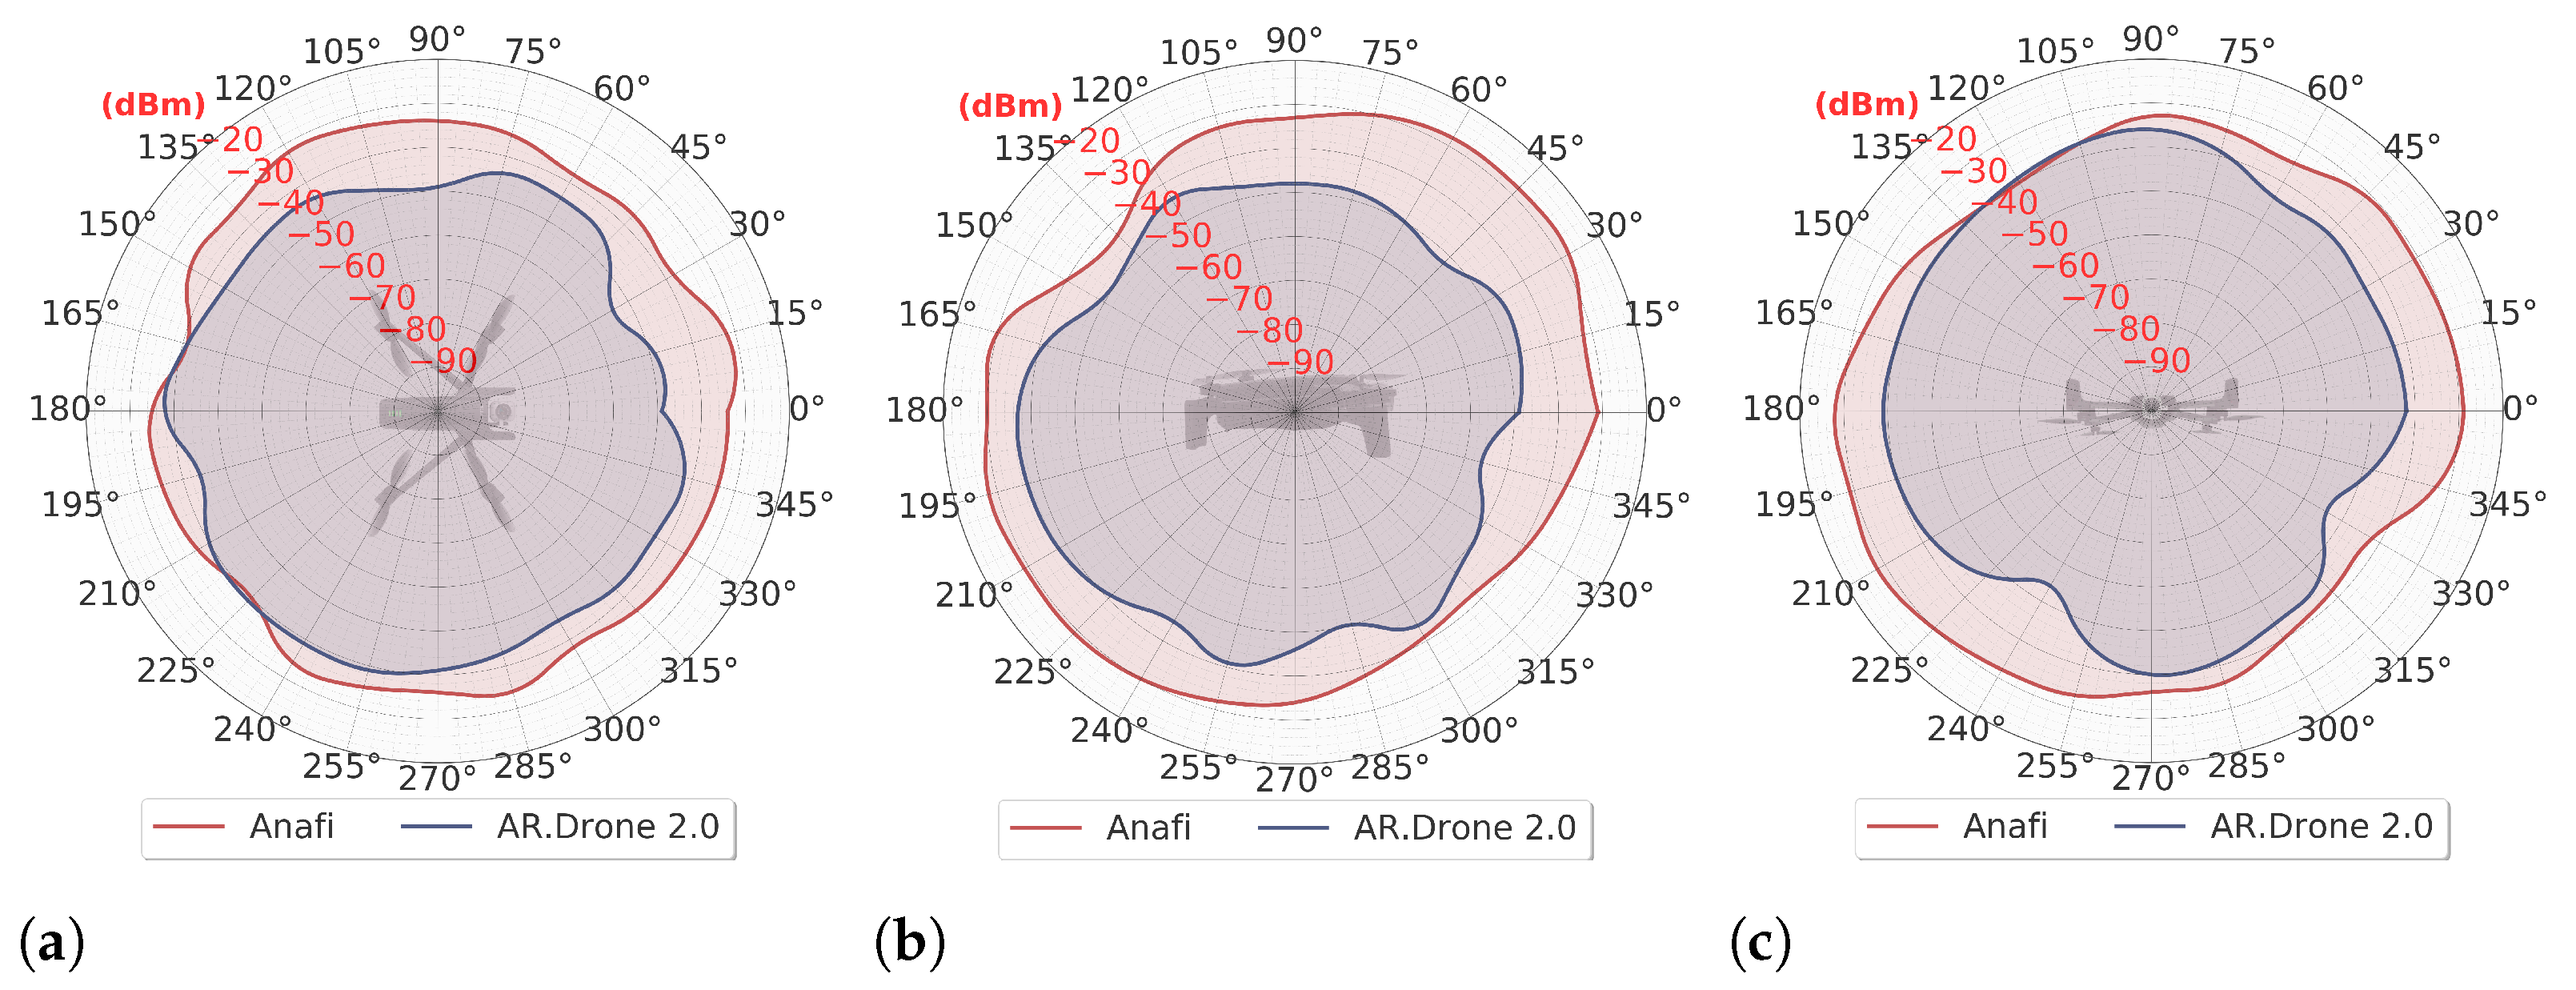
2.1. Radiation Pattern

The communication between the drone and the controller is strongly related with the radiation pattern of the drone. The radiation pattern determines how sensitive the drone is on receiving and transmitting wireless signals on different orientations around its axes. The physical characteristics of the antenna and the designing decisions during the drone development are two of the main reasons that communication issues may occur. For instance, badly placed antennas often suffer internal interference from the onboard electronic circuitry. In addition, the building materials of the drone can cause further shadowing effects, and hence signal strength drop is likely to occur.
There are various approaches to studying these effects, including modeling and taking actual measurements in an RF anechoic chamber [29,
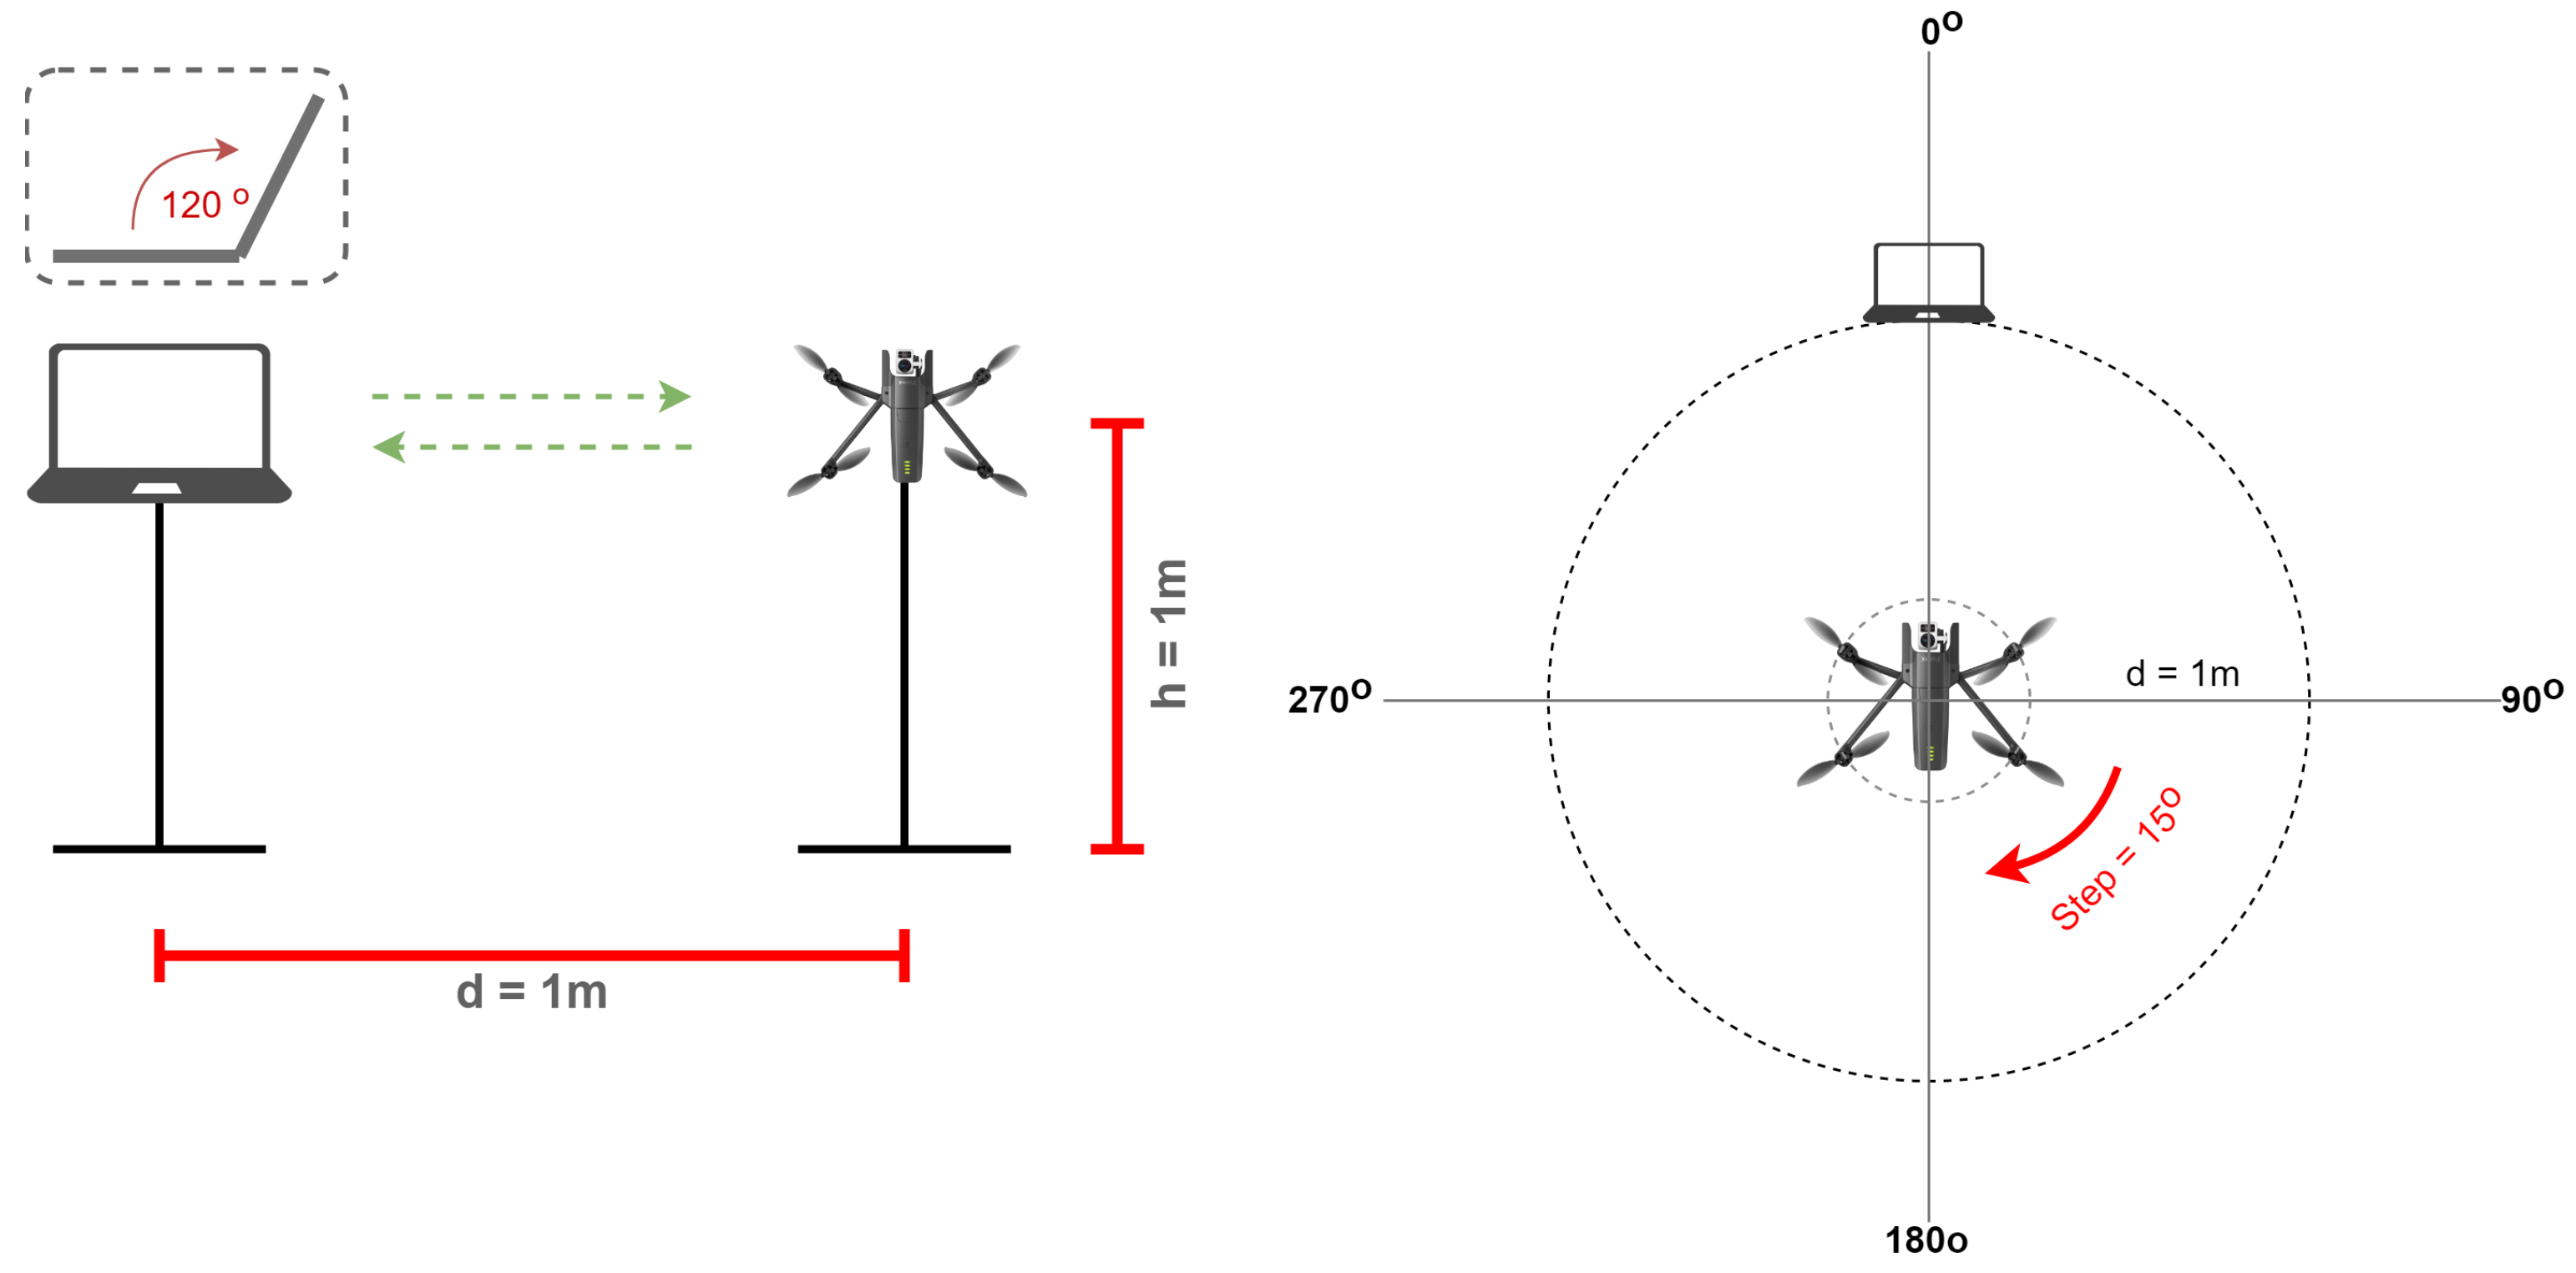
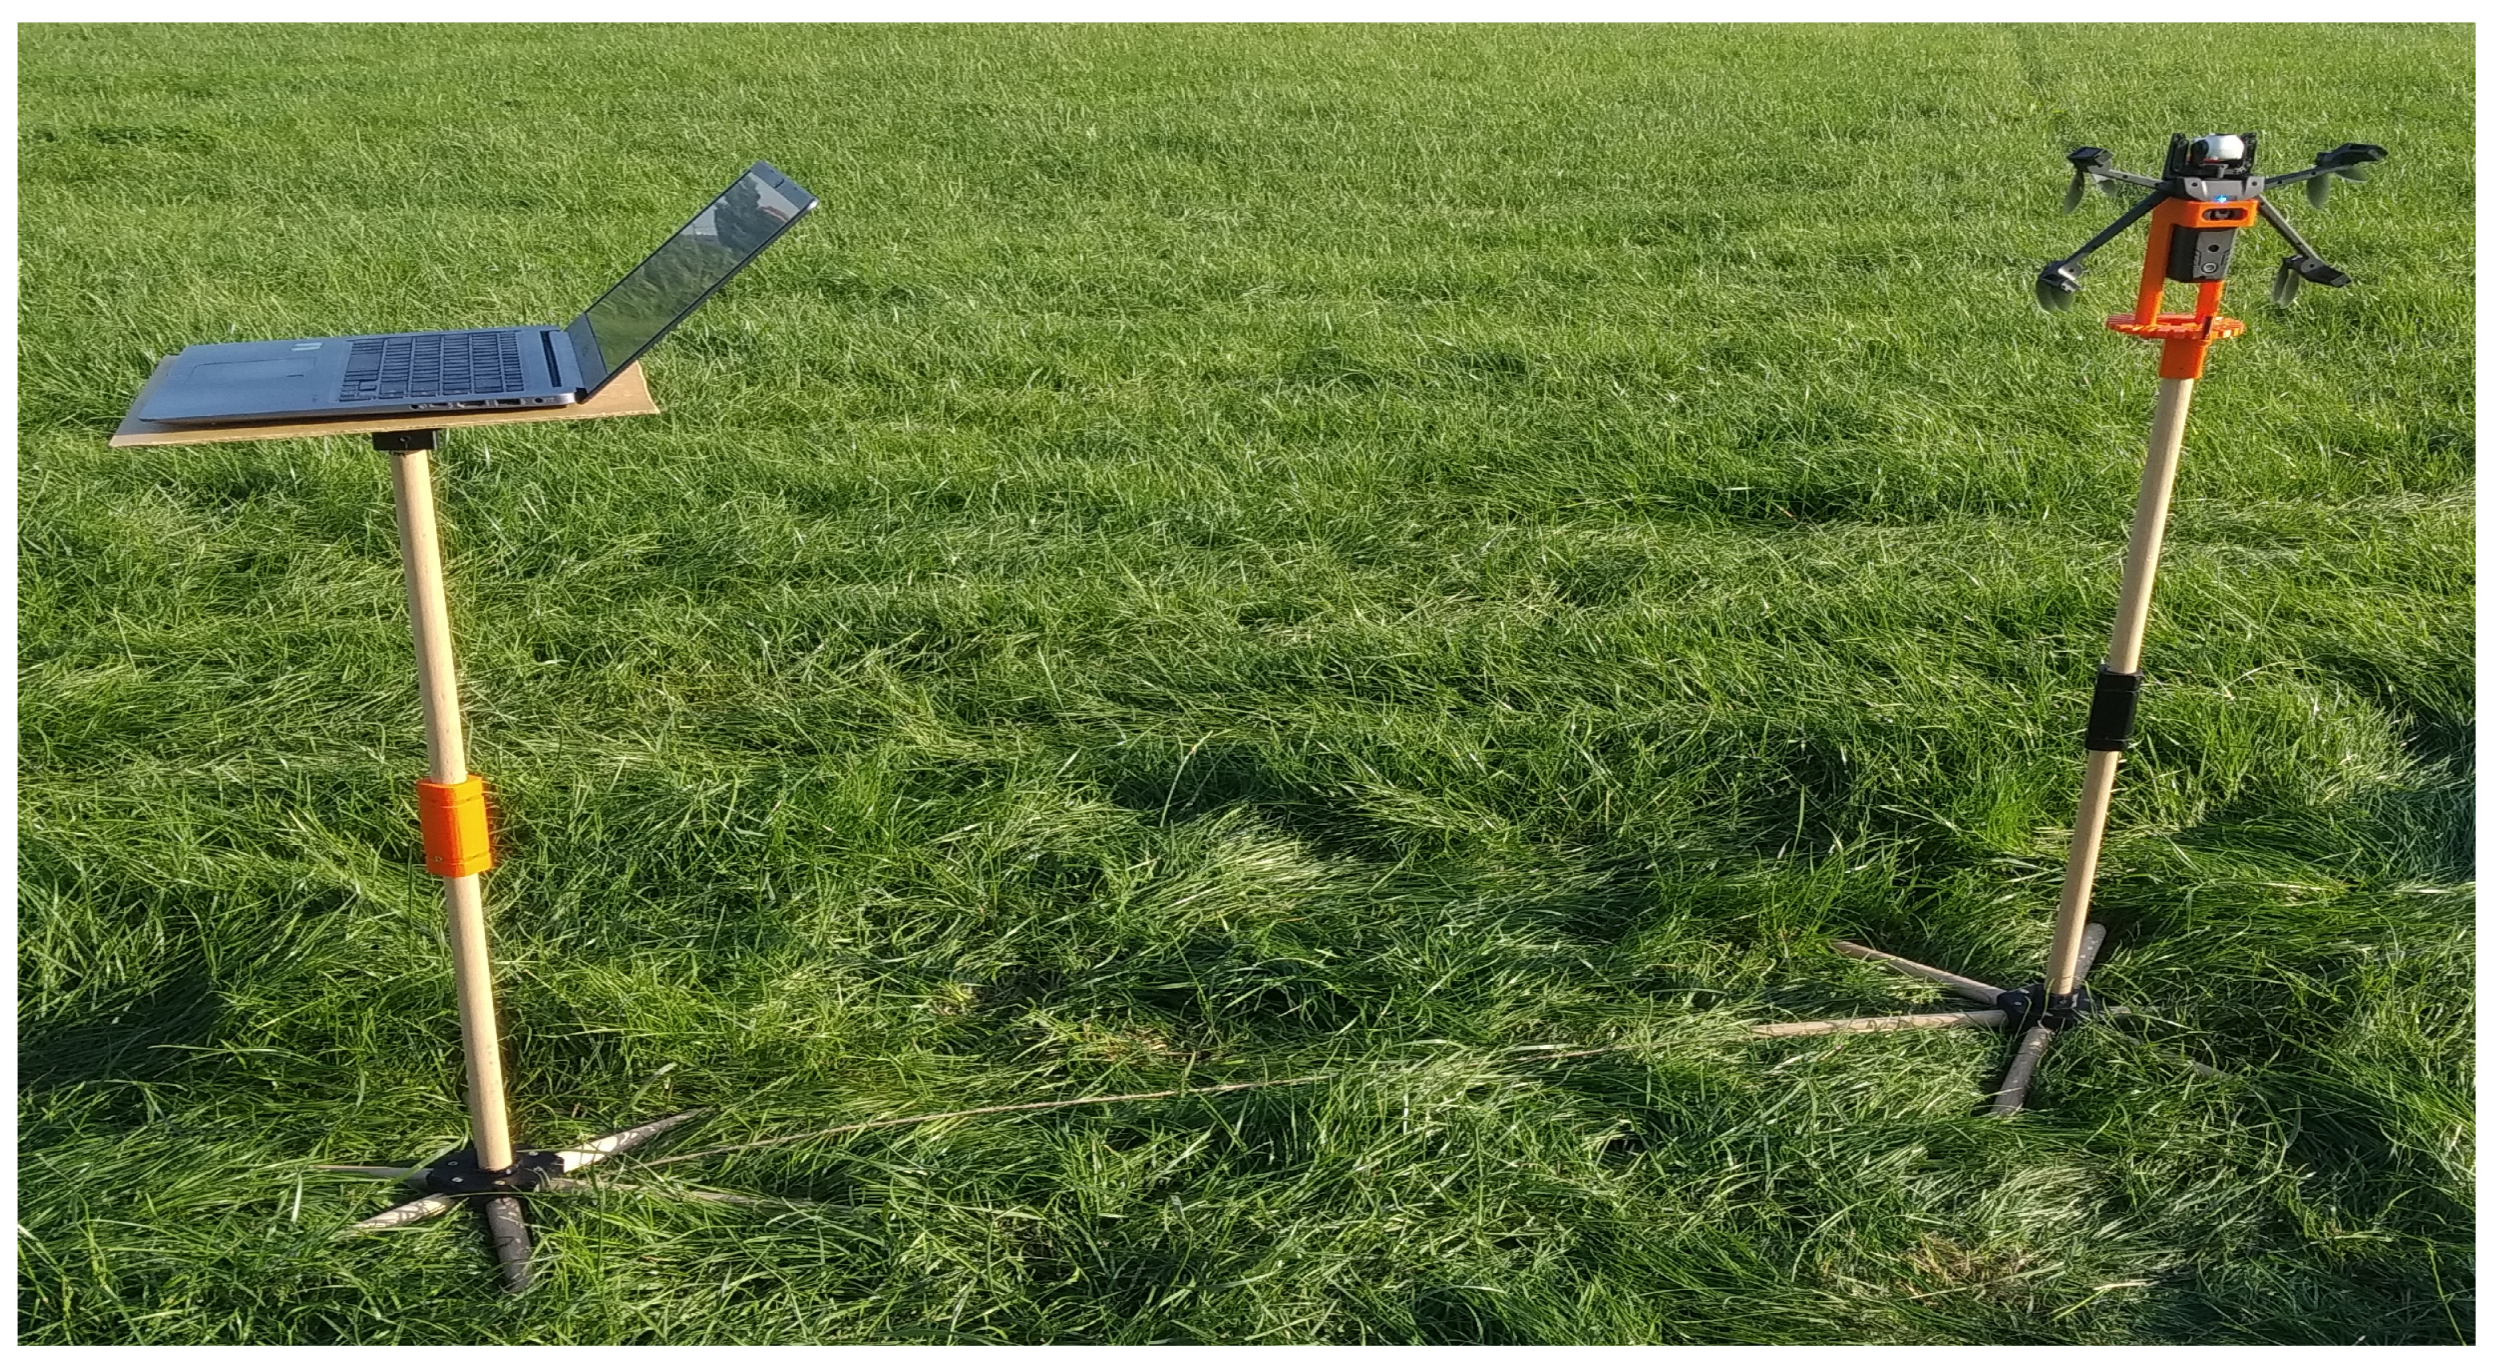
30]. Considering that most of the physical properties of the drone components are unknown, the mathematical modeling cannot be applied. On the other hand, anechoic chambers are sophisticated systems, and accessing them is challenging. Taking these factors into account, we decided to conduct measurements in an open field, an environment with minimal reflections and Wi-Fi interference from other sources. From measurements we conducted at different heights, we concluded that the effect of the ground reflections and absorption is insignificant after 70 cm without affecting the shape of the radiation patterns; therefore, a height of 1m was chosen.
During the measurements, both the signal strength and the round-trip times and the throughput in different drone orientations were measured while the propellers were activated. Two 3D-printed stands, one for the PC and one the UAVs, were designed in order to hold the UAVs in a fixed distance and height of 1m in front of the PC. Since each UAV was measured in X, Y, and Z axes individually, a different 3D printed holder was designed for each case. Every holder was capable of rotating each UAV with a step of 15 degrees. In Figure 1 and Figure 2, the experimental setup is presented.
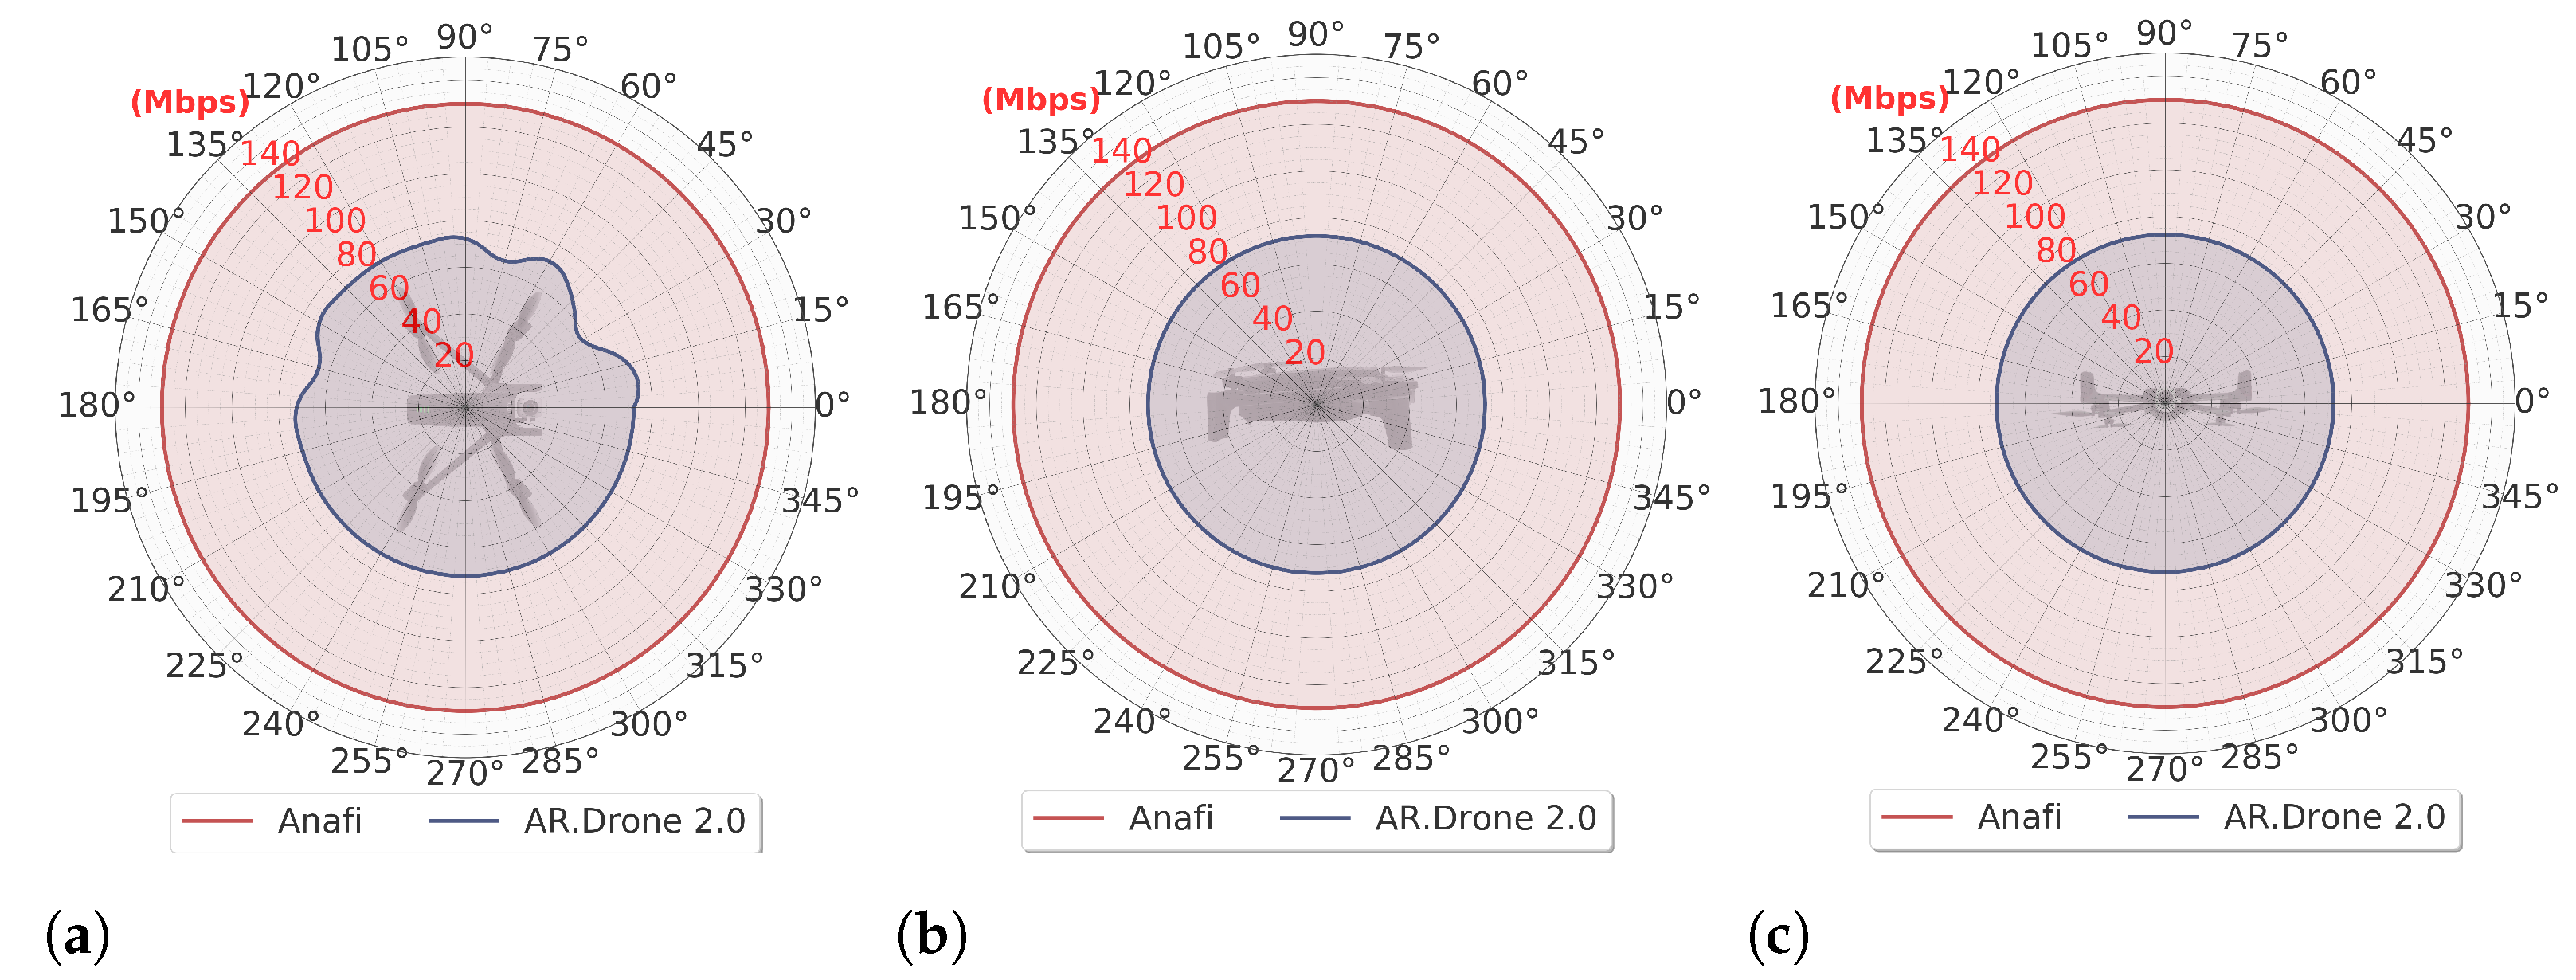
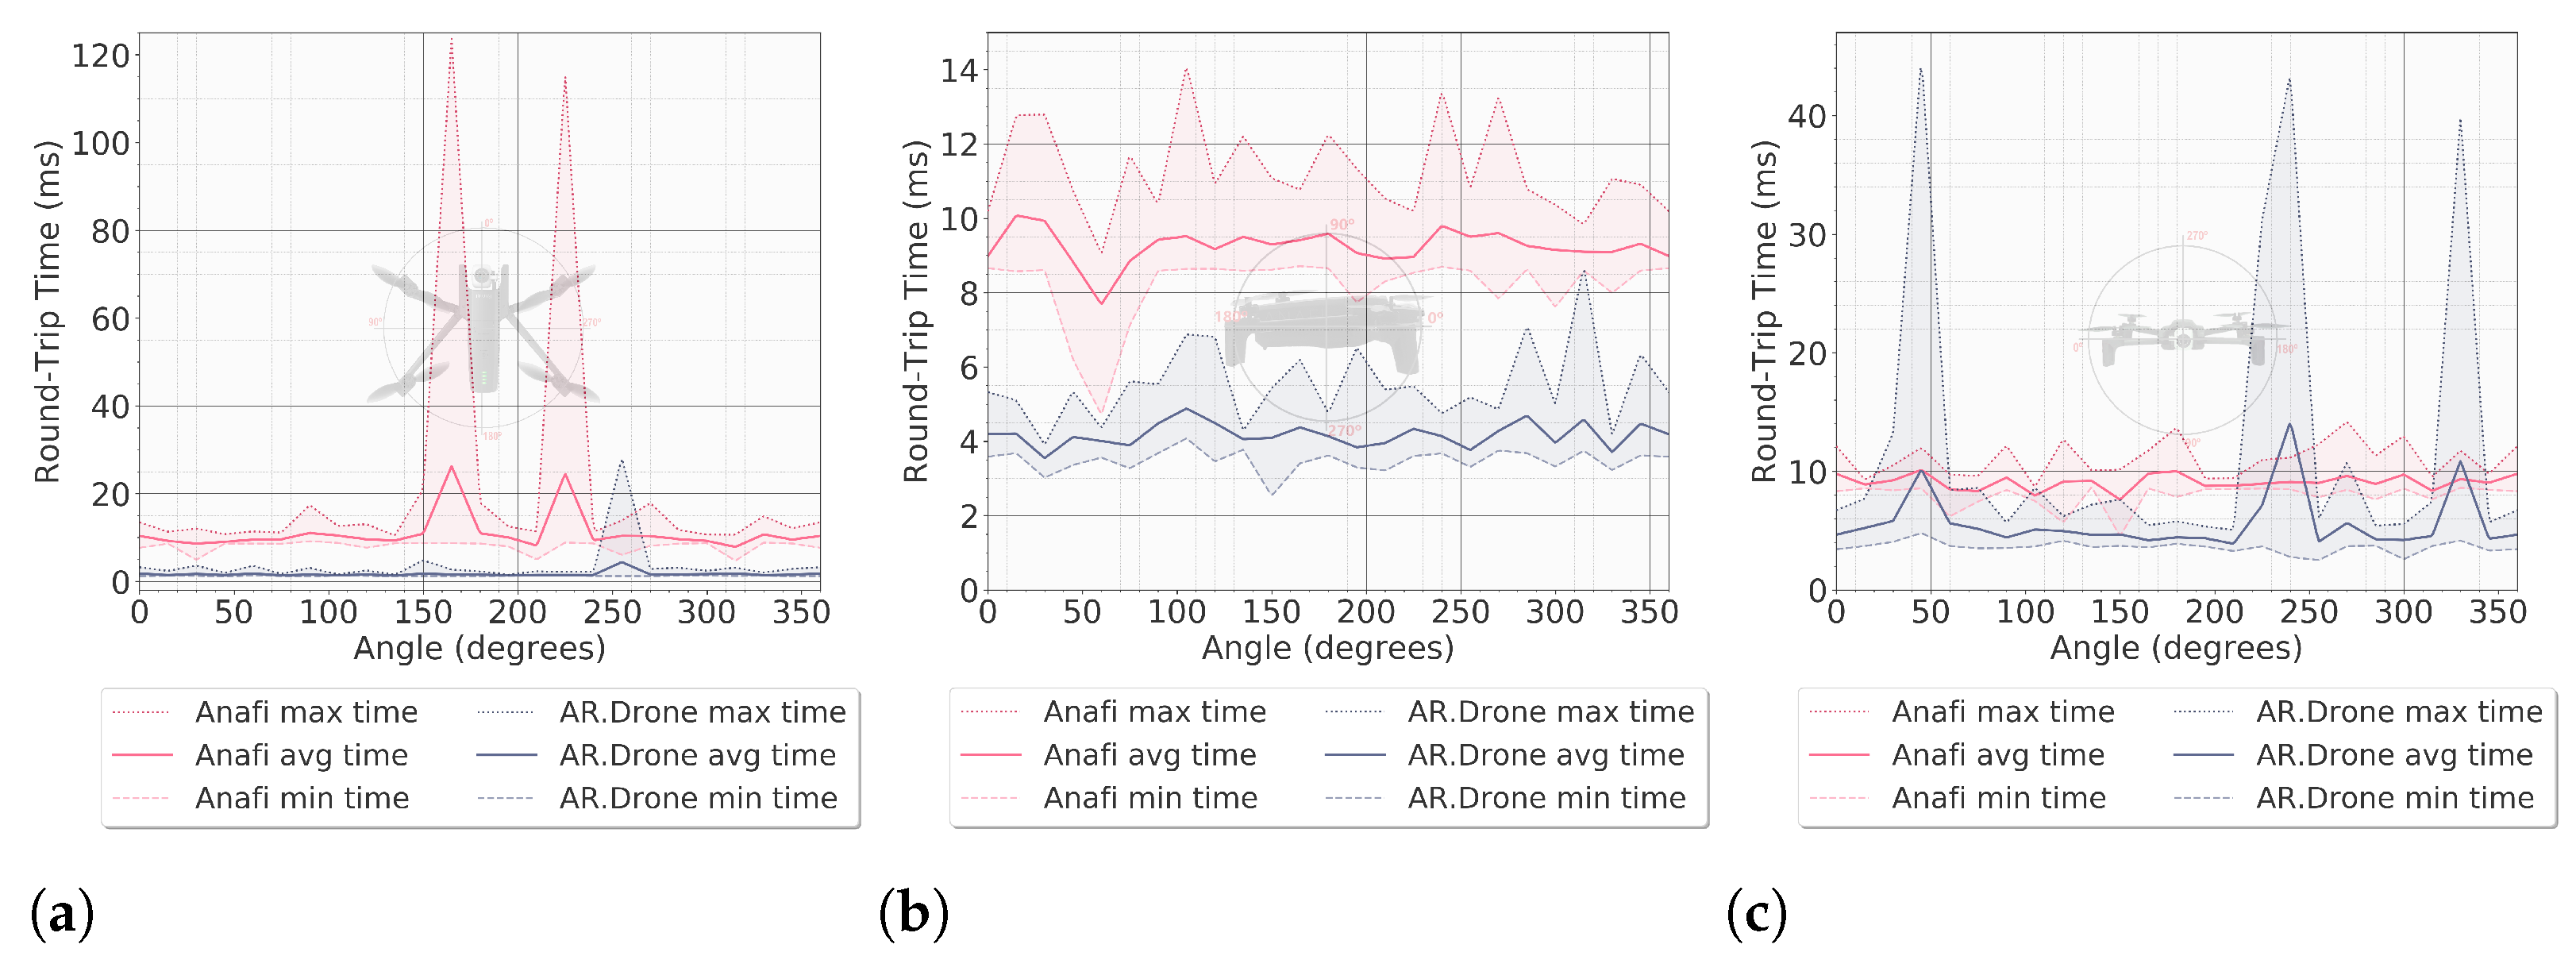
The radiation patterns were usually viewed in two principal planes: the horizontal, which is referred to also as azimuth, and the vertical, which is also known as elevation. In this study, however, we measured the signal radiation in three principal planes, one for each axis, X, Y, and Z, and we use the term yaw, pitch, and roll, respectively, since these are the most commonly used terms in the aviation world when referring to the axes of an aerial vehicle’s coordinate system.

2.2. Three-Dimensional Signal Propagation in a Greenhouse Environment

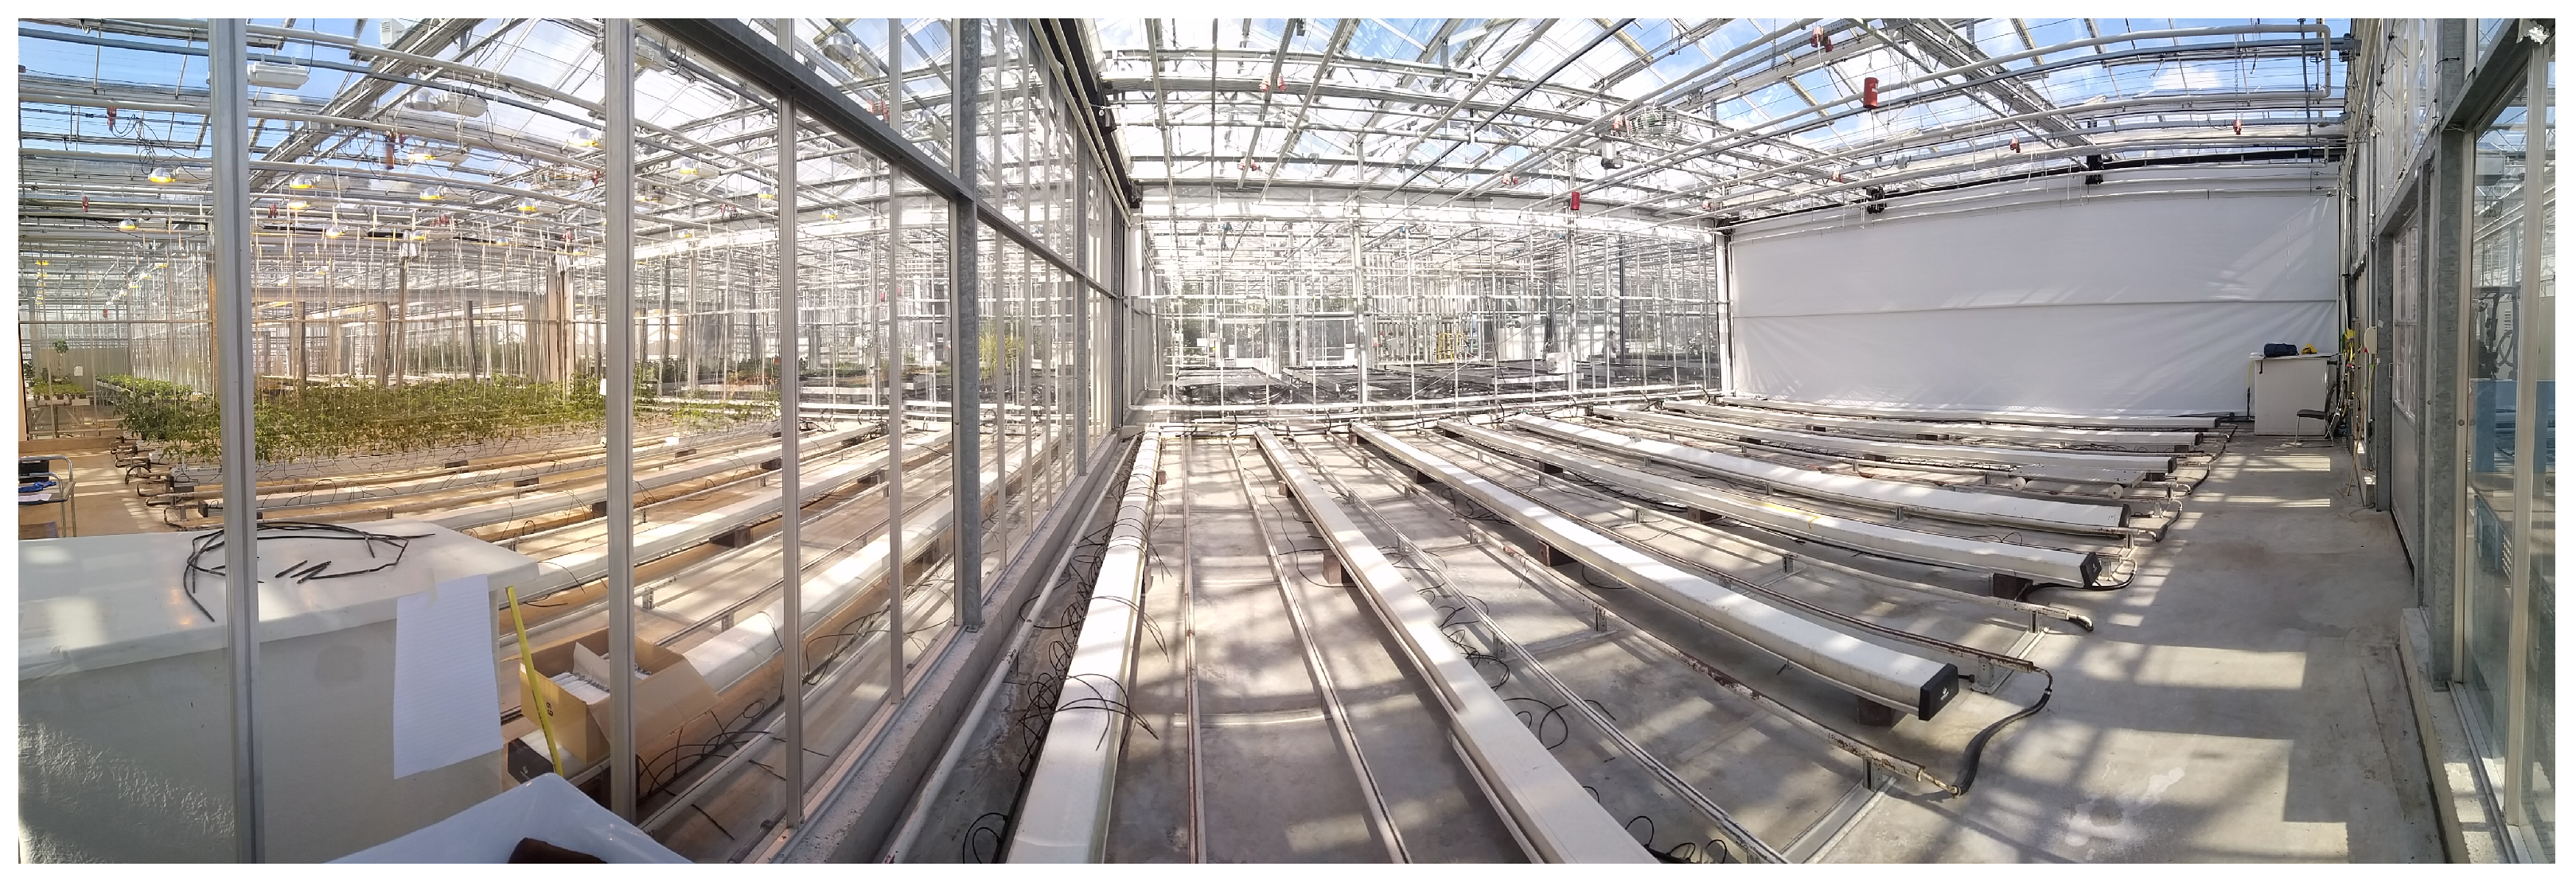
Indoor farming constructions such as greenhouses are ambient complex environments, as illustrated in Figure 3.There is a long list of different types of equipment commonly found inside the cultivation room, among which are heating and cooling systems, lighting equipment, wires, pipes, harvesting and transporting tools, and so on. In such an environment, there is a large variety of materials and shapes, and therefore the UAV communication with the ground station can be challenging. The metallic surfaces usually cause constructive and destructive interference and phase shifting due to multipath propagation. As a result, signal shadowing effects, packet loss, reduction in throughput, or even complete communication loss can happen.
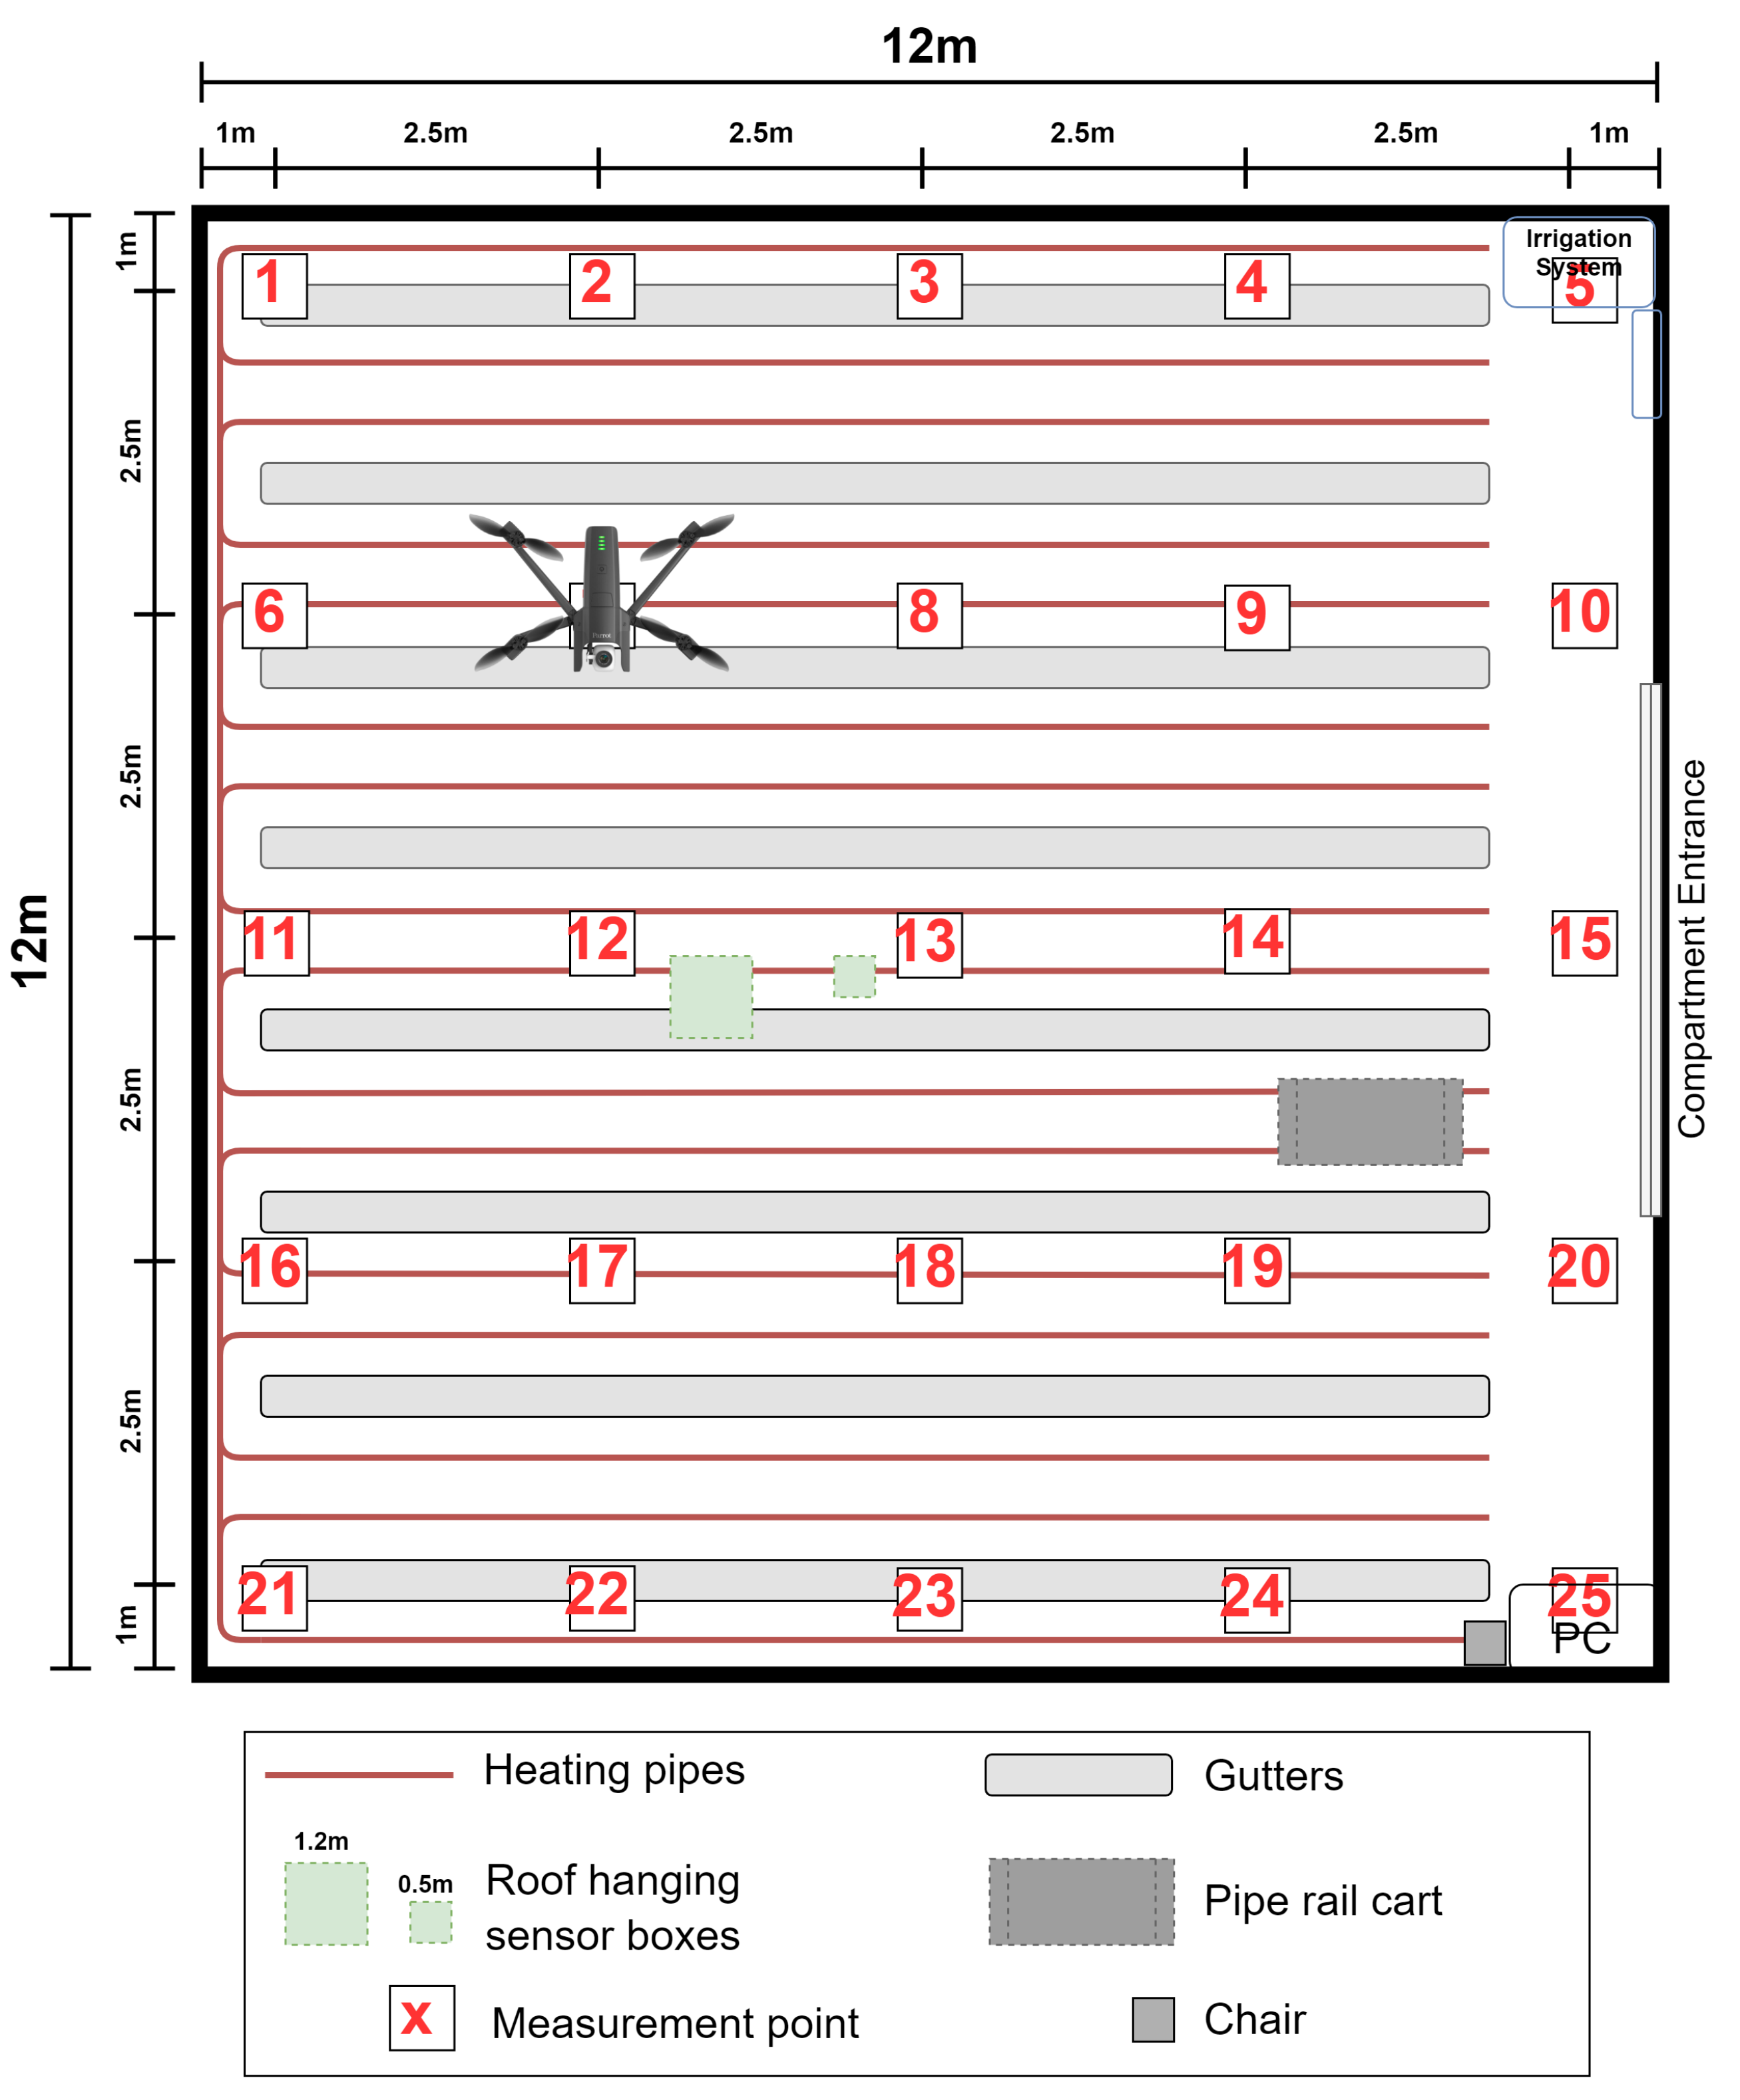
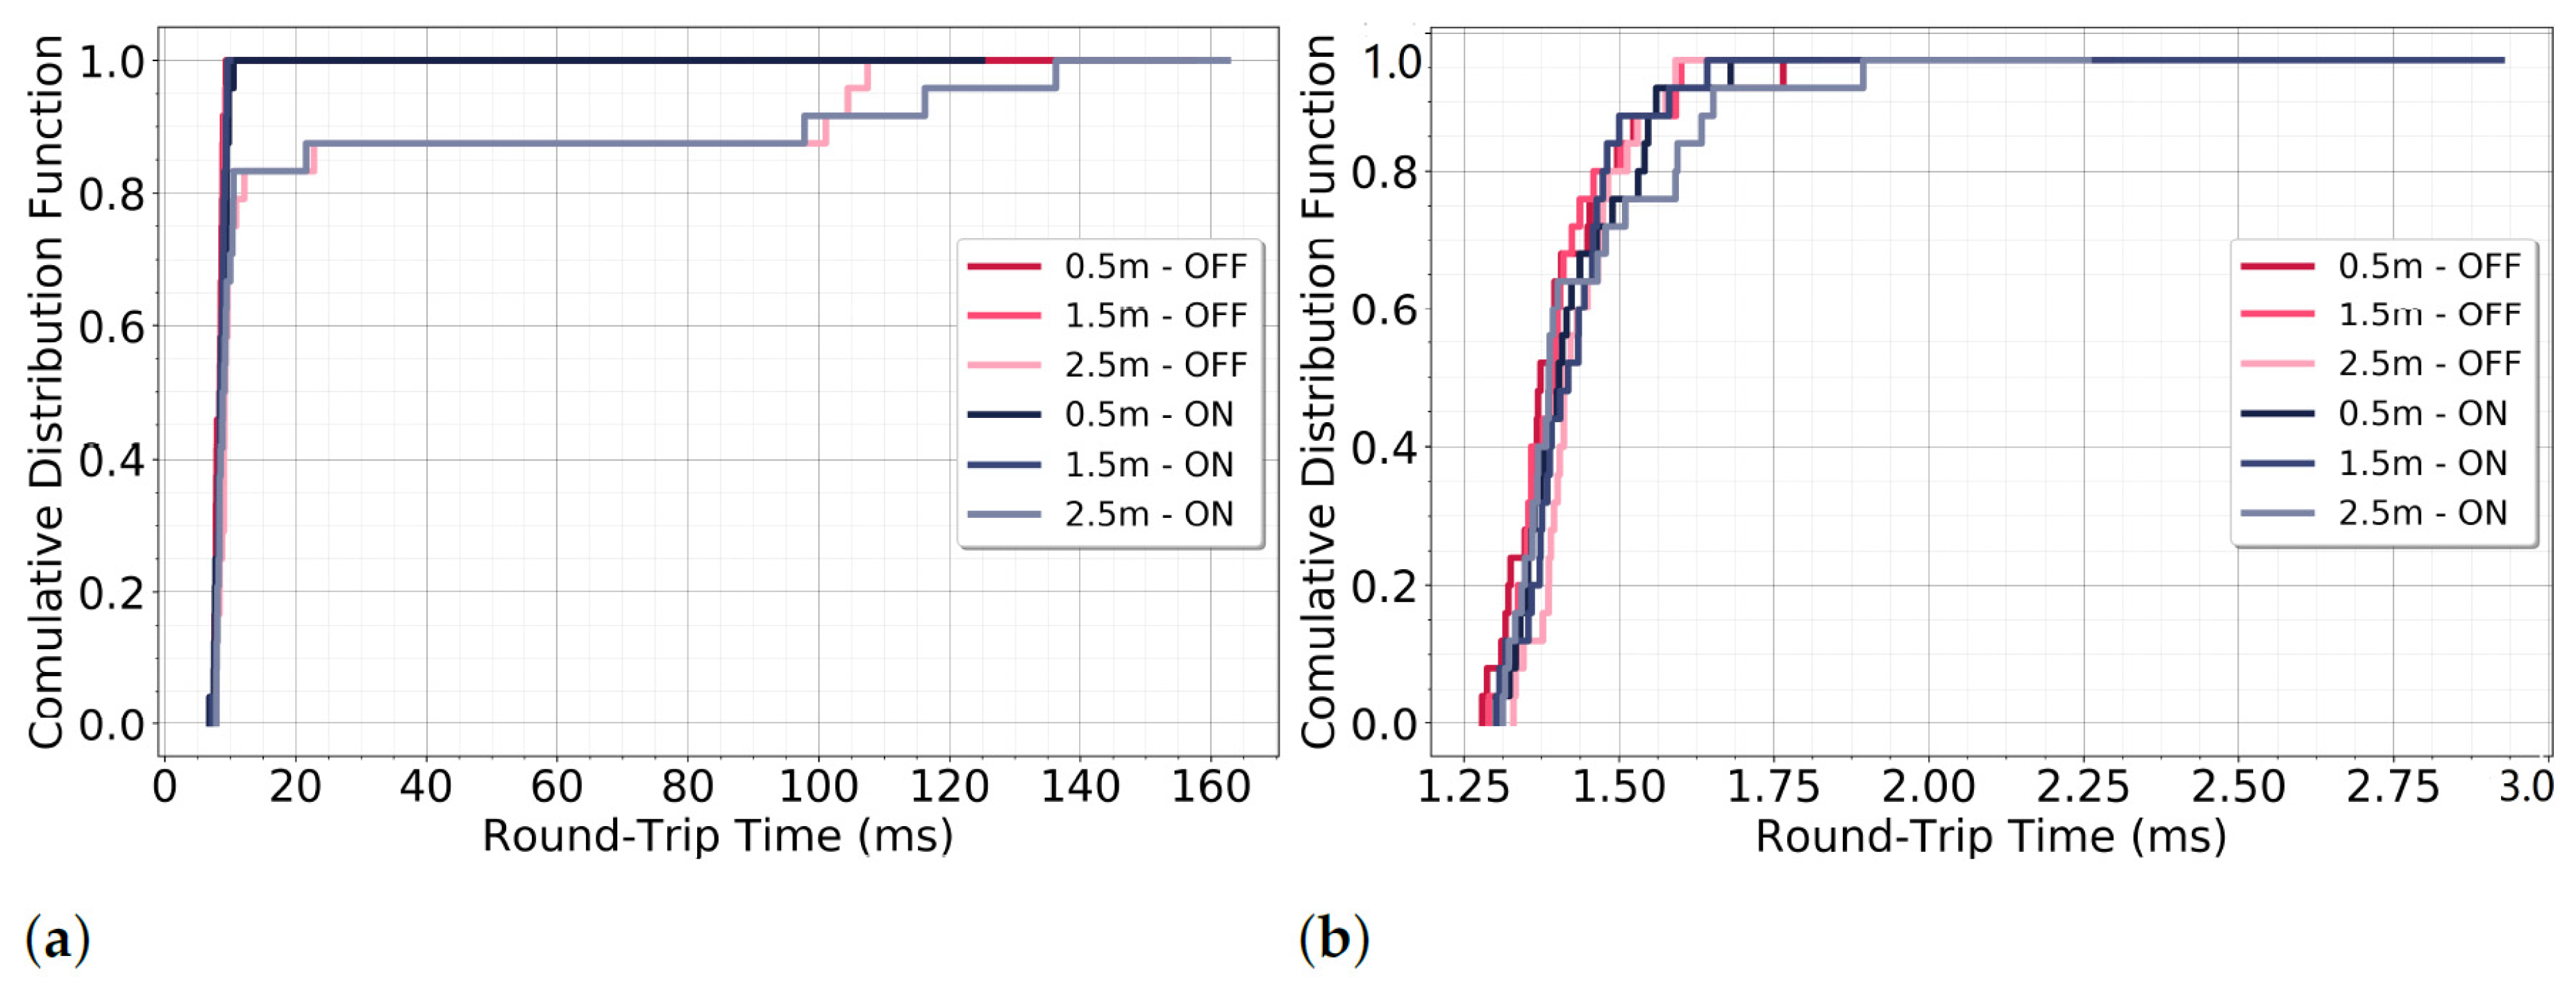
In this experiment, data on the signal strength, throughput, and the round-trip time were acquired for both drones in a greenhouse compartment. After placing 25 location markers on the compartment’s floor with an equal distance of 2.5 m from each other, the UAVs were moved manually at each location, and measurements were conducted at three different heights, namely 0.5 m, 1.5 m, and 2.5 m, respectively. Data from each drone were collected in two different scenarios, first with the propellers turned on, where the throttle was set to 100%, and then with the propeller turned off, where the throttle was set to 0%. During the measurements, not only was the position and orientation of the PC steady, but also the UAVs were aiming for a fixed orientation, as Figure 4 illustrates. It is worth mentioning that no plants populated the greenhouse during the measurements.
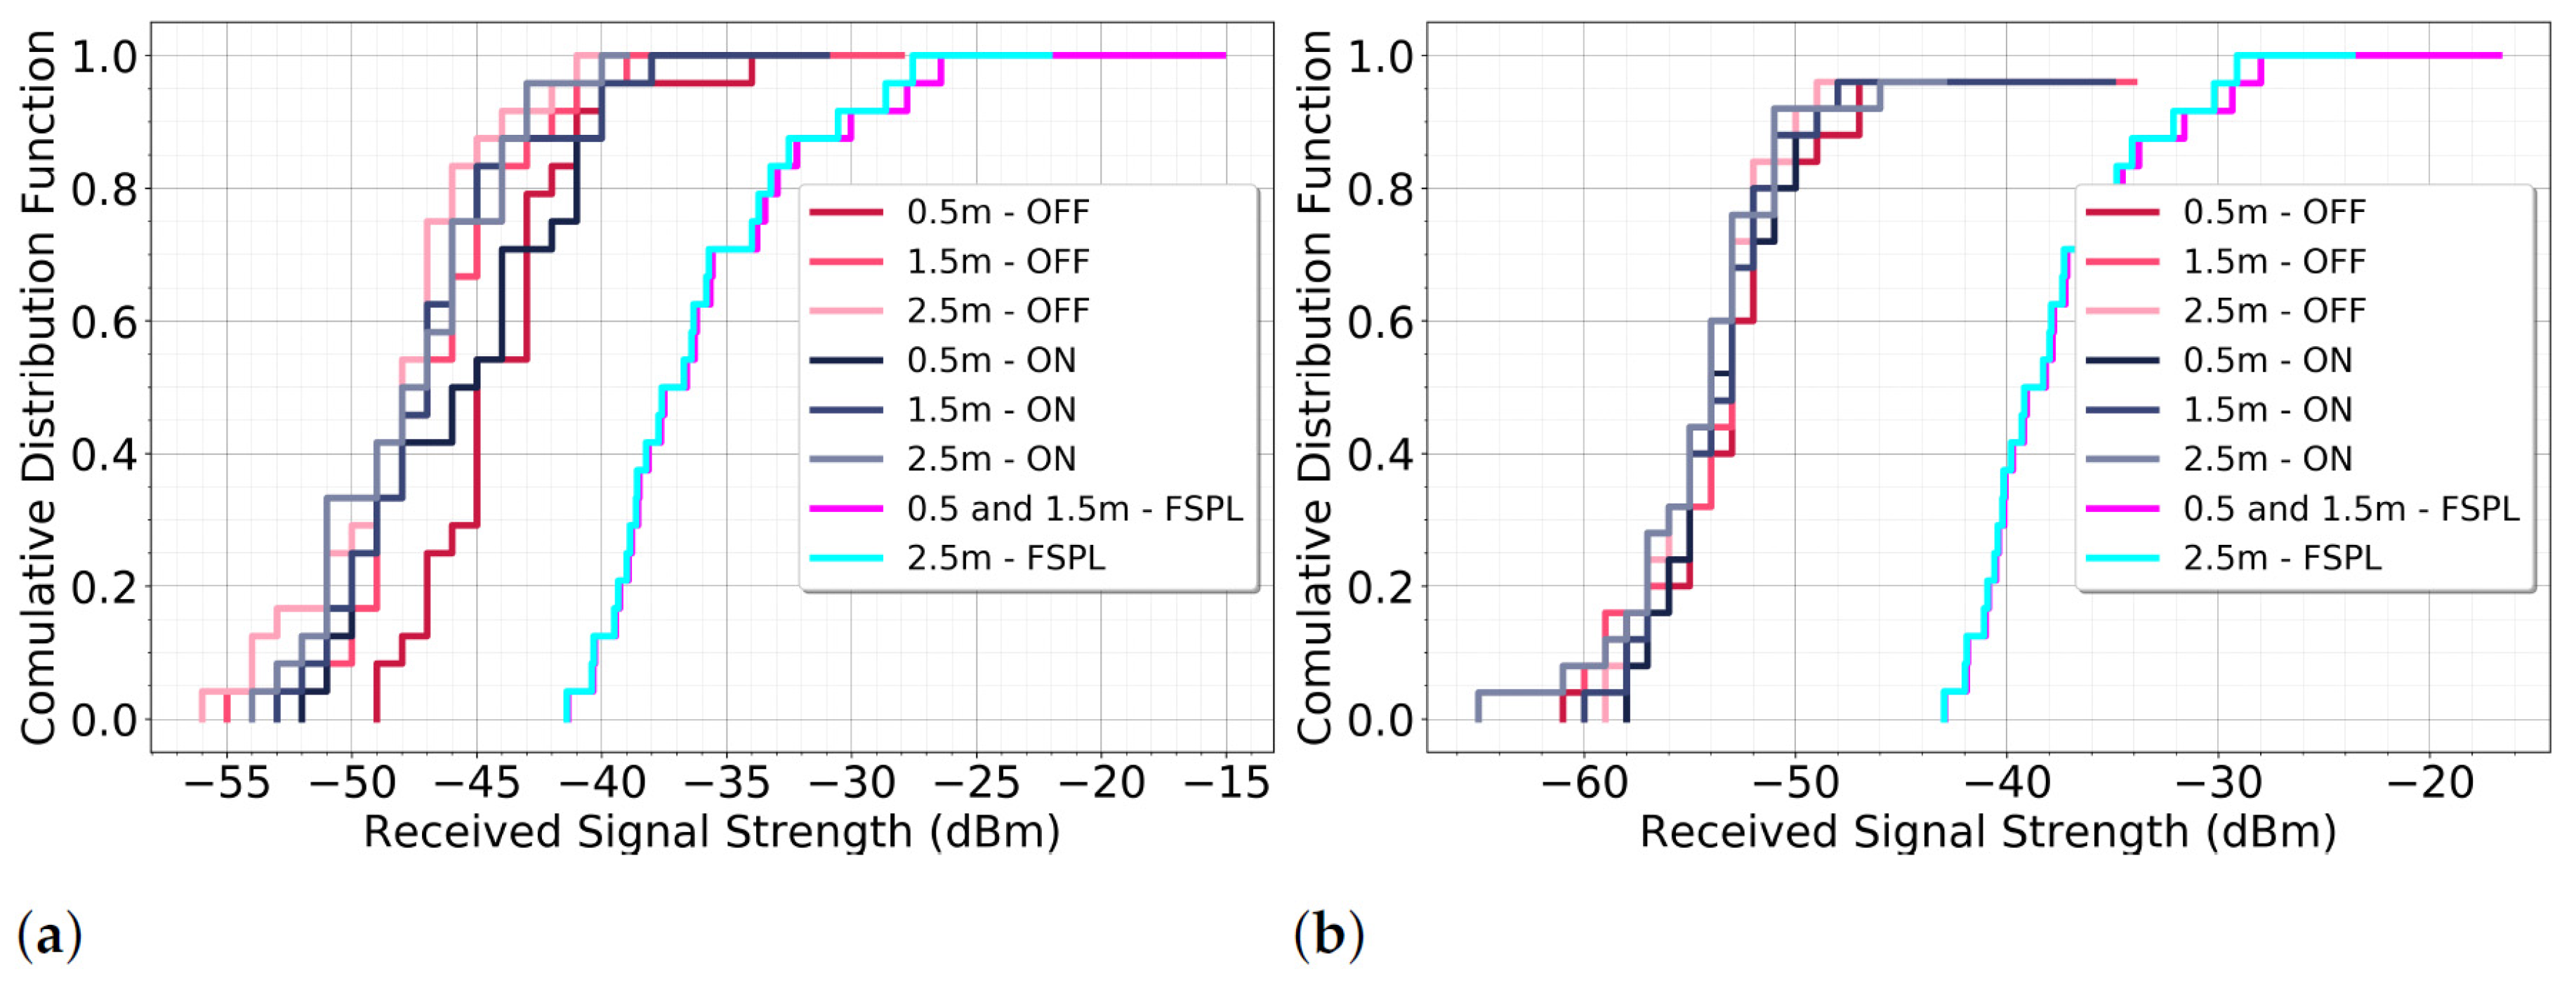
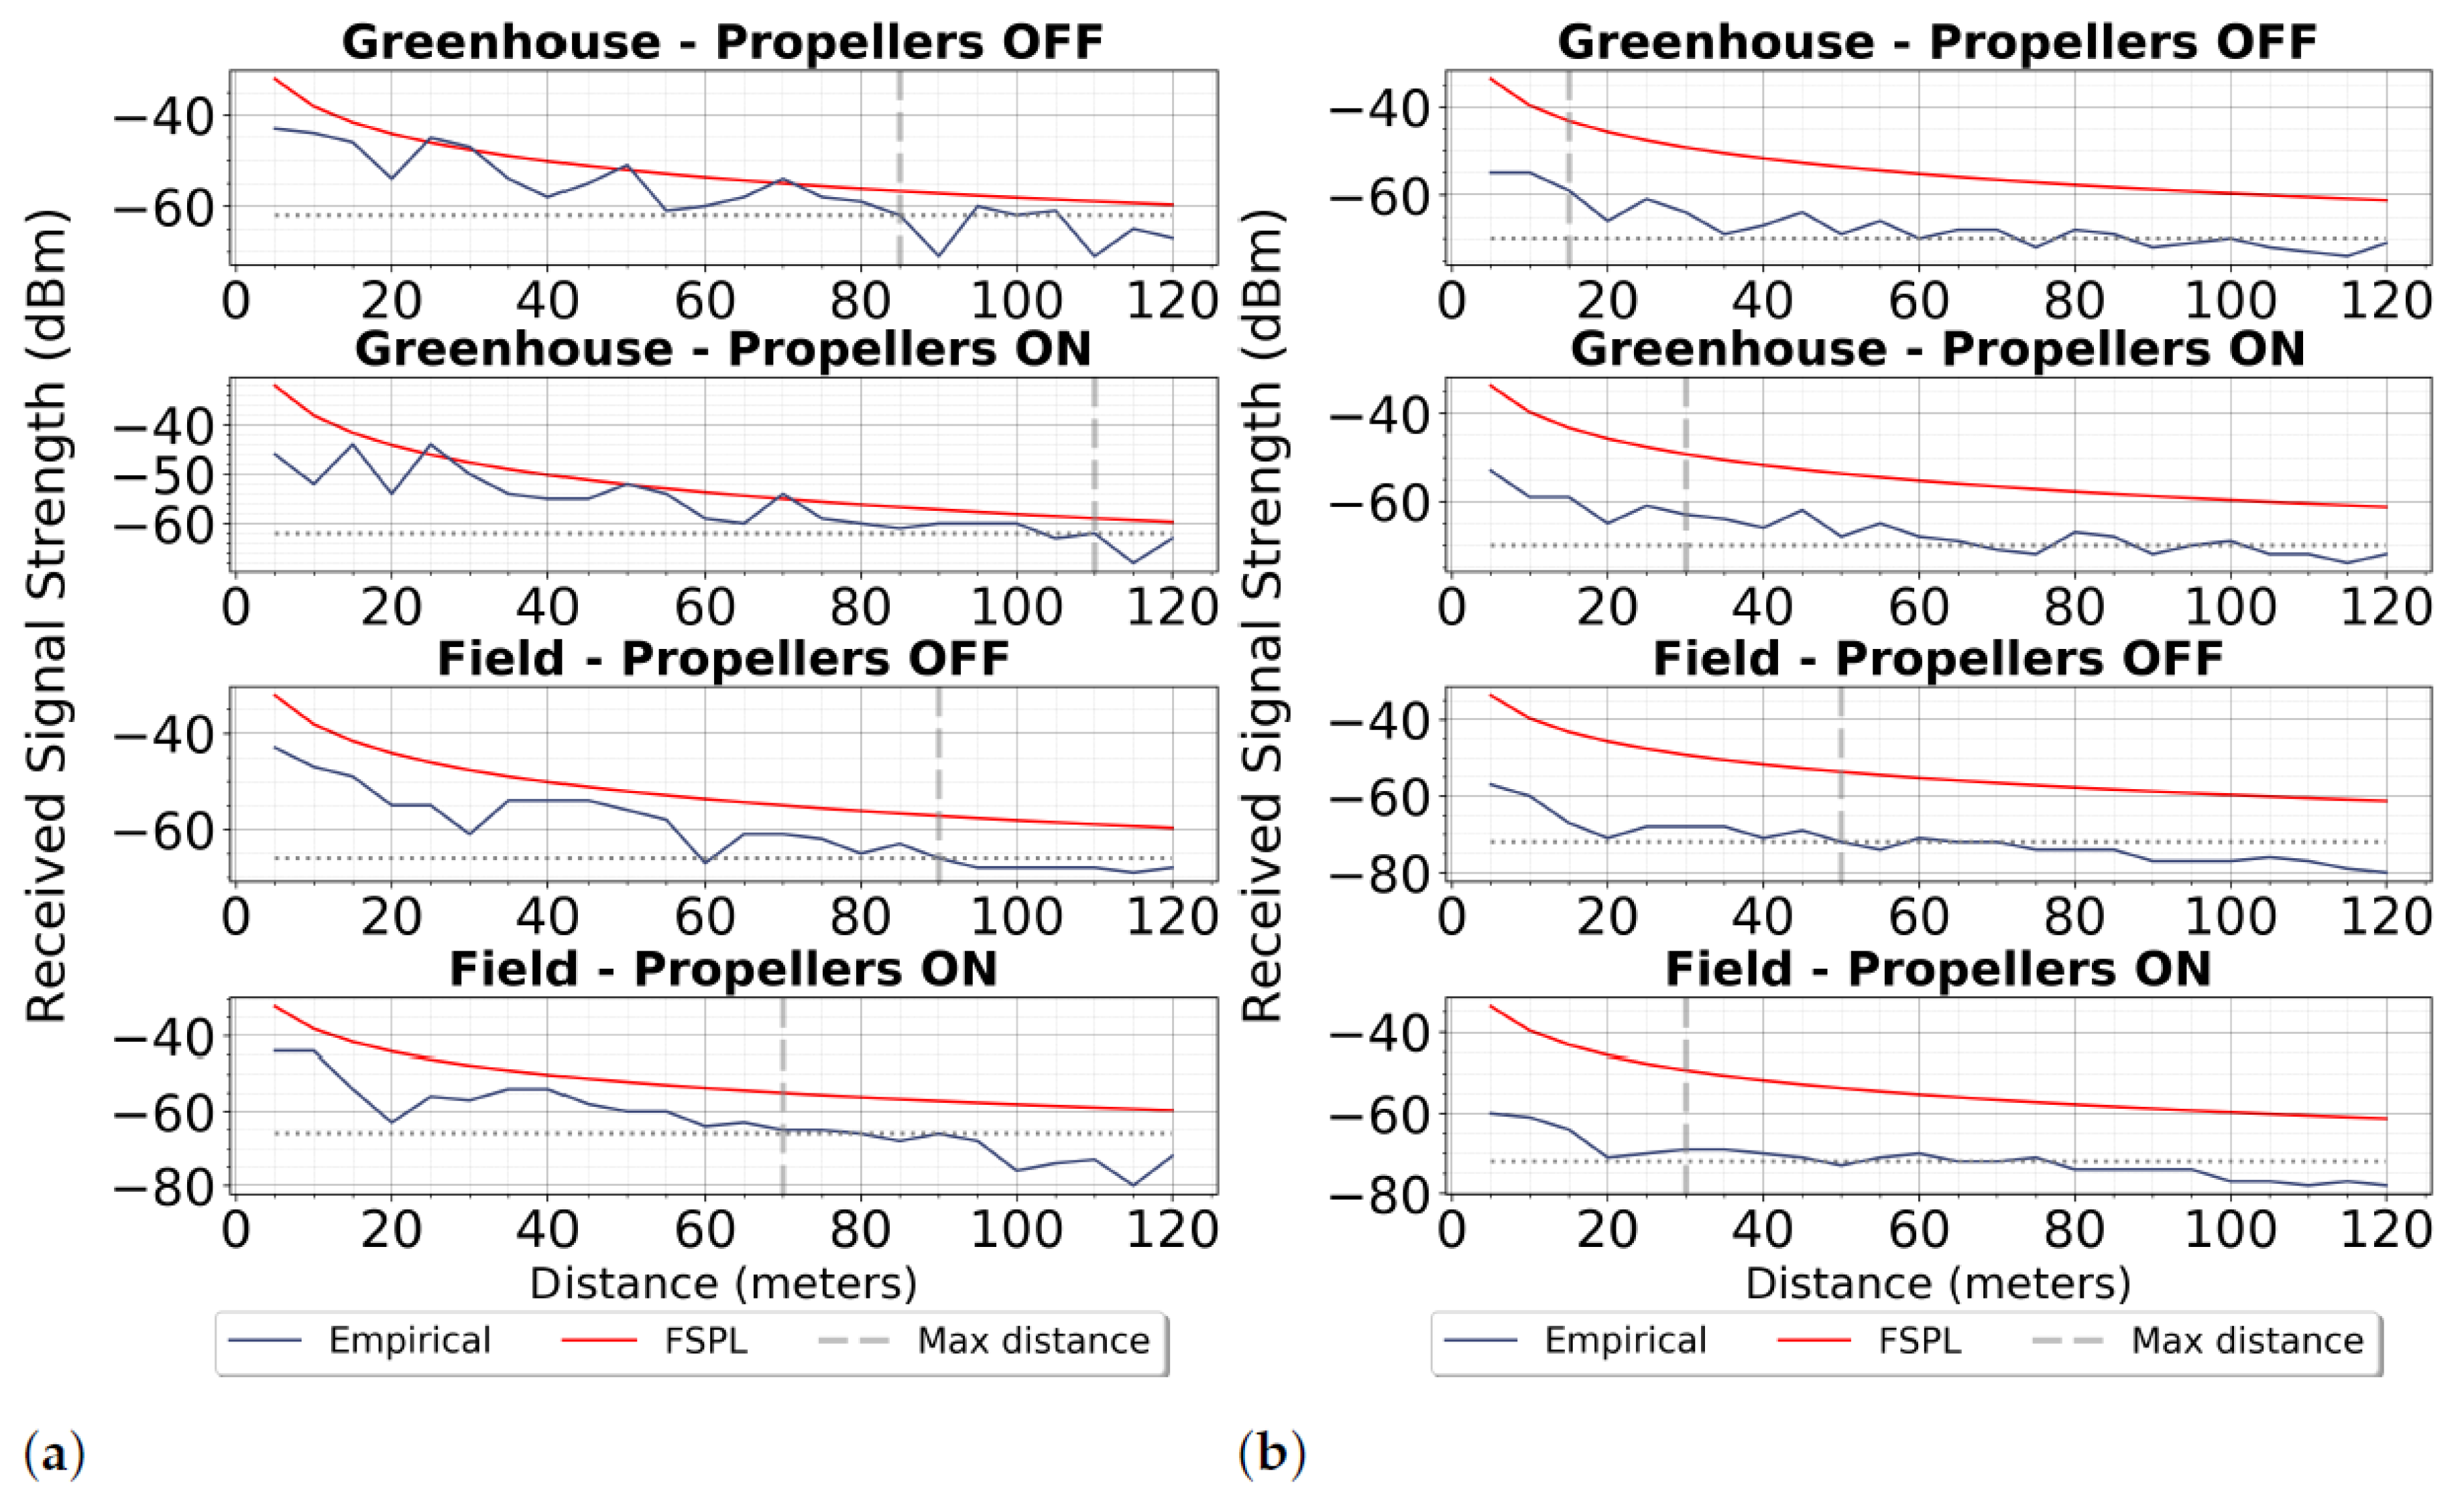
The path loss for each scenario was calculated, and then the results were compared with the Free Space Path Loss (FSPL) model [31], one of the most fundamental models for signal propagation:
P L ( d B ) = 10 l o g 10 P t P r = 10 l o g 10 G t G r λ 4 π d 2
P r ( d B m ) = P t + 10 l o g 10 ( G t G r ) + 20 l o g 10 ( λ ) 20 l o g 10 ( 4 π ) 20 l o g 10 ( d )
The Free Space Path Loss is an idealistic model; it represents the signal attenuation in cases where there is line-of-sight propagation and no obstacles are involved between the receiver and the transmitter. This means that only the signal attenuation caused by distance has been considered while it is assumed that lossless antennas were used and there is absence of multipath effects.

2.3. Maximum Range

Another aspect that was studied was the effect of the greenhouse construction on the maximum flight range that a UAV can fly inside a greenhouse. The aim of this experiment is to explore the distance boundaries where a drone can achieve reliable connection with the ground controller unit.
It is important, however, to define the requirements where a connection can be considered reliable. Cameras in UAV applications in indoor farming are an essential system component, and the video quality was considered one of the most important requirements, especially for cases where crucial visual aided algorithms were employed, such as VSLAMs [5,32]. Usually, the video quality is proportional to the video bitrate, the higher the quality, the more data need to be transferred.
One of the characteristics of the Wi-Fi communications is the data rate, or throughput, which indicates the amount of data that can be transferred between the clients. Since both the UAVs used in this study communicate using Wi-Fi, it is important to ensure that the video data can be transmitted to the ground station by taking into account the connection data rate. By design, both drones employ dynamic video compression to reduce the video quality when the data rate is not adequate for the data transmission.
In order to ensure highest video quality transmission, we consider the maximum video bitrate the UAVs can achieve as the minimum data rate required by the Wi-Fi connection to transfer the data. For the evaluation of the maximum distance that a UAV can fly without video quality loss, the data rate of the connection is used as the main Quality of Service (QoS) parameter.
Several studies have attempted to examine the throughput between different 802.11 standards in different environments. For instance, the authors of [26,
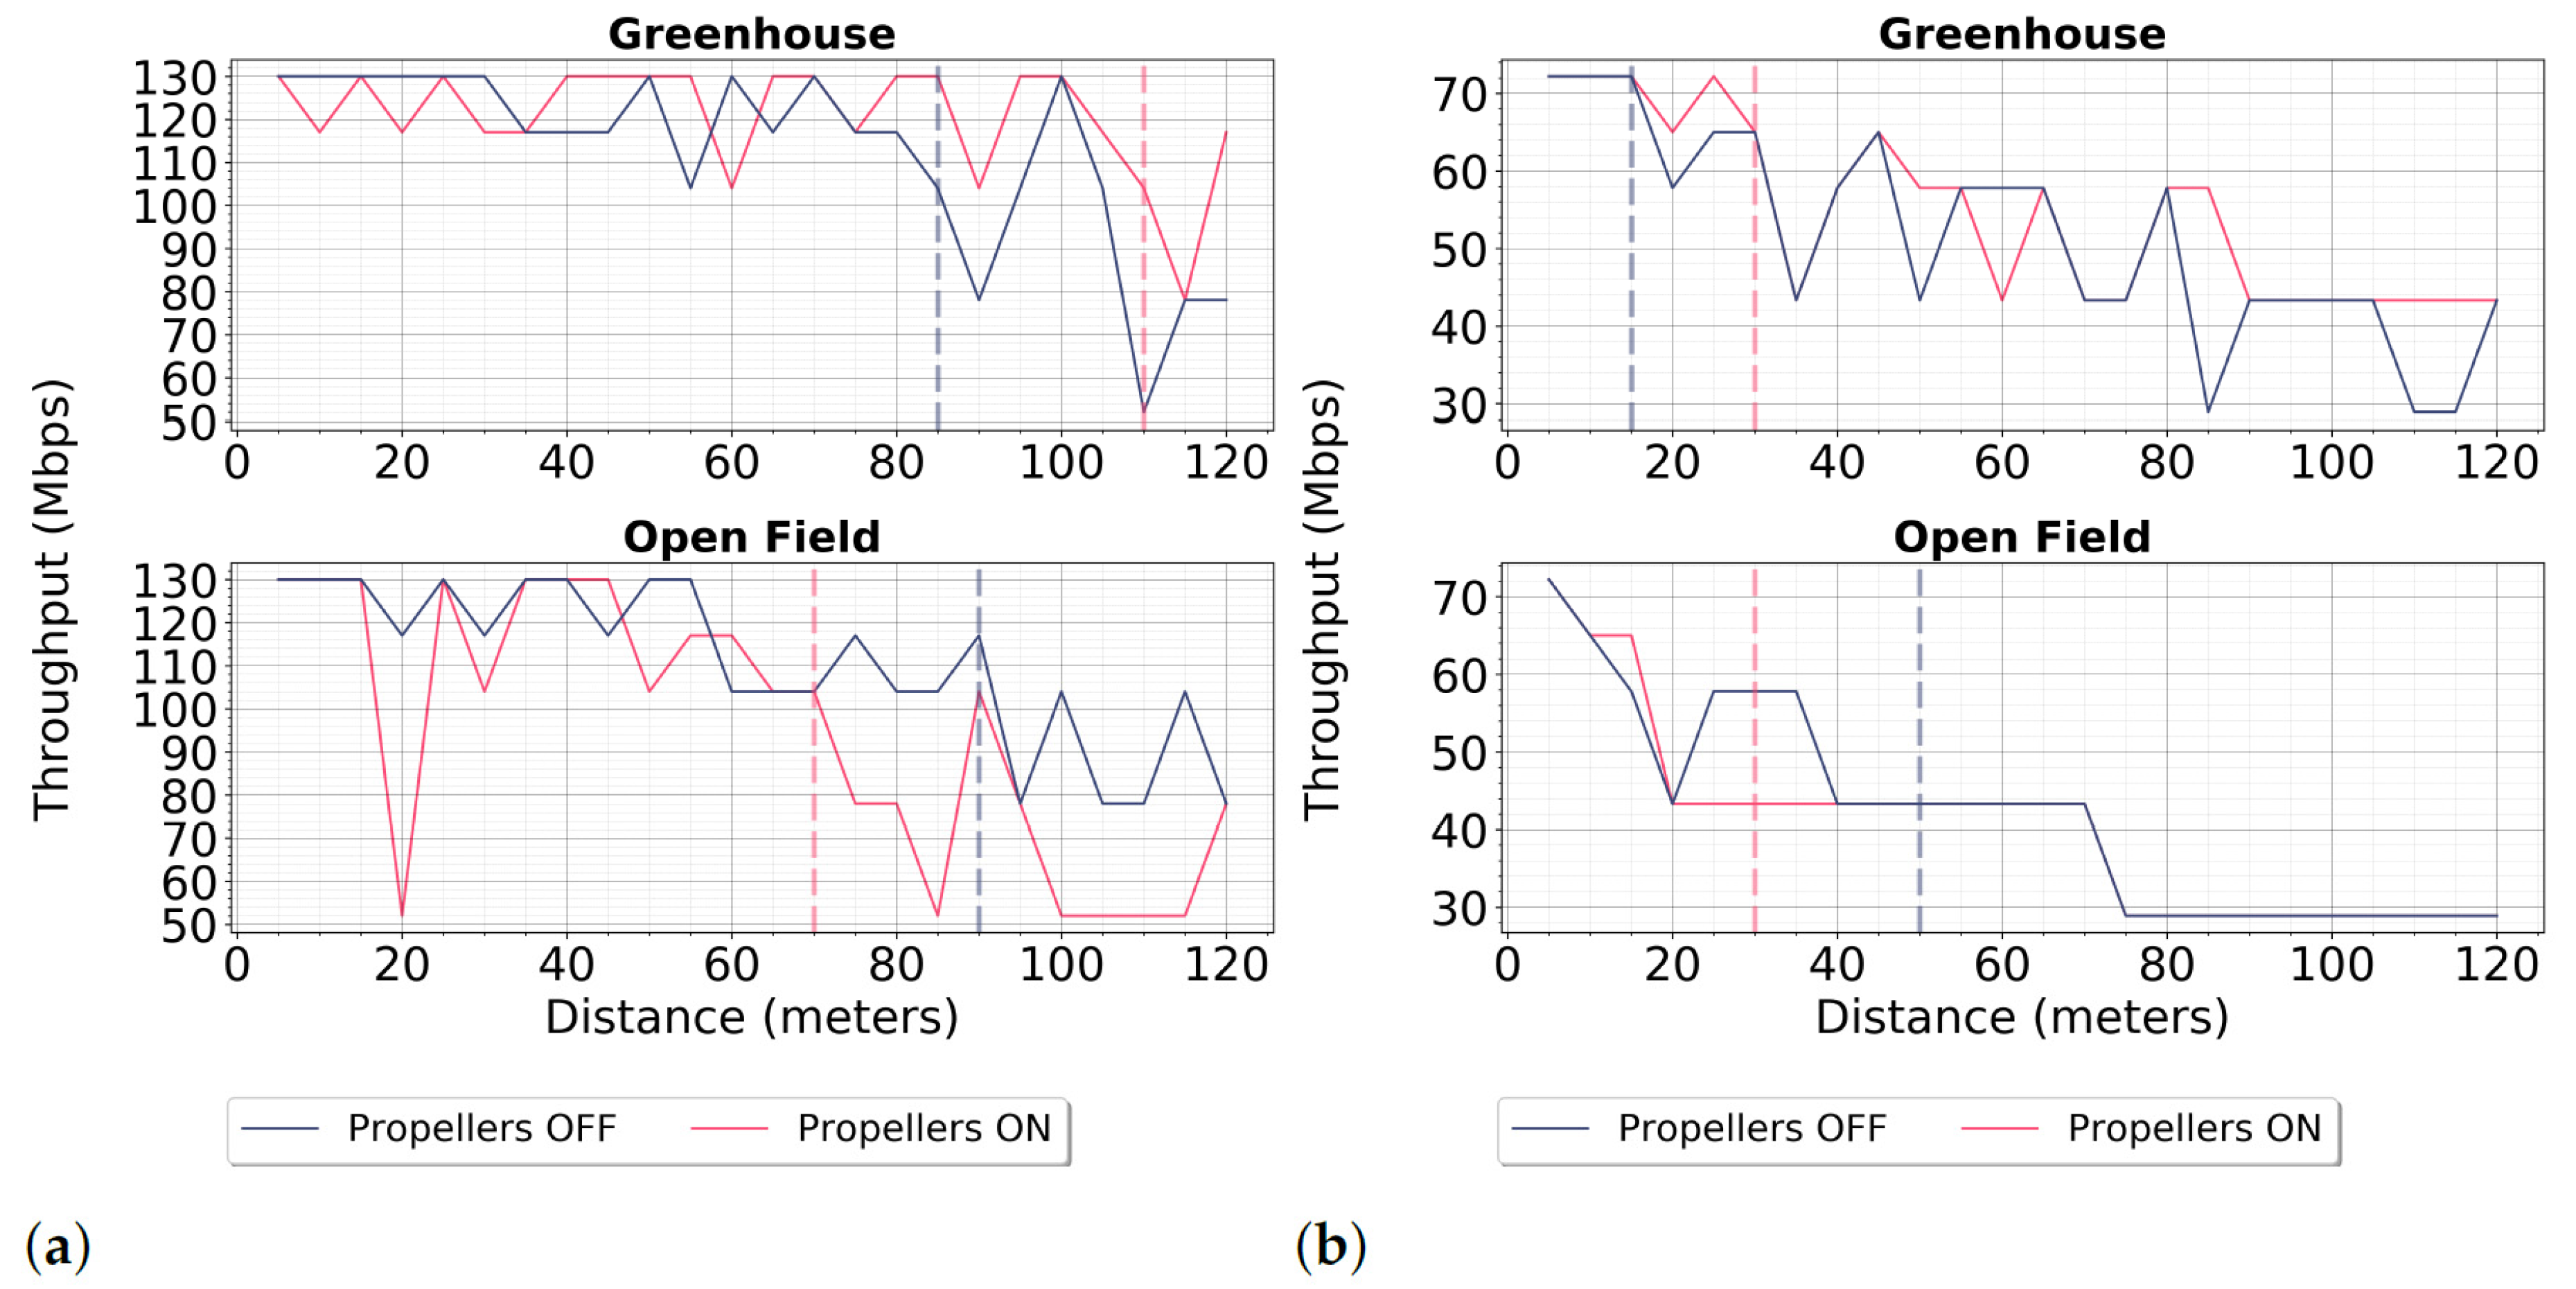
27] found that the IEEE 802.11n is susceptible to interference, and as a result, the throughput is affected significantly. Since the UAVs used in this study support only IEEE 802.11n, experiments were conducted in two different environments, first an open field, and second a real-world greenhouse corridor, as can be seen in 
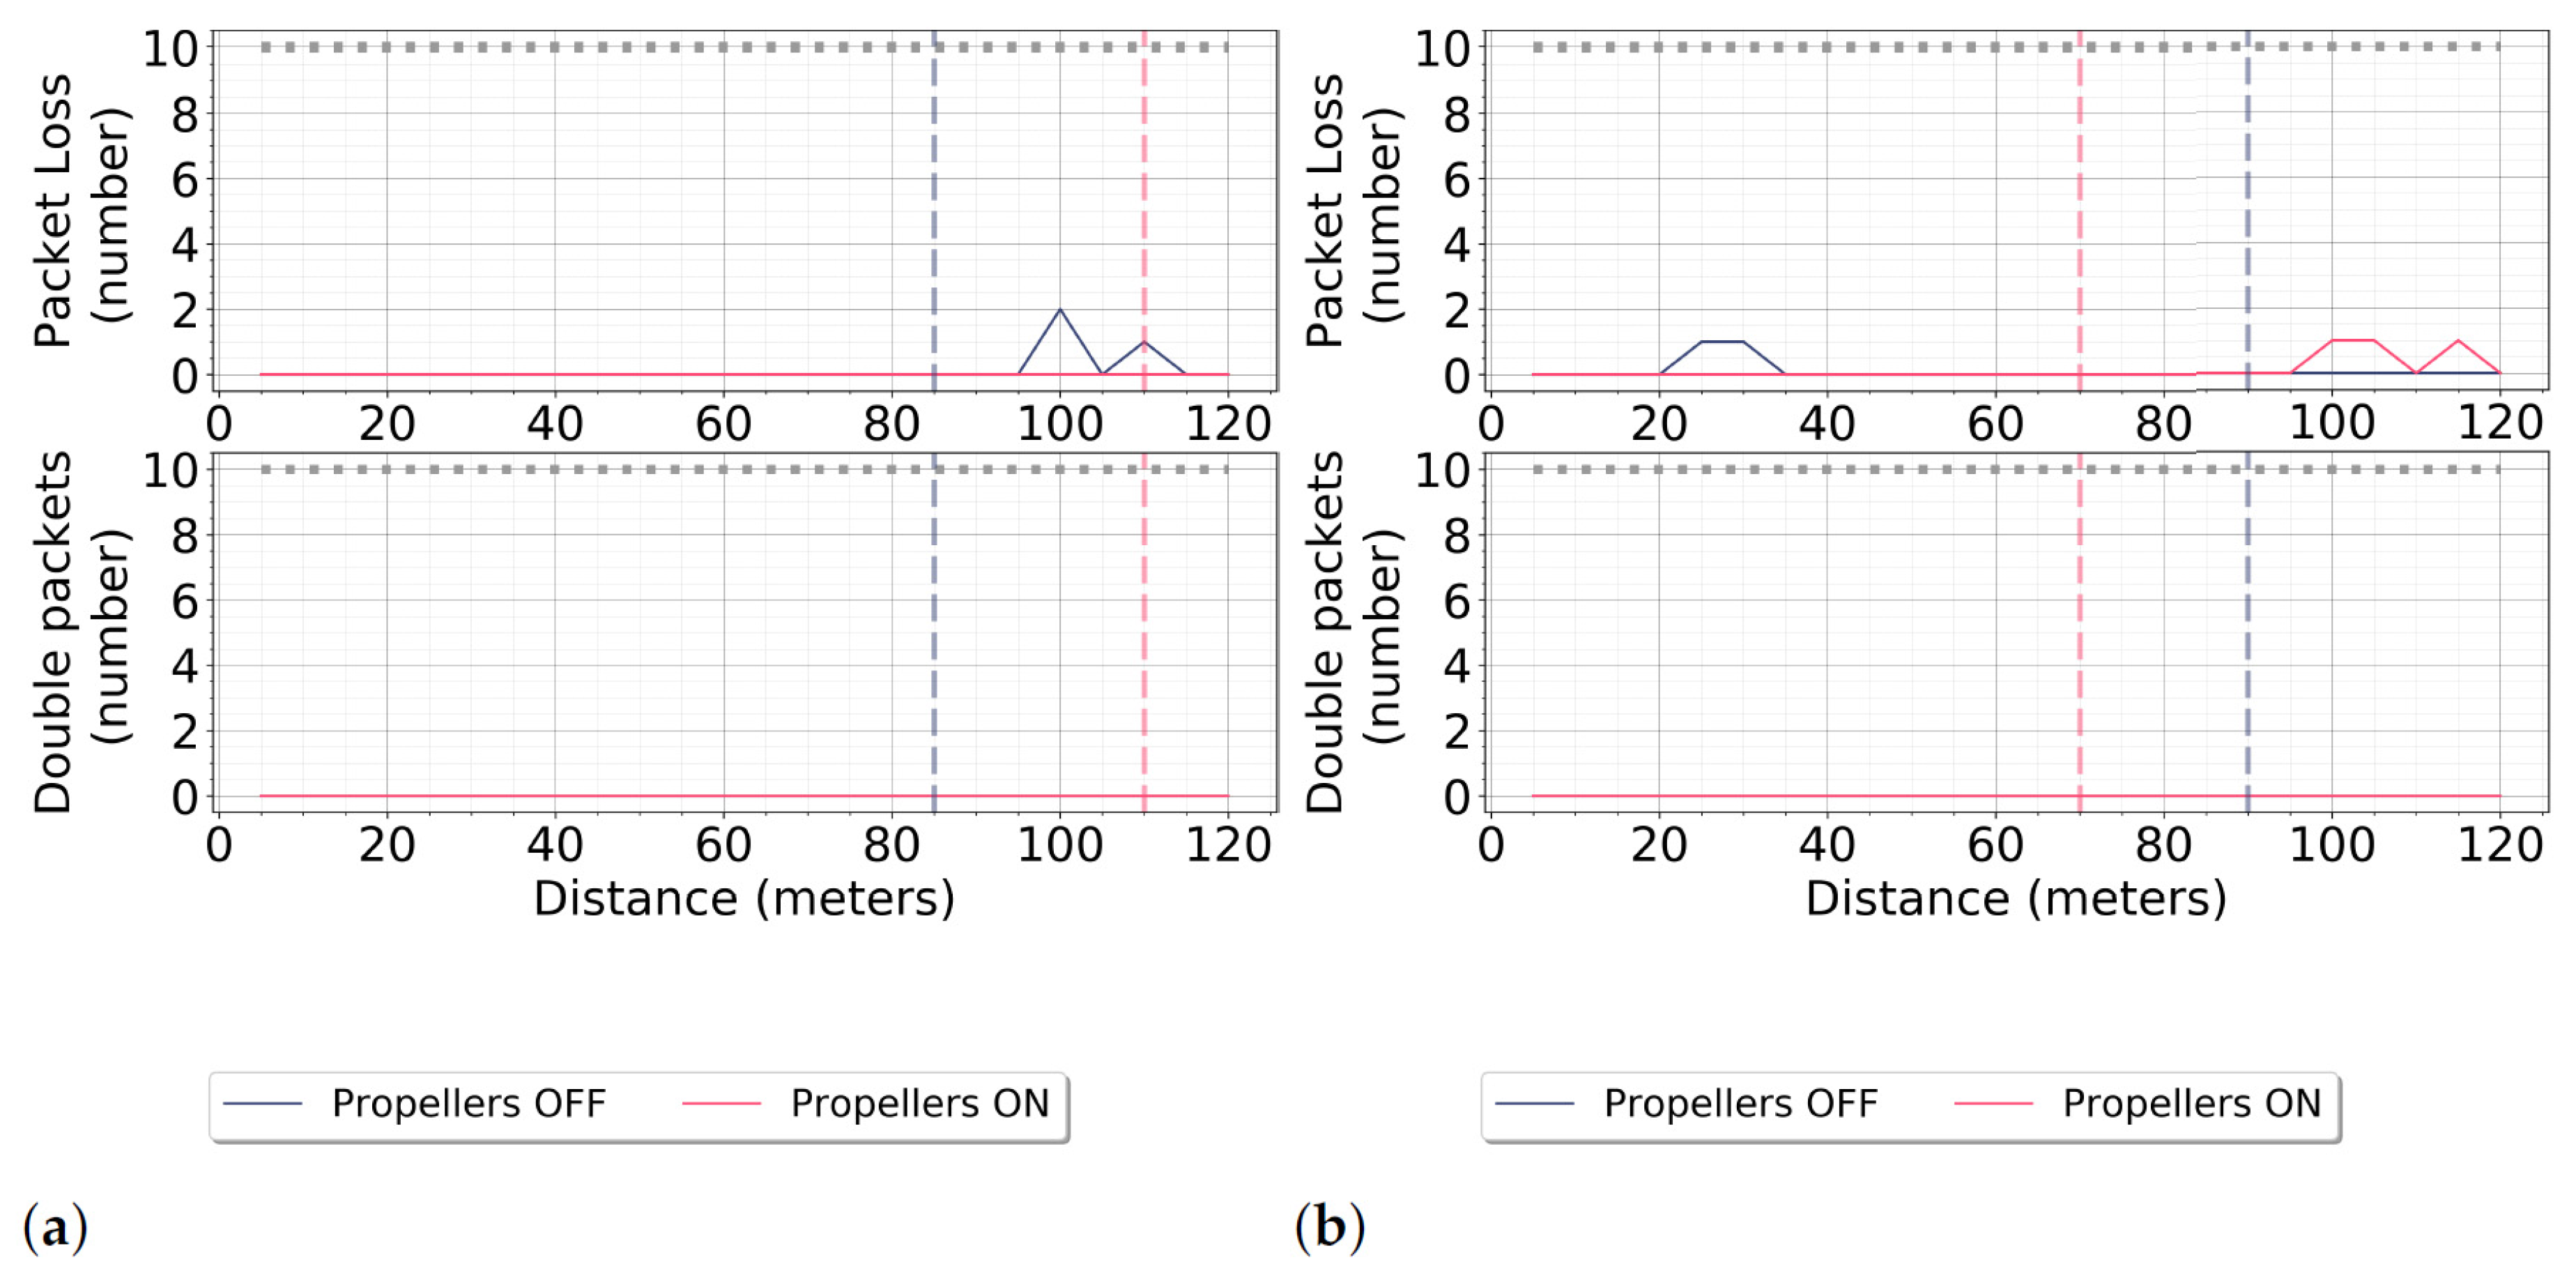
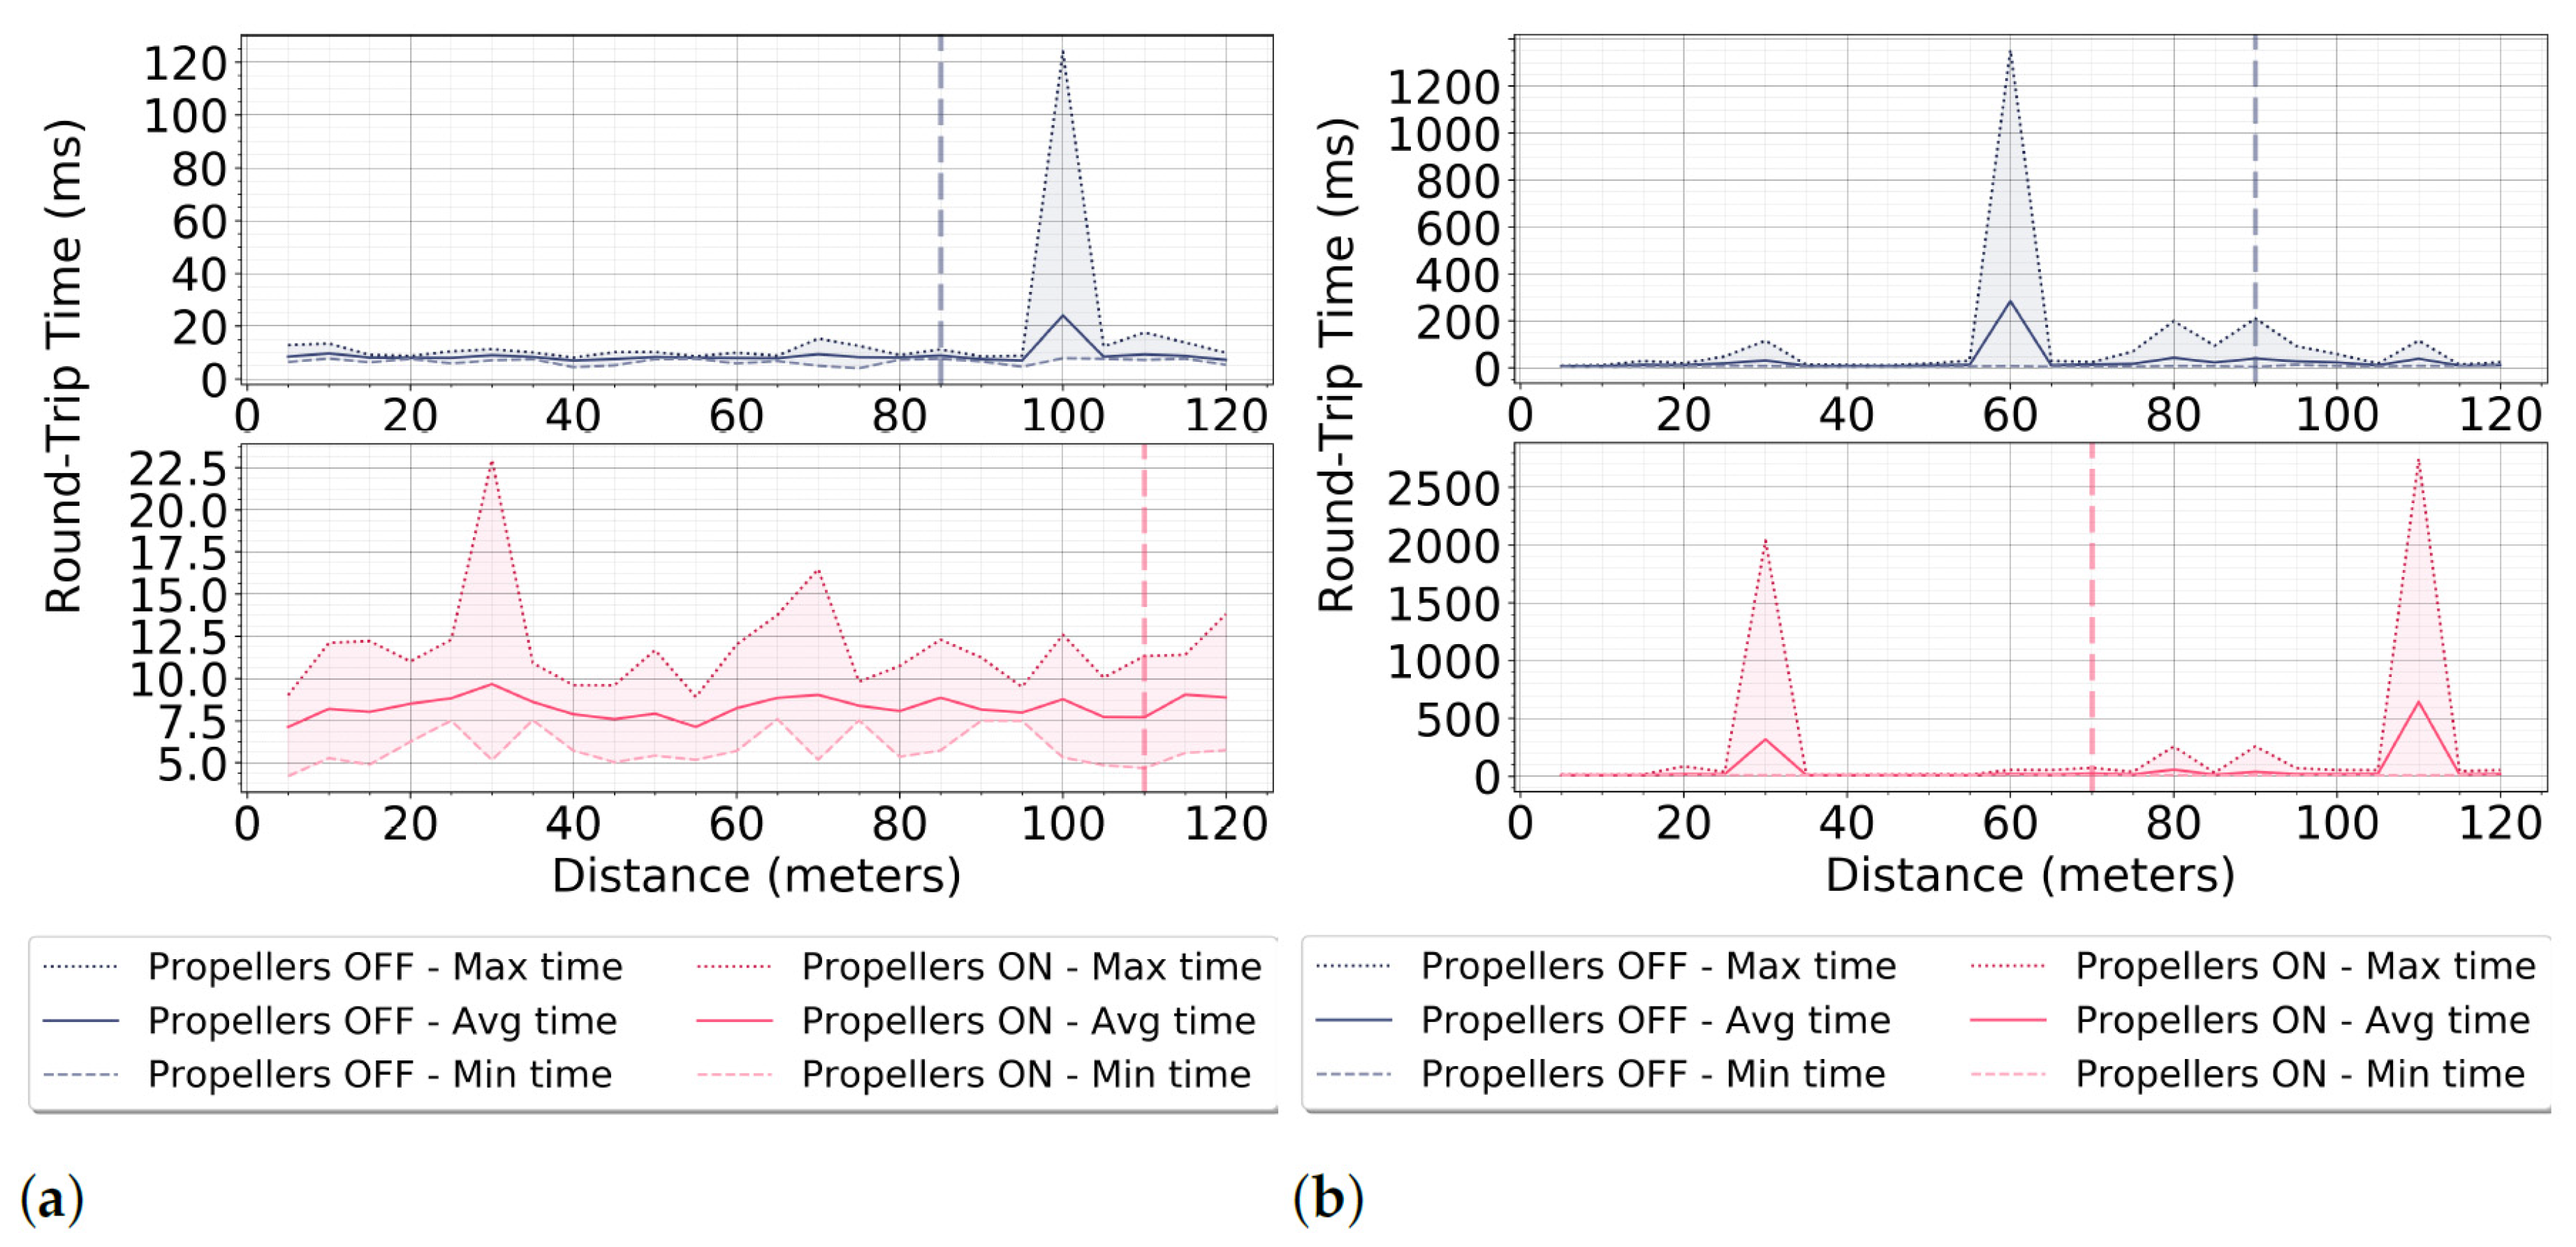
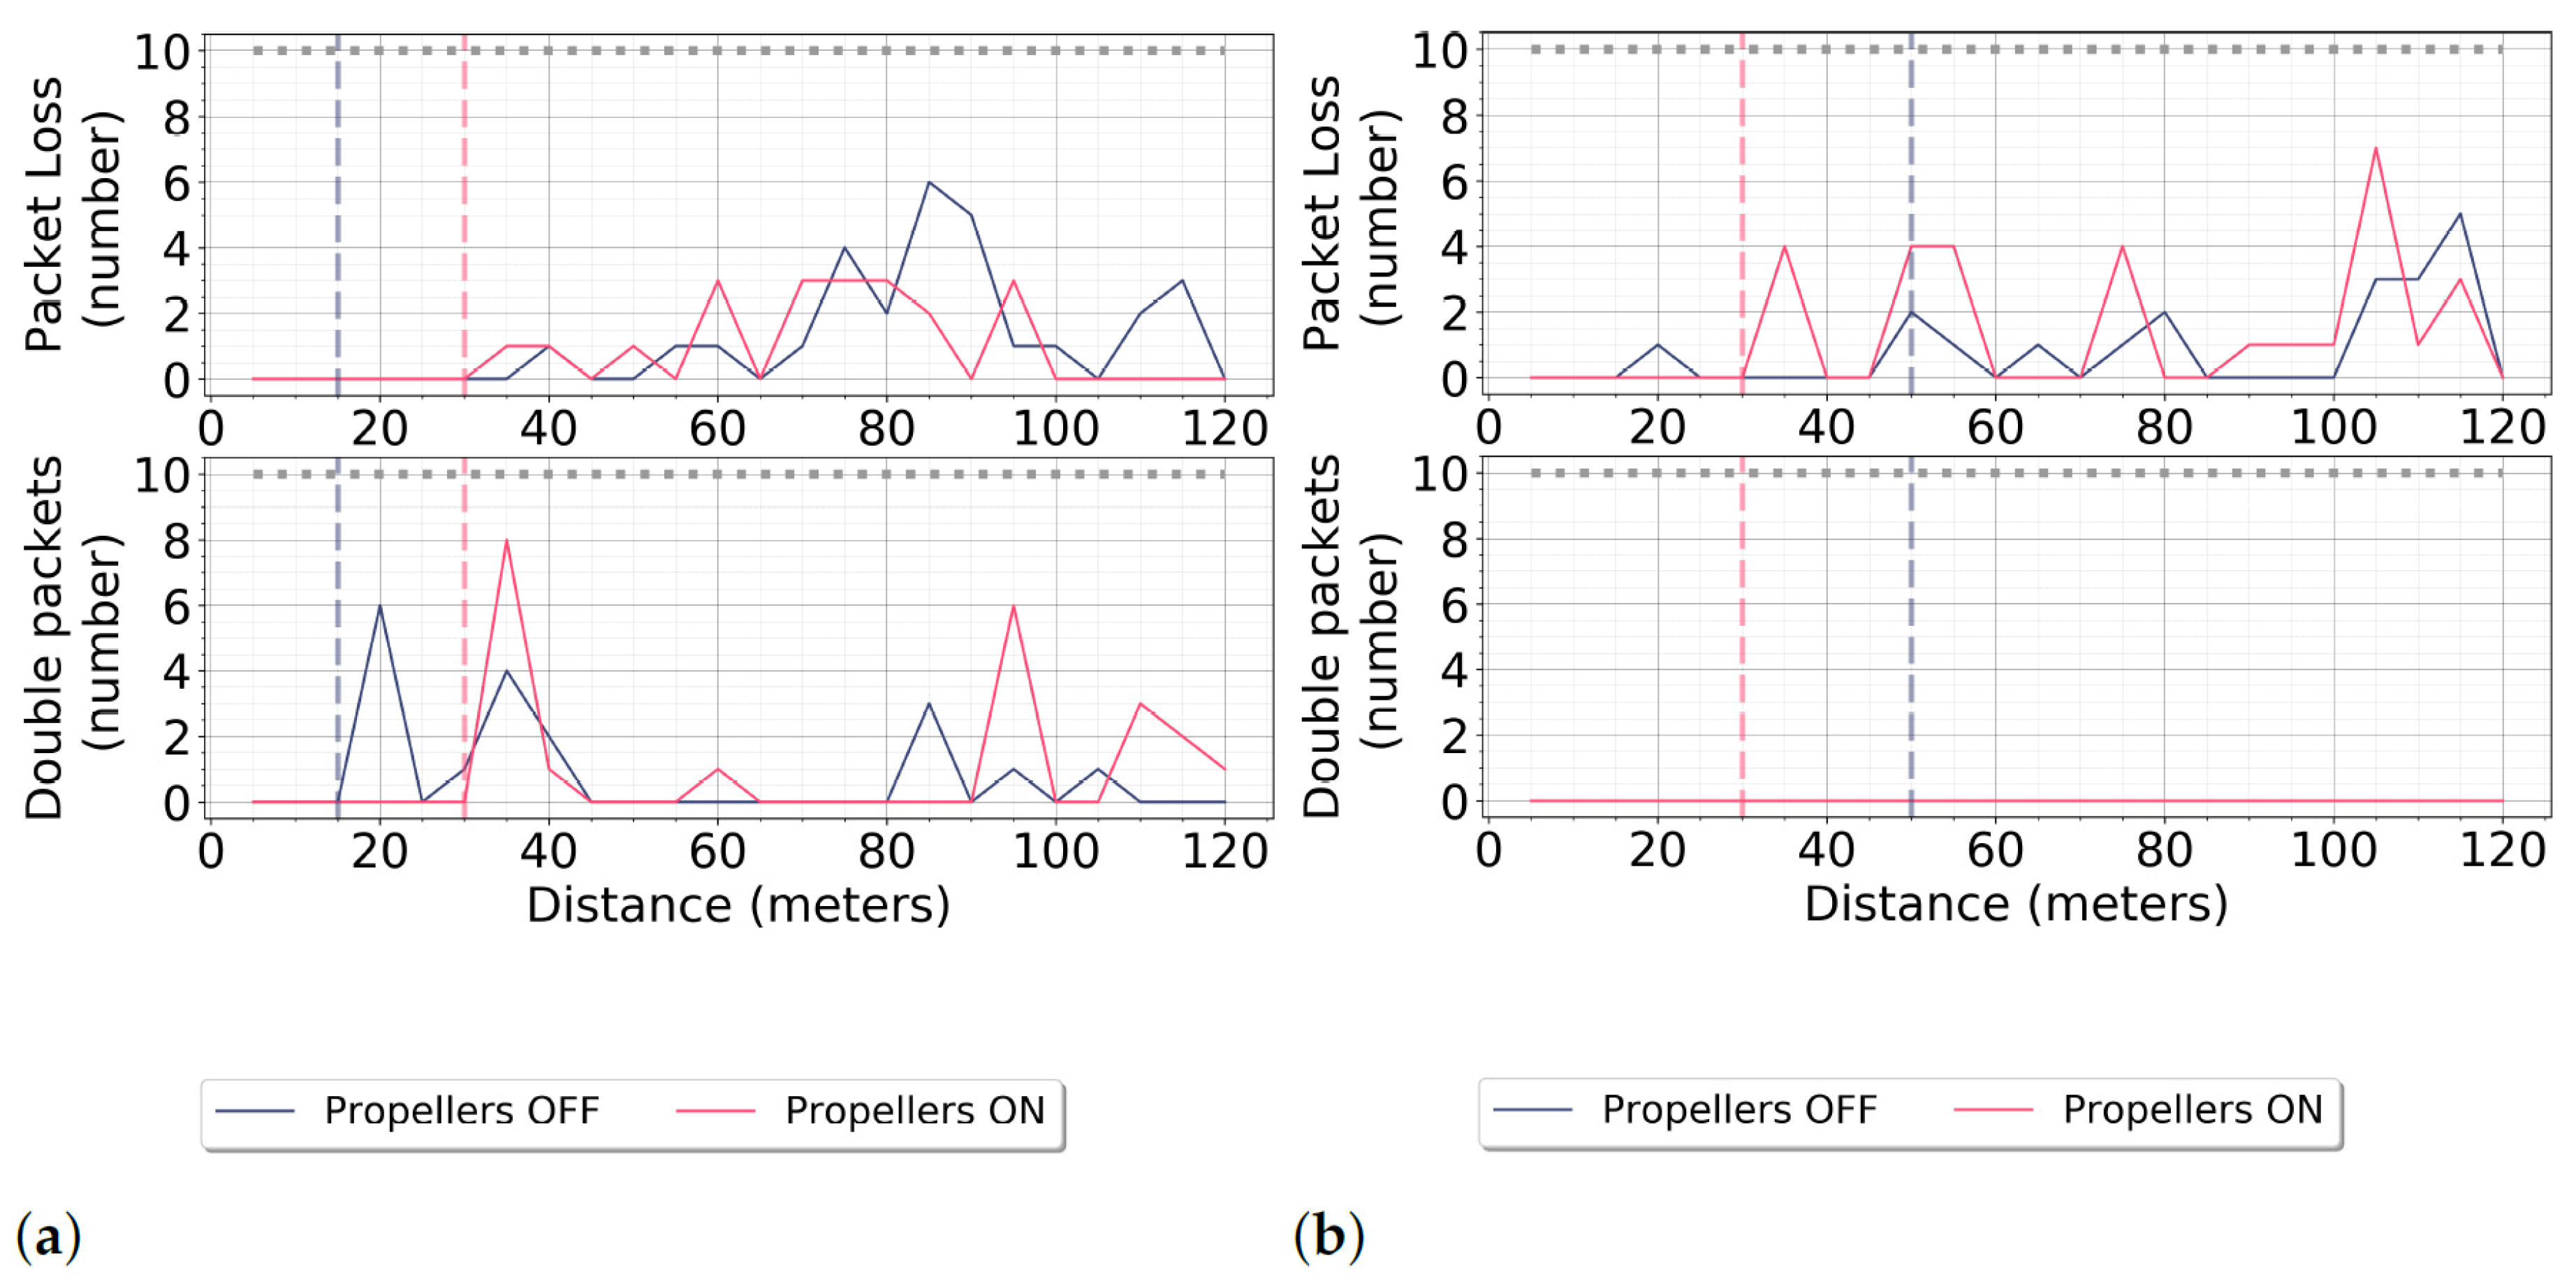
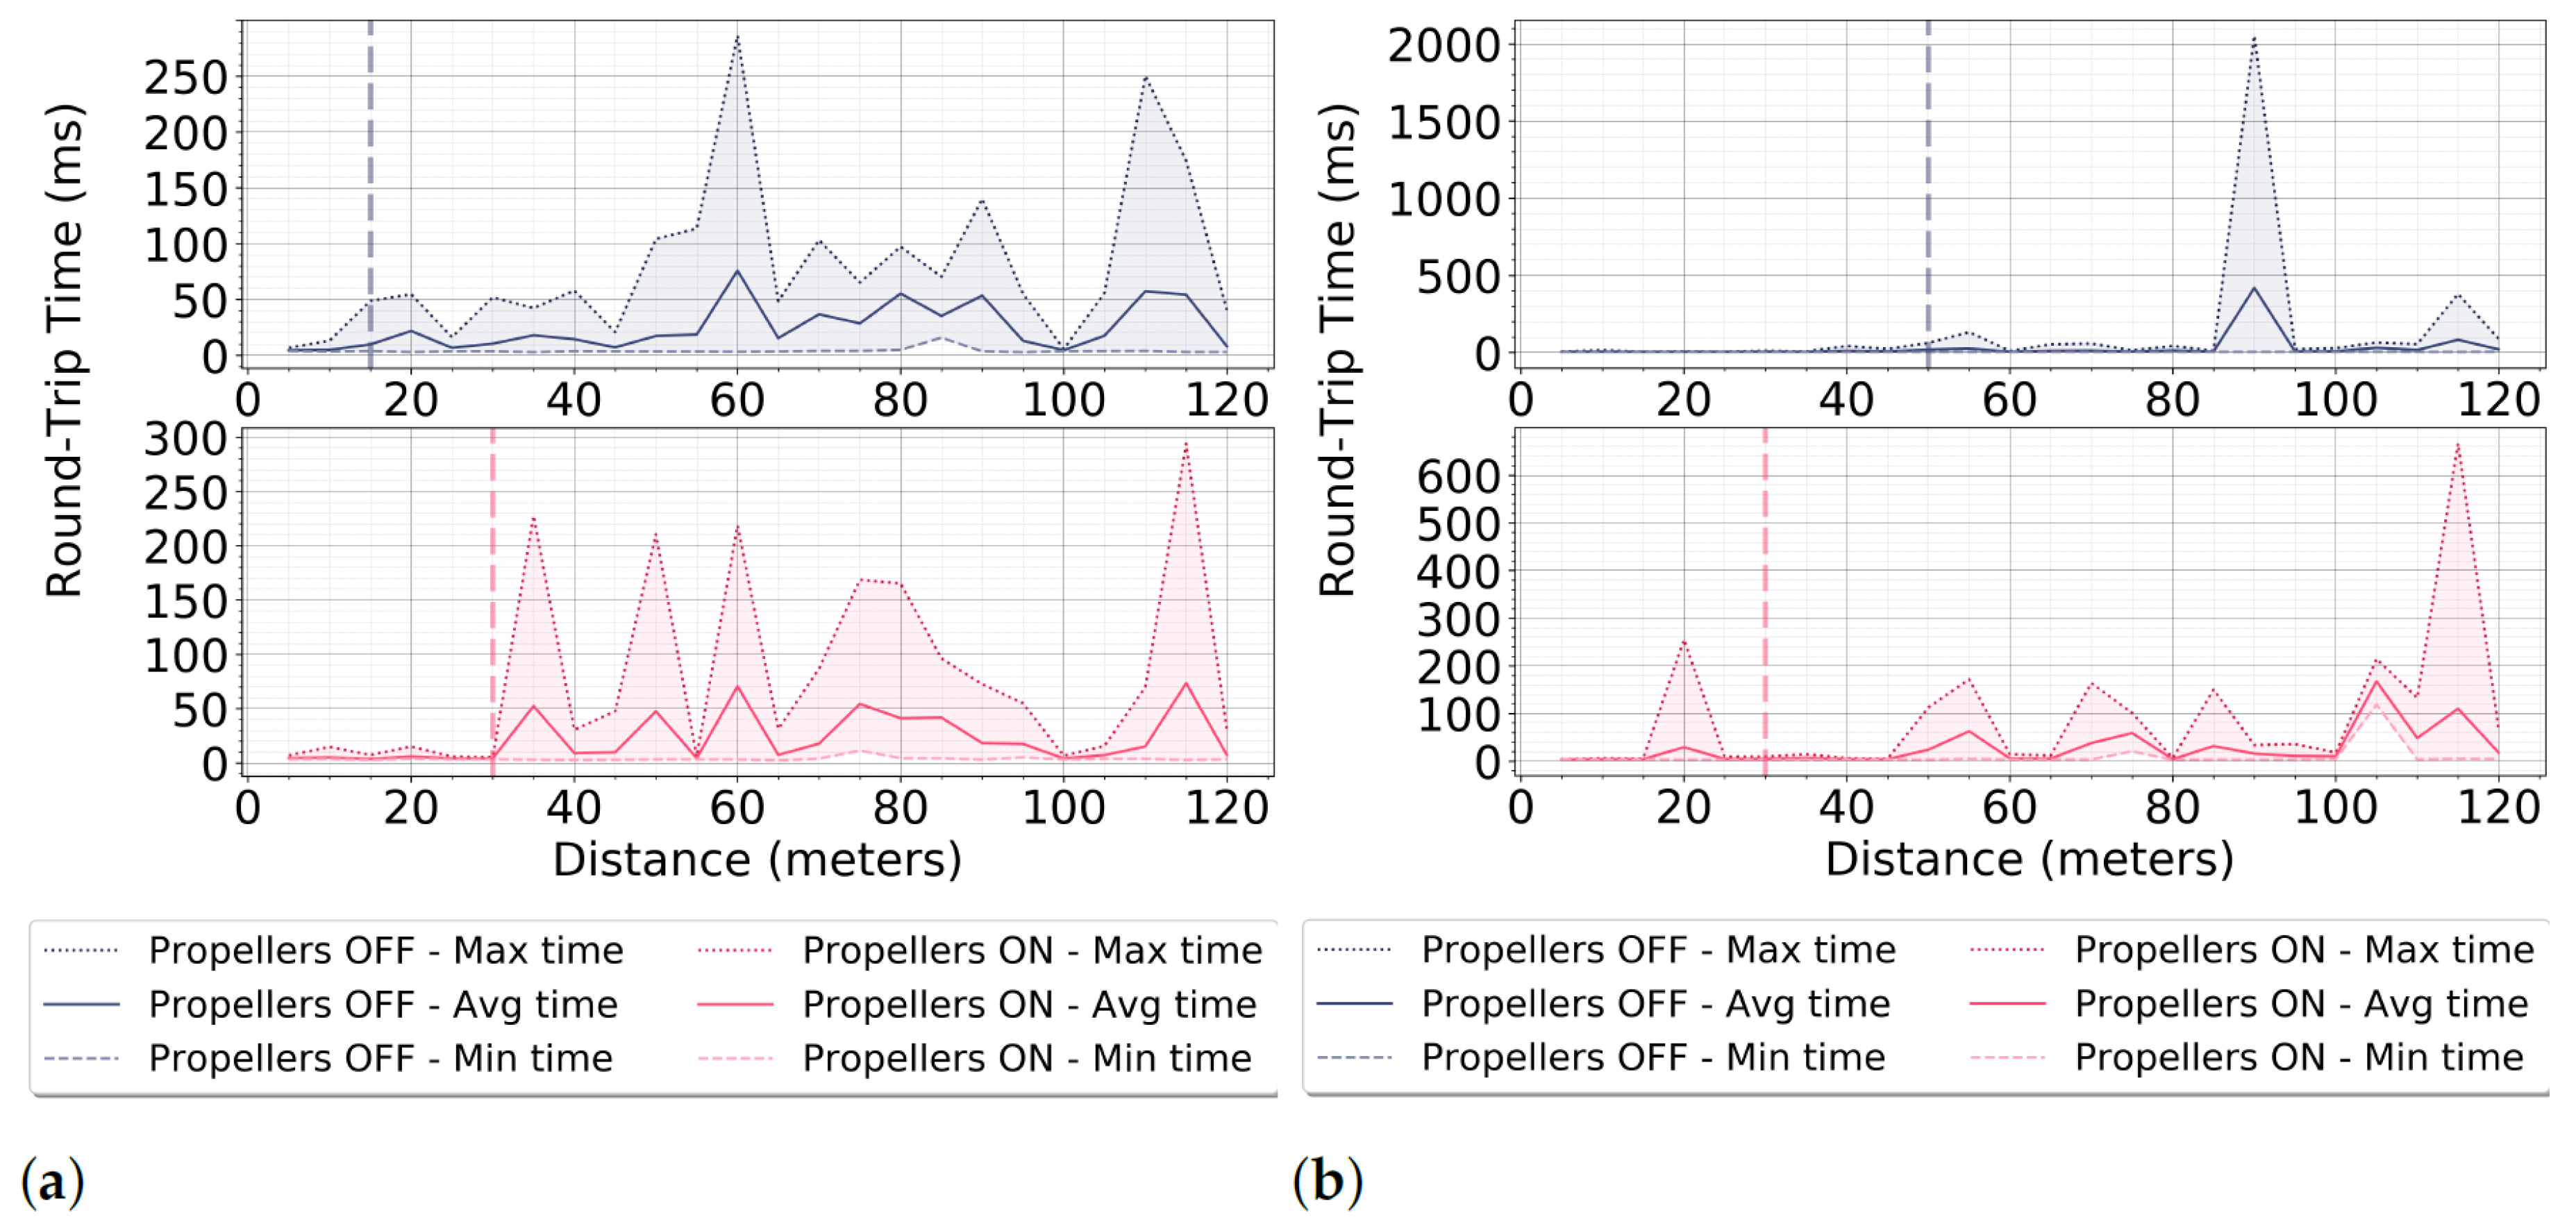
Figure 5a,b, respectively. Although the presence of external Wi-Fi networks around was minimal, the effect of the potential interference caused by the greenhouse structure was studied, and thus, the connection capabilities of each UAV in two environments were compared. For this reason, measurements were carried out every 5 meters, reaching the maximum distance of 120 meters away from the controller unit.

3. Results

3.1. Radiation Pattern

Both UAVs were compared and their connection capabilities were evaluated by examining the RSS, the throughput, the packet transmission rate, and finally the round-trip times. The first aspect that was studied was the RSS in different orientations. In principle, the aerial vehicles are meant to change their positions and their orientations in space constantly. This means that they should be able to transmit and receive the signal effectively in every possible direction, and ideally, an isotropic radiation pattern is observed. From the empirical measurements, however, it was found that none of the measured UAVs had a perfect isotropic radiation pattern in any of the axes, as can be seen in Figure 6. The main reason for this effect is the design of each platform. For instance, the AR.Drone 2.0 has a two-layer Printed Circuit Board (PCB) antenna, which is located on the mid-left side of the vehicle body, underneath the battery, as Figure 7b indicates. As a result, there is a significant fluctuation probably caused by shadowing effects of the onboard components. The difference between the minimum and the maximum RSS values is 16 dB, 19 dB, and 18 dB for the yaw (Figure 6a), pitch (Figure 6b), and roll axis (Figure 6c) respectively. In addition, on the roll axis (Figure 6c), a two-lobe, hyper-cardioid pattern is observed with the main lobe at 105° and a smaller back lobe at 285°. Interestingly, the two lobes are not aligned on the vertical axis of Figure 6c, but instead, there is roughly a 15° counter-clockwise swift, which can be justified by taking into account the physical properties and the location of the antenna (Figure 7b).
On the other hand, the Parrot Anafi is designed with a different Multiple Input Multiple Output (MIMO) antenna configuration system, where four external antennas, one in each leg of the drone, have been integrated (Figure 7a), and therefore, it is more sensitive in most of the orientations and outperforms the AR.Drone 2.0. However, the empirical radiation pattern is not isotropic either, especially on the pitch (Figure 6b) and the roll axes (Figure 6c), and two overlapping lobes were observed. Despite the fact that the two lobs are not very distinct, there is a significant difference in the signal strength between the minimum and the maximum values, 15 dB for the pitch and 14 dB for the roll axis. Although the yaw axis has a more balanced shape, there is a fluctuation of 9 dB between the maximum and minimum values.
In Figure 8, the throughput is presented in different orientations around the yaw, pitch, and roll axes. In general, the throughput trend in all cases is uniform with the only exception of the AR.Drone 2.0 on the yaw axis (Figure 8a), where there is a moderate fluctuation between 0° and 180°. From the results, it turns out that the AR.Drone 2.0 is capable of delivering only the 55.5% of the maximum throughput of 130 Mbps the Parrot Anafi can achieve, proving the superiority of the Anafi.
The reliability of the connection was also investigated using the packet loss rate and the round-trip time in different orientations. In total, 240 packets were sent to each UAV for every axis, the AR.Drone 2.0 had no losses or duplicate packets, and Anafi had a total loss of 1.25% on the yaw axis, (1 out of 10 packet loss at 165° and 2 out of 10 at 225°), but no losses or double packets were observed on the other axes’ orientations.
In Figure 9, the round-trip times are presented for each axis individually. Overall, the AR.Drone 2.0 had lower average round-trip times with the exception of some peaks on the roll axis. Interestingly, some of these peaks, as can be seen in Figure 9c, occurred at the same orientations as the RSS drop on roll axis Figure 6c, which reinforces the evidence of signal shadowing or internal interference on the UAV’s components. Similar phenomena could be observed for the Parrot Anafi, where there are two spikes at 165° and 225° on the yaw axis (Figure 9a). These spikes also coincided with the RSS drop and the packet loss on exactly the same orientations, as seen in Figure 6a which leads to the conclusion that there is a relationship between the RTT with the signal strength and the packet loss.

3.2. Signal Propagation Inside the Greenhouse

This section presents the results of how the greenhouse construction had effects on the UAV connection. In such complex ambient environments, it is expected that the packet loss rate is higher compared to open, obstacle-free environments. For this reason, both the packet loss and the double packet received were studied. The packet loss was 0.27%, while the Parrot Anafi was in idle state and only 0.13% when the propellers were activated during the measurements. The packet loss, however, occurred only on the highest layer, where the drone was closer to the roof. For the AR.Drone 2.0, no packet loss was observed in any of the cases. Finally, no duplicate packets were observed in any of the cases, indicating that the greenhouse construction has minimum impact on packet reception, which proved wrong the initial hypothesis.
In order to study the signal attenuation in the greenhouse, the path loss was calculated first using the empirical data and then using the FSPL model given by Equation (1) and Table 1, which is used as a reference for the evaluation of every scenario. In Table 2 and Table 3, there is a summary of the minimum, the maximum and their difference of the measured path loss values for each layer individually. A common pattern that was observed was that in all cases, the difference between the minimum and the maximum path loss for the first (0.5 m) and the third layer (2.5 m) is lower compared to the second layer (1.5 m). The reason for this deviation was probably a roof hanging sensor box which happen to be placed at 1.2 m above the ground, a height very close to the measurements affecting the line-of-sight propagation and causing significant signal decay at some locations.
In Table 4 and Table 5, the mean errors of the FSPL model are summarized. Since the FSPL model is an idealistic model, the error between the modeled and the real-world measurements were expected to be significant. By comparing the MAE and the RMSE for the two UAVs, it was found that the Parrot Anafi outperformed the AR.Drone 2.0 in every scenario since the incurred errors were smaller.
Another interesting observation was that the error between the actual measurements and the FSPL model is smaller when the UAVs were measured at 0.5 m, while the error increases as the height increases. In other words, the signal propagation in the theoretical model and the experimental values are similar when the UAVs are closer to the floor, especially for the Anafi, which, as we showed in the previous section, is in general more sensitive. The metallic surfaces from the roof construction in combination with the roof-mounted equipment are responsible for these shadowing phenomena, which have a greater impact as the distance between the UAV and the roof decreases. Figure 10 illustrates the Cumulative Distribution Functions (CDF) of the received signal strength, where the actual measurements were compared with the calculated FSPL model values, using Equation (2).
In addition, as can be seen in the previous results, the signal propagation is not affected significantly by the propellers. The results for both UAVs are very consistent for every scenario, while the error differences in all cases are very small. The results in Table 6 show that the RTT of the AR.Drone 2.0 was steady in all scenarios regardless of the height. For the Parrot Anafi, however, the RTT varied over height.
The MIMO antenna configuration consists of the following antenna chains: Front Left + Front Right, Back Left + Back Right, Front Left + Back Left, and Front Right + Back Right. On every transmission, the system uses only two chains simultaneously using Cyclic Delay Diversity (CDD) [33,36]. The Anafi’s antenna configuration and the CDD mechanism are responsible for higher RTTs, especially when the signal multipath complexity is increased due to ground and roof reflections. The RTT response for both UAVs is also illustrated in Figure 11 in separate CDFs.

3.3. Maximum Range in the Greenhouse

In order to estimate the maximum flight range inside the greenhouse, the Wi-Fi data rate was chosen as the main QoS parameter. According to the official Parrot Anafi’s specifications sheet, for the highest possible resolution, the UAV requires asteady data rate up to 100 Mbps [37] for video streaming without quality loss or frame drops. After the data analysis (Figure 12a), the maximum distance that the Parrot Anafi achieved at least 100 Mbps was 110 m in the greenhouse corridor and 70 m in the open field while the propellers were activated and 85 m and 90 m while the propellers deactivated in the same scenarios. The reflections on the greenhouse construction in combination with the MIMO antenna configuration seems to play a significant role on the above results since the Parrot Anafi was able to reach longer distance indoors compared to the open field. It is worth mentioning, though, that in Figure 12a, there is a severe drop at 20 m while the propellers were activated, which was treated as an outlier since it could be justified.
Another significant observation for the Parrot Anafi is that in all cases, the minimum RSS it required to achieve 100 Mbps data rate was at around −62 dBm in the greenhouse and approximately −66 dBm in the field (Figure 13a). RSS values below these thresholds yielded data rates below 100 Mbps. This indicates a strong relation between the data rate and the signal strength; however, the signal strength by itself cannot be considered as a reliable QoS parameter since it is strongly affected by RF propagation phenomena, causing significant fluctuation. This is the case with the RSS in the greenhouse, which is lower compared to the one in the open field, because the reflections and the shadowing phenomena cause interference, and consequently, the signal-to-noise ratio (SNR) is lower and thus a higher RSS is required to maintain the bitrate steady.
In addition, it was found that the Parrot Anafi had a very low packet loss rate, and no double packets were observed in any of the scenarios (Figure 14). Furthermore, the RTT inside the greenhouse (Figure 15a) was on average 8.8 ms with propellers off and 8.3 ms with propellers on, while in the field (Figure 15b) these numbers were 3.2 times higher for the former and 6.3 times higher for the latter case. Unexpectedly, the RTT was significantly higher in the open field compared to the greenhouse cases. Finally, although there were some high peaks on the RTT, no frame drops or synchronization issues were observed in any of the measurement points.
The Parrot AR.Drone 2.0, on the other hand, is capable of a video bitrate up to 4.0 Mbps [38] at the highest possible resolution, which is far less than the Anafi due to the lower camera characteristics. For this UAV, however, it is more challenging to determine the maximum flight distance by taking the data rate as the only QoS parameter, as we did with the Anafi. The reason is that, from the throughput measurements, it was found that the minimum data rate that this drone can just maintain a connection is 28.9 Mbps, as can be seen in Figure 12b. Below this threshold, the connection becomes unstable and a complete connection loss is likely to happen. This means that the requirement of 4.0 Mbps of available throughput is already satisfied, but the connection cannot be characterized as reliable.
In this case, to determine the maximum flight distance, empirical criteria were defined based on the video quality and reliability of the received data. During the measurements, in cases where more than 20% of the packets were lost or were received twice in the same measurement point, frame loss and video synchronization issues were observed. Furthermore, corrupted video data and frame freezing was observed when the RSS dropped below −70 dBm in the greenhouse and −72 dBm in the open field scenario.
The maximum distance for each scenario was determined by taking into account the above empirical observations. In the greenhouse compartment (Figure 16a), this distance reached up to 15 m with propellers deactivated and 30 m when the propellers were activated. For the open field scenario (Figure 16b), it reached up to 50 m, while the propellers were deactivated and 30 m with propellers turned on. Finally, the average measured RTT in the greenhouse was 21.9 ms with activated propellers and 24.4 ms while the drone was in an idle state, and for the open field, 28.1 ms while the propellers were turned on and 30.1 ms when they were deactivated (Figure 17).
Based on the results above, we also found that both UAVs in the indoor measurements achieved significantly better performance when the propellers were activated compared to deactivated propellers. However, on the outdoor measurements, the exact opposite effect was observed. This behavior was also observed in other studies such as [20], where higher throughput was measured indoors. The authors of [20] argue that this phenomena can be explained by the fact that there were fewer clients connected to the network during the measurements. However, this was not the case in our study (where no clients were present). Therefore, we believe that in order to investigate the real cause of this phenomenon, further research is required.

4. Discussion

During real operation, the UAVs were able to navigate freely in space, and this is a dynamic process that can affect the signal propagation. However, the greenhouse is a GPS-denied environment which means that there is significant error during flights, and keeping a constant position is challenging. We performed some test flights with the drones using only the onboard IMU and the compass, but the drift had even greater effect. In addition, it was not possible to take measurements on a fixed throttle without constraining the drones physically. Other options such as hanging the drones using strings were explored, but this was highly impractical. Therefore, we performed our measurements using fixing brackets carefully designed to have as minimal an impact as possible on the connection characteristics of each platform. Performing simulations on this particular environment was not an option either, since most parameters regarding the greenhouse contraction and materials used were unknown.
This study focused on the connection characteristics of two UAVs in the context of greenhouses and explored the limitations for precision agricultural applications using a non-destructive methodology. Unlikely custom drones designed for particular agricultural uses, off-the-self drones, are not equipped with an interface to allow user access certain system data without destructive reverse engineering of the system.
Further research on bigger greenhouse compartments could provide more conclusive results and validate our findings. Further research should also be conducted to study the effect of the plants on the UAVs’ connection characteristics. Temperature variation and high-humidity conditions may also be studied.
Finally, a path-planning algorithm based on the signal propagation footprint could be used to ensure that the UAVs avoid locations that are prone to connection disturbances. A few researchers have proposed tools to characterize the Wi-Fi signal propagation [14,15], but since these tools are designed for buildings such as offices where the structure and the building materials differ significantly from the greenhouse environment, these tools cannot be applied without modifications and scientific validation in the indoor agricultural sector; therefore, further research is required.

5. Conclusions

In this work, we explored the connection characteristics specifically for video-oriented applications of two commercially available off-the-shelf UAVs in the greenhouse environment. Extensive, real-world measurements were conducted, focusing on three main areas: the radiation pattern, the signal propagation inside the greenhouse compartments, and finally the maximum flying range that each drone can achieve without video quality losses in the greenhouse corridor.
From the radiation pattern results, it was found that both UAVs have anisotropic radiation patterns and thus that in RSS, crucial applications’ signal equalization may be required on the receiver side. Furthermore, in some specific orientations, the UAVs are more prone to signal drop and packet loss, and as a result the RTT might increase dramatically. The results also shows that the greenhouse compartment construction does not significantly affect the communication characteristics. However, measurements closer to the roof were more prone to connection issues. Although the Parrot Anafi in all cases had higher RTT than AR.Drone 2.0, it outperformed the AR.Drone 2.0, achieving higher signal strength and higher throughput in all cases.
The measurements in the greenhouse corridor prove that the Parrot Anafi is capable to fly to a distance up to 110 m without compromising any video quality, and the minimum RSS required to achieve this range was −62 dBm. The AR.Drone 2.0 was capable of reaching only a distance up to 30 m from the ground station, while the minimum RSS required was −70 dBm. The above numbers define the empirical boundaries of the specific UAVs and should be taken into account in cases where video crucial applications are employed in similar environments to ensure safe navigation. The effect of the propellers has an insignificant impact on the UAV connection characteristics in all tested scenarios. Finally, between the two UAV used in this study, we concluded that the Parrot Anafi outperforms the AR.Drone 2.0 in almost all cases; therefore, it can be considered a more suitable platform for operations inside greenhouses.

Author Contributions

Conceptualization, C.P. and J.V.; methodology, C.P.; software, C.P.; validation, C.P. and J.V.; formal analysis, C.P.; investigation, C.P.; resources, J.V.; data curation, C.P.; writing—original draft preparation, C.P.; writing—review and editing, C.P., J.V., and H.H.; visualization, C.P.; supervision, J.V.; project administration, J.V.; funding acquisition, J.V. All authors have read and agreed to the published version of the manuscript.

Funding

This research was funded by H2020 ROSIN project of European Union grant number 732287.

Data Availability Statement

Acknowledgments

The authors are grateful for the support of the Pavlos Condellis Fund.

Conflicts of Interest

The authors declare no conflict of interest.

Abbreviations

The following abbreviations are used in this manuscript:
CDDCyclic Delay Diversity
CDFCumulative Distribution Function
FSPLFree Space Path Loss
GPSGlobal Positioning System
IMUInertia Measurement Unit
MIMOMultiple Input Multiple Output
PCBPrinted Circuit Board
QoSQuality of Service
RFRadio Frequency
RSSReceived Signal Strength
RTTRound-Trip Time
SNRSignal-to-Noise Ratio
UAVUnmanned Aerial Vehicles
UWBUltra-Wide band
VSLAMVisual Simultaneous Localization and Mapping

References

  1. FAO. World Food and Agriculture—Statistical Yearbook 2020; Technical Report; FAO: Rome, Italy, 2020. [Google Scholar] [CrossRef]
  2. Hassler, S.C.; Baysal-Gurel, F. Unmanned aircraft system (UAS) technology and applications in agriculture. Agronomy 2019, 9, 618. [Google Scholar] [CrossRef] [Green Version]
  3. Attada, V.; Katta, S. A Methodology for Automatic Detection and Classification of Pests using Optimized SVM in Greenhouse Crops. Int. J. Eng. Adv. Technol. 2019, 8, 1485–1491. [Google Scholar] [CrossRef]
  4. Roldán, J.J.; Garcia-Aunon, P.; Garzón, M.; De León, J.; Del Cerro, J.; Barrientos, A. Heterogeneous Multi-Robot System for Mapping Environmental Variables of Greenhouses. Sensors 2016, 16, 1018. [Google Scholar] [CrossRef] [PubMed] [Green Version]
  5. Krul, S.; Pantos, C.; Frangulea, M.; Valente, J. Visual slam for indoor livestock and farming using a small drone with a monocular camera: A feasibility study. Drones 2021, 5, 41. [Google Scholar] [CrossRef]
  6. Abutalipov, R.N.; Bolgov, Y.V.; Senov, H.M. Flowering plants pollination robotic system for greenhouses by means of nano copter (drone aircraft). In Proceedings of the 2016 IEEE Conference on Quality Management, Transport and Information Security, Information Technologies (IT MQ IS), Nalchik, Russia, 4–11 October 2016; pp. 7–9. [Google Scholar] [CrossRef]
  7. Villegas, E.G.; López-Aguilera, E.; Vidal, R.; Paradells, J. Effect of adjacent-channel interference in IEEE 802.11 WLANs. In Proceedings of the 2007 2nd International Conference on Cognitive Radio Oriented Wireless Networks and Communications, Orlando, FL, USA, 1–3 August 2007. [Google Scholar] [CrossRef] [Green Version]
  8. Shi, G.; Li, K. Signal Interference in WiFi and ZigBee Networks; Springer: Cham, Switzerland, 2017. [Google Scholar] [CrossRef]
  9. Stone, W.C. Electromagnetic Signal Attenuation in Construction Materials; Technical Report; NIST: Gaithersburg, MD, USA, 1997. [CrossRef]
  10. Wilson, R. Propagation Losses through Common Building Materials 2.4 GHz vs. 5 GHz; Technical Report; Magis Network Inc., 2002; Available online: https://www.am1.us/wp-content/uploads/Documents/E10589_Propagation_Losses_2_and_5GHz.pdf (accessed on 30 November 2022).
  11. Sarkar, N.I.; Lo, E. Indoor propagation measurements for performance evaluation of IEEE 802.11g. In Proceedings of the 2008 Australasian Telecommunication Networks and Applications Conference, ATNAC 2008, Adelaide, SA, Australia, 7–10 December 2008; pp. 163–168. [Google Scholar] [CrossRef]
  12. Hwang, G.; Shin, K.; Park, S.; Kim, H. Measurement and comparison of wi-fi and super wi-fi indoor propagation characteristics in a multi-floored building. J. Commun. Netw. 2016, 18, 476–483. [Google Scholar] [CrossRef]
  13. Chrysikos, T.; Georgopoulos, G.; Kotsopoulos, S. Wireless channel characterization for a home indoor propagation topology at 2.4 GHz. In Proceedings of the 2011 Wireless Telecommunications Symposium (WTS), New York City, NY, USA, 13–15 April 2011. [Google Scholar] [CrossRef]
  14. Marjan, R.K.; Aldulaimi, M.H.; Al-Naseri, R.S.H. Design and evaluation of Wi-Fi Network Heat map generator. In Proceedings of the 2019 1st AL-Noor International Conference for Science and Technology (NICST), Sulimanyiah, Iraq, 25–29 October 2019; pp. 14–19. [Google Scholar] [CrossRef]
  15. Sangkusolwong, W.; Apavatirut, A. Indoor WIFI Signal Prediction Using Modelized Heatmap Generator Tool. In Proceedings of the 2017 21st International Computer Science and Engineering Conference (ICSEC), Bangkok, Thailand, 15–18 November 2017. [Google Scholar] [CrossRef]
  16. Cheng, C.M.; Hsiao, P.h.; Kung, H.T.; Vlah, D. Performance measurement of 802.11a wireless links from UAV to ground nodes with various antenna orientations. In Proceedings of the 15th International Conference on Computer Communications and Networks, Arlington, VA, USA, 9–11 October 2006; pp. 303–308. [Google Scholar] [CrossRef]
  17. Yanmaz, E.; Kuschnig, R.; Bettstetter, C. Channel measurements over 802.11a-based UAV-to-ground links. In Proceedings of the 2011 IEEE GLOBECOM Workshops (GC Wkshps), Houston, TX, USA, 5–9 December 2011; pp. 1280–1284. [Google Scholar] [CrossRef]
  18. Yanmaz, E.; Kuschnig, R.; Bettstetter, C. Achieving air-ground communications in 802.11 networks with three-dimensional aerial mobility. In Proceedings of the 2013 Proceedings IEEE INFOCOM, Turin, Italy, 14–19 April 2013; pp. 120–124. [Google Scholar] [CrossRef]
  19. Yanmaz, E.; Hayat, S.; Scherer, J.; Bettstetter, C. Experimental performance analysis of two-hop aerial 802.11 networks. In Proceedings of the 2014 IEEE Wireless Communications and Networking Conference (WCNC), Istanbul, Turkey, 6–9 April 2014; pp. 3118–3123. [Google Scholar] [CrossRef]
  20. Gu, Y.; Zhou, M.; Fu, S.; Wan, Y. Airborne WiFi networks through directional antennae: An experimental study. In Proceedings of the 2015 IEEE Wireless Communications and Networking Conference (WCNC), New Orleans, LA, USA, 9–12 March 2015. [Google Scholar] [CrossRef]
  21. Ali, W.; Khawaja, G.; Ozdemir, O.; Erden, F.; Guvenc, I. Ultra-Wideband Air-to-Ground Propagation Channel Characterization in an Open Area. arXiv 2019. [Google Scholar]
  22. Al-Hourani, A.; Kandeepan, S.; Jamalipour, A. Modeling air-to-ground path loss for low altitude platforms in urban environments. In Proceedings of the 2014 IEEE Global Communications Conference, Austin, TX, USA, 8–12 December 2014. [Google Scholar] [CrossRef]
  23. Shahen Shah, A.F.; Ilhan, H.; Tureli, U. Designing and Analysis of IEEE 802.11 MAC for UAVs Ad Hoc Networks. In Proceedings of the 2019 IEEE 10th Annual Ubiquitous Computing, Electronics & Mobile Communication Conference (UEMCON), New York City, NY, USA, 10–12 October 2019. [Google Scholar] [CrossRef]
  24. Khan, M.A.; Qureshi, I.M.; Khan, I.U.; Nasim, A.; Javed, U.; Khan, W. On the performance of flying ad hoc networks (FANETs) with directional antennas. In Proceedings of the 2018 5th International Multi-Topic ICT Conference (IMTIC), Jamshoro, Pakistan, 25–27 April 2018. [Google Scholar] [CrossRef]
  25. Bielsa, G.; Mezzavilla, M.; Widmer, J.; Rangan, S. Performance Assessment of Off-the-Shelf mmWave Radios for Drone Communications. In Proceedings of the 2019 IEEE 20th International Symposium on “A World of Wireless, Mobile and Multimedia Networks” (WoWMoM), Washington, DC, USA, 10–12 June 2019. [Google Scholar] [CrossRef]
  26. Pelechrinis, K.; Salonidis, T.; Lundgren, H.; Vaidya, N.H. Experimental characterization of 802.11n link quality at high rates. In Proceedings of the WiNTECH ’10: Proceedings of the fifth ACM International Workshop on Wireless Network Testbeds, Experimental Evaluation and Characterization; Association for Computing Machinery: New York, NY, USA, 2010; pp. 39–46. [Google Scholar] [CrossRef]
  27. Shrivastava, V.; Rayanchu, S.; Yoon, J.; Banerjee, S. 802.11n Under the microscope. In Proceedings of the IMC ’08: Proceedings of the 8th ACM SIGCOMM Conference on Internet Measurement; Association for Computing Machinery: New York, NY, USA, 2008; pp. 1–6. [Google Scholar] [CrossRef]
  28. Asadpour, M.; Giustiniano, D.; Hummel, K.A.; Heimlicher, S. Characterizing 802.11n aerial communication. In Proceedings of the ANC ’13: Proceedings of the Second ACM MobiHoc Workshop on Airborne Networks and Communications; Association for Computing Machinery: New York, NY, USA, 2013; pp. 7–11. [Google Scholar] [CrossRef]
  29. Bailey, W.H.; Harrington, T.; Hirata, A.; Kavet, R.R.; Keshvari, J.; Klauenberg, B.J.; Legros, A.; Maxson, D.P.; Osepchuk, J.M.; Reilly, J.P.; et al. Synopsis of IEEE Std C95.1™-2019 ’IEEE Standard for Safety Levels with Respect to Human Exposure to Electric, Magnetic, and Electromagnetic Fields, 0 Hz to 300 GHz’. IEEE Access 2019, 7, 171346–171356. [Google Scholar] [CrossRef]
  30. SASB/SCC39—SCC39—International Committee on Electromagnetic Safety. IEEE C95.3-2002 - IEEE Recommended Practice for Measurements and Computations of Radio Frequency Electromagnetic Fields With Respect to Human Exposure to Such Fields, 100 kHz–300 GHz; Technical Report; SASB/SCC39-SCC39-International Committee on Electromagnetic Safety. 2002. Available online: https://ieeexplore.ieee.org/document/1167131 (accessed on 30 November 2022). Technical Report.
  31. Goldsmith, A. Wireless Communications, 1st ed.; Cambridge University Press: Cambridge, UK, 2005; p. 674. [Google Scholar]
  32. Taketomi, T.; Uchiyama, H.; Ikeda, S. Visual SLAM algorithms: A survey from 2010 to 2016. IPSJ Trans. Comput. Vis. Appl. 2017, 9, 1–11. [Google Scholar] [CrossRef] [Green Version]
  33. Parrot Drones SAS. ANAFI—Certification Radio Test Report According to the Standard: CFR 47 FCC PART 15; Technical Report; Parrot Drones SAS: Montigny-le-Bretonneux, France, 2018. [Google Scholar]
  34. Parrot Drones SAS. AR DRONE 2.0—Certification Radio Test Report according to the Standard: FCC Part 15; Technical Report; Parrot Drones SAS: Beaucouze, France, 2011. [Google Scholar]
  35. ASUSTeK Computer Inc. Intel 8265NGW—FCC SAR Test Report; Technical Report; ASUSTeK Computer Inc.: Taipei, Taiwan, 2017. [Google Scholar]
  36. Plass, S.; Dammann, A.; Sand, S.; Plass, E.S.; Dammann, A.; De, S.S.D.L.R.; Principle, A. An Overview of Cyclic Delay Diversity and its Applications. In Proceedings of the 2008 IEEE 68th Vehicular Technology Conference, Calgary, AB, Canada, 21–24 September 2008; Number 3. pp. 1–5. [Google Scholar] [CrossRef]
  37. Parrot Drones SAS. Anafi White Paper. 2020. Available online: https://www.parrot.com/assets/s3fs-public/2020-07/white-paper_anafi-v1.4-en.pdf (accessed on 30 November 2022).
  38. Parrot Drones SAS. Parrot AR.Drone 2.0 Developer Guide. 2012. Available online: https://jpchanson.github.io/ARdrone/ParrotDevGuide.pdf (accessed on 30 November 2022).
Figure 1. Experimental radiation pattern configuration.
Drones 07 00024 g001
Figure 2. Outdoor experimental setup.
Drones 07 00024 g002
Figure 3. Inside the greenhouse compartment.
Drones 07 00024 g003
Figure 4. Greenhouse compartment layout.
Drones 07 00024 g004
Figure 5. Maximum-range experiment in two environments. (a) Open field. (b) Greenhouse corridor.
Drones 07 00024 g005
Figure 6. Parrot Anafi versus Parrot AR.Drone 2.0, radiation patterns. (a) Yaw axis. (b) Pitch axis. (c) Roll axis.
Drones 07 00024 g006
Figure 7. Location of the antennas on two UAVs. (a) Parrot Anafi (top view). (b) Parrot AR.Drone 2.0 (bottom view).
Drones 07 00024 g007
Figure 8. Parrot Anafi versus Parrot AR.Drone 2.0, interpolated throughput on different orientations. (a) Yaw axis. (b) Pitch axis. (c) Roll axis.
Drones 07 00024 g008
Figure 9. Parrot Anafi versus Parrot AR.Drone 2.0, Round-trip time on different orientations. (a) Yaw axis. (b) Pitch axis. (c) Roll axis.
Drones 07 00024 g009
Figure 10. Empirical versus theoretical CDFs for the received signal strength. The theoretical values for the first layer (0.5 m) and the second layer (1.5 m) are similar, since the distances between the drones and the PC were the same. (a) Parrot Anafi. (b) Parrot AR.Drone 2.0.
Drones 07 00024 g010
Figure 11. Empirical Round-trip time CDFs for every scenario. (a) Parrot Anafi. (b) AR.Drone 2.0.
Drones 07 00024 g011
Figure 12. Throughput over distance in the greenhouse and in the open field. The vertical dashed lines indicate the maximum distance for each scenario. (a) Parrot Anafi. (b) Parrot AR.Drone 2.0.
Drones 07 00024 g012
Figure 13. Received signal strength over distance in four different scenarios. The vertical dashed lines indicate the maximum distance. (a) Parrot Anafi. (b) Parrot AR.Drone 2.0.
Drones 07 00024 g013
Figure 14. Packet loss and number of double-received packets for the Parrot Anafi. The vertical dashed lines indicate the maximum distance. (a) Greenhouse corridor. (b) Open field.
Drones 07 00024 g014
Figure 15. Round-trip time over distance for the Parrot Anafi. The vertical dashed lines indicate the maximum distance. (a) Greenhouse corridor. (b) Open field.
Drones 07 00024 g015
Figure 16. Packet loss and number of double received packets for Parrot AR.Drone 2.0. The vertical dashed lines indicate the maximum distance. (a) Greenhouse corridor. (b) Open field.
Drones 07 00024 g016
Figure 17. Round-trip time over distance for Parrot AR.Drone 2.0. The vertical dashed lines indicate the maximum distance. (a) Greenhouse corridor. (b) Open field.
Drones 07 00024 g017
Table 1. Free Space Path Loss model notation.
VariableValueUnitMeaning
P t 0.1WattPower transmitted
P r (Variable)WattPower received
G t 1.2531 *-Antenna gain (Parrot Anafi)
G t 0.8710 *-Antenna gain (AR.Drone 2.0)
G r 1.2560 *-Antenna gain (PC)
λ 0.12429206MetersWavelength (2412 Mhz)
d(Variable)MetersDistance between transmitter and receiver
* Data retrieved from the official FCC certification authority [33,34,35].
Table 2. Parrot Anafi—Empirical path loss in the greenhouse compartment.
Propellers OFFPropellers ON
Height (m):0.51.52.50.51.52.5
Min (dB):534860555159
Max (dB):697576727374
Difference (dB):162716172215
Table 3. AR.Drone 2.0—Empirical path loss in the greenhouse compartment.
Propellers OFFPropellers ON
Height (m):0.51.52.50.51.52.5
Min (dB):625462625563
Max (dB):818079788085
Difference (dB):192614162522
Table 4. Parrot Anafi—Mean FSPL model errors.
Propellers OFFPropellers ON
Height (m):0.51.52.50.51.52.5
MAE (dB):8.4410.7212.169.9211.0811.60
RMSE (dB):9.0611.0612.7410.6511.7912.02
Table 5. AR.Drone 2.0—Mean FSPL model errors.
Propellers OFFPropellers ON
Height (m):0.51.52.50.51.52.5
MAE (dB):16.3416.3816.5816.3016.5016.94
RMSE (dB):16.7816.7716.9316.7016.8217.49
Table 6. Average round-trip time in the greenhouse compartment.
Propellers OFFPropellers ON
Height (m):0.51.52.50.51.52.5
Parrot Anafi (ms):14.238.5520.0513.228.6228.46
AR.Drone2.0 (ms):1.431.441.441.441.481.47
Disclaimer/Publisher’s Note: The statements, opinions and data contained in all publications are solely those of the individual author(s) and contributor(s) and not of MDPI and/or the editor(s). MDPI and/or the editor(s) disclaim responsibility for any injury to people or property resulting from any ideas, methods, instructions or products referred to in the content.

