1. Introduction
Sugarcane (
Saccharum officinarum) is a tropical plant, and it is the most important sugar extracting crop in Sri Lanka [
1,
2]. Sugarcane white leaf disease (WLD) is one of the most economically important diseases in Sri Lanka’s sugarcane industry [
3], and WLD severely progresses in ratoon sugarcane, which ultimately affects yield [
4]. WLD is caused by a phytoplasma, an obligate plant parasite that attacks plant phloem tissue. It is transmitted through leafhopper insect vectors [
3,
4,
5]. Cream-white stripes are developed parallel to the midrib of sugarcane leaves, eventually covering the entire leaf in the infected crops. Other symptoms of WLD include stunted stalks, the absence of lateral shoots on the upper portion of infected stalks, and eventual plant death. Currently, there are no sugarcane varieties found to be resistant to WLD in Sri Lanka [
4]. As a preventive approach, growers still follow traditional scouting methods all over the field, monitoring disease symptoms with human eyes and burning infected crops on the spot. However, this method requires a significant amount of time to watch the entire field to identify infected areas in large field sugarcane plantations. Thus, precision agriculture technologies aided with modern computational machine learning approaches may provide an effective way of detecting sugarcane WLD on-field, an alternative to human-based methods.
Precision agriculture is a smart farming method that uses current technologies to examine and manage changes within an agricultural field to maximize cost-effectiveness, sustainability, and environmental protection [
6,
7,
8]. Precision agriculture is crucial to seeking low-input, high-efficiency, and sustainable methods in agricultural industries [
9]. Recent improvements in the application of UAV-based remote sensing in crop production have proved crucial in improving crop productivity [
10]. Remote sensing for precision agriculture is based on the indirect detection of soil and crop reflected radiation in an agricultural field [
11]. This approach is well suited for monitoring plant stress and disease since it provides multitemporal and multispectral data. UAVs are increasingly used for agriculture to collect high-resolution images and videos for post-processing. Artificial intelligent (AI) approaches are used to process these UAV images for planning, navigation, and georeferencing, as well as for a variety of agricultural applications [
12]. UAVs and advanced computational ML techniques are increasingly used to forecast and improve yield in various farming industries, including sugarcane [
10].
León-Rueda et al. [
13] examined the use of multispectral cameras mounted on UAVs to classify commercial potato vascular wilt using supervised random forest classification. Su et al. [
14] investigated the yellow rust disease in winter wheat using a multispectral camera by selecting spectral bands and SVI with a high discriminating capability. Albetis et al. [
15] assessed the possibility of distinguishing Flavescence dorée symptoms using UAV multispectral imaging. Gomez Selvaraj et al. [
16] examined the potential of aerial imagery and machine learning approaches for disease identification in bananas by classifying and localizing bananas in mixed-complex African environments using pixel-based classifications and machine learning models. Lan et al. [
17] assessed the feasibility of large-area identification of citrus Huanglongbing using remote sensing and committed to improving the accuracy of detection using numerous ML techniques, including support vector machine (SVM), K-nearest neighbor (KNN), and logistic regression (LR).
Table 1 represents the application of UAVs for disease management in precision agriculture, and
Table 2 shows the use of UAVs for pest and disease control in the sugarcane sector.
ML algorithms have been used to monitor the crop status in many remote sensing applications in agriculture [
30,
31,
32,
33]. ML methods attempt to establish a relationship between crop parameters to forecast crop production [
34]. Artificial neural networks (ANN), random forests (RF), SVM, and decision trees (DT) are relevant algorithms in remote sensing applications [
35].
Saini and Ghosh [
36] utilized XGBoost (XGB), stochastic gradient boosting (SGB), RF, and SVM for rice mapping crops in India to evaluate the efficacy of ensemble methods. Huang et al. [
37] used VIs generated from canopy level hyperspectral scans to examine the utility of the RF technique in combination with the XGB approach for detecting wheat stripe rust early and mid-term. Compared to typical machine learning approaches, the XGB, as a unique ML methodology, can reduce model overfitting and computing effort [
37]. Tageldin et al. [
38] used the XGB method to predict the occurrence of cotton leaf miner infestation with an accuracy of 84 percent, which was greater than the findings obtained using algorithms, such as RF and logistic regression. The RF non-parametric classifier is an ensemble-based machine learning technique that combines the predictions of many decision tree classifiers using a voting strategy [
39]. Santoso et al. [
40] assessed the RF model’s potential for predicting BSR disease in oil palm fields and produced BSR disease distribution maps. With the cascade parallel random forest (CPRF) algorithm and a 20-year examination of pertinent data, Zhang [
41] identified the pattern of rice diseases. Samajpati and Degadwala [
42] experimented with identifying apple scab, apple rot, and apple blotch utilizing the RF algorithm. Some of the researchers suggested a model that employs a decision tree to identify and categorize leaf disease and boosts its detection accuracy while reducing detection time compared to the current system using DT models [
43,
44,
45]. K-nearest neighbor (KNN) is a prevalent machine learning algorithm that performs well in supervised learning scenarios and simple recognition issues [
46]. Vaishnnave et al. [
47] developed the ML model by KNN algorithm to detect the groundnut leaf disease, and Krithika and Grace [
48] used a KNN classifier to identify the grape leaf diseases. Kapil et al. [
49] developed a system for recognizing cotton leaf disease by the KNN algorithm.
Vegetation indices are numerical metrics used in remote sensing applications to assess the differentiation of vegetation cover, vigor, and growth dynamics. A sum, difference, ratio, or other linear combination of reflectance factor or radiance measurements from two or more wavelength intervals normally constitutes the vegetation index. It is utilized to increase the reliability of regional and temporal comparisons of terrestrial photosynthetic activity and canopy structure variation by enhancing the contribution of vegetation features [
50]. A VI’s ability to detect WLD-infected sugarcane via image processing from a multispectral camera placed on a UAV was examined by Sanseechan et al. [
5]. Moriya et al. [
29] developed a method for accurately identifying and mapping mosaic virus in sugarcane using aerial surveys conducted with a UAV equipped with a hyperspectral camera. A few research studies have been undertaken using ML techniques over UAV multispectral images to identify the other sugarcane diseases, and no research studies have been undertaken related to detection of WLD using ML models and high-resolution UAV imagery in sugarcane crops. Therefore, this study proposes developing a method for identifying sugarcane WLD by combining UAV technology with high-resolution multispectral cameras and multiple machine learning classification algorithms. There were two sub-goals: (1) to correlate the VIs with the fluctuation in severity level of WLD in the sugarcane field; and (2) to evaluate the detection performance in WLD severity levels using various ML approaches.
UAV-based remote sensing can assist farmers in analyzing crop health and management in precision agriculture. Early detection of WLD in Sri Lankan sugarcane fields will be used to implement effective management measures throughout the crop’s early phases. This method will aid in disease management in sugarcane farms by eliminating the requirement for conventional methods [
51]. Ultimately, it will help farmers and the cane industry in Sri Lanka recover economically. However, the commercial application of UAVs and artificial intelligence algorithms in sugarcane sectors has been limited due to various variables, including technology, UAV legislation, and cost [
51].
2. Methodology
2.1. Process Pipeline
As depicted in
Figure 1, a process pipeline with four key components was developed: acquisition, preprocessing, training, and prediction. Images are downloaded, orthorectified, mosaicked, and preprocessed to extract samples with crucial features and then we labelled them. The data were then supplied to supervised machine learning classifiers, trained, and optimized for detection. The complete orthorectified data were then analyzed to determine where WLD crops would grow in the field. Images were collected, orthorectified, and preprocessed to extract samples with essential characteristics and then we labelled them. The data were subsequently sent to supervised machine learning classifiers that had been trained and optimized for detection.
2.2. Study Site
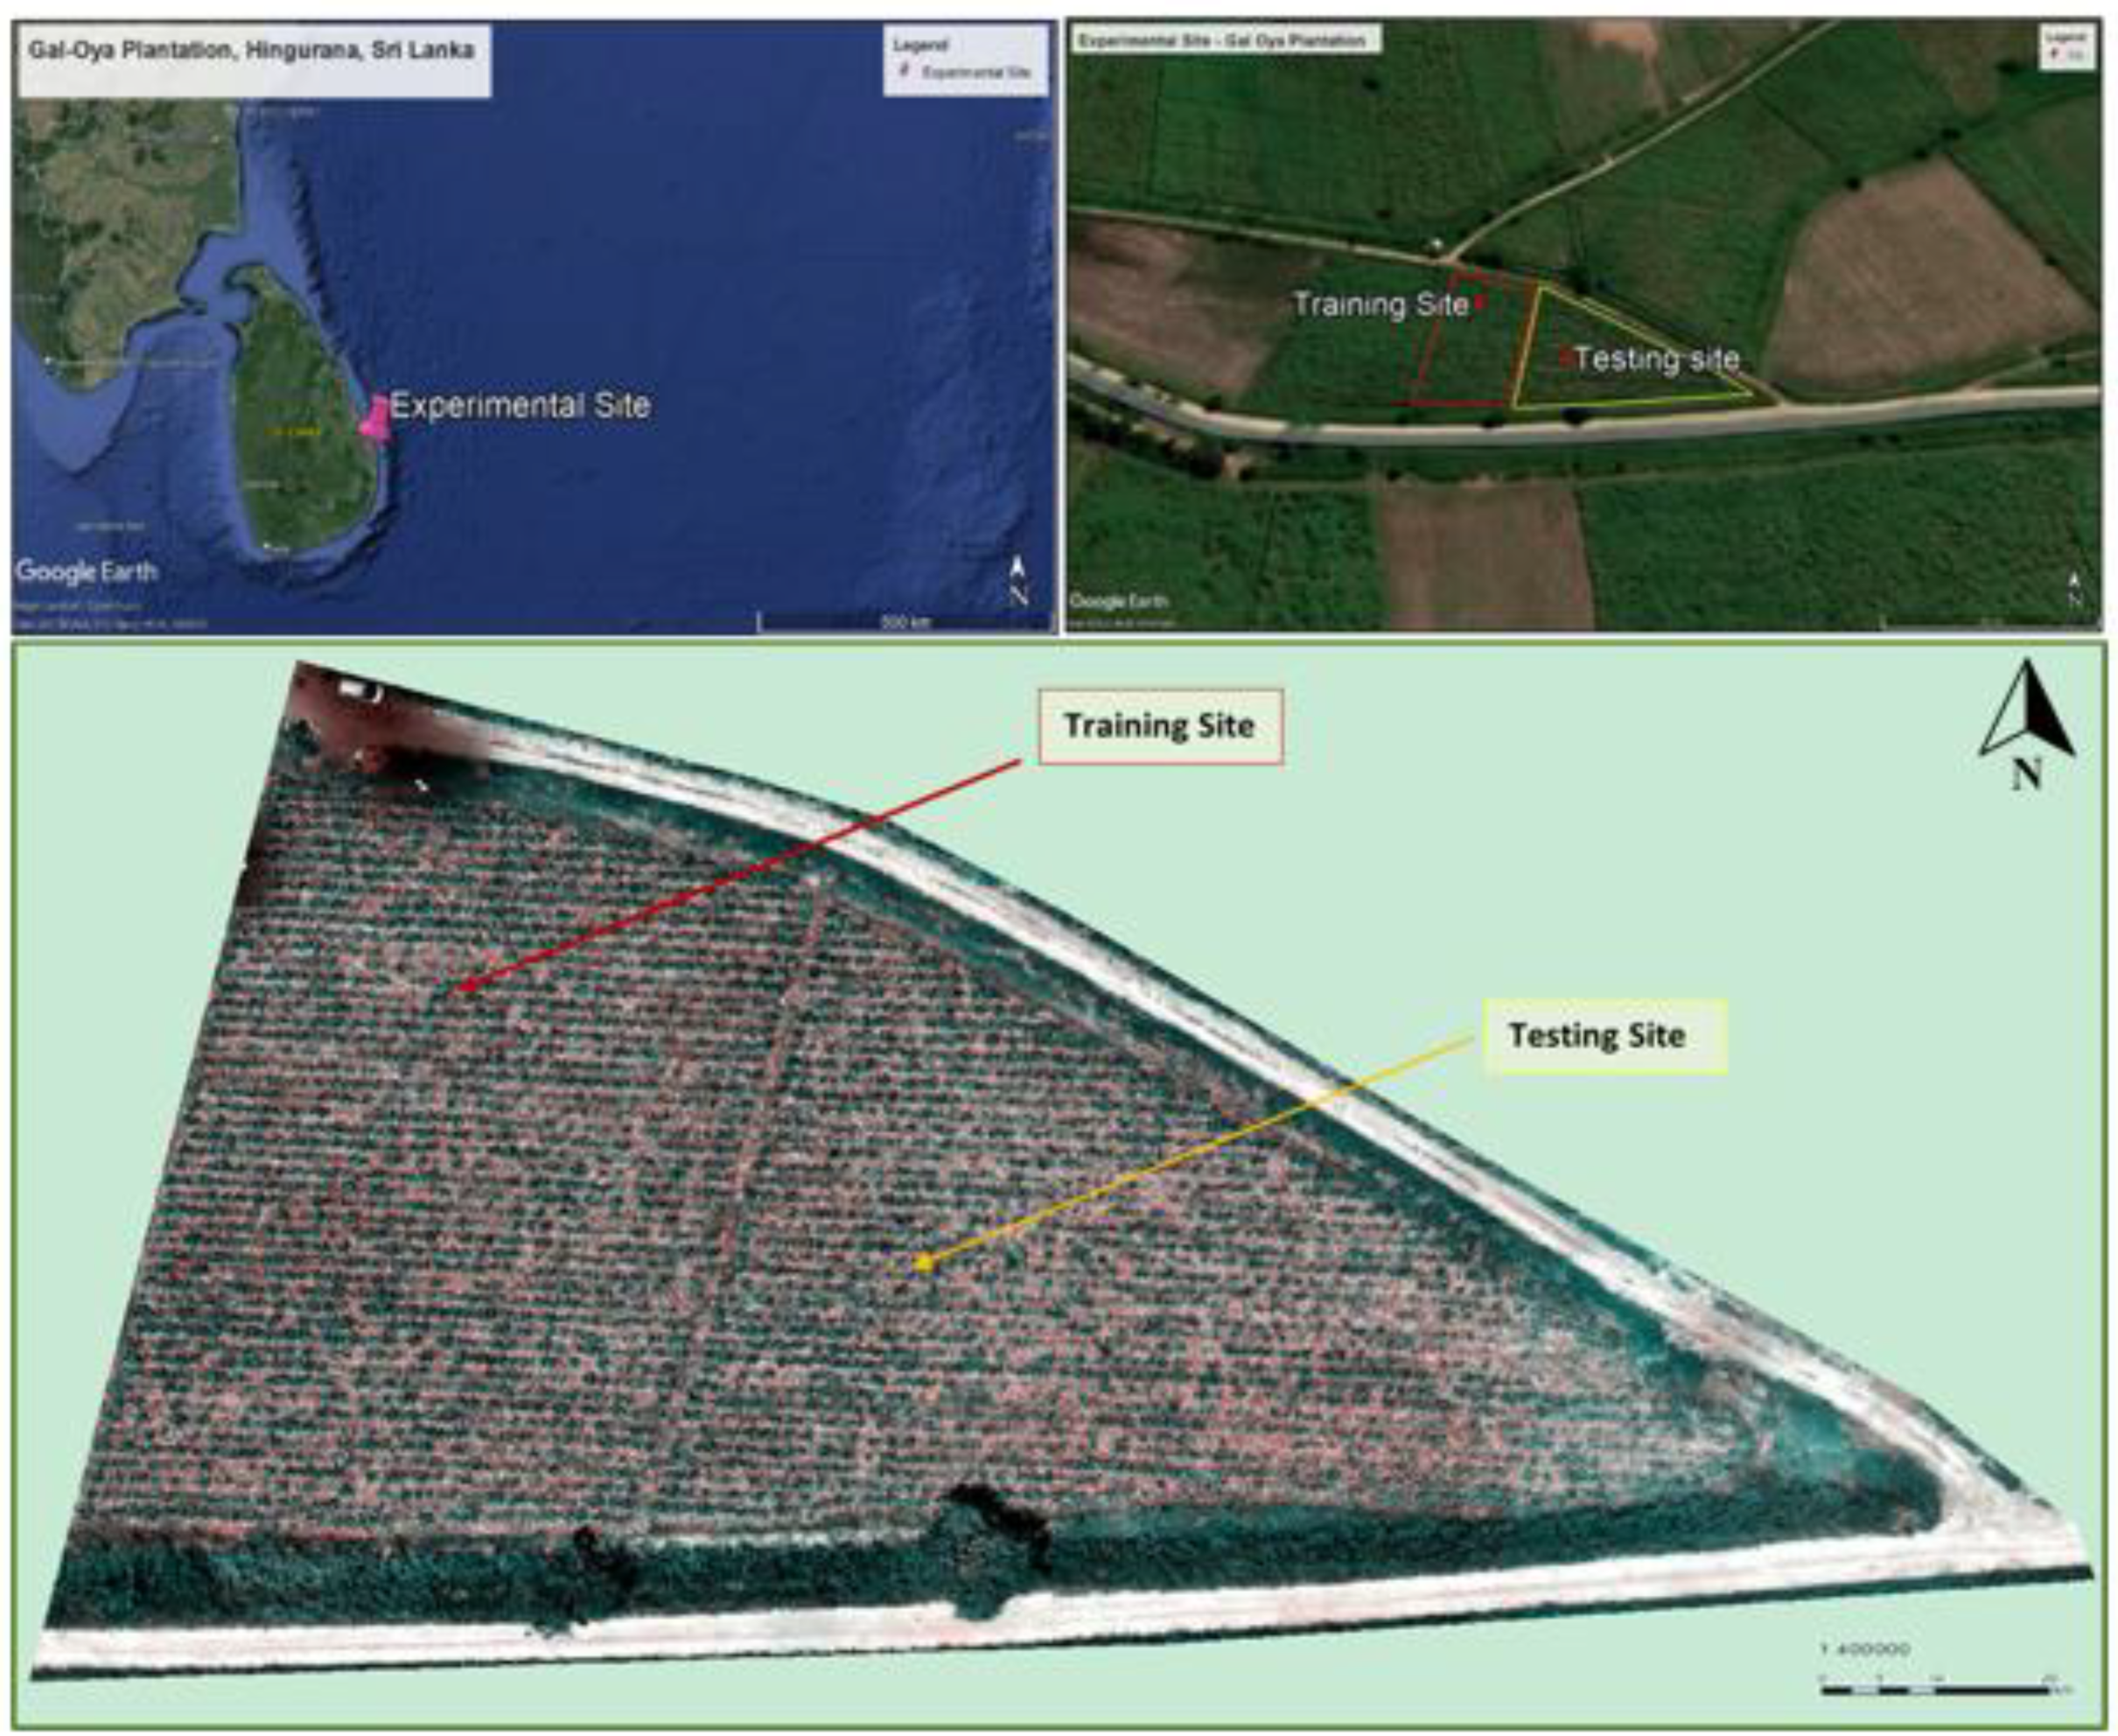
The study was conducted in a 1.24-hectare sugarcane field in Gal-Oya Plantation, Hingurana, Sri Lanka (7° 16′42.94″ N, 81° 42′25.53″ E) during the sugarcane growing season of October 2021 (
Figure 2). For this experiment, two-month-old sugarcane plants with an average height of 1.2 m were chosen.
Disease plants were randomly sampled throughout the field for the levels of disease severities followed by the natural disease occurrence pattern in the field. Field agronomists confirmed the following during this experiment: (1) Ridges and furrows irrigation method was used in the field, and there was no water stress to the plants; (2) the entire experimental site had a uniform soil type (sandy to clay loam soils); (3) fertilizers were applied in the recommended level to the entire experimental field, and there was no fertilizer stress to the plants; and (4) WLD disease was transmitted by insect vector and was not associated with soil or water, and this symptom was developed only by WLD. Due to the above four reasons, it was not necessary to design the experiment for block design in this site.
2.3. Ground Truth Data Collection
Experts visually inspected and labelled diseased and healthy plants as ground truth before image acquisition to train and test the classifier [
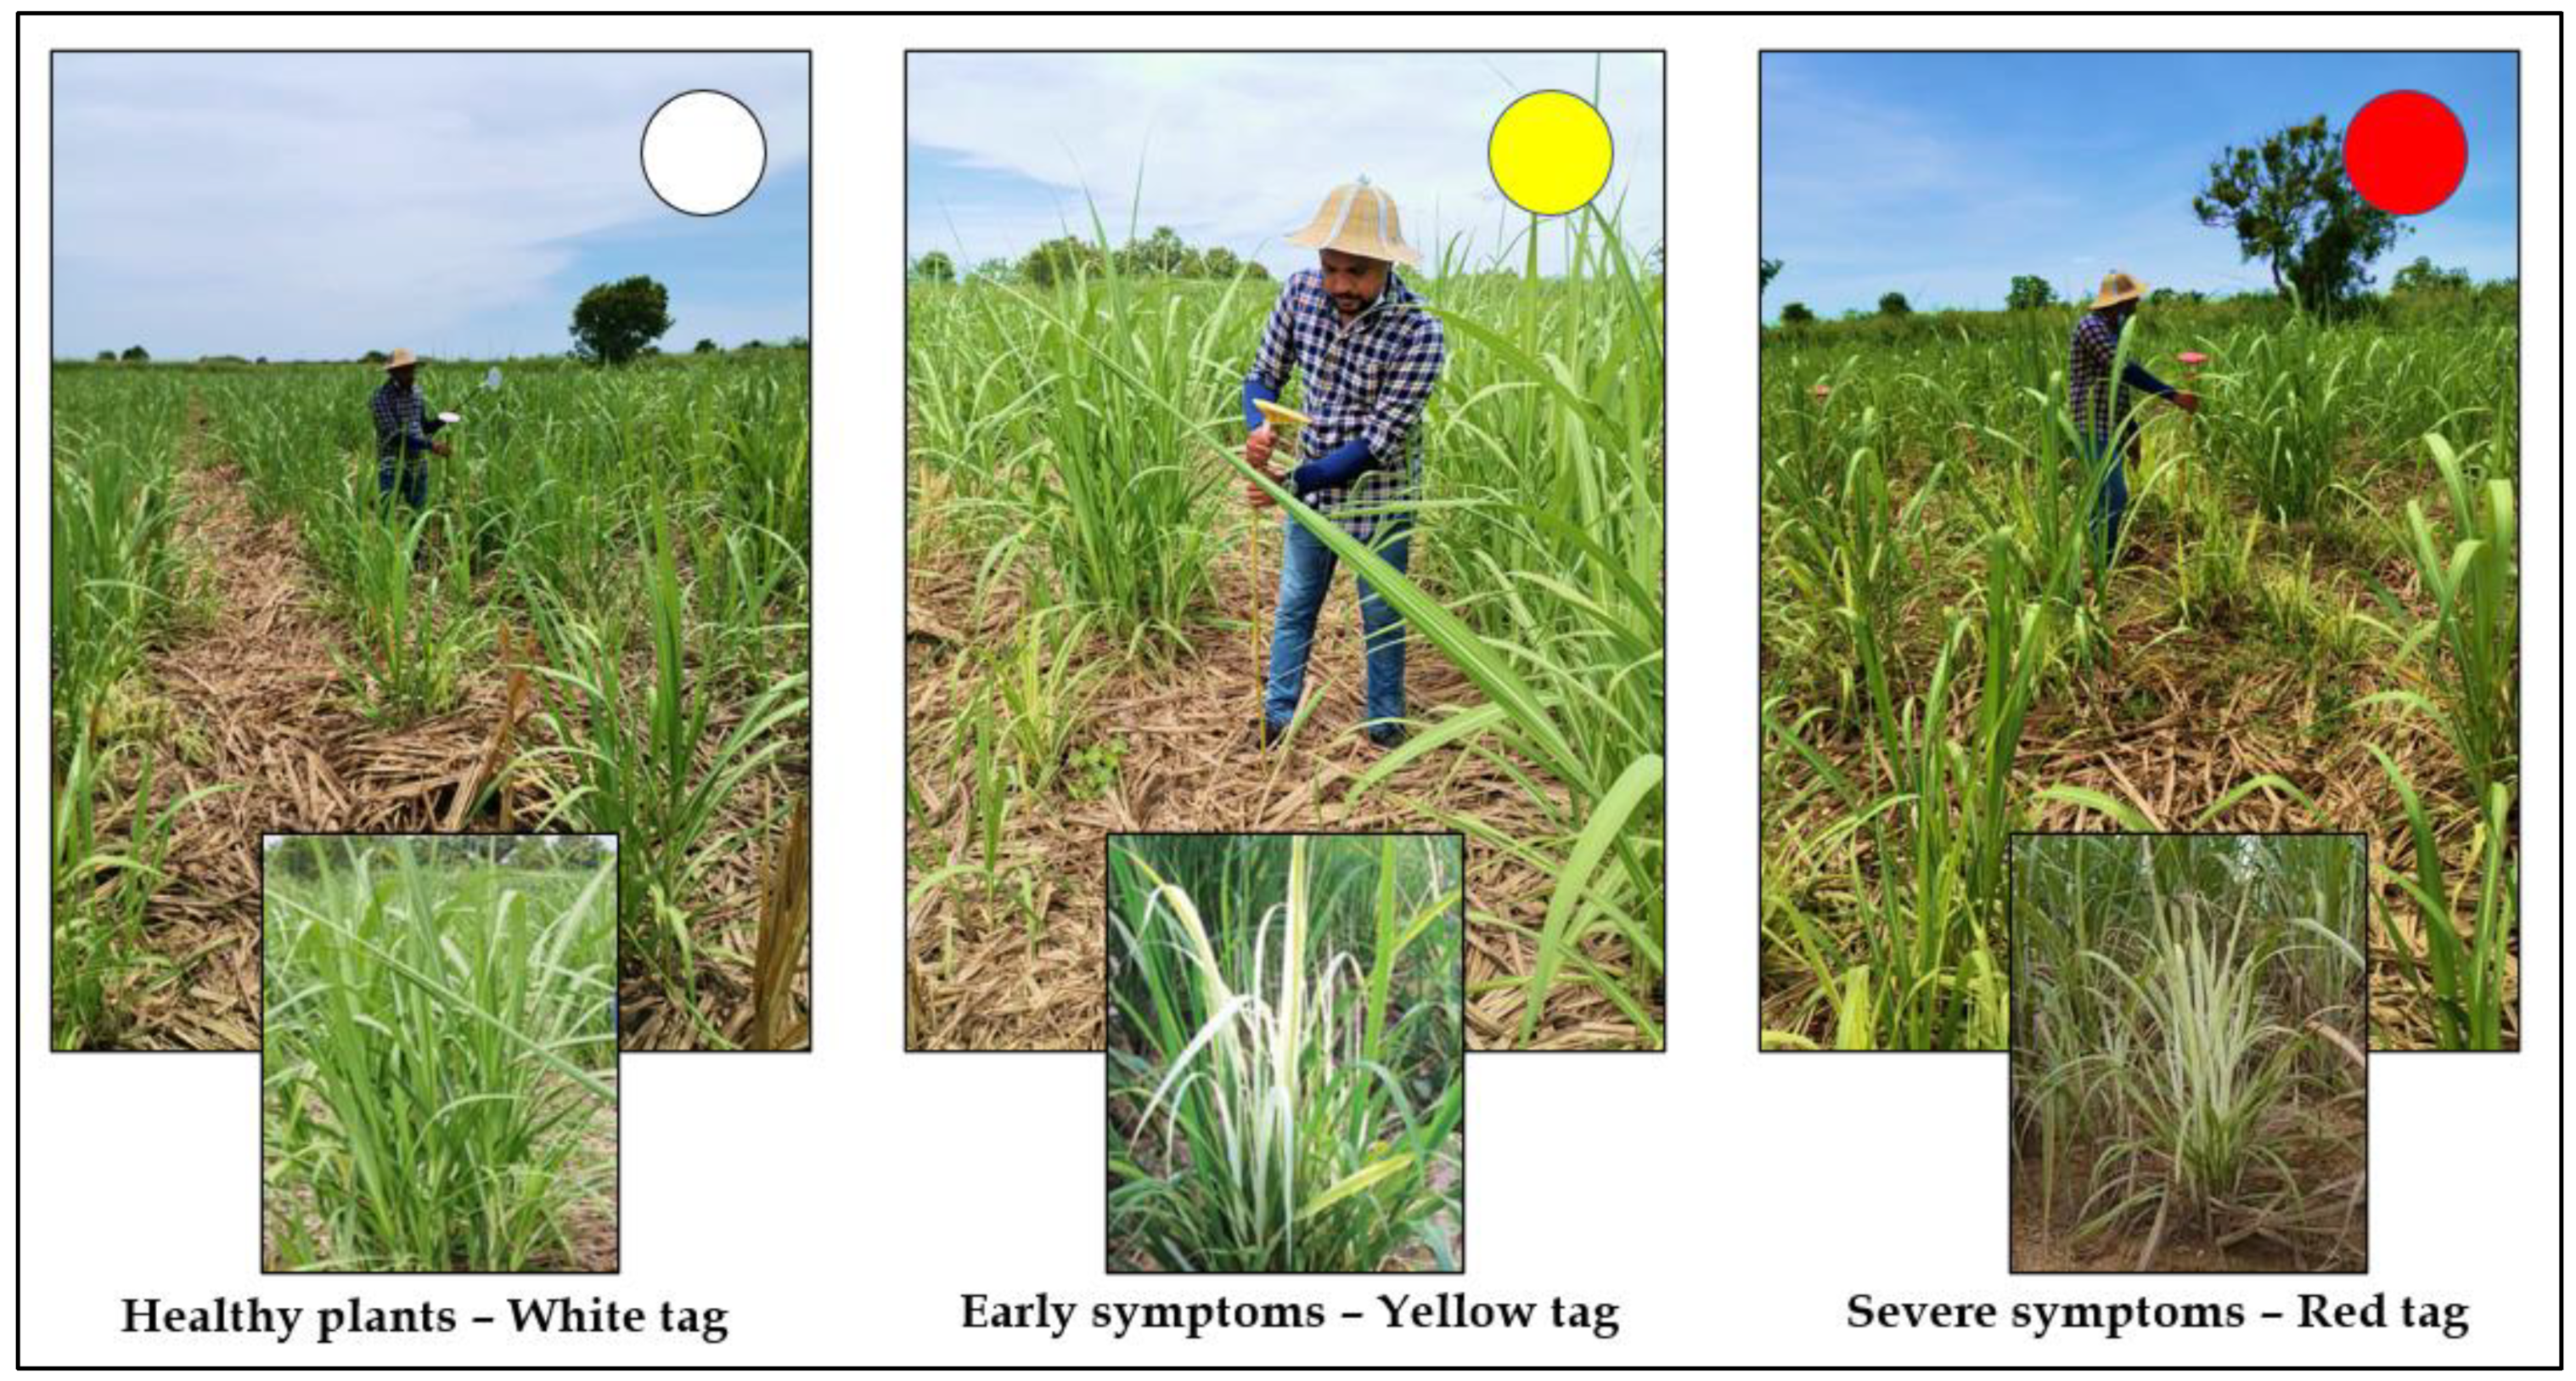
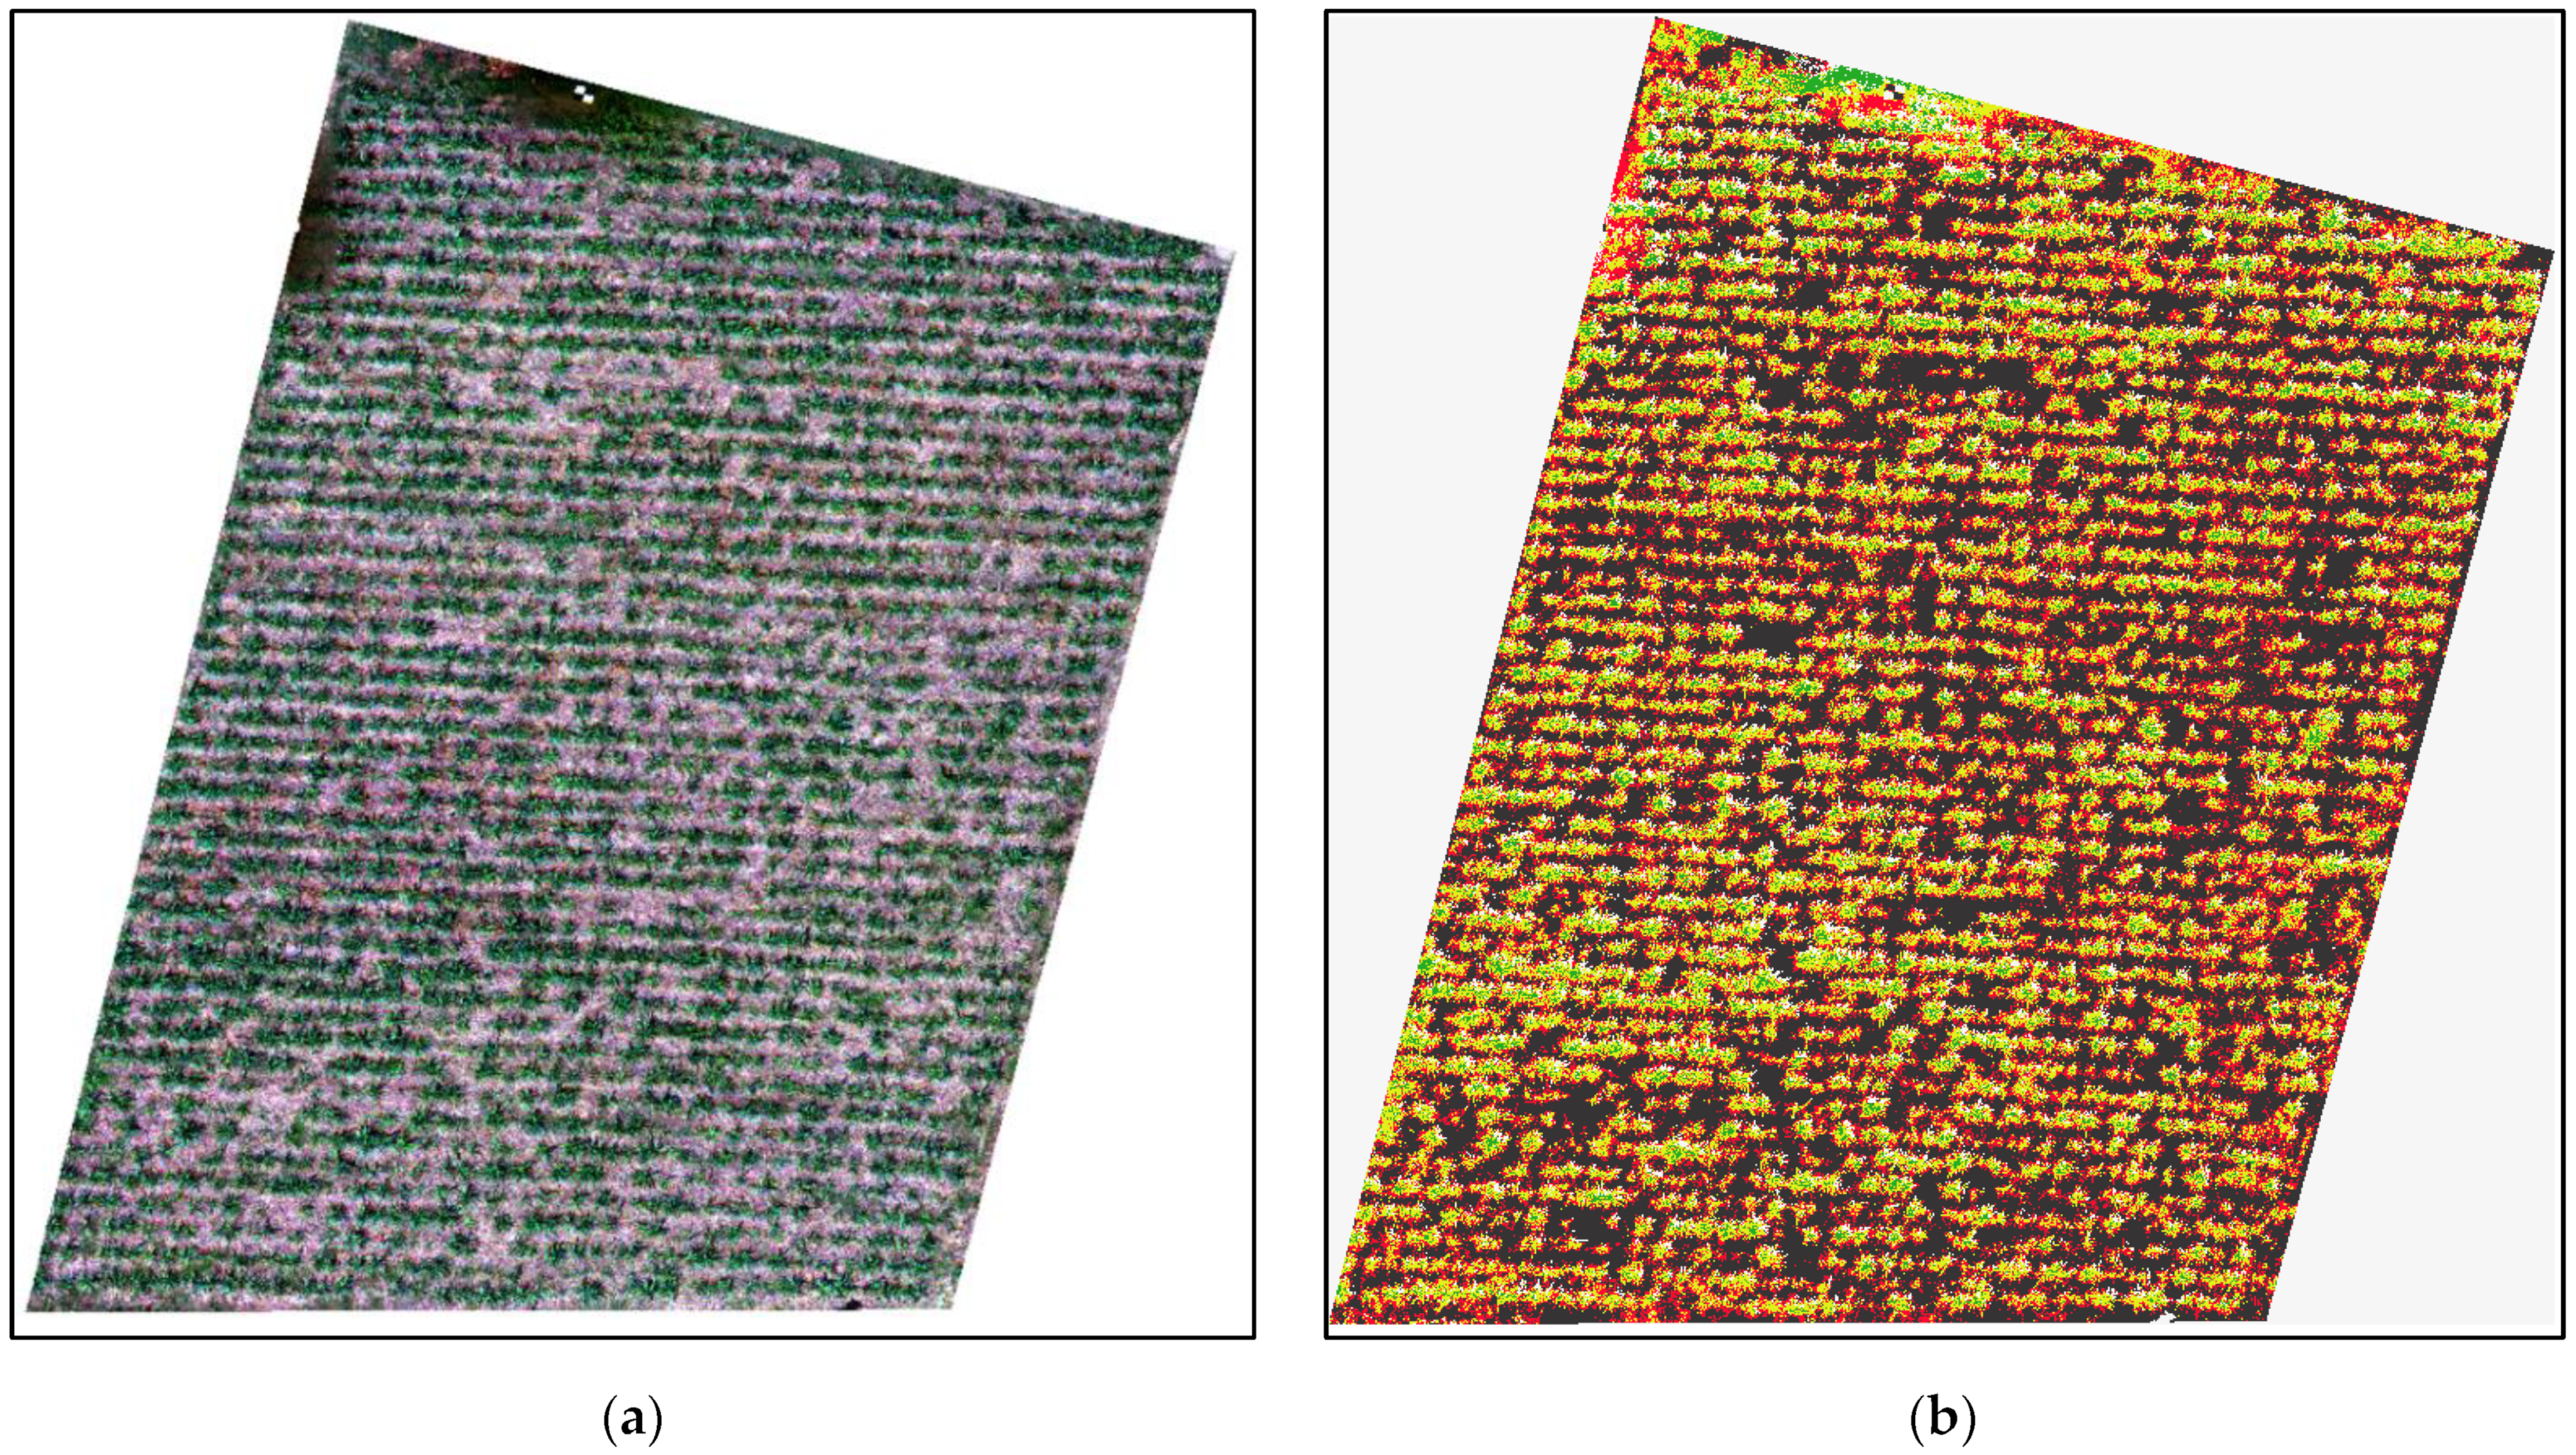
39]. The sugarcane plants (a total of 150 plants) were classified into three types, healthy plants (50 plants), early symptoms plants (50 plants), and severe symptoms plants (50 plants) by using different color tags such as white tag, yellow tag, and red tag, respectively, that were installed in the training site manually as shown in
Figure 3. A total of 90 plants were classified into three types, healthy plants (30 plants), early symptoms plants (30 plants), and severe symptoms plants (30 plants), by using color tags in the testing site for validation. Early symptom plants were characterized by the youngest leaves appearing white with older leaves remaining green. Pure white leaves classify the severe plant symptoms in most leaves with stunted growth [
52].
2.4. UAV Platform
DJI P4 multispectral UAV was used to conduct the experiment in the sugarcane field. DJI P4 Multispectral is a fully integrated UAV platform, and it can complete the data collection task independently without the help of other aircraft. It has a take-off weight of 1487 g, and the average flight time is 27 min. The P4 Multispectral imaging system contains six cameras with 1/2.9-inch CMOS sensors, including an RGB camera that produces images in the JPEG format and a multispectral camera array containing five cameras (
Figure 4b) that produce multispectral images in the TIFF format. It uses a global shutter to ensure performance. The five cameras in the multispectral camera array can capture photos in the following imaging bands: Blue (B): 450 nm ± 16 nm; green (G): 560 nm ± 16 nm; red (R): 650 nm ± 16 nm; red edge (RE): 730 nm ± 16 nm; and near-infrared (NIR): 840 nm ± 26 nm [
53] without zoomable.
Table 3 shows the information on central wavelength and wavelength width for DJI P4 multispectral camera [
53].
Table 4 shows the camera specifications of the DJI P4 Multispectral. The remote controller features, as shown in the
Figure 4a, of DJI’s long-range transmission technology can control the aircraft and the gimbal cameras at a maximum transmission range of 4.3 mi (7 km). It is possible to connect an iPad to the remote controller via the USB port to use the DJI GS Pro app to plan and perform missions. It can also be used to export the captured images for analysis and create multispectral maps [
53].
The RTK module is integrated directly into the Phantom 4 RTK, providing real-time, centimeter-level positioning data for improved absolute accuracy on image metadata. The GSD for the P4 multispectral is (H/18.9) cm/pixel. Height can be calculated based on the accuracy needed for flight mission.
2.5. Collection of Multispectral UAV Images
A UAV flying operation was undertaken during the growing season utilizing a DJI P4 multispectral system on a sunny day between 11:00 a.m. and 12:00 p.m. The visible-to-near-infrared spectral range of the DJI P4 multispectral camera comprises five bands with wavelengths of 450.0 nm, 560.0 nm, 650.0 nm, 730.0 nm, and 840.0 nm, respectively (blue, green, red, red edge, and near-infrared). The flying altitude was 20 m and maintained by a barometer present in the UAV. DJI P4 multispectral UAV uses barometer to maintain the altitude. It uses mean barometer to measure air pressure and establish and maintain a stable altitude during flying. Barometer can rapidly measure changes in atmospheric pressure to help ensure the UAV is flying at the appropriate elevation. Additionally, the experiment site is in the level surface. Therefore, it was easy to maintain the height in the same altitude. The size of pixels in terms of real-world dimensions for this experiment was 1.1 cm/pixel.
The UAV was flown at different heights, 10 m, 15 m, 20 m, and 25 m, before conducting the flight mission to select the suitable height needed for labelling the WLD over the multispectral orthomosaic image. The flight campaign at 15 m was selected as captured data, which provided the best outcomes in terms of WLD detection, UAV endurance, and battery capacity. The speed of the UAV and front and side overlap of images were 1.4 m per second and 75% and 65%, respectively. The experiment was conducted between 11:00 a.m. and 12:00 p.m. because plant leaves are erect and at maximum transpiration time (active time for plants) at the time of image capture. Early morning and late afternoon or evening are not suitable for conducting this experiment due to dew on the plants in the early morning and dropping of leaves in the late afternoon or evening. Additionally, this will have not an effect on the VIs values. Therefore, the time of image capture is very important for developing the accurate WLD detection models.
2.6. Software and Python Libraries
This research was conducted using several software tools and python libraries. Agisoft Metashape (Version 1.6.6; Agisoft LLC, Petersburg, Russia) was used to process, filter, and orthorectify 5600 raw photos for multispectral image analysis. A set of images from cropped regions was extracted and then labelled using QGIS (Version 3.2.0; Open-Source Geospatial Foundation, Chicago, IL, USA). Visual Studio Code (VS Code) 1.70.0 was used as source-code editor to develop the different ML algorithms using the Python 3.8.10 programming language. Several libraries were used for data manipulation and machine learning, including Geospatial Data Abstraction Library (GDAL) 3.0.2, eXtreme Gradient Boosting (XGBoost) 1.5.0, Scikit-learn 0.24.2, OpenCV 4.6.0.66, and Matplotlib 3.4.3.
2.7. Data Labelling
A mask for each image was generated by assigning integer values for every highlighted pixel to perform image labelling. The integer values were set as follows: 1 = ground cover; 2 = shadow; 3 = healthy; 4 = early symptoms; and 5 = severe WLD by using QGIS. Each bright colored pixel was filtered from an orthomosaic image. A new shapefile was created to draw the polygons on the multispectral orthomosaic image to label each class by using toggle editing and adding polygon tools in the QGIS. In total, 471,748 pixels were labelled from all the classes based on the ground truth information by observing the different color tags in the orthomosaic image as shown in
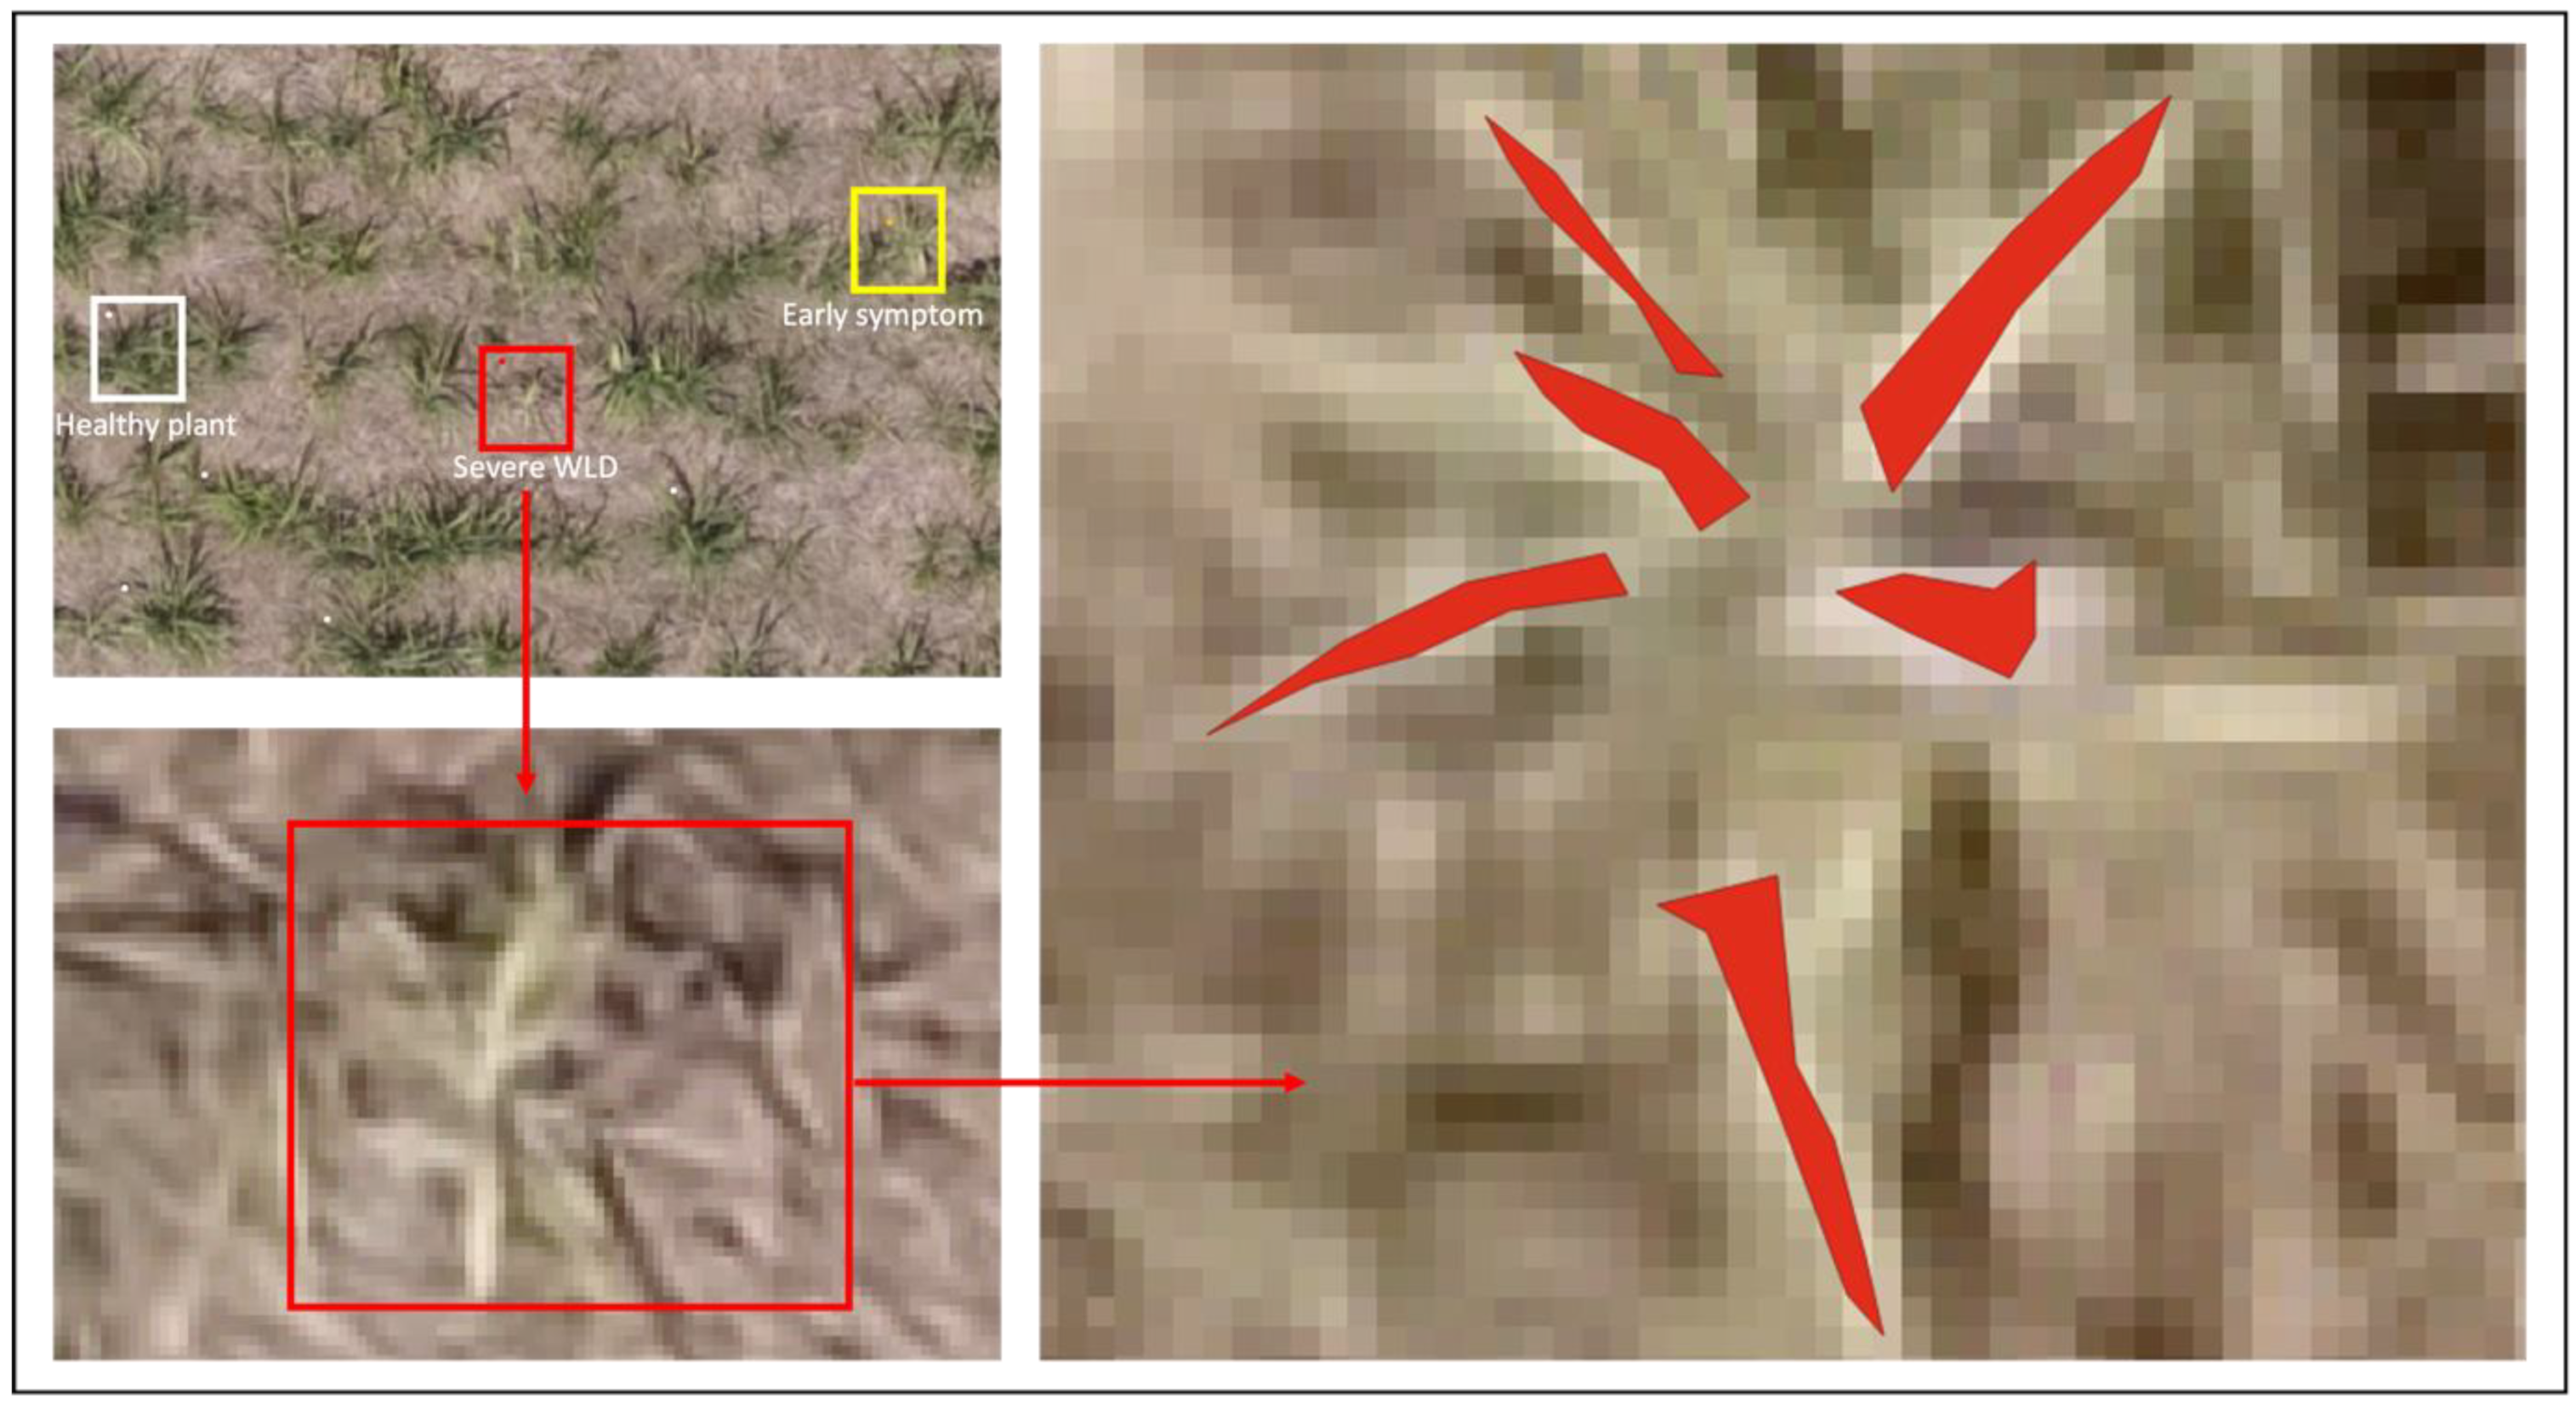
Figure 3. The edges of the plant leaves were not labelled to prevent the misclassification of mixed pixels. All the selected 150 plants’ leaves were labelled by using the polygon tool in QGIS as shown in
Figure 5. Ground truth shape files (.shp) were exported for training the different ML models. Shape region in the shape file was converted into labelled pixels using translation techniques before training the data.
2.8. Statistical Analysis for Algorithm Development
Statistical analysis was conducted using multicollinearity testing and normality testing to select the best fit ML models before tuning them with labelled data. From an initial list of twenty VIs, only six of them were chosen to train the models via multicollinearity testing via variable inflation factors (
VIF) to avoid model overfitting. Finally, eleven input features (five bands and six VIs) were used to develop the ML models to detect WLD. Variance inflation factor was used to measure how much the variance of the estimated regression coefficient is inflated if the independent variables are correlated [
54].
VIF is calculated as shown in Equation (1).
where
represents the unadjusted coefficient of determination for regressing the i-th independent variable on the remaining ones, and tolerance is simply the inverse of the
VIF. The lower the tolerance, the more likely is the multicollinearity among the variables. The value of
VIF =1 indicates that the independent variables are not correlated to each other. If the value of
VIF is 1<
VIF < 5, it specifies that the variables are moderately correlated to each other. The challenging value of
VIF is between 5 to 10 as it specifies the highly correlated variables. If
VIF ≥ 5 to 10, there will be multicollinearity among the predictors in the regression model, and
VIF > 10 indicates the regression coefficients are feebly estimated with the presence of multicollinearity [
54].
Based on the literature review [
54,
55,
56], input features, which are not correlated among all input features and moderately correlated among all input features, such as blue, green, red, red edge, NIR, normalized difference vegetation index (NDVI), green normalized difference vegetation index (GNDVI), normalized difference red edge index (NDRE), green chlorophyll index (GCI), modified soil-adjusted vegetation index (MSAVI), and excess green (ExG), were selected to train the models, as shown in the
Table 5. Highly correlated input variables, such as leaf chlorophyll index (LCI), difference vegetation index (DVI), ratio vegetation index (RVI), enhanced vegetation index (EVI), triangular vegetation index (TVI), green difference vegetation index (GDVI), normalized green red difference index (NGRDI), atmospherically resistant vegetation index (ARVI), structure insensitive pigment index (SIPI), green optimized soil adjusted vegetation index (GOSAVI), excess red (ExR), excess green red (ExGR), normalized difference index (NDI), and simple ratio index (SRI), were not selected to train the ML models due to higher
VIF that range from around 7 to 22 [
54].
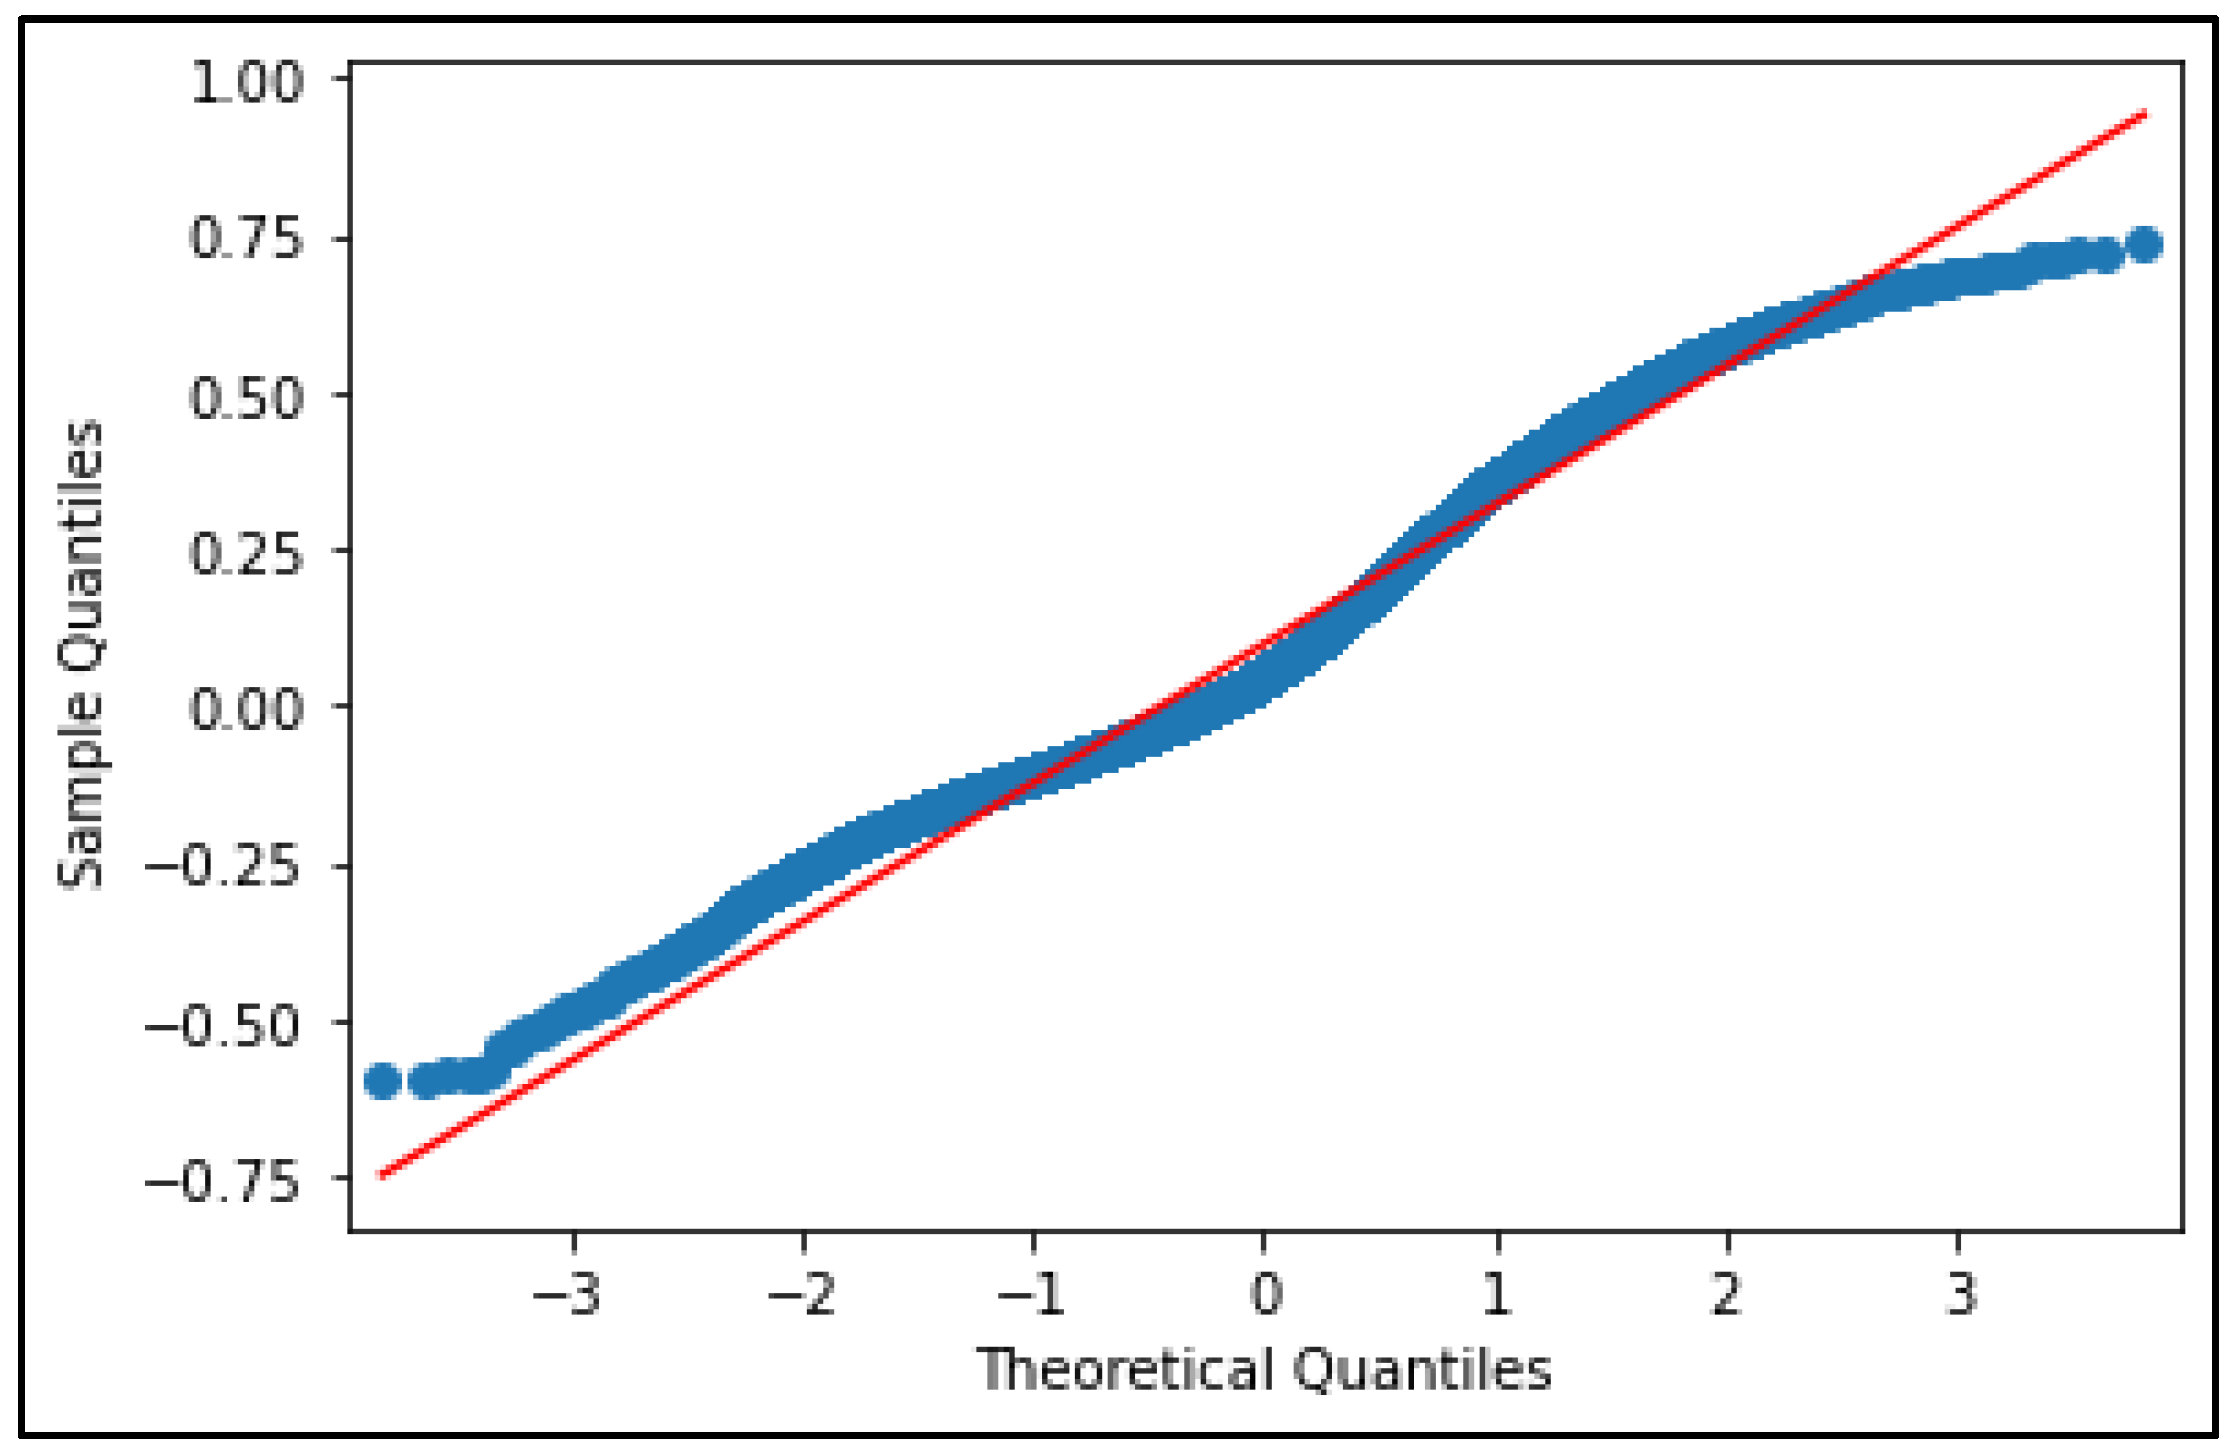
A second statistical experiment of normality test was conducted to determine whether sample data have been drawn from a normally distributed population for the development of ML models. Different normality tests, namely quantile-quantile (Q-Q) plot, were conducted to confirm the normal distribution of features.
Figure 6 shows the Q-Q plot confirming that the data were adequately close to the theoretical reference line, representing a sound model fit. The python libraries, such as matplotlib, numpy, statsmodels.graphics.gofplots, and scipy.stats, were used to develop the Q-Q plot.
2.9. Development of Classification Algorithms and Prediction
The development of algorithms includes multiple steps to load, preprocess, fit the classifier to the data, and prediction. The processing phase converts the read data into a collection of features, which are then analyzed by the classifier as shown in
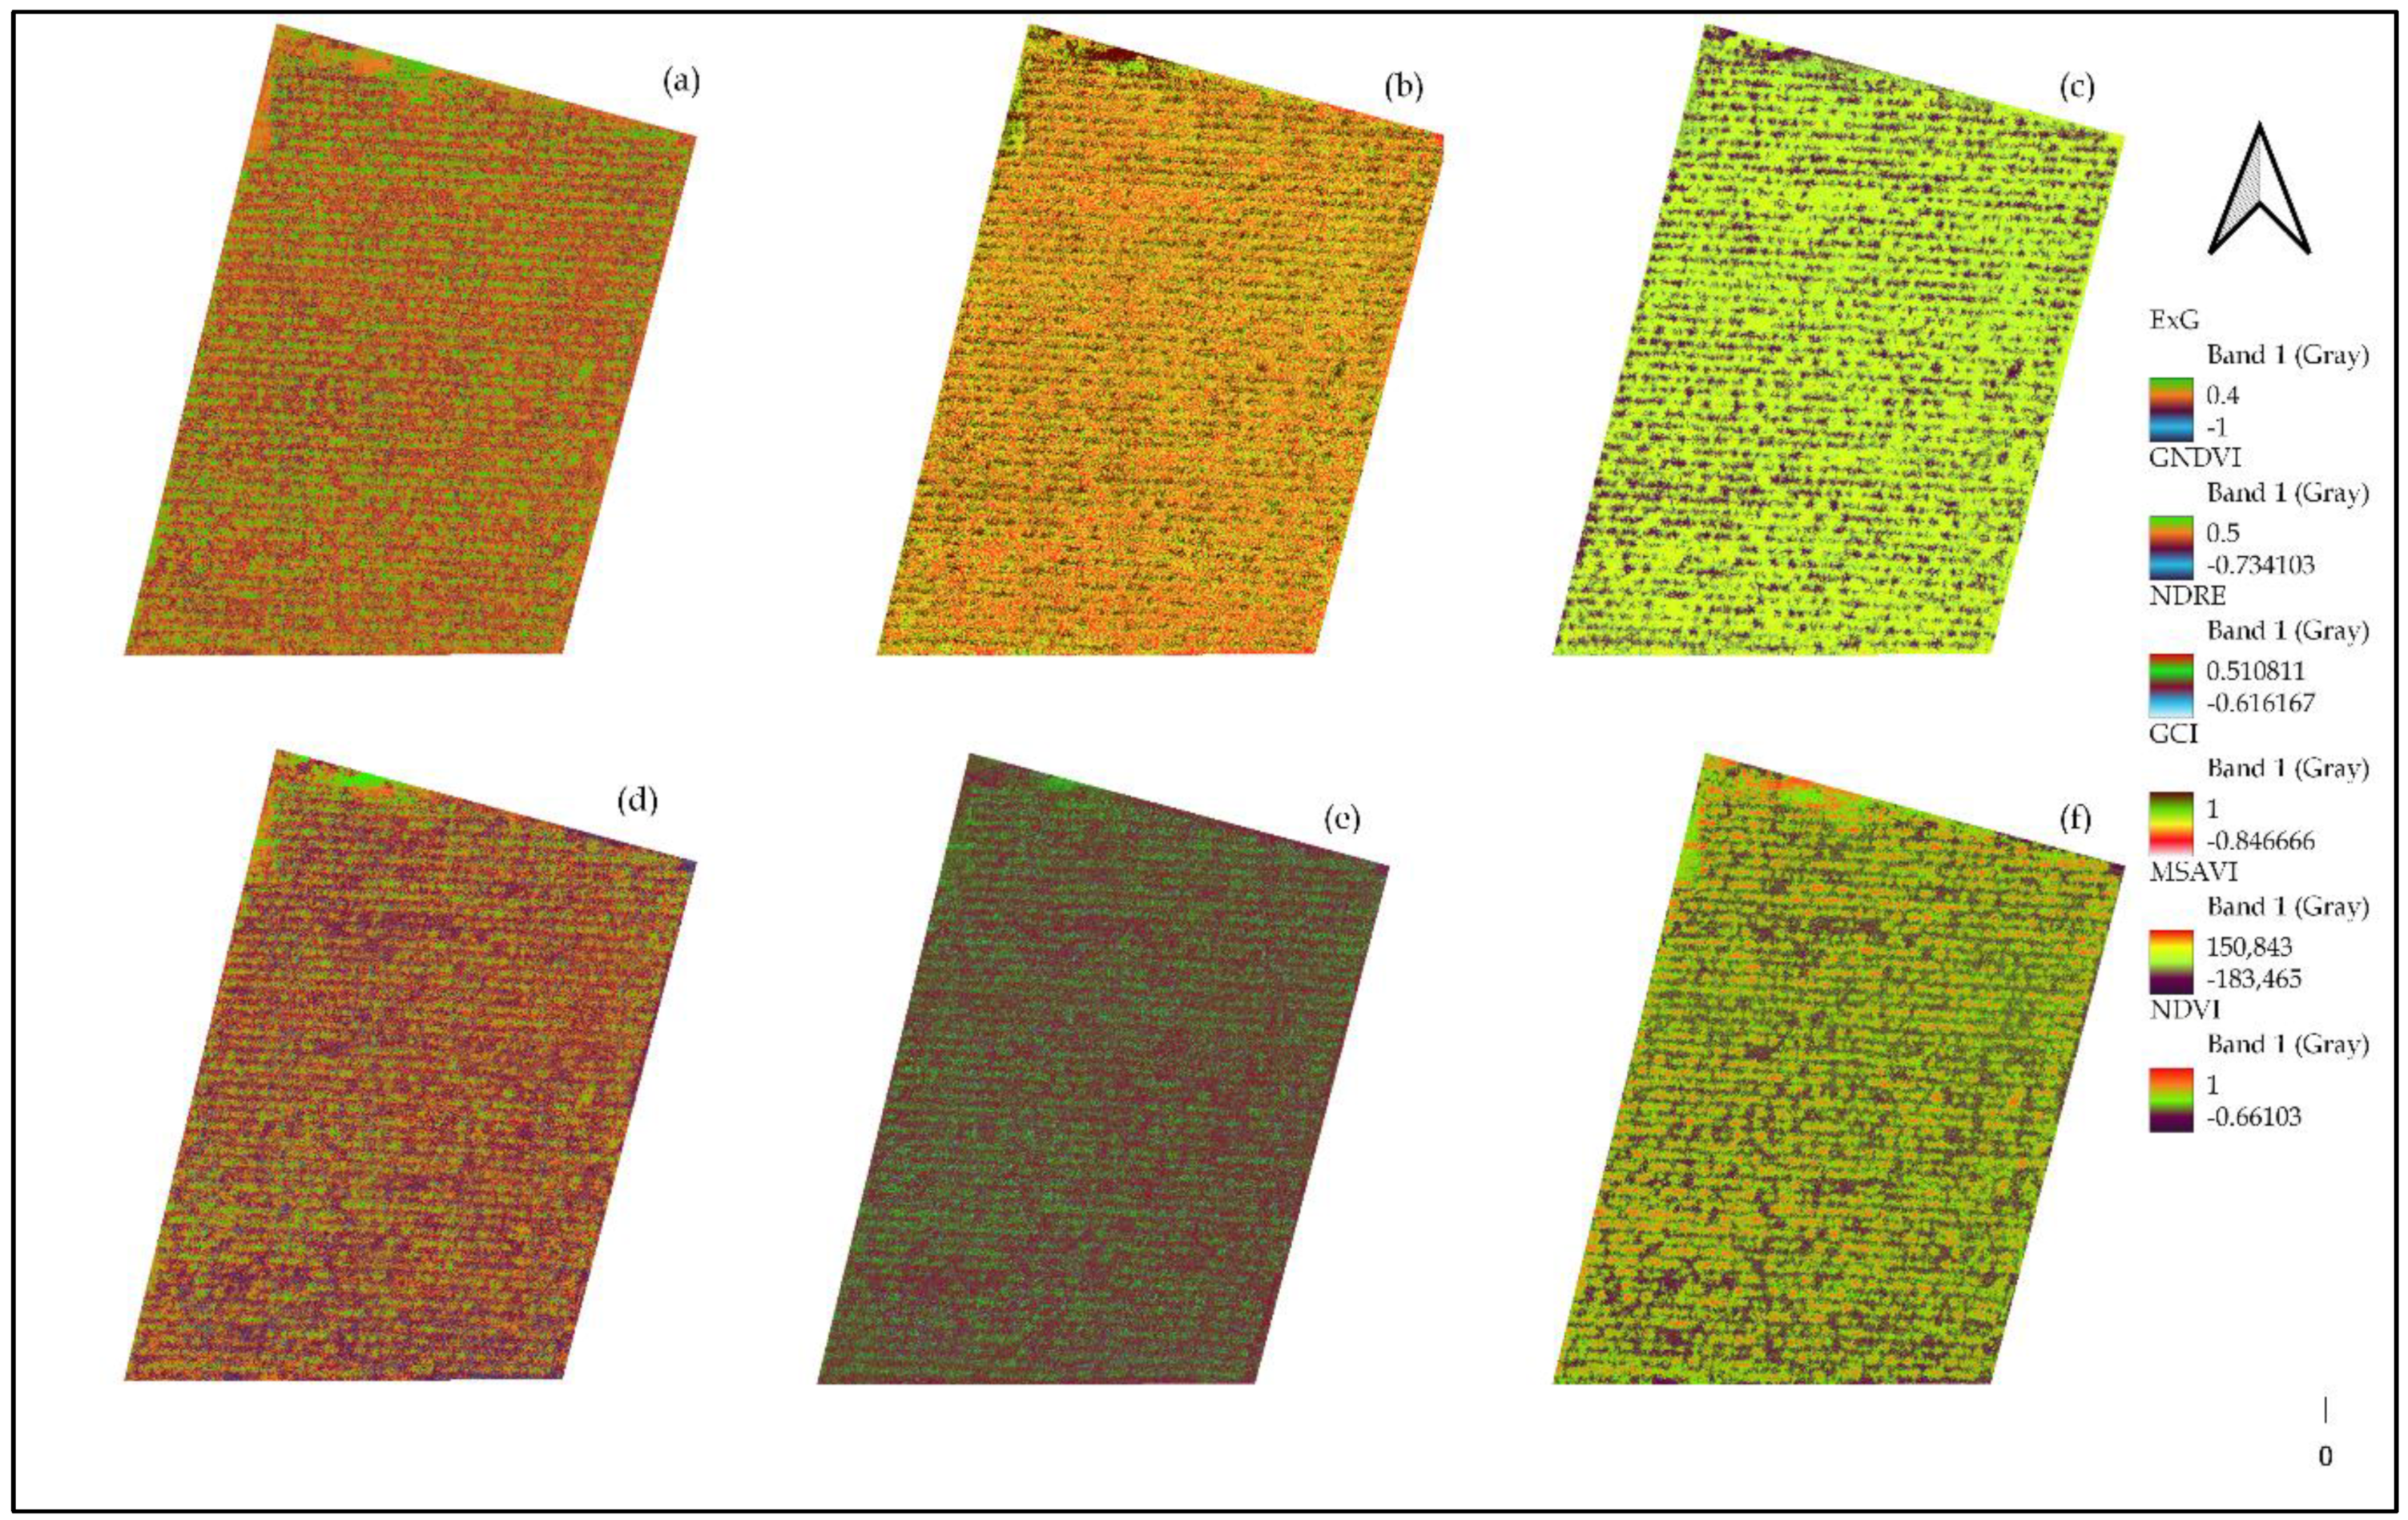
Table 6. An orthomosaic multispectral raster was loaded into the algorithm to calculate spectral indexes and improve the detection rates as mentioned in step 5. For this approach, the VIs, such as ExG, GCI, MSAVI, GNDVI, NDRE, and NDVI, are estimated (step 6) as shown in
Table 7. All five bands in the multispectral raster, as well as in the estimated vegetation spectral indexes, are denominated as input features (step 7).
The labelled regions from the ground-based assessments are exported from QGIS and loaded into an array (y_array) (step 10). In all, 471,748 pixelwise samples were filtered and randomly divided into a training array (75%) and a testing array (25%) (step 11). In step 13, data are processed into different ML classifiers. This study employed four (04) machine learning regression methods, XGB, RF, DT, and KNN, to detect the sugarcane WLD from multispectral UAV images. Finally, the fitted model is validated using k-fold cross-validation (step 15). In the prediction stage, unlabelled pixels are processed in the optimized classifier, and their values are displayed in the same 2D spatial image from the orthorectified multispectral raster (step 17). Each image’s identified pixels are then colored differently and exported in TIF format, which can be read with geographic information system (GIS) platforms (step 18). The best performant model for identifying WLD in the sugarcane field was selected by comparing performance metrics, such as precision, recall, f1 score, and accuracy. Further details on the calculation of these metrics can be found in
Section 3.4.
2.10. Validation
For validation, 90 sugarcane plants were classified into three types, healthy plants (30 plants), early symptoms plants (30 plants), and severe symptoms plants (30 plants), by using different color tags, such as white tag, yellow tag, and red tag, respectively, as shown in
Figure 3, in the testing site. The labelling was performed the same as in the training site that is mentioned in the
Section 2.6. Then, a python script was developed to validate the validation accuracy in the testing site. Finally, an input file (multispectral images as .tiff for testing site), a ground truth file (ground truth shape file as .shp for testing site), and a best model file (as .json exported from training) were loaded into different algorithms for estimating the validation accuracy.
4. Discussion
The current study demonstrates a viable strategy for detecting WLD in sugarcane fields by UAVs and machine learning-based classification models. This methodology will give a realistic, accurate, and efficient method for determining the presence of WLD in vast sugarcane fields. VIs are crucial for developing the best classification algorithms because diseases cause changes in the color, water content, and cell structure of the leaves, which are reflected in the spectrum [
72]. Pigment changes cause visible spectral responses, while changes in cell structure cause near-infrared spectral responses. Initially, twenty VIs were selected, and only six VIs were chosen via multicollinearity testing and feature selection techniques to minimize the training time and resource requirements of the computer because training time is crucial for model evaluation and to avoid model overfitting. However, the UAV-derived spectral bands and indices used in this work are not disease-specific; hence, they can only measure different infestation levels or damage when a single disease impacts the crop, as they cannot differentiate between their different types of diseases.
Feature selection is important to attain a higher classification accuracy with less training time. However, it isn’t easy to obtain the best time and accuracy, and hence a balance must be established based on users’ requirements. Different color tags were used for ground truth measurements for post image processing of labelling. However, a handheld GPS meter with higher accuracy can locate each class due to the unavailability of high accuracy GPS meters. However, it is a good method for validating the prediction results in the segmented images. Since conducting ground truth investigations into plant diseases needs professional competence and is time- and labor-intensive, most of the research relied heavily on sampling surveys, as did the evaluation outcomes [
50]. Two-month-old sugarcane plants were selected in this study because young plants are highly affected by WLD in the sugarcane industries. Early detection of illnesses is crucial for successful mitigation actions [
46]. However, this study should continue further in various sugarcane crop stages. Additionally, flight missions should be conducted in different climatic seasons in different sugarcane varieties to find the severity level of this incident.
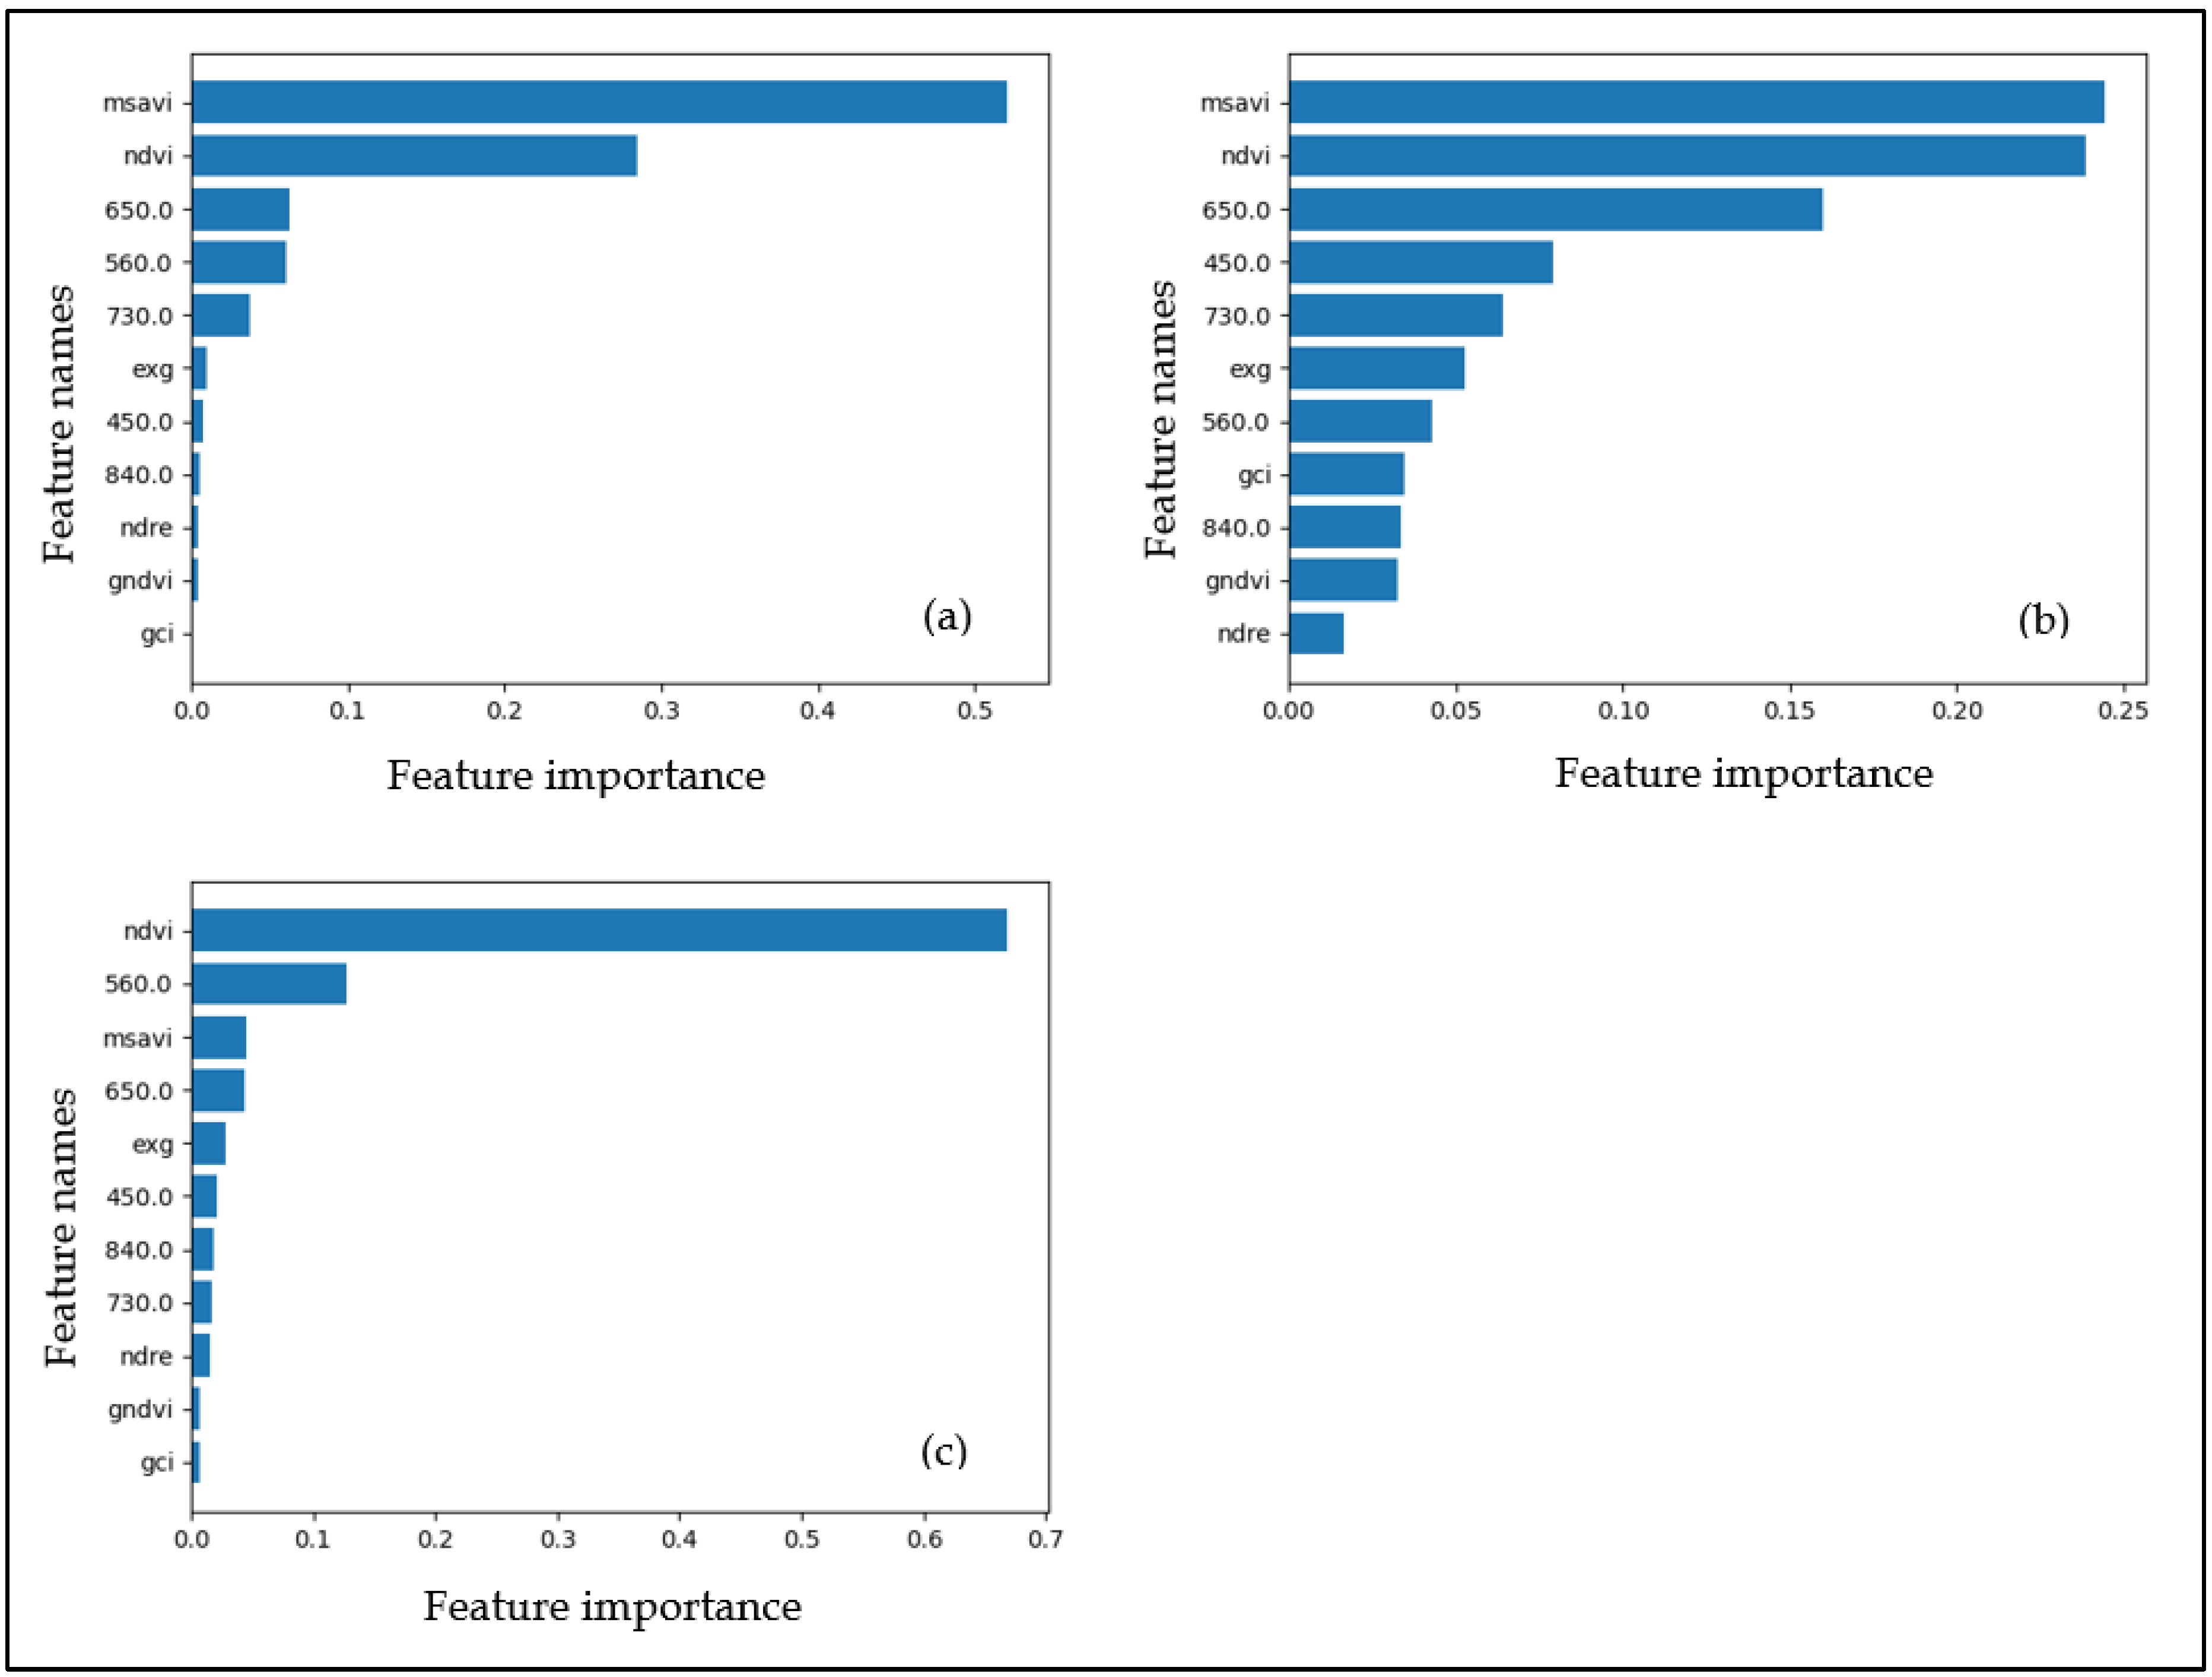
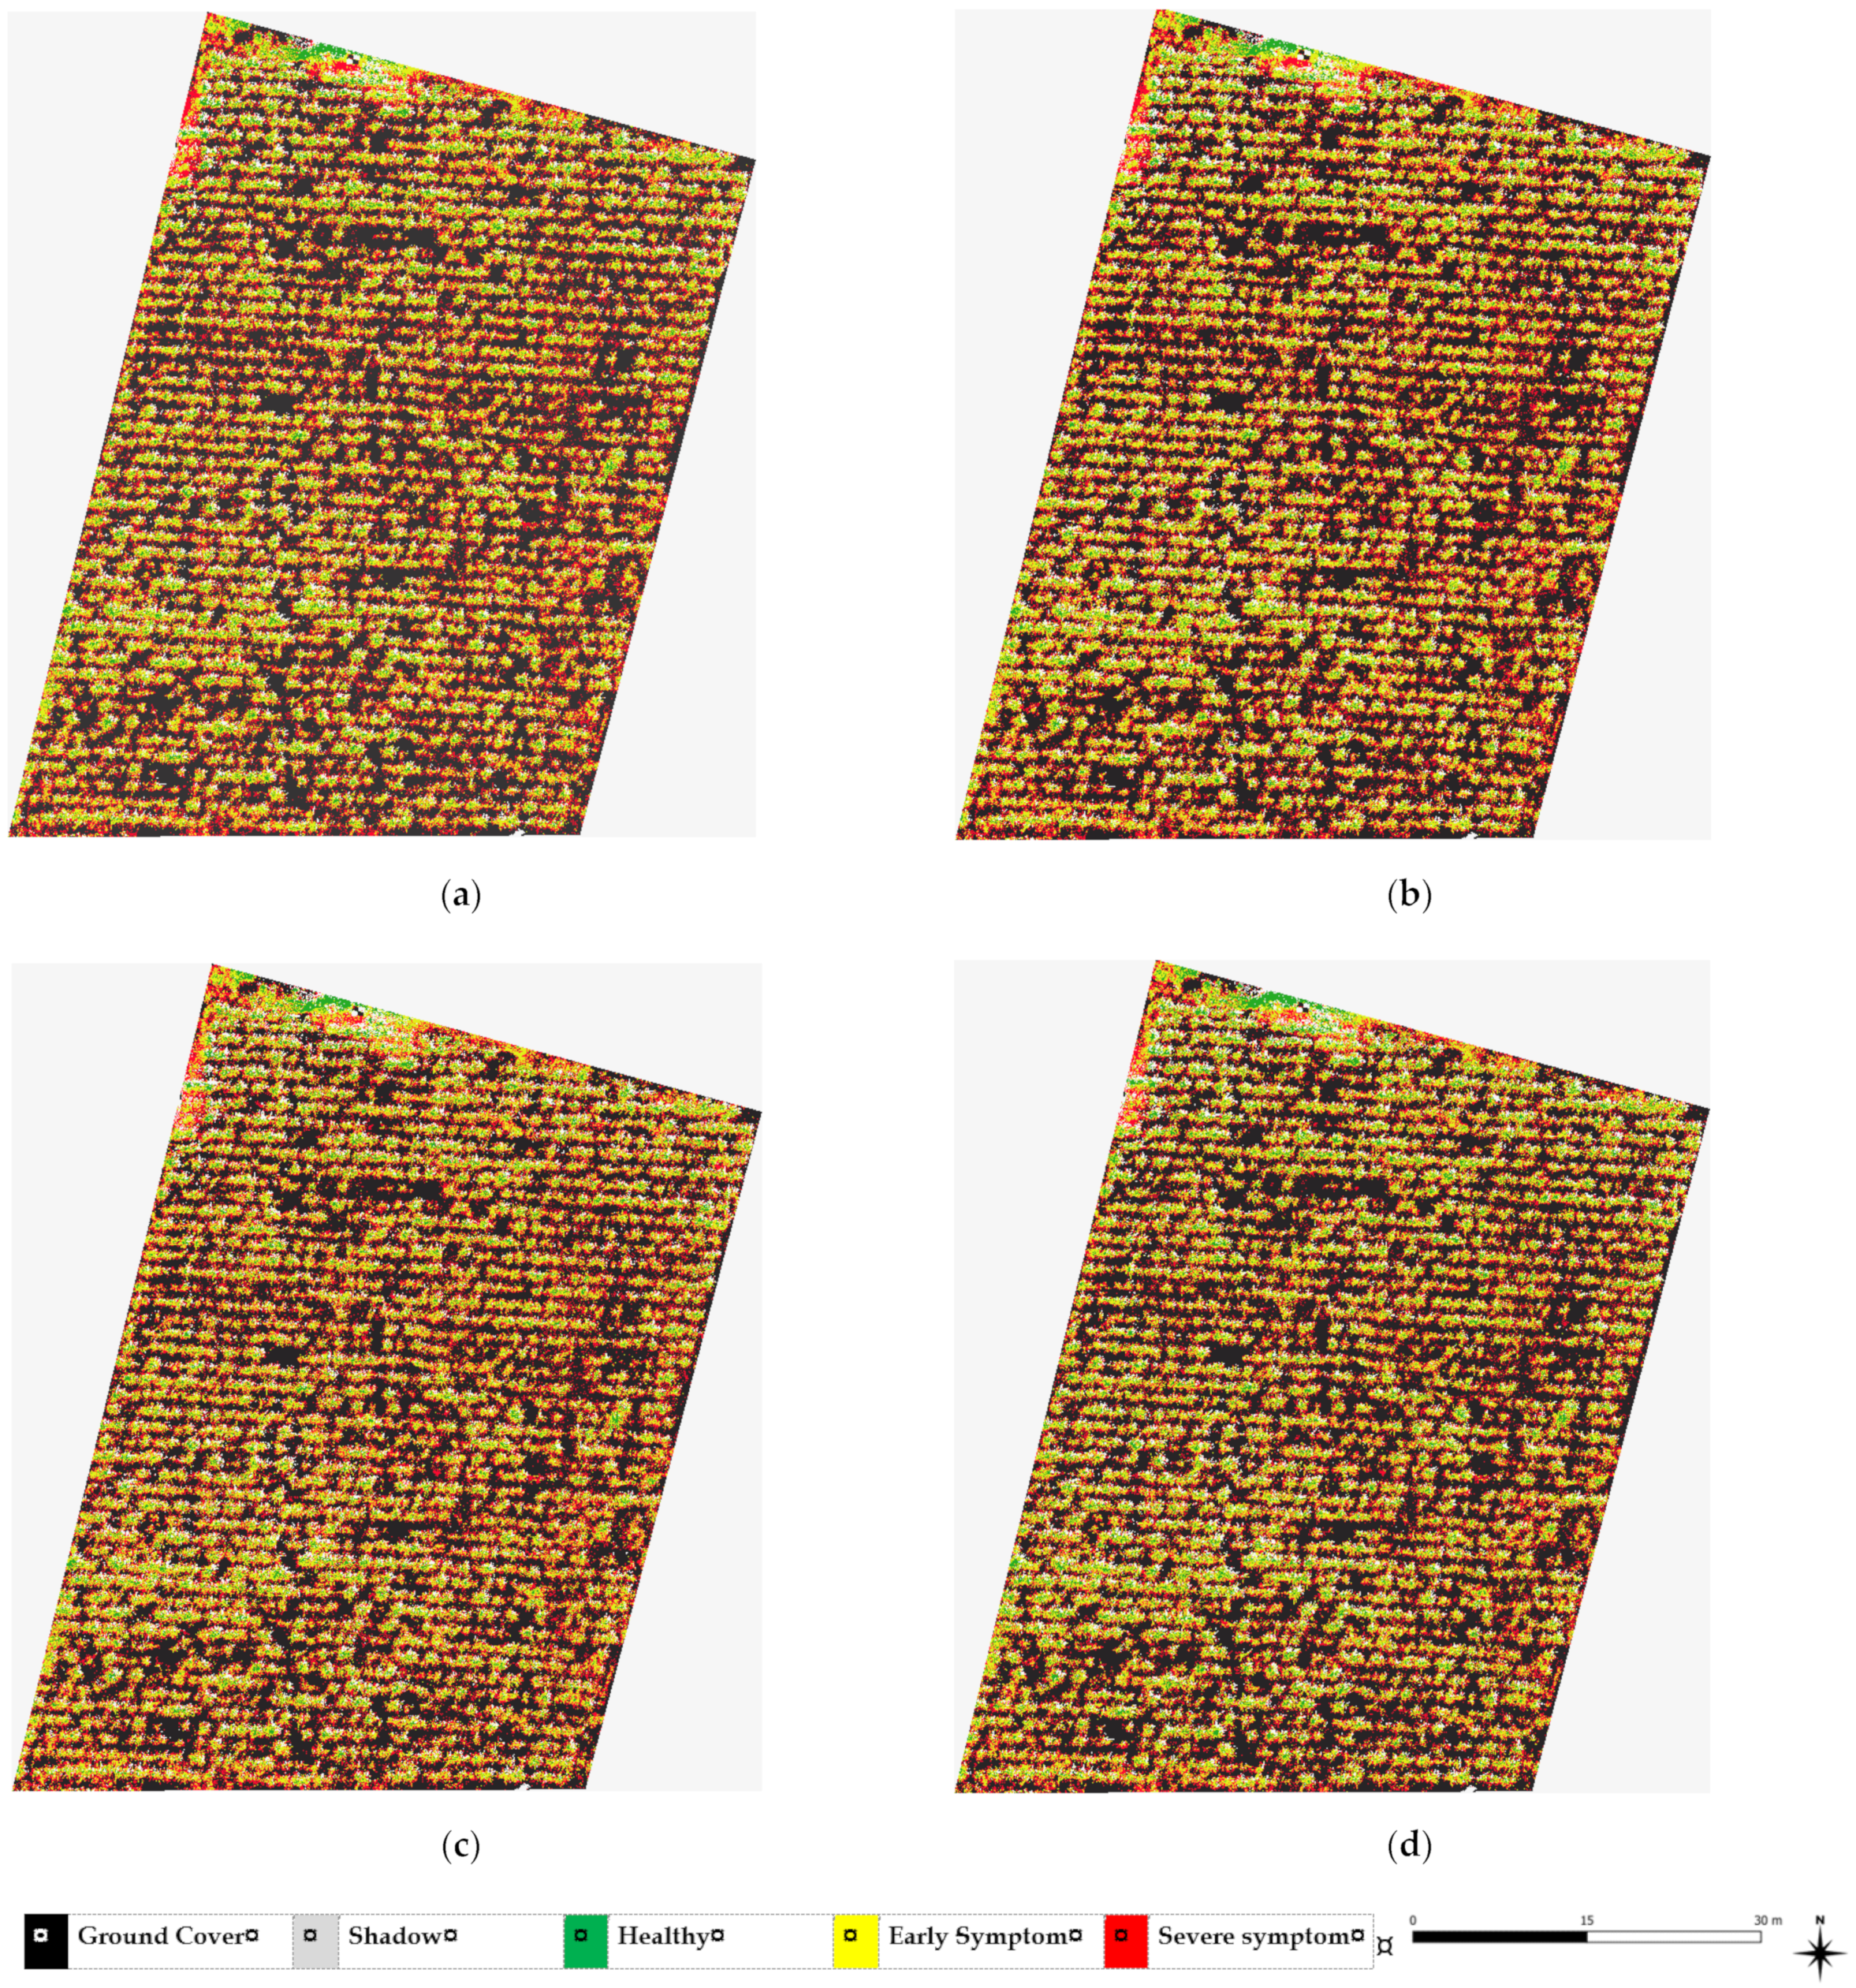
Variable optimization was implemented, and just six variables were deemed essential for developing the various ML prediction models. During the optimization process, all ML models eliminated less significant variables. Other studies have indicated that excluding insignificant factors improves the classification performance of machine learning. When variable relevance is very low, the variable is either unimportant or substantially collinear with another variable or variables. Based on the five-band pictures and VIs, the selected ML models, such as XGB, RF, DT, and KNN, produced distribution maps with comparable results. In addition, the overall classification accuracy of this study employing multispectral VIs produced from UAVs is equivalent to similar studies described in the preceding sections. RF has great precision, excellent outlier tolerance, and parameter selection. León-Rueda et al. [
13] also used the RF classifier for the classification process. Lan et al. [
17] evaluated the feasibility of monitoring citrus Huanglongbing (HLB) by using multispectral images, VIs, and KNN algorithm because KNN is one of the simplest classification algorithms available. It may be used to solve classification and regression predicting problems with extremely competitive results [
46]. The DT algorithm tends to have more numerical features in the classification results for data within consistent sample sizes in each category [
73]. However, as a result, XGB was chosen as the ideal technology for monitoring WLD in the sugarcane field because it is highly flexible and works well in small to medium datasets. Therefore, the best prediction model was developed with high accuracy within a short training time.
In the segmentation results, the margin of all the crops was shown in red color due to the dead leaves. Therefore, precision, recall, and F1 score for early and severe symptoms were reduced during the training process. It is a limitation of this study. However, severely diseased plants can be detected easily if the segmented crop canopy is covered completely with red color. Therefore, further research should be conducted to determine the usefulness of deep learning algorithms for detecting WLD in sugarcane fields. Only four ML algorithms were selected in this study based on the previous studies mentioned in
Section 1. However, other ML models, such as SVM and LR, can be developed to detect the WLD while comparing with existing models. In addition to these research gaps, high-resolution hyperspectral cameras can improve accuracy, and disease-specific VIs should be developed to detect the specific disease in the sugarcane field.

