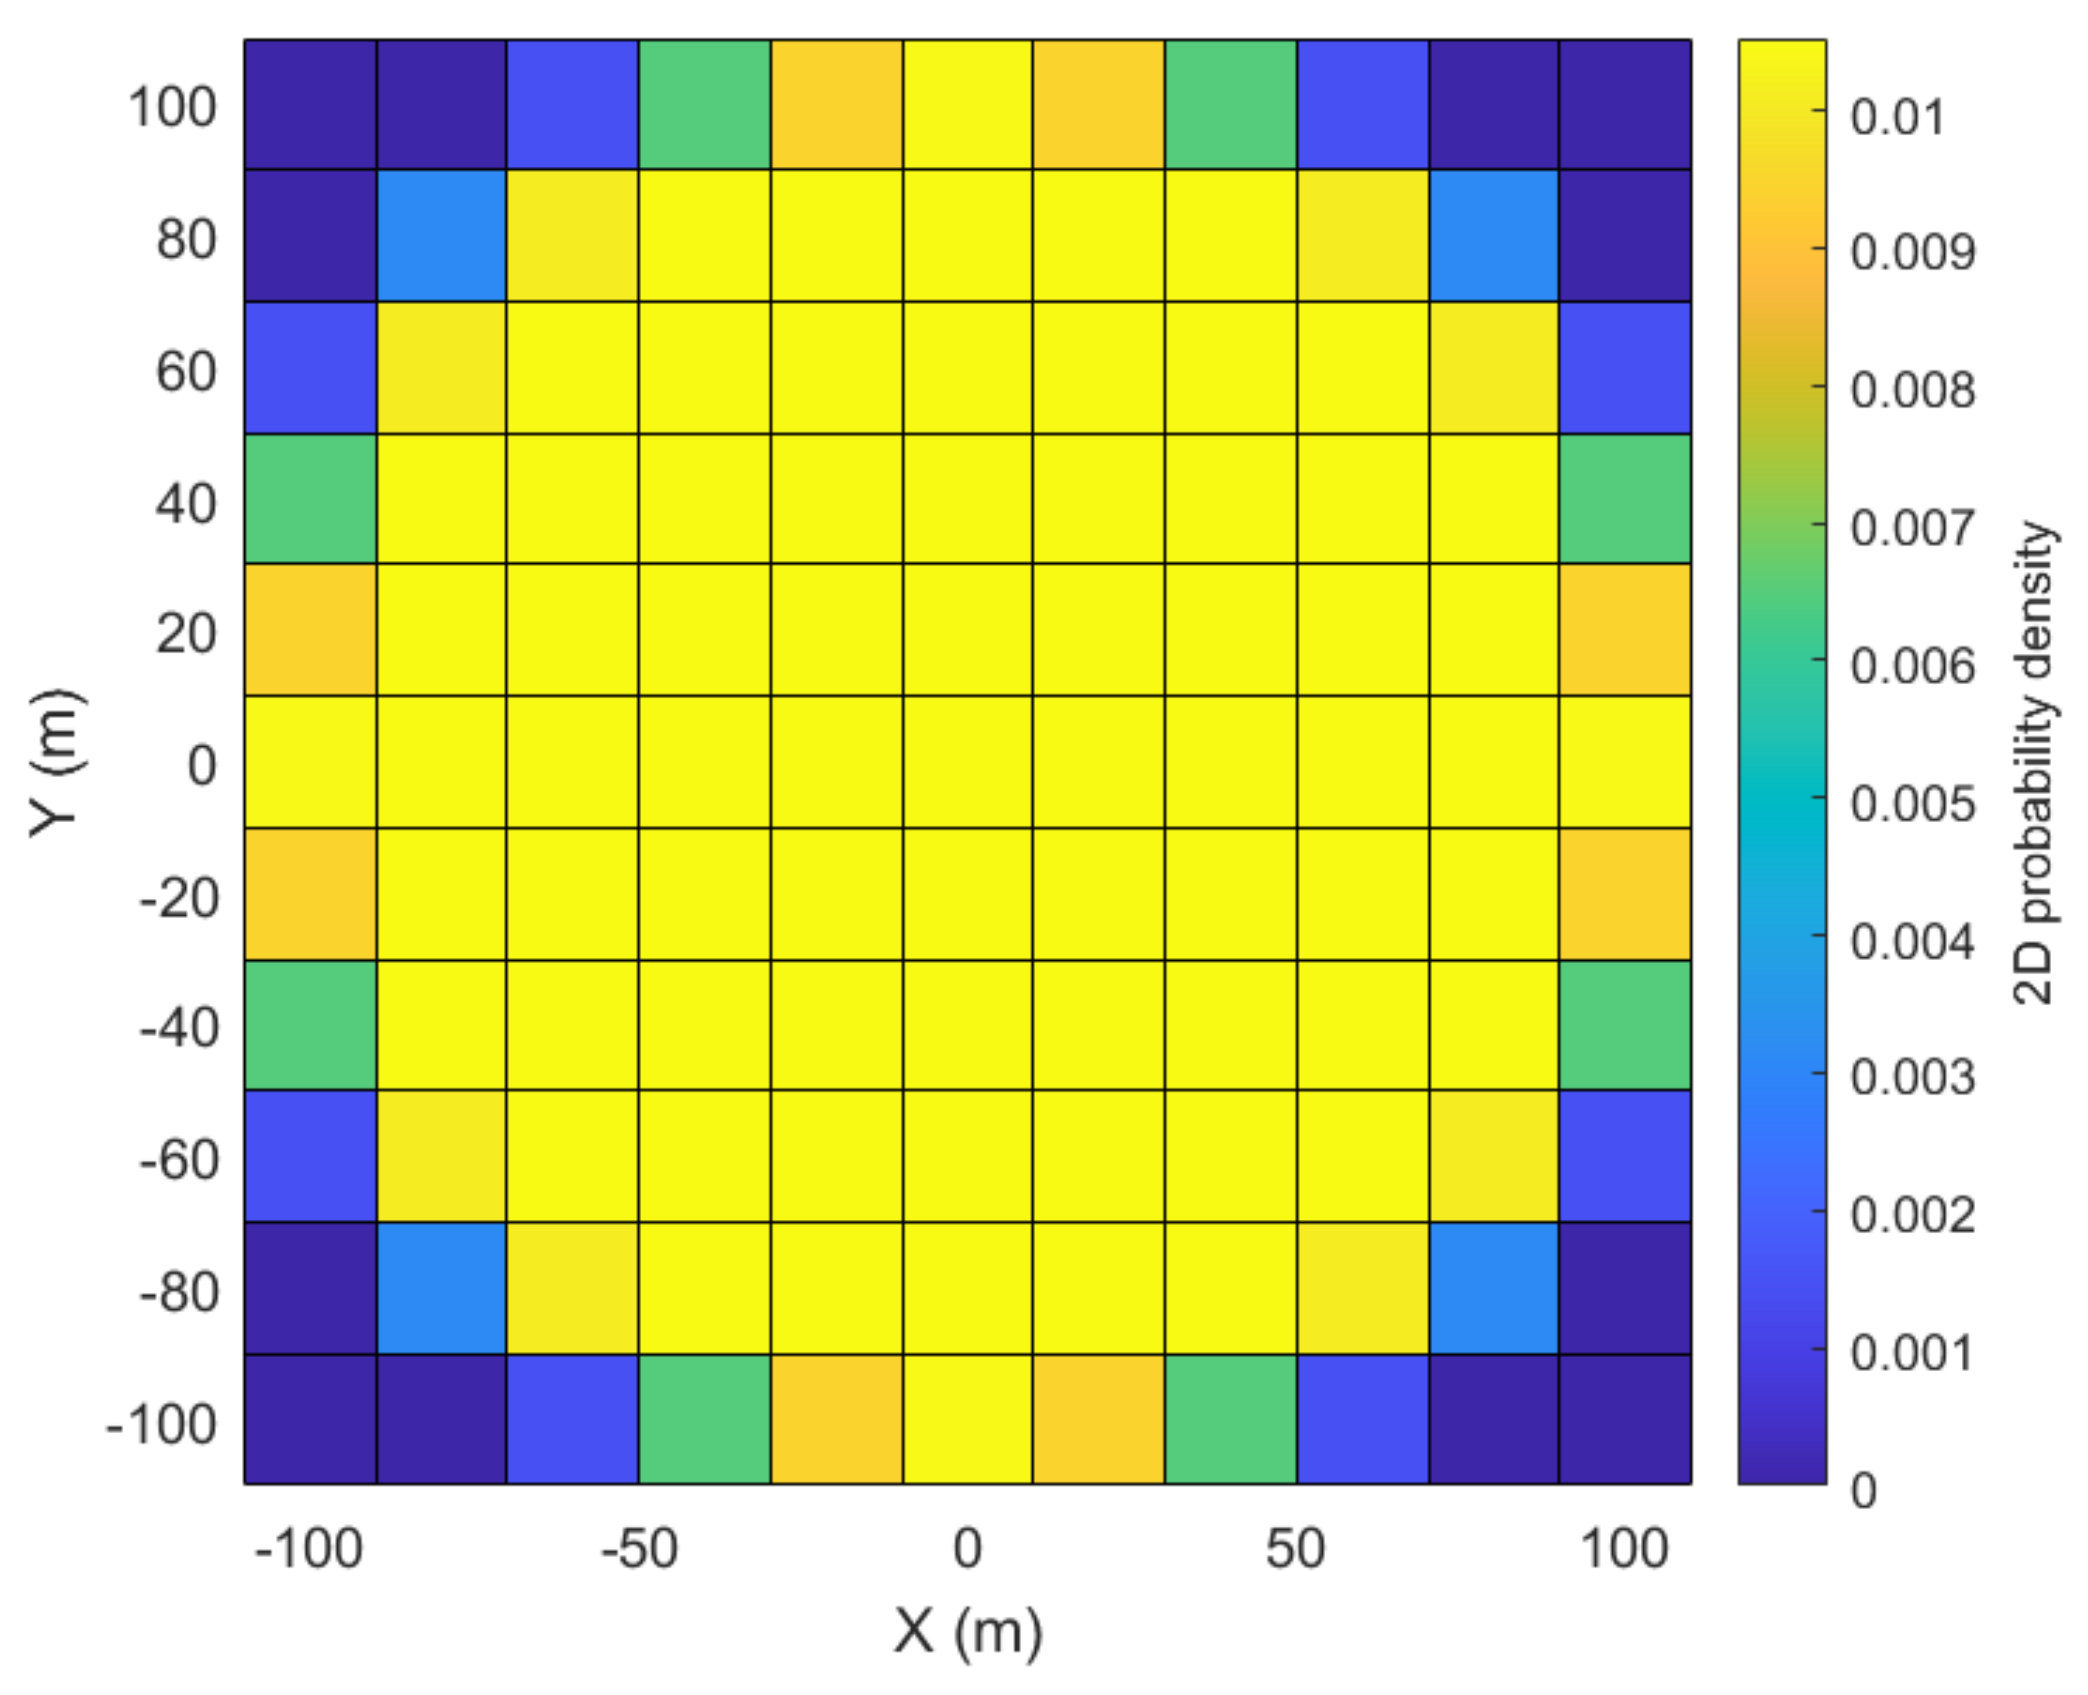
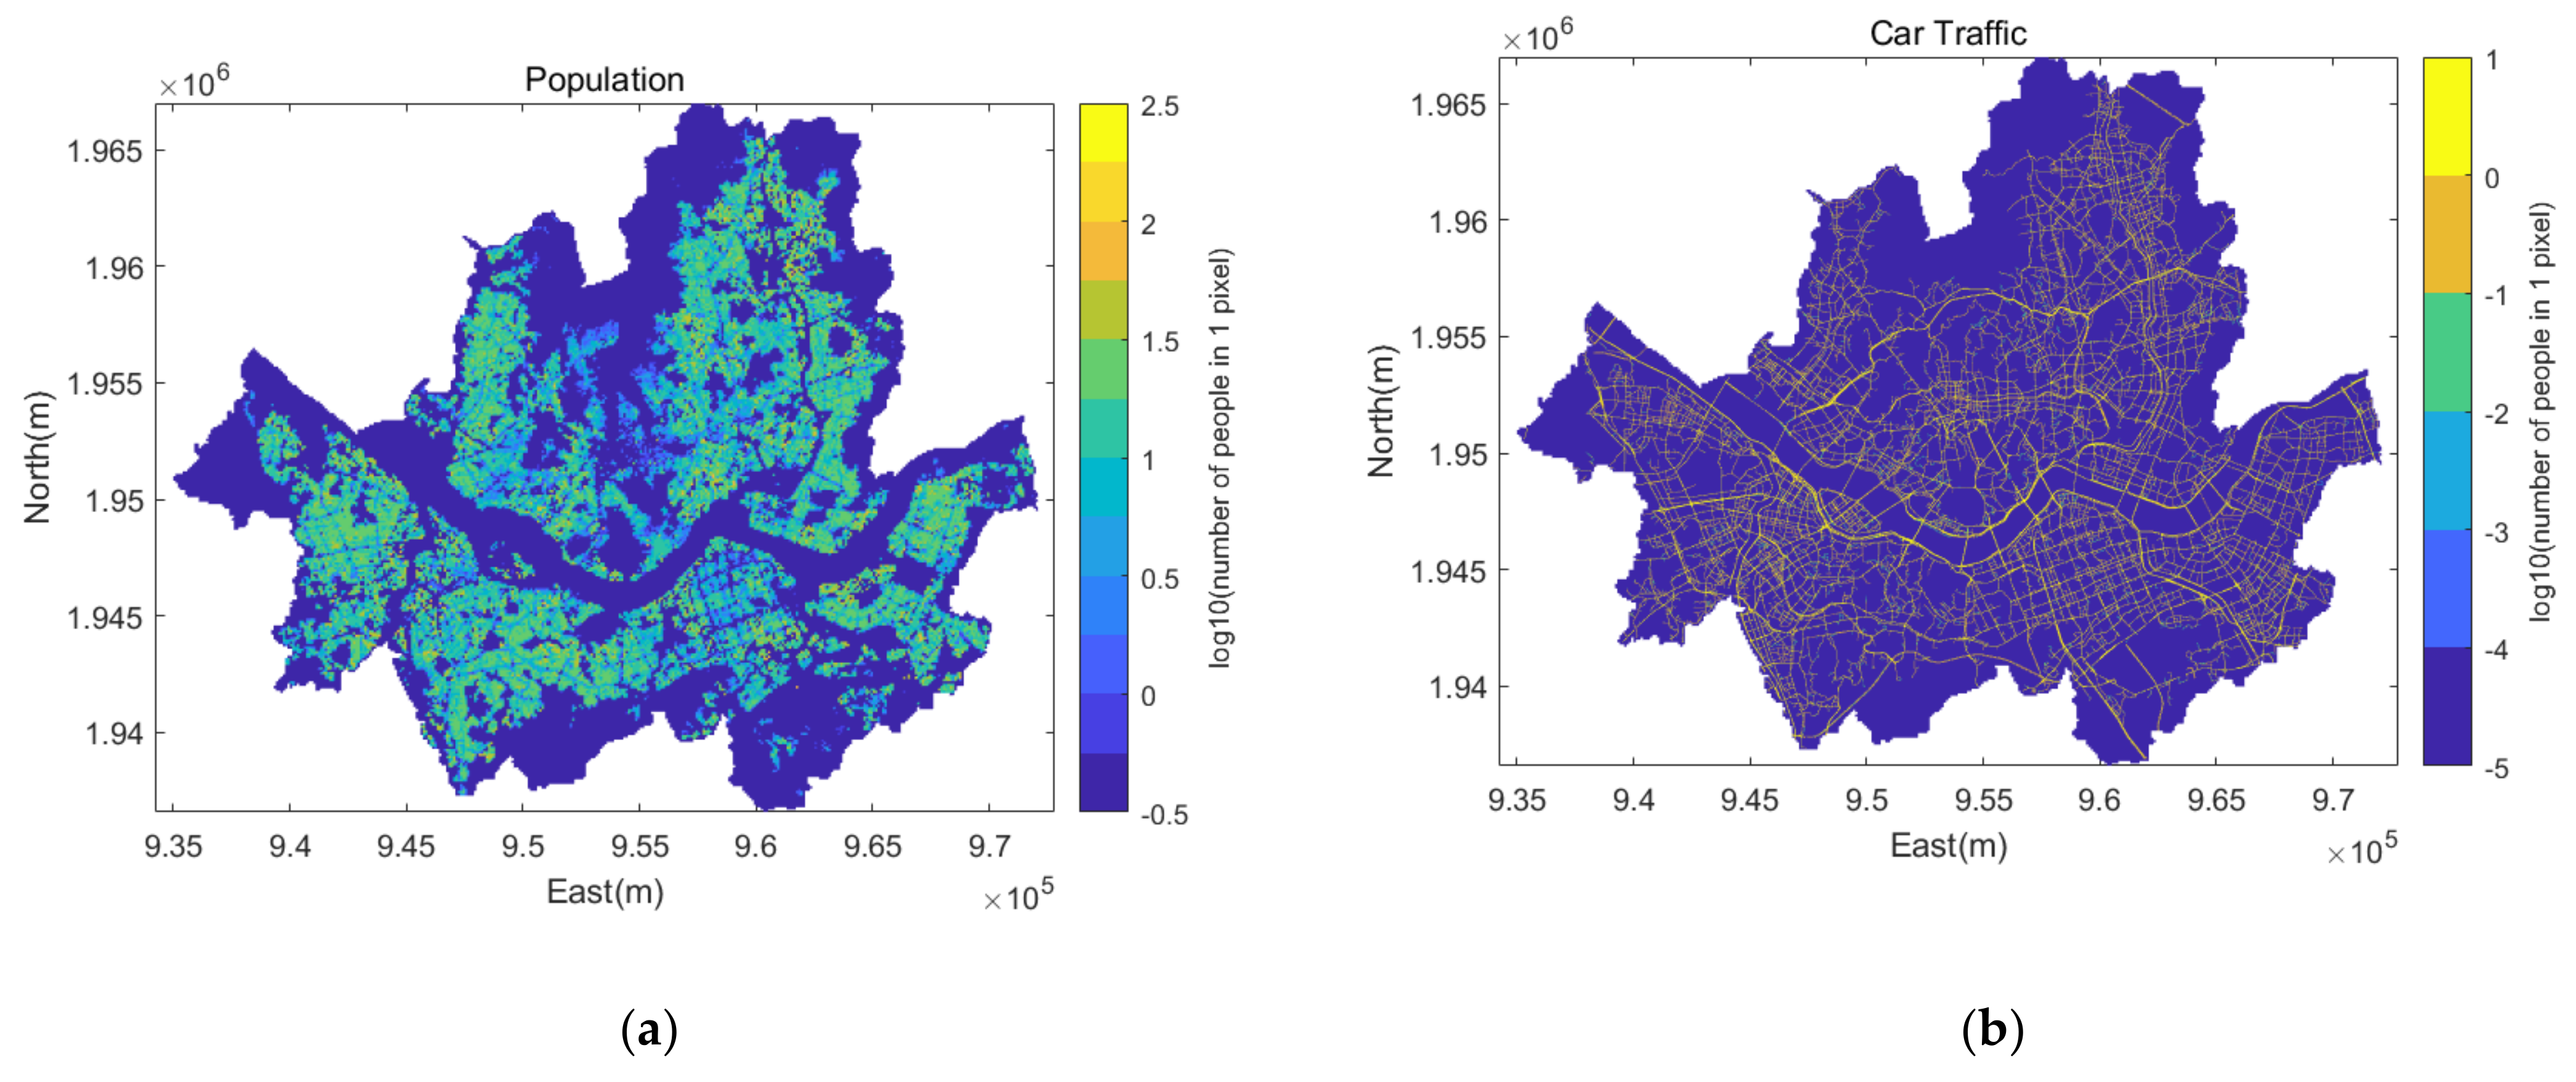
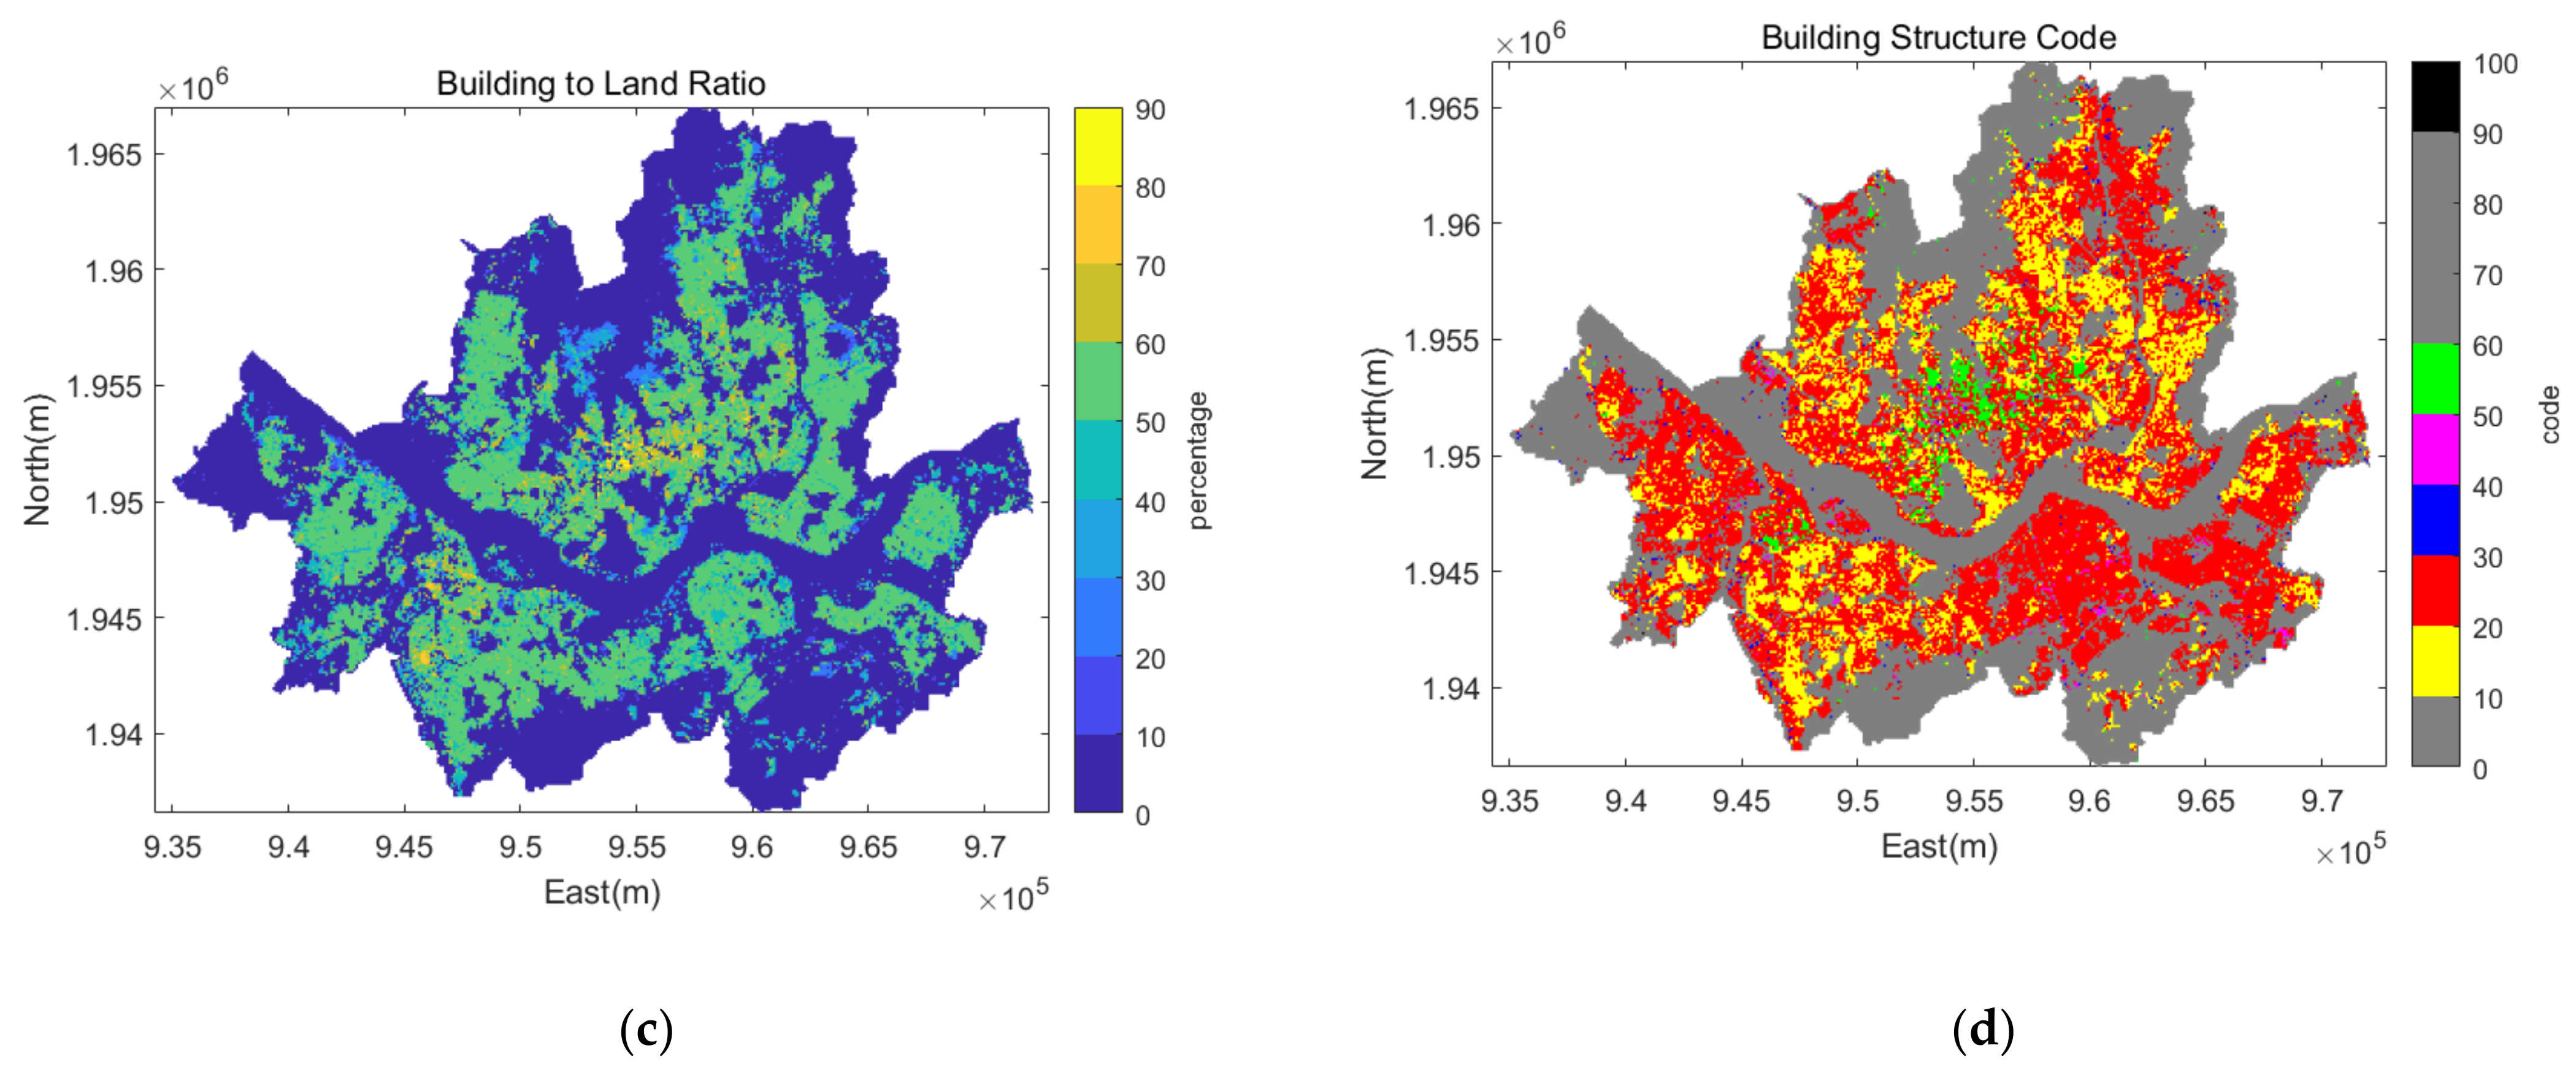
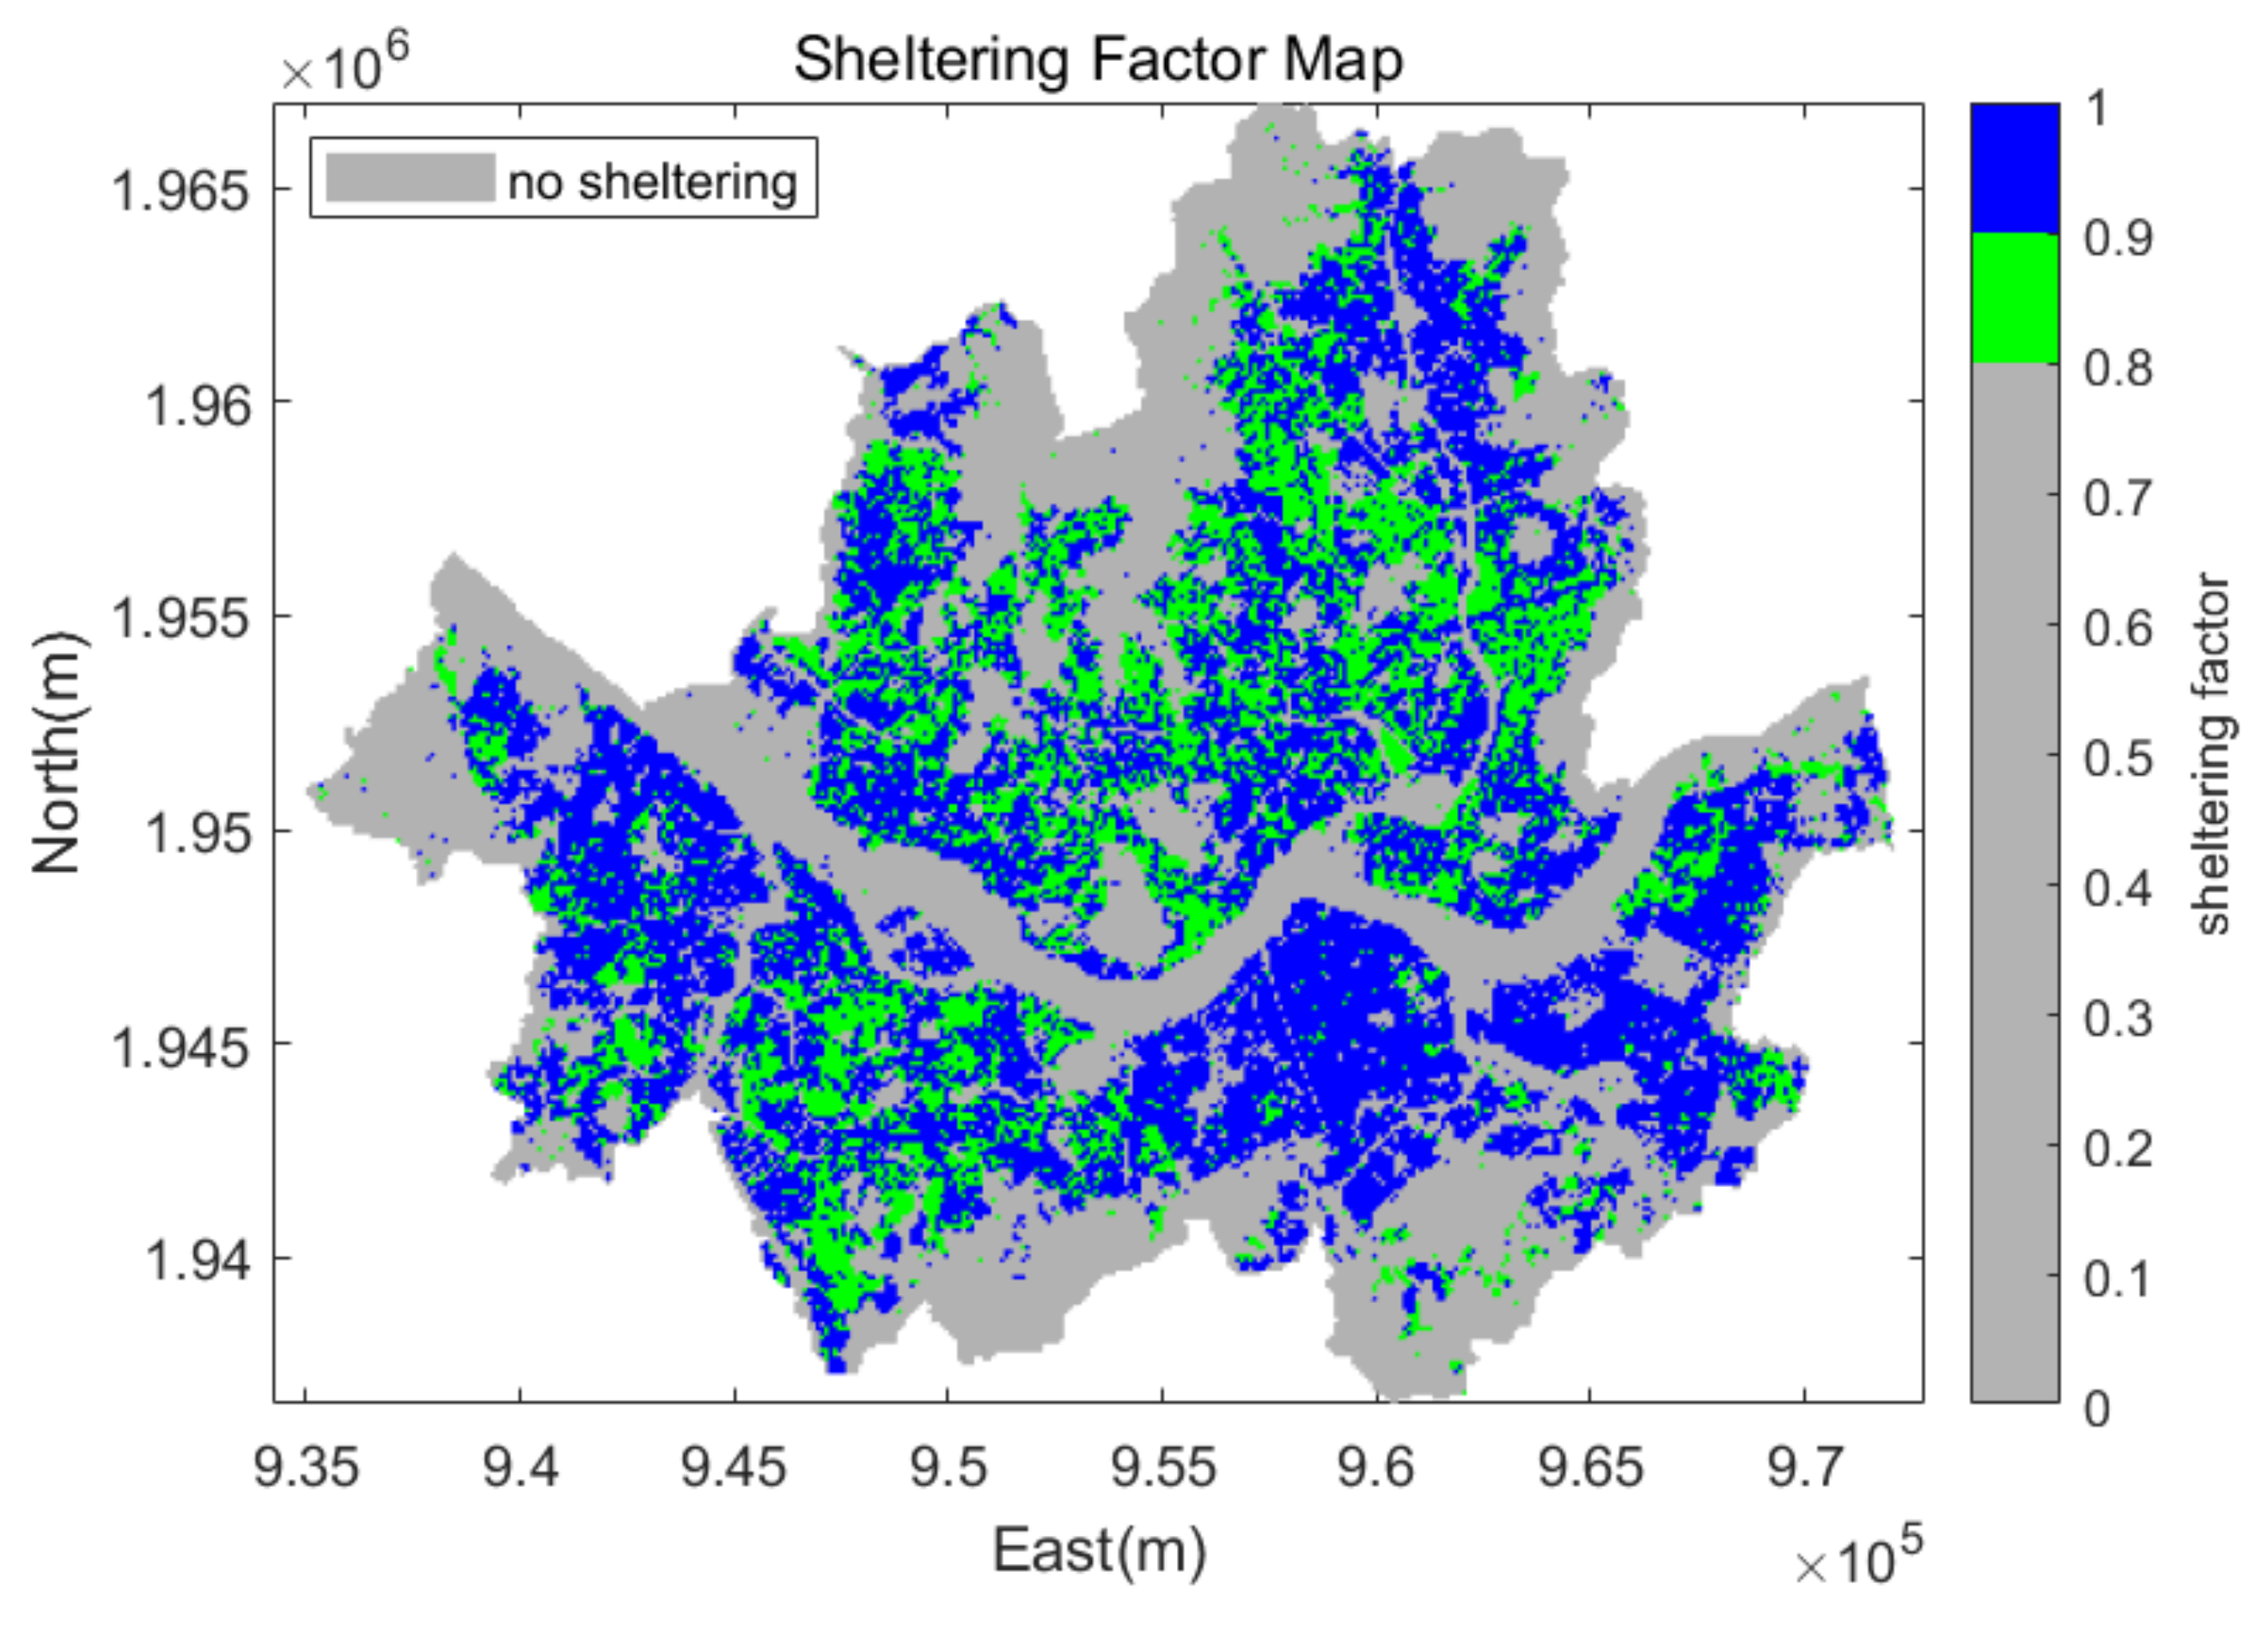
To investigate the capacity of the corridor in a risk-based sense, the collision rate () and the failure rate () in Equation (1) need to be formulated as a function of the traffic flow of the corridor. and can also be considered as the crash rate due to collisions and failures if it is assumed that the probability of a UAV crash is one when a collision or failure occurs.
4.2. Capacity Derivation Based on Collision Rate
To compute the expected number of vehicles that will crash on the ground due to a collision between UAVs in the corridor, the Reich collision risk model used in manned aviation was utilized. In the lateral/vertical Reich collision risk model, the course deviation error which is presented as RNP (Required Navigation Performance) in manned aviation is the major factor that affects the collision risk. Regarding the longitudinal collision risk model, collision risk was defined based on the longitudinal overlap of two consecutive aircrafts in a longitudinal direction during the position reporting period due to the position error and relative velocity. In this model, the lateral and vertical models do not account for air traffic controller intervention, while longitudinal models do. In the case of UAVs, the role of the air traffic controller is replaced by the UTM. Furthermore, the DAA (detect and avoid) capability of the UAV is not considered. If this kind of mitigation is applied, the collision risk can be decreased.
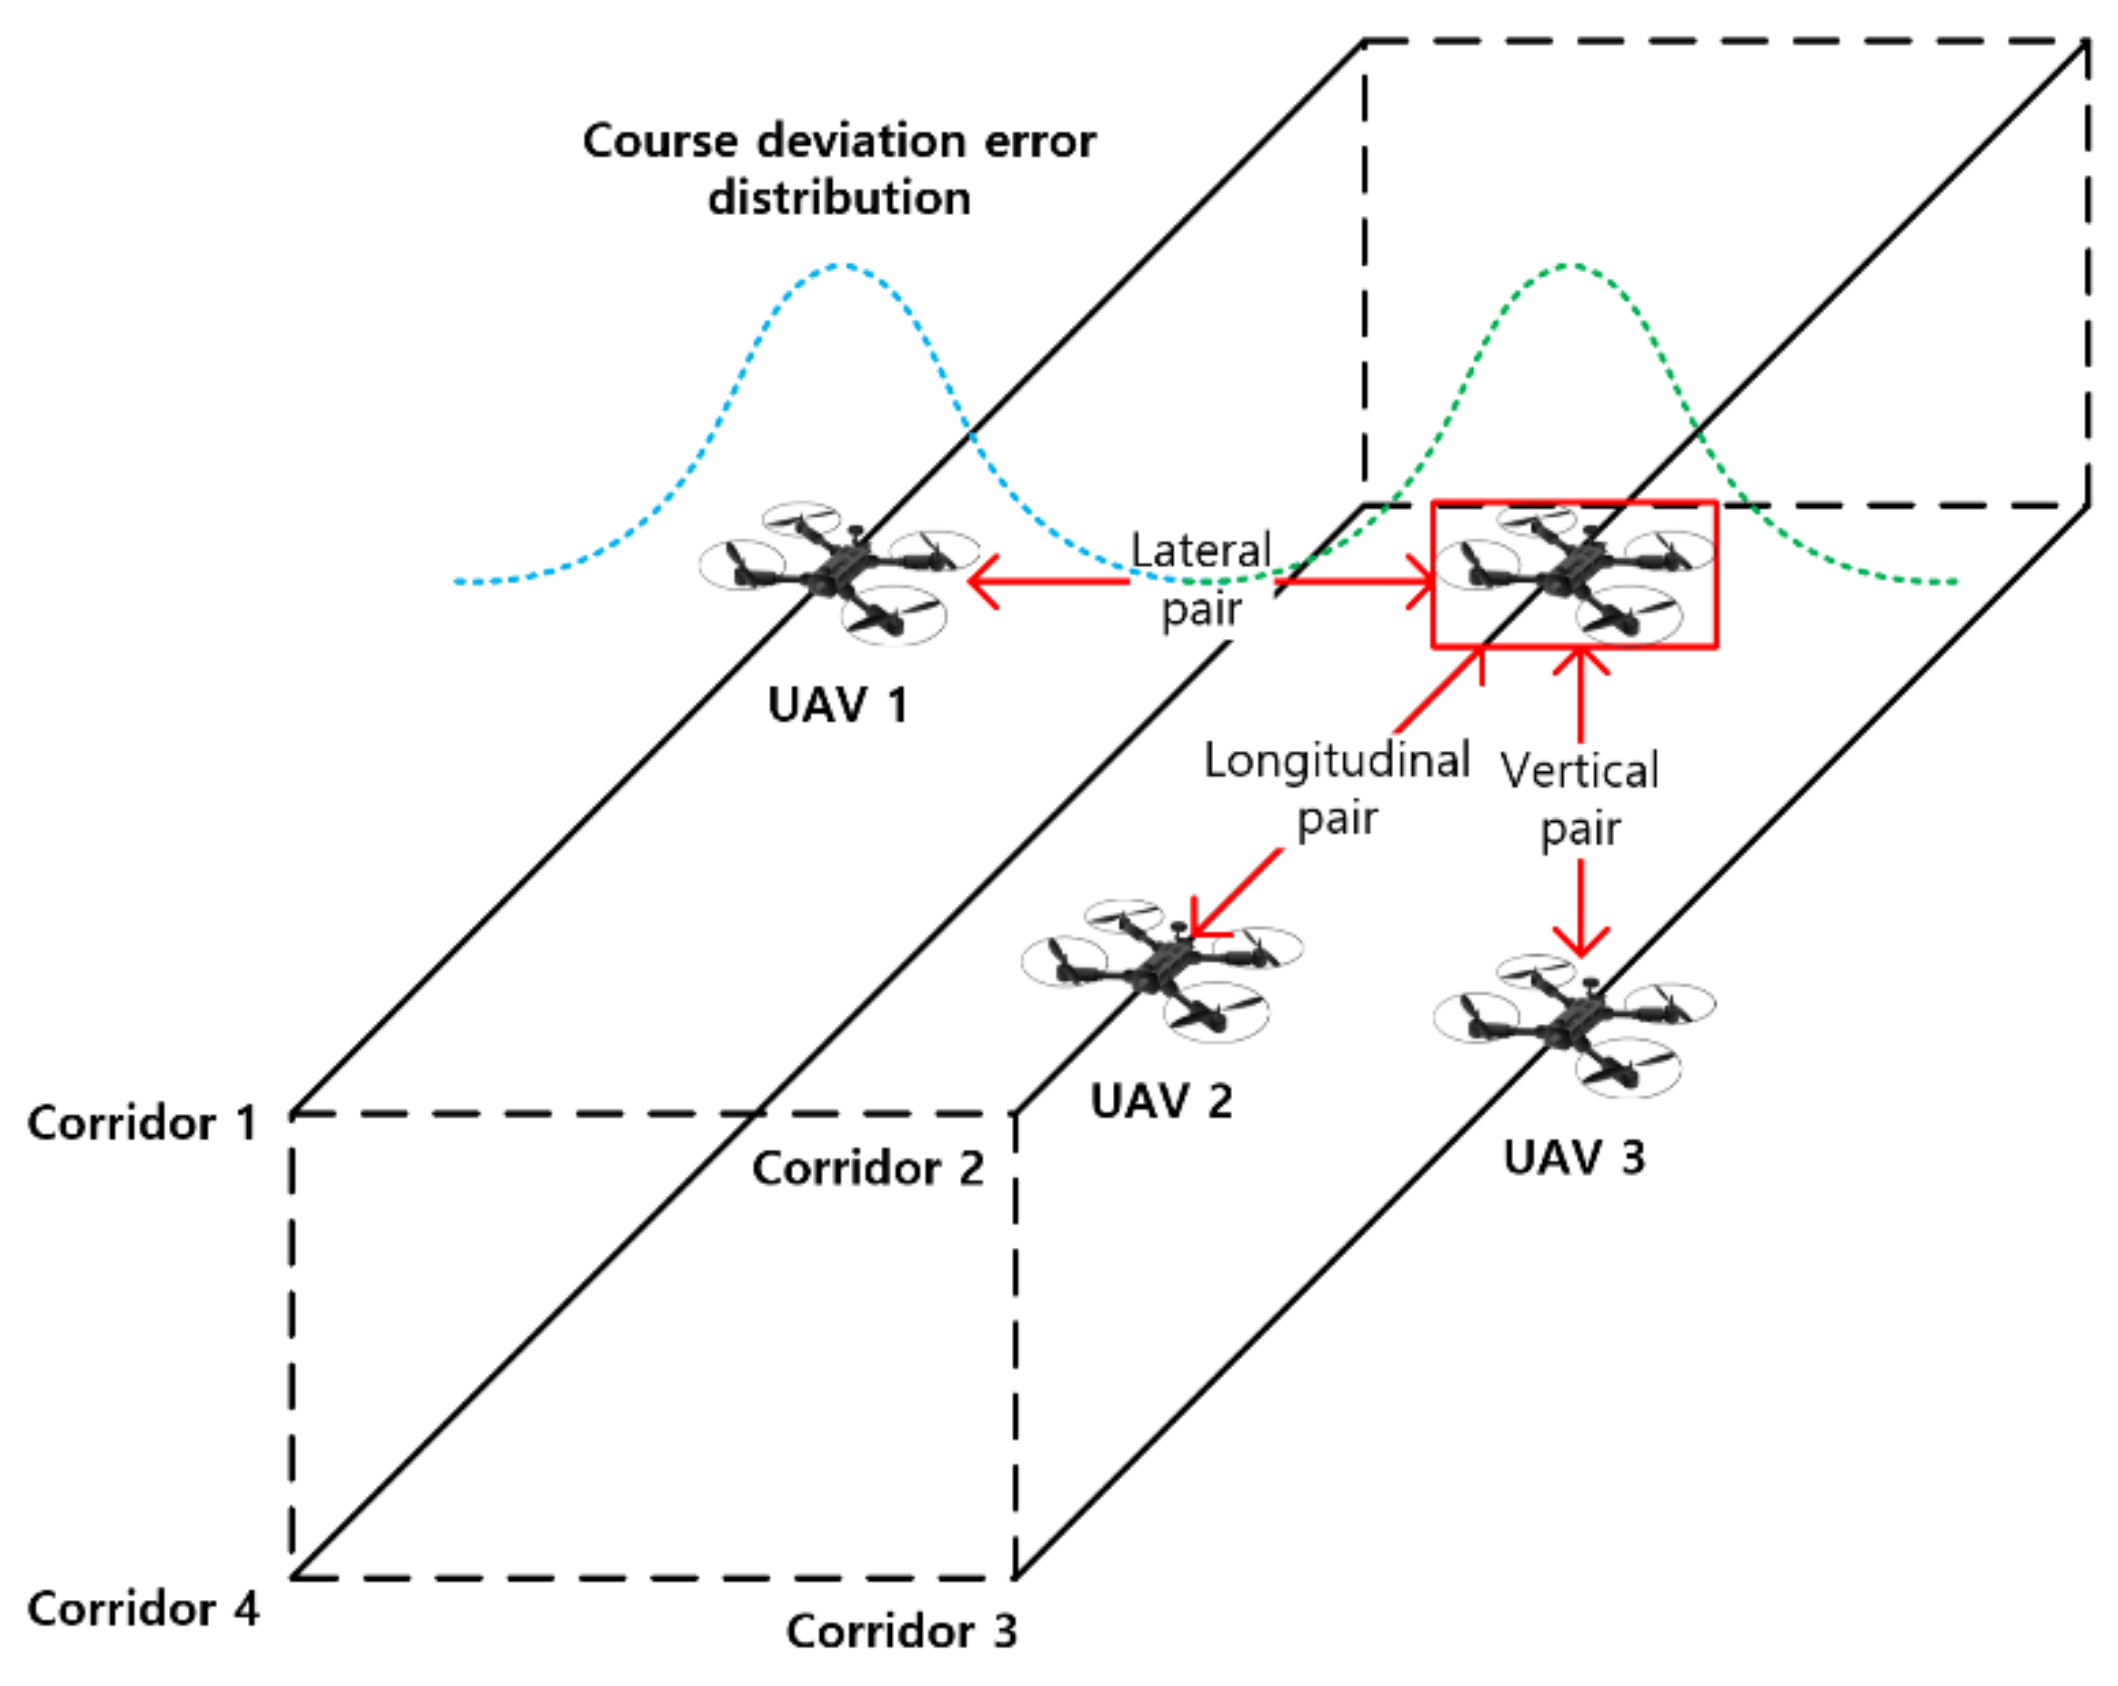
In the Reich model, the collision risk is evaluated by summing the collision risk of the pairs of all UAVs in three directions as shown in
Figure 8.
In addition, the total ground risk due to collisions can be calculated similar to the failure cases as in Equation (12).
In Equation (11), is the collision risk for longitudinal pairs of UAV; is the that in the lateral direction; and is the that in vertical direction.
The collision risk for all the lateral pairs of UAV was computed as follows [
26,
46]:
In Equation (13),
is the lateral overlap probability of two UAVs that are laterally separated by
;
is the vertical overlap probability of two UAVs at the same level;
,
, and
are the average of the longitudinal, lateral, and vertical sizes of the UAV;
is the average speed of the UAV;
,
, and
are the relative velocities of the two UAV in each direction;
and
are the same direction and opposite direction occupancies;
,
,
, and
were determined from
Table 1, and
,
, and
were determined by referring to a previous study [
20].
The lateral overlap probability,
, can be computed as follows [
47]:
In Equation (14),
is the probability density of lateral navigation errors that can be written as follows using the double double exponential distribution (DDE) [
22,
26,
47]:
where
and
are the parameters for nominally and poorly navigating UAV;
can be computed by using the RNP value representing 95% of the lateral positioning accuracy;
is selected the same as with the lateral separation,
[
26,
47]; and
is the weighting factor representing the percentage of UAVs that experience lateral navigation anomalies. In this study, the RNP value was determined based on the 95% position accuracy of the KASS (Korea Augmentation Satellite System), which is the SBAS (Satellite-Based Augmentation System) for Korea. The KASS is under development for APV (Approach with Vertical Guidance)-1 level performance, which is 16 m of 95% horizontal accuracy and 20 m of 95% vertical accuracy [
48]. Note that in this study, the flight technical error was neglected in the RNP because it is known and continuously controlled to be small by a flight control computer which is presented at the submeter level for UAVs in the literature [
49]. In addition,
was assumed to be 0.05, which is the conservative value in the case of manned aviation [
47]. It means that 5% of UAVs experience a lateral navigation anomaly. In the literature,
is in the order of 10
−4 in manned aviation [
47].
The vertical overlap probability,
, can be computed as follows [
47]:
In a previous study that aimed to apply the Reich collision risk model to UAV, the vertical overlap probability was extrapolated from the manned aviation data and computed as 0.0393 [
20]. Moreover, we computed the vertical overlap probability by using double exponential distribution for
with 20 m of 95% vertical positioning accuracy of the KASS. The resulting vertical overlap probability was computed as 0.0363, which was similar to the values in a previous study. Thus, in this study, we used 0.0363 as the vertical overlap probability.
The same direction and opposite direction occupancies
and
can be computed using Equation (17) by applying the steady-state flow model [
47]. The occupancies for the lateral collision risk model were computed for the lateral pairs of UAV in
Figure 8. Note that no distinction was made between the same and opposite direction traffic [
24]. The occupancy in Equation (17) was computed for overlapping pairs rather than proximate pairs, which is convertible by matching with Equation (13) [
46].
In Equation (17),
represents the traffic flow rate of each corridor;
is the corridor index in the lateral direction; and
is the corridor index in the vertical direction. The corridor system considered in this study, as shown in
Figure 7, had only one corridor in the vertical direction; therefore, in this case, the vertical corridor index
can be neglected. In the lateral direction, there were two corridors. Thus, the denominator of Equation (17) can be calculated by summing the traffic flow rates of two corridors and the numerator is computed by multiplying the traffic flow rates of the corridors. Note that the same directional occupancy was zero in the case in
Figure 7; only the opposite directional occupancy existed, because there was no corridor pair which had the same flight direction. As a result, the lateral collision risk can be linked with the traffic flow rate using the equations above.
In addition, the vertical collision risk for vertical pairs can be computed similarly as follows:
Note that the occupancies are computed for the vertical pairs of UAVs in
Figure 8. In this study, there were no UAV pairs in the vertical direction because only one corridor existed in the vertical direction. Therefore, the vertical collision risk was zero in this case.
Regarding the longitudinal collision risk, the model for computing the risk was different from the lateral and vertical directions, because its operational nature is that the aircraft is flying in the longitudinal direction and the assumption of air traffic controller intervention in the longitudinal direction which will be replaced by the UTM in the case of UAV. In the airspace planning manual published by ICAO, the longitudinal collision risk is defined on the basis of the probability of longitudinal overlap of two consecutive aircrafts in the longitudinal direction between the position reporting periods [
26].
In Equation (19), represents the proportion of time that a typical UAV is in longitudinal overlap with another UAV assigned to the same track and flight level. In addition, the rest of the parameters are defined the same as with the lateral and vertical collision risk model.
can be represented as follows [
26]:
where
is the probability density function of longitudinal separation,
, between consecutive pairs of UAVs in the longitudinal direction;
is the probability that longitudinal overlap occurs between times
and
, given an initial nominal separation,
;
is the position reporting period plus the air traffic controller intervention buffer; and
is the longitudinal separation.
can be modeled as follows:
This means that consecutive pairs of UAVs in the longitudinal direction are exactly separated at
. The ideal condition was assumed to compute the capacity of the corridor. In addition, in the traffic data of manned aviation, the actual separation was longer than the separation minima [
50]. Thus, by choosing the probability density function of longitudinal separation, as in Equation (21), the conservative value for the longitudinal collision risk can be evaluated, because the longer the longitudinal separation, the smaller the probability of longitudinal overlap
between reporting periods.
can be written as in Equation (22). This means that the probability of actual separation at
is smaller than
, when the estimated separation at
is
[
26].
It can be formulated as follows by assuming the position error and relative velocity distribution in the longitudinal direction. The detailed derivation process can be found in [
50].
where
is the shape parameter for the probability density function of the longitudinal navigation error of the UAV. In this study,
was determined from the 95% horizontal accuracy of the KASS. It was modeled using the double exponential (DE) distribution as follows [
26,
50]:
Note that, because of the non-simultaneous nature of the position reports of pairs of aircraft, the position of one of the aircrafts in a pair should be extrapolated forward in time to coincide with the reporting time of the other aircraft. Thus, the probability density function of the longitudinal position error of one of the aircraft in a pair is expressed as the sum of two DE random variables; one of the DE random variables represents the horizontal position error of the KASS and another DE random variable represents the extrapolation error [
26]. However, if we assume that the position was extrapolated using GPS (global positioning system) velocity, which is a cm/s level in the literature [
51], and the reporting period of UAV is less than few seconds, then the extrapolation error can be neglected. Therefore, in this study, a single DE distribution function was used to model the longitudinal position error of UAVs.
Moreover,
is the shape parameter for the probability density function of the relative velocity in the longitudinal direction. In the literature, it was also modeled using the DE distribution as follows [
50]:
For
, the average longitudinal relative velocity is presented as 1.0289 m/s in a previous study [
20]; thus, the three values of 95% relative velocity were simulated as 1, 3, and 5 m/s. In the DE distribution, the shape parameter can be computed by dividing the 95% value by 2.996.
Finally, the longitudinal collision risk can be linked with the traffic flow rate as follows:
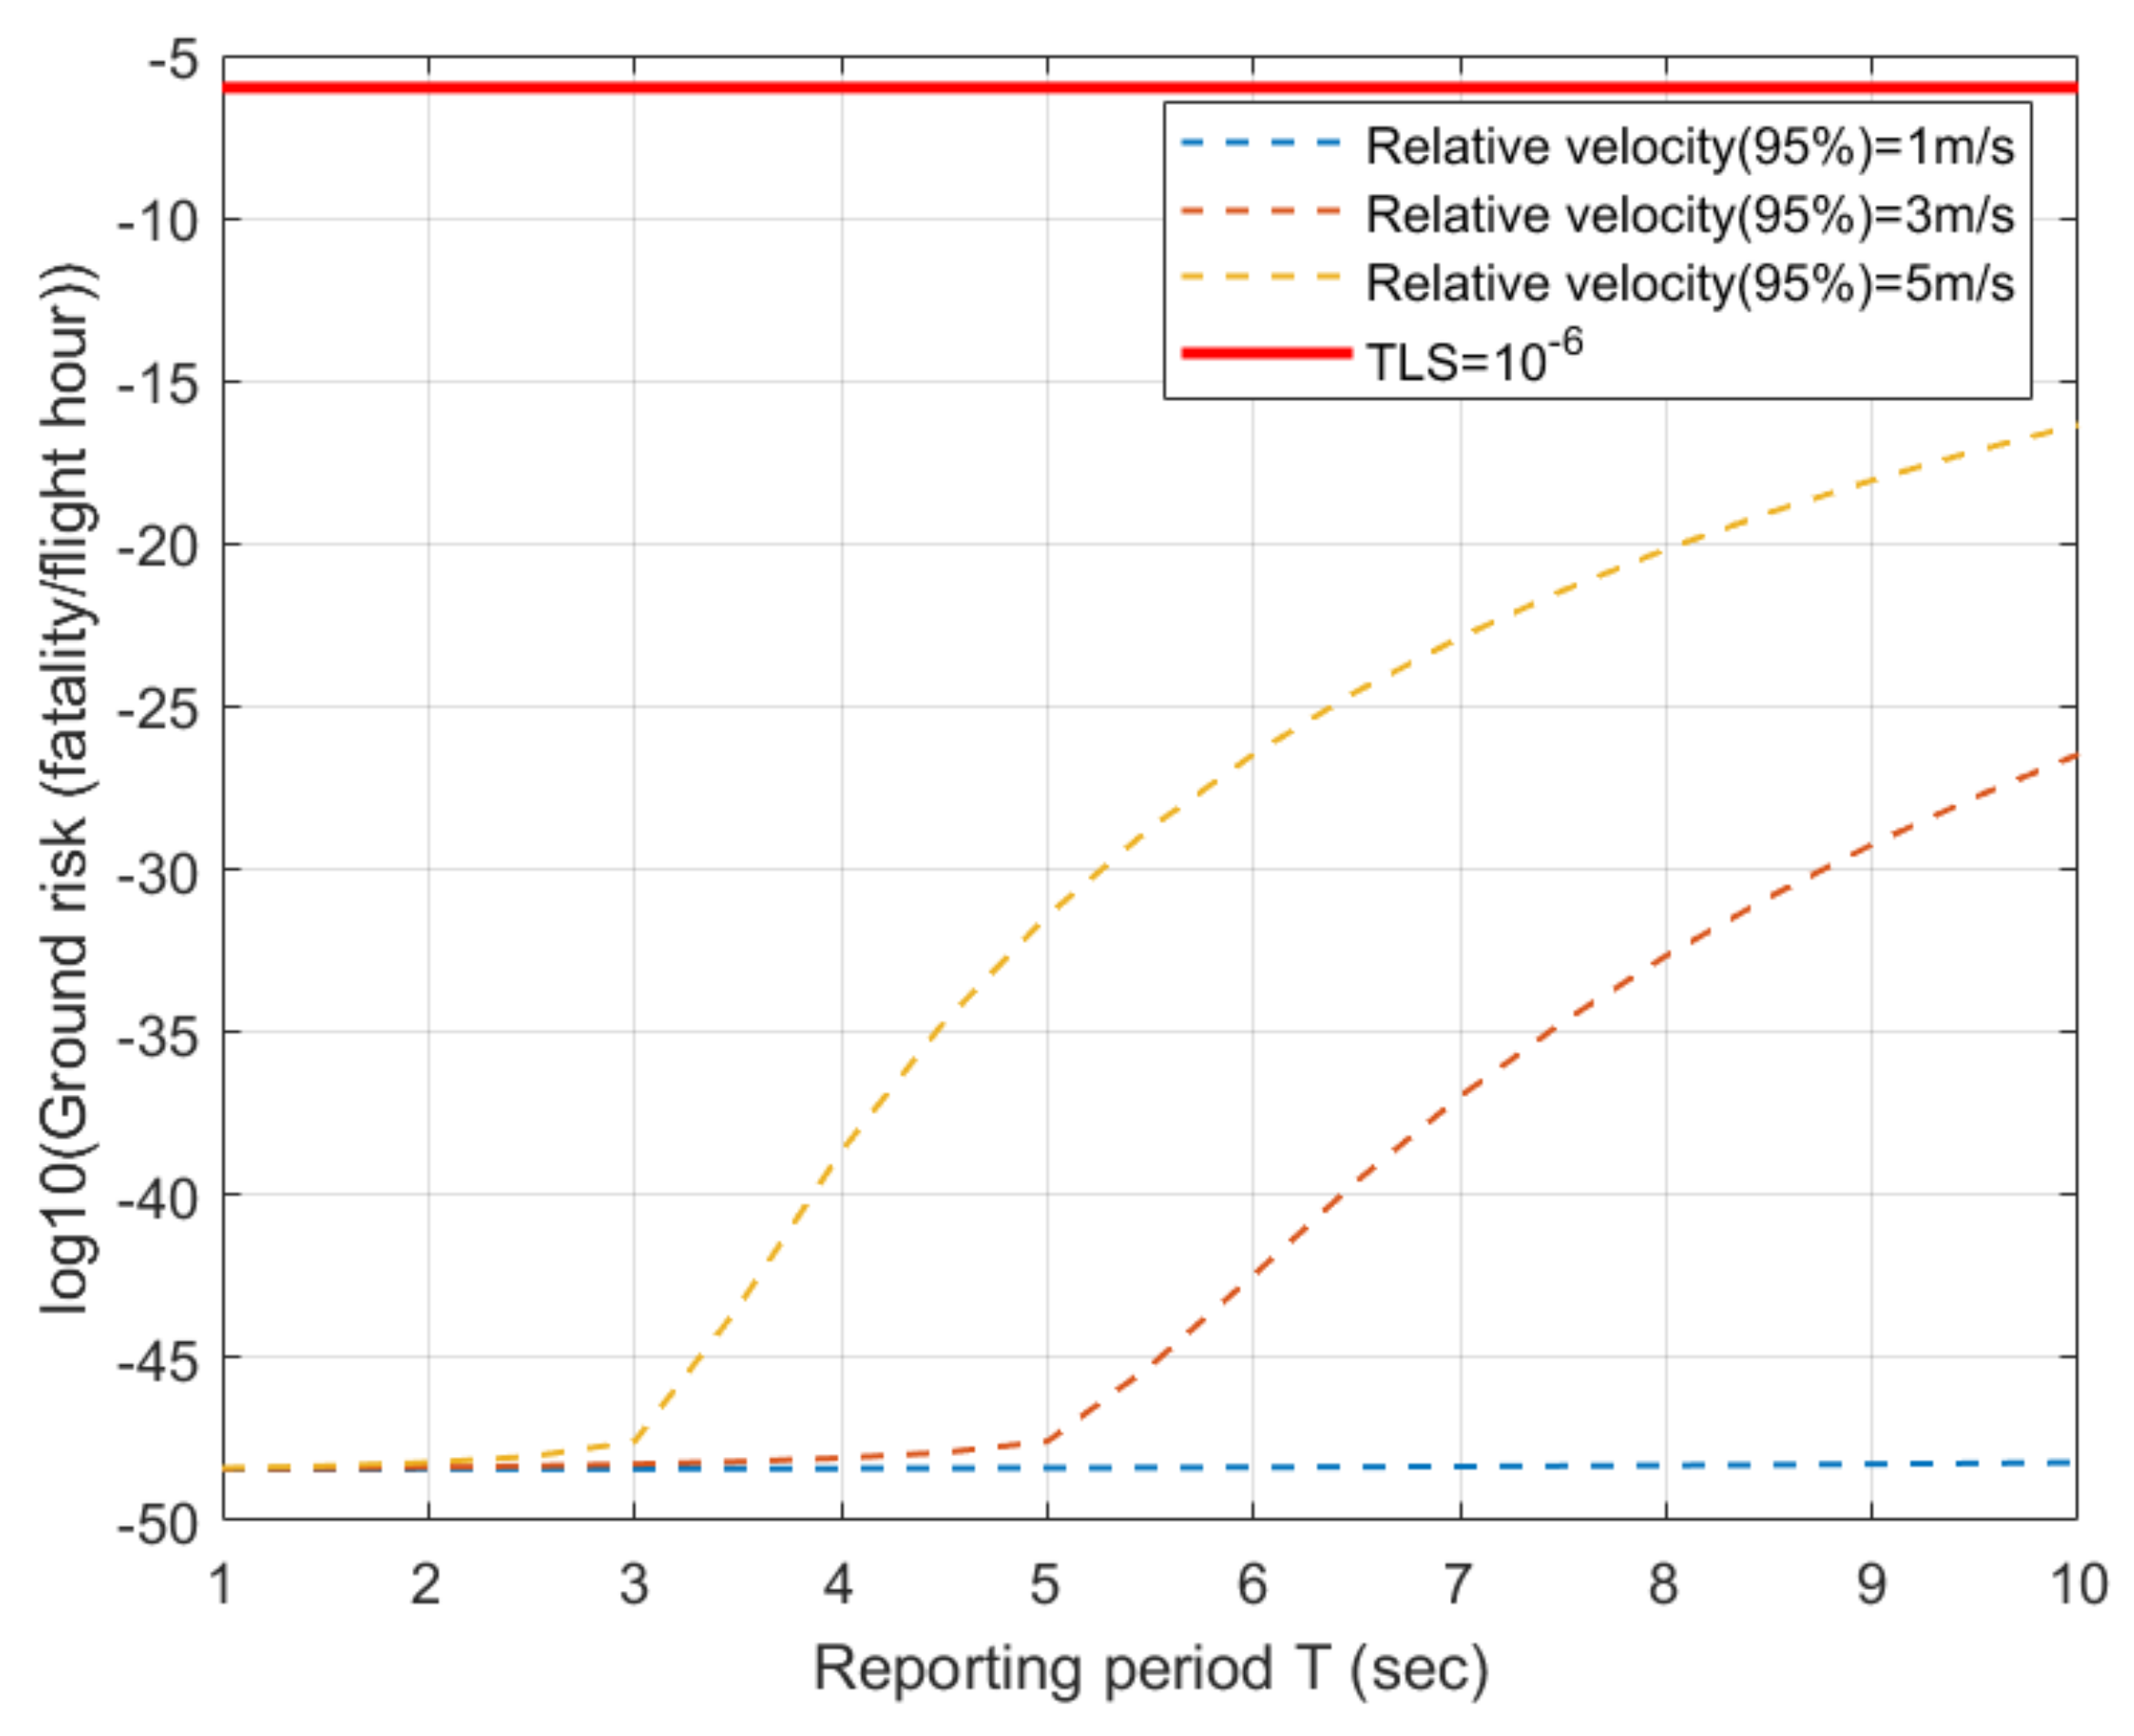
Note that, in manned aviation, the position reporting update rate is much longer than the UAV, for example, 15 or 30 min. However, in the case of UAVs, the reporting period is expected to be very short, such as few seconds. In the literature, it is already mentioned that the longitudinal technical collision risk with high update rate will be very small [
46]. It was also confirmed from the simulation results of this study. The longitudinal collision risk was found to be negligible with a less than 10 s reporting period. As a result, it was found that for a high position update rate condition, the lateral and vertical collision risks dominated the total collision risk. It will be quantitatively described in the next section.
4.3. Capacity Analysis Result for the UAV Corridor
Finally, the ground risk due to collisions and failures can be evaluated using Equations (10) and (12). The target level of safety for third parties on the ground was selected as 10
−6 (fatalities/flight hour) [
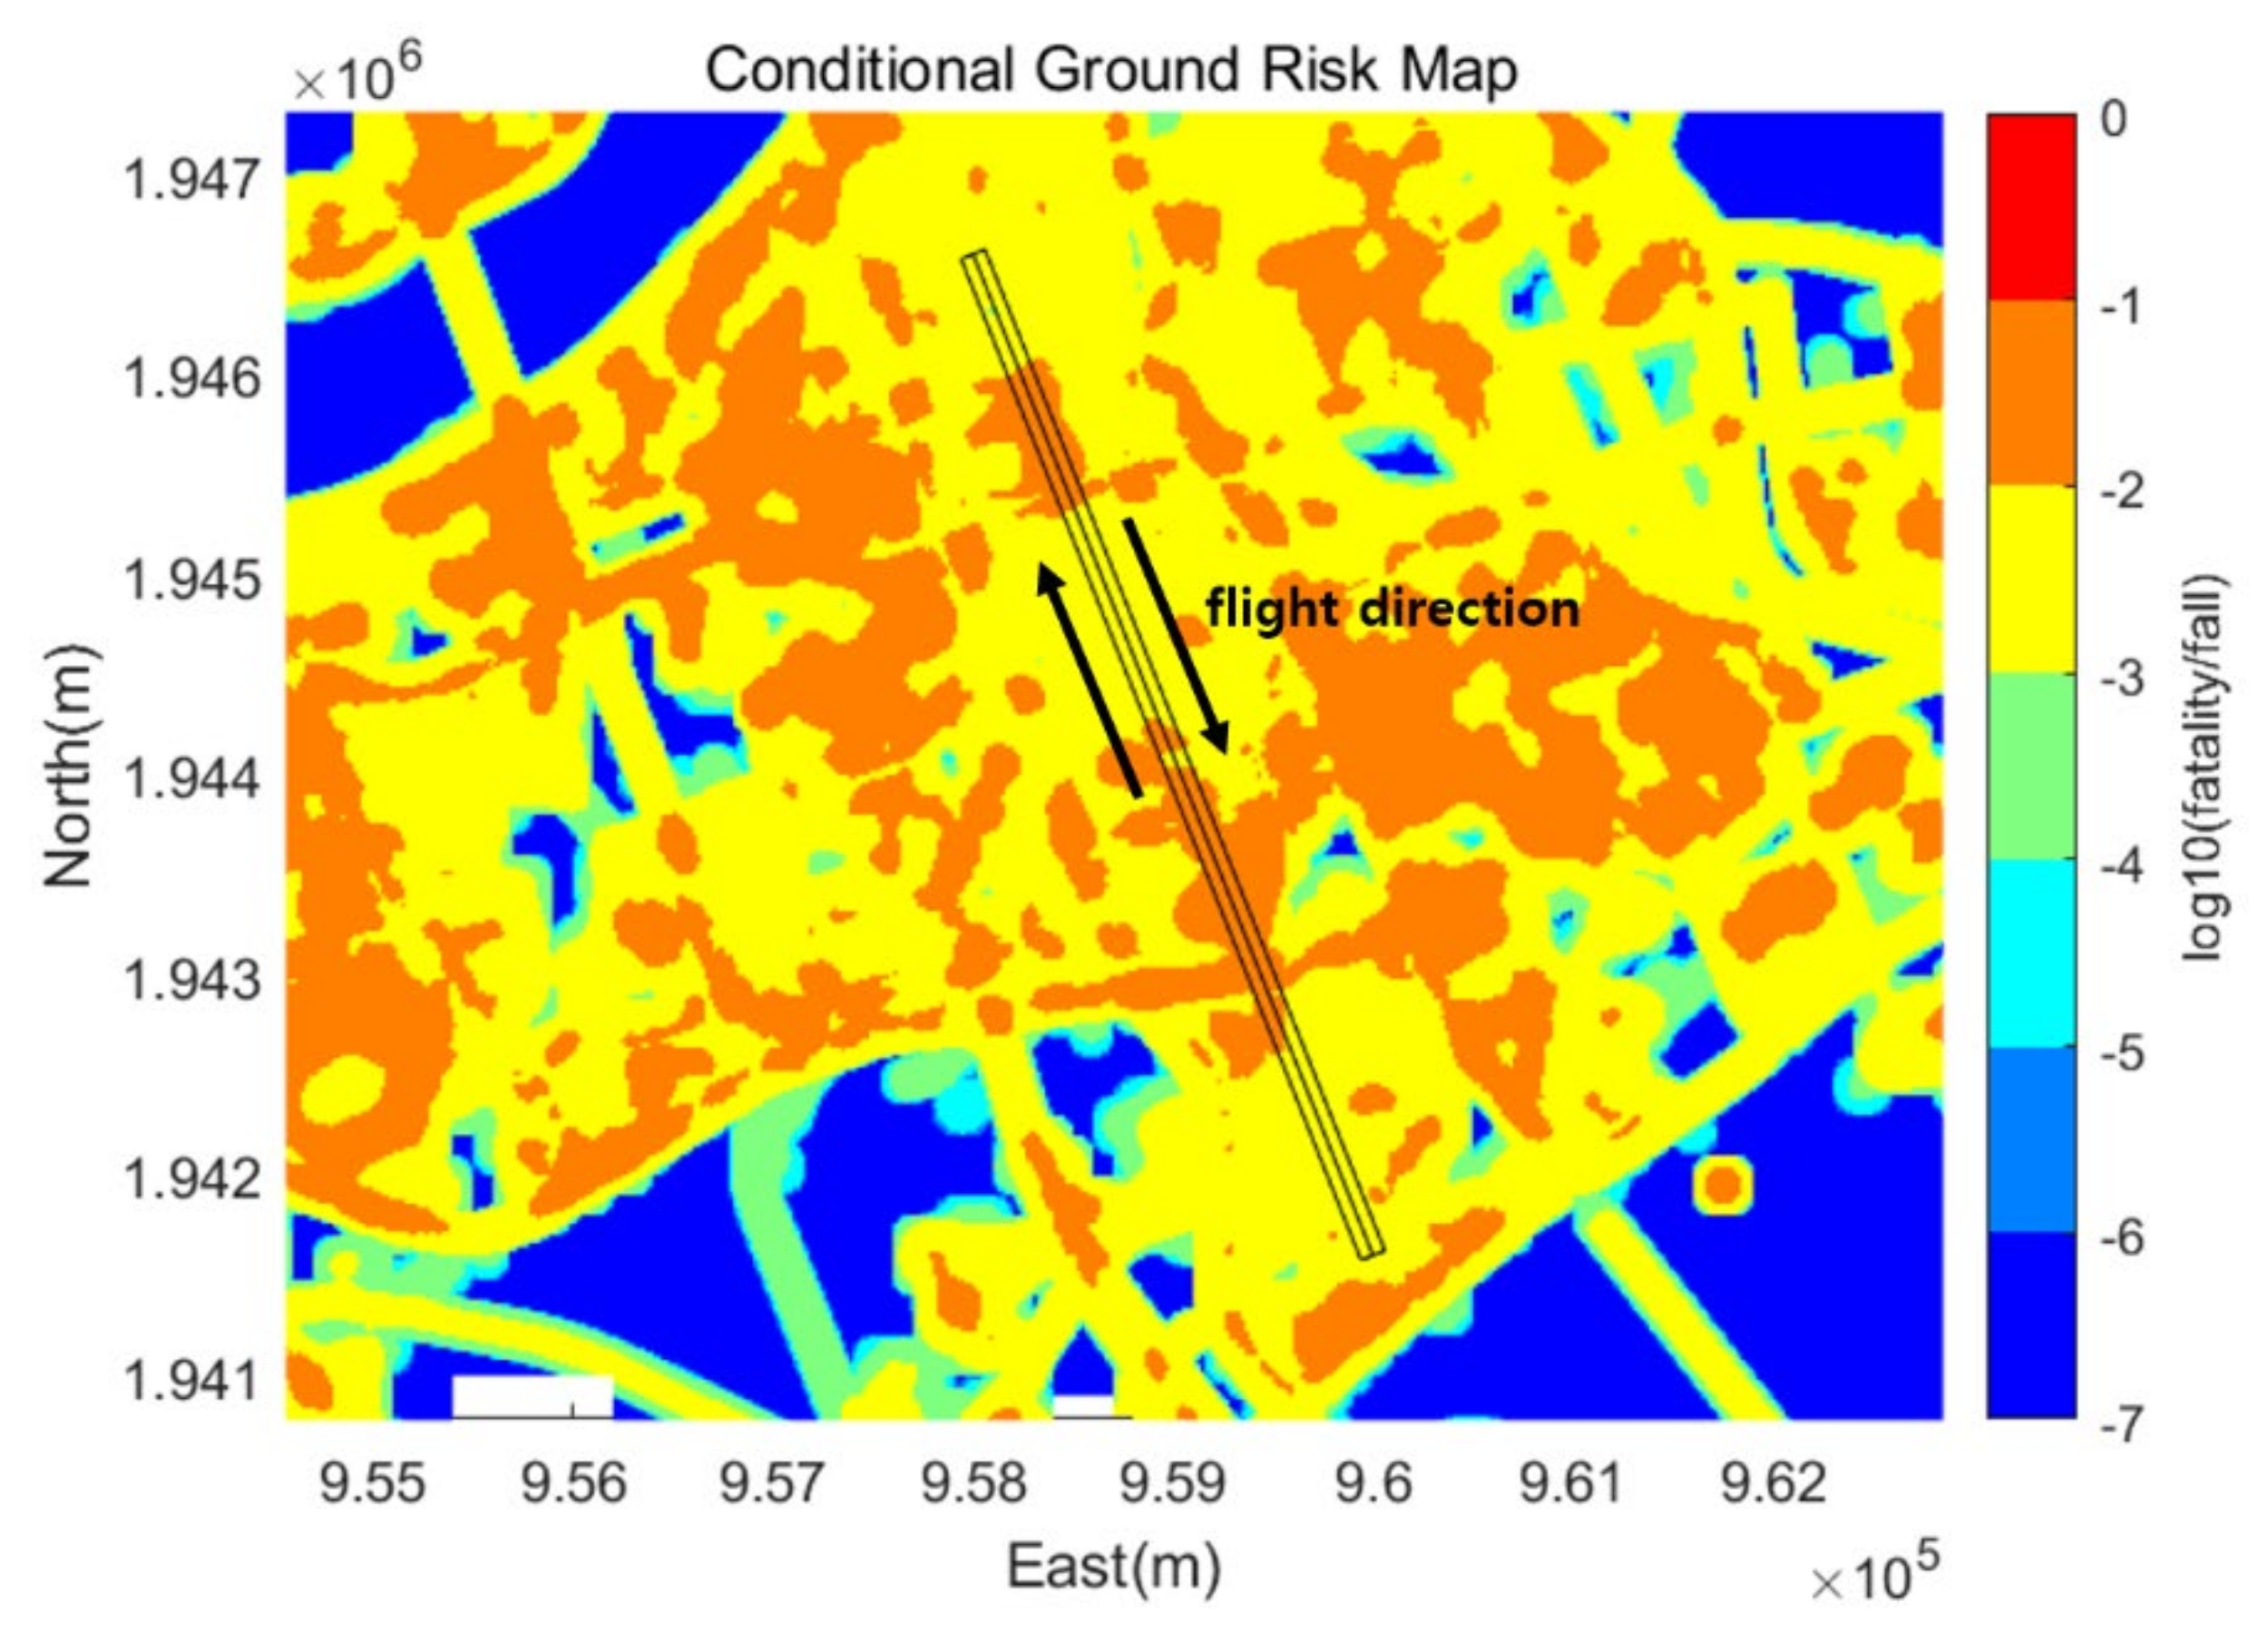
5]. In addition, the conditional ground risk
was computed as 0.049 in
Section 3.5.
We considered two cases of failure rates, as shown in
Table 8, and the parameters used in the lateral and longitudinal collision risks are presented in
Table 9 and
Table 10.
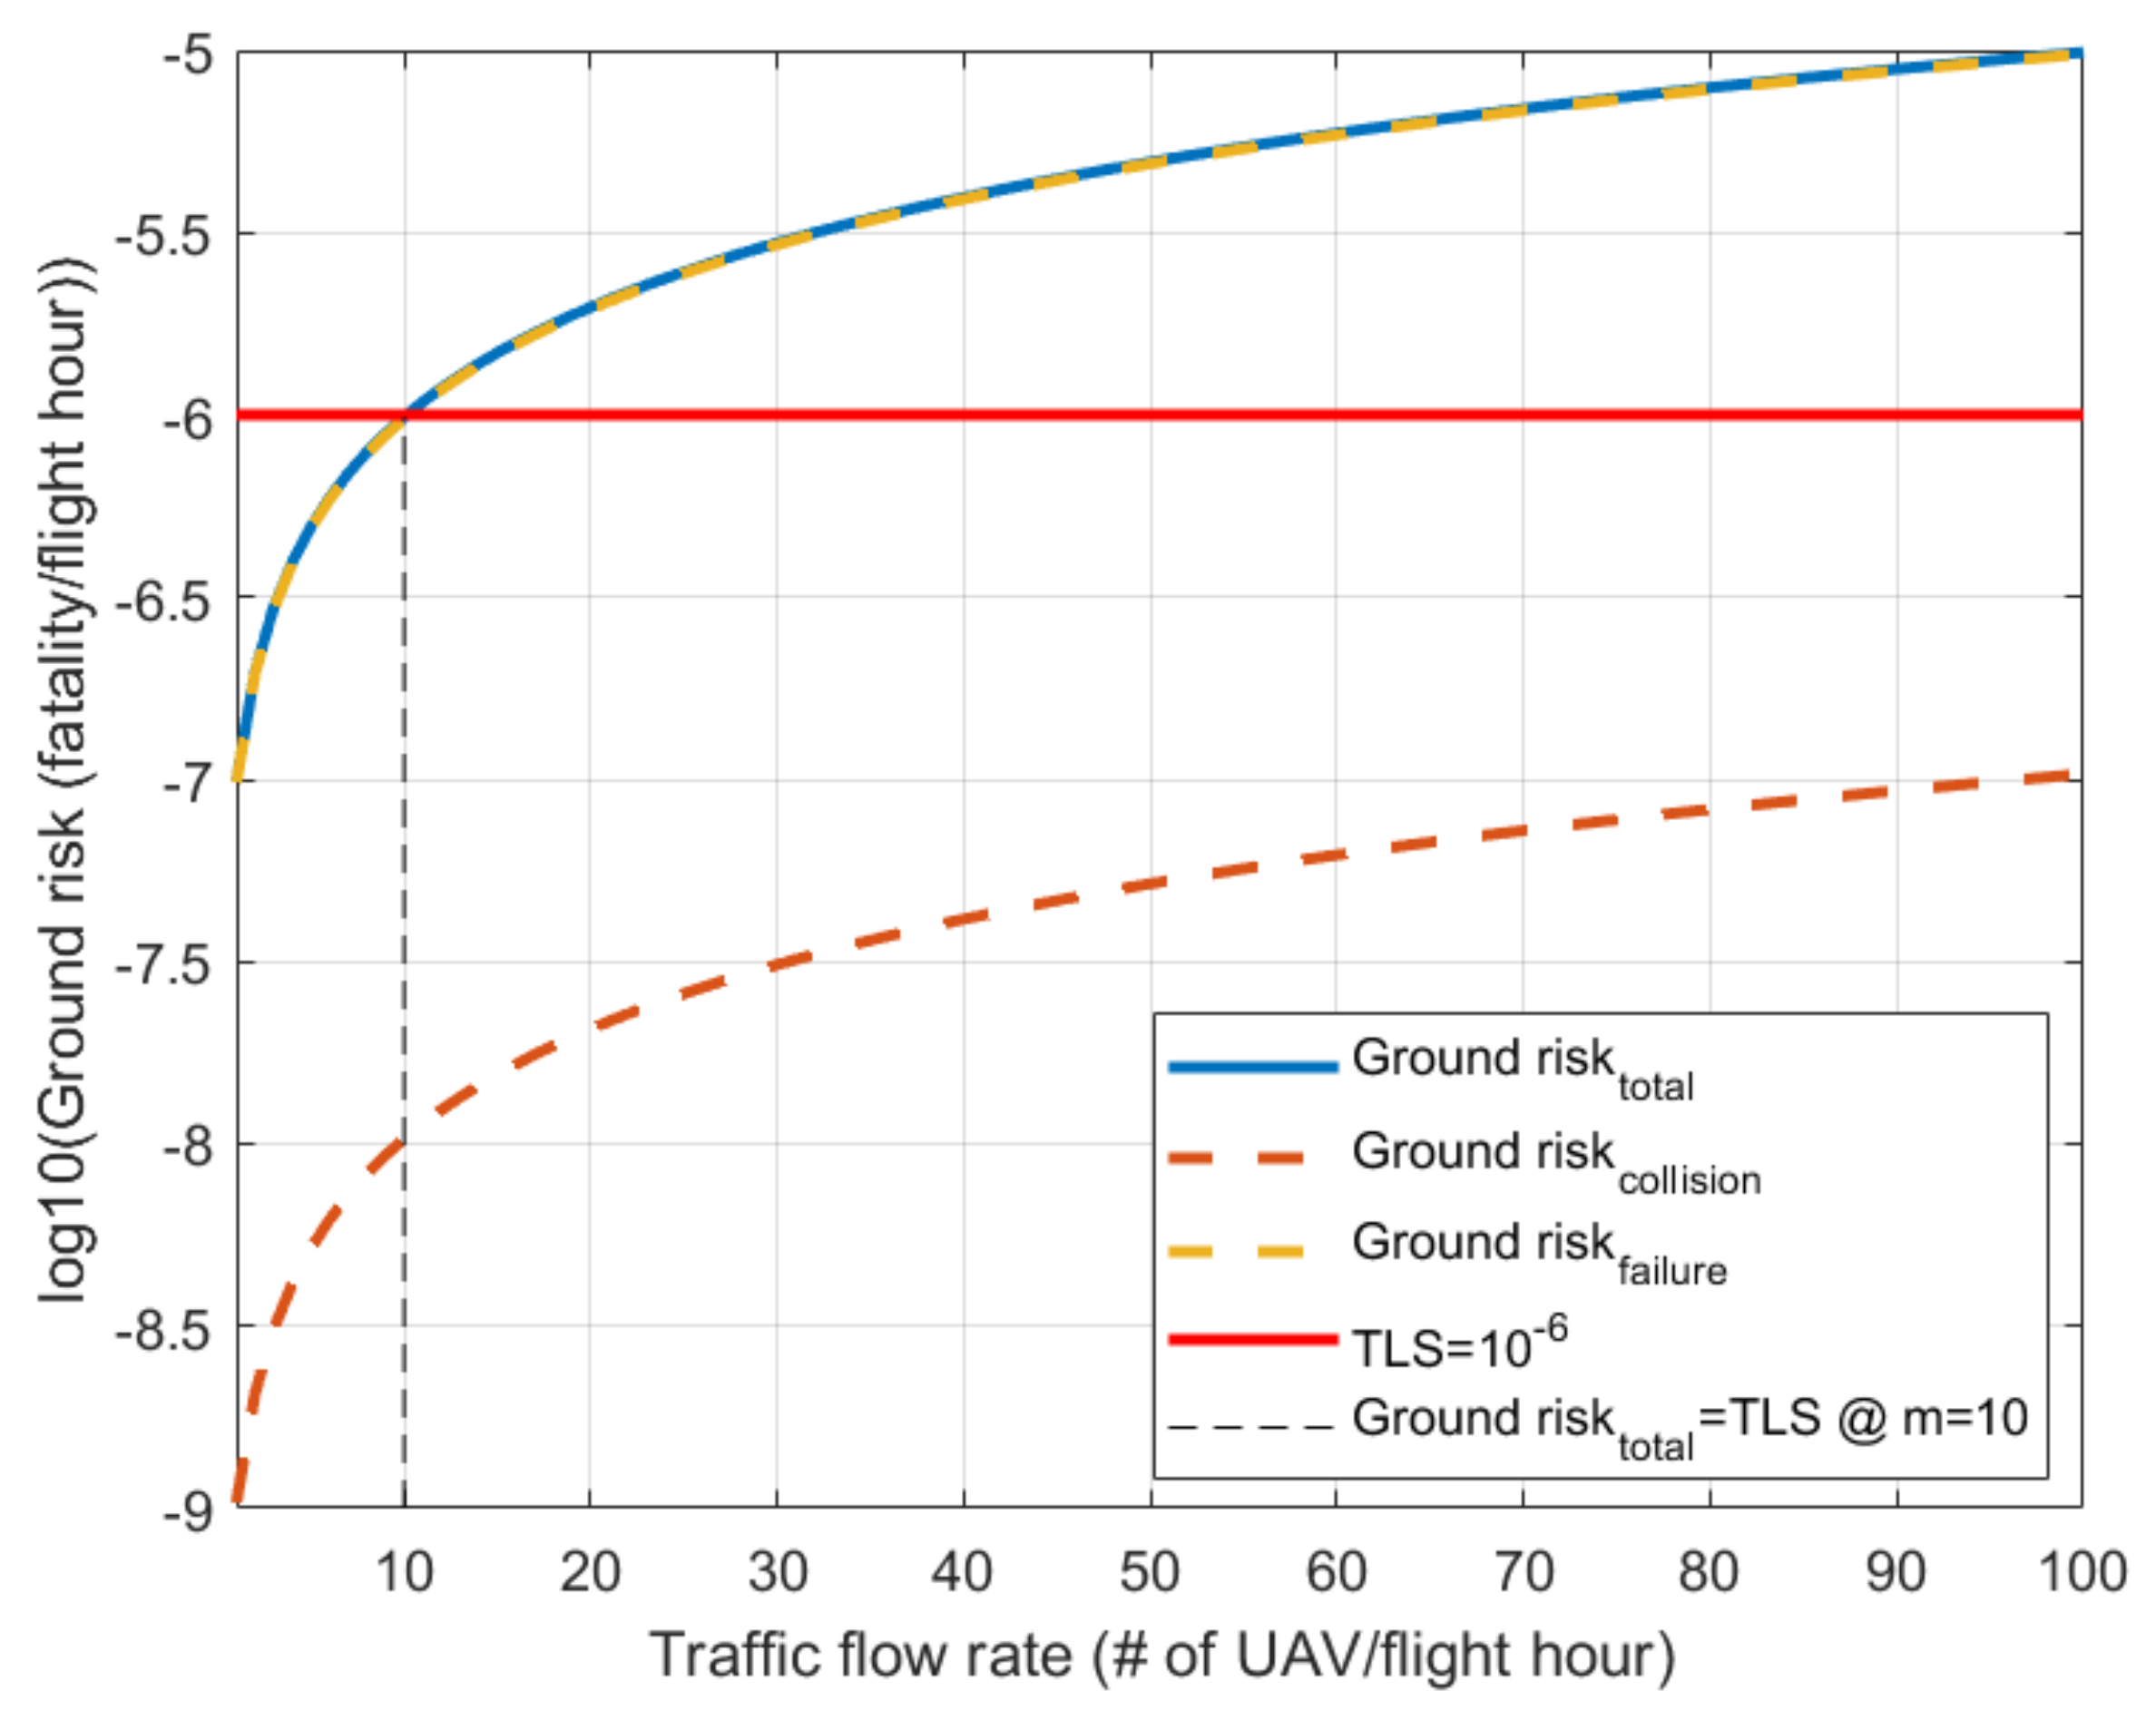
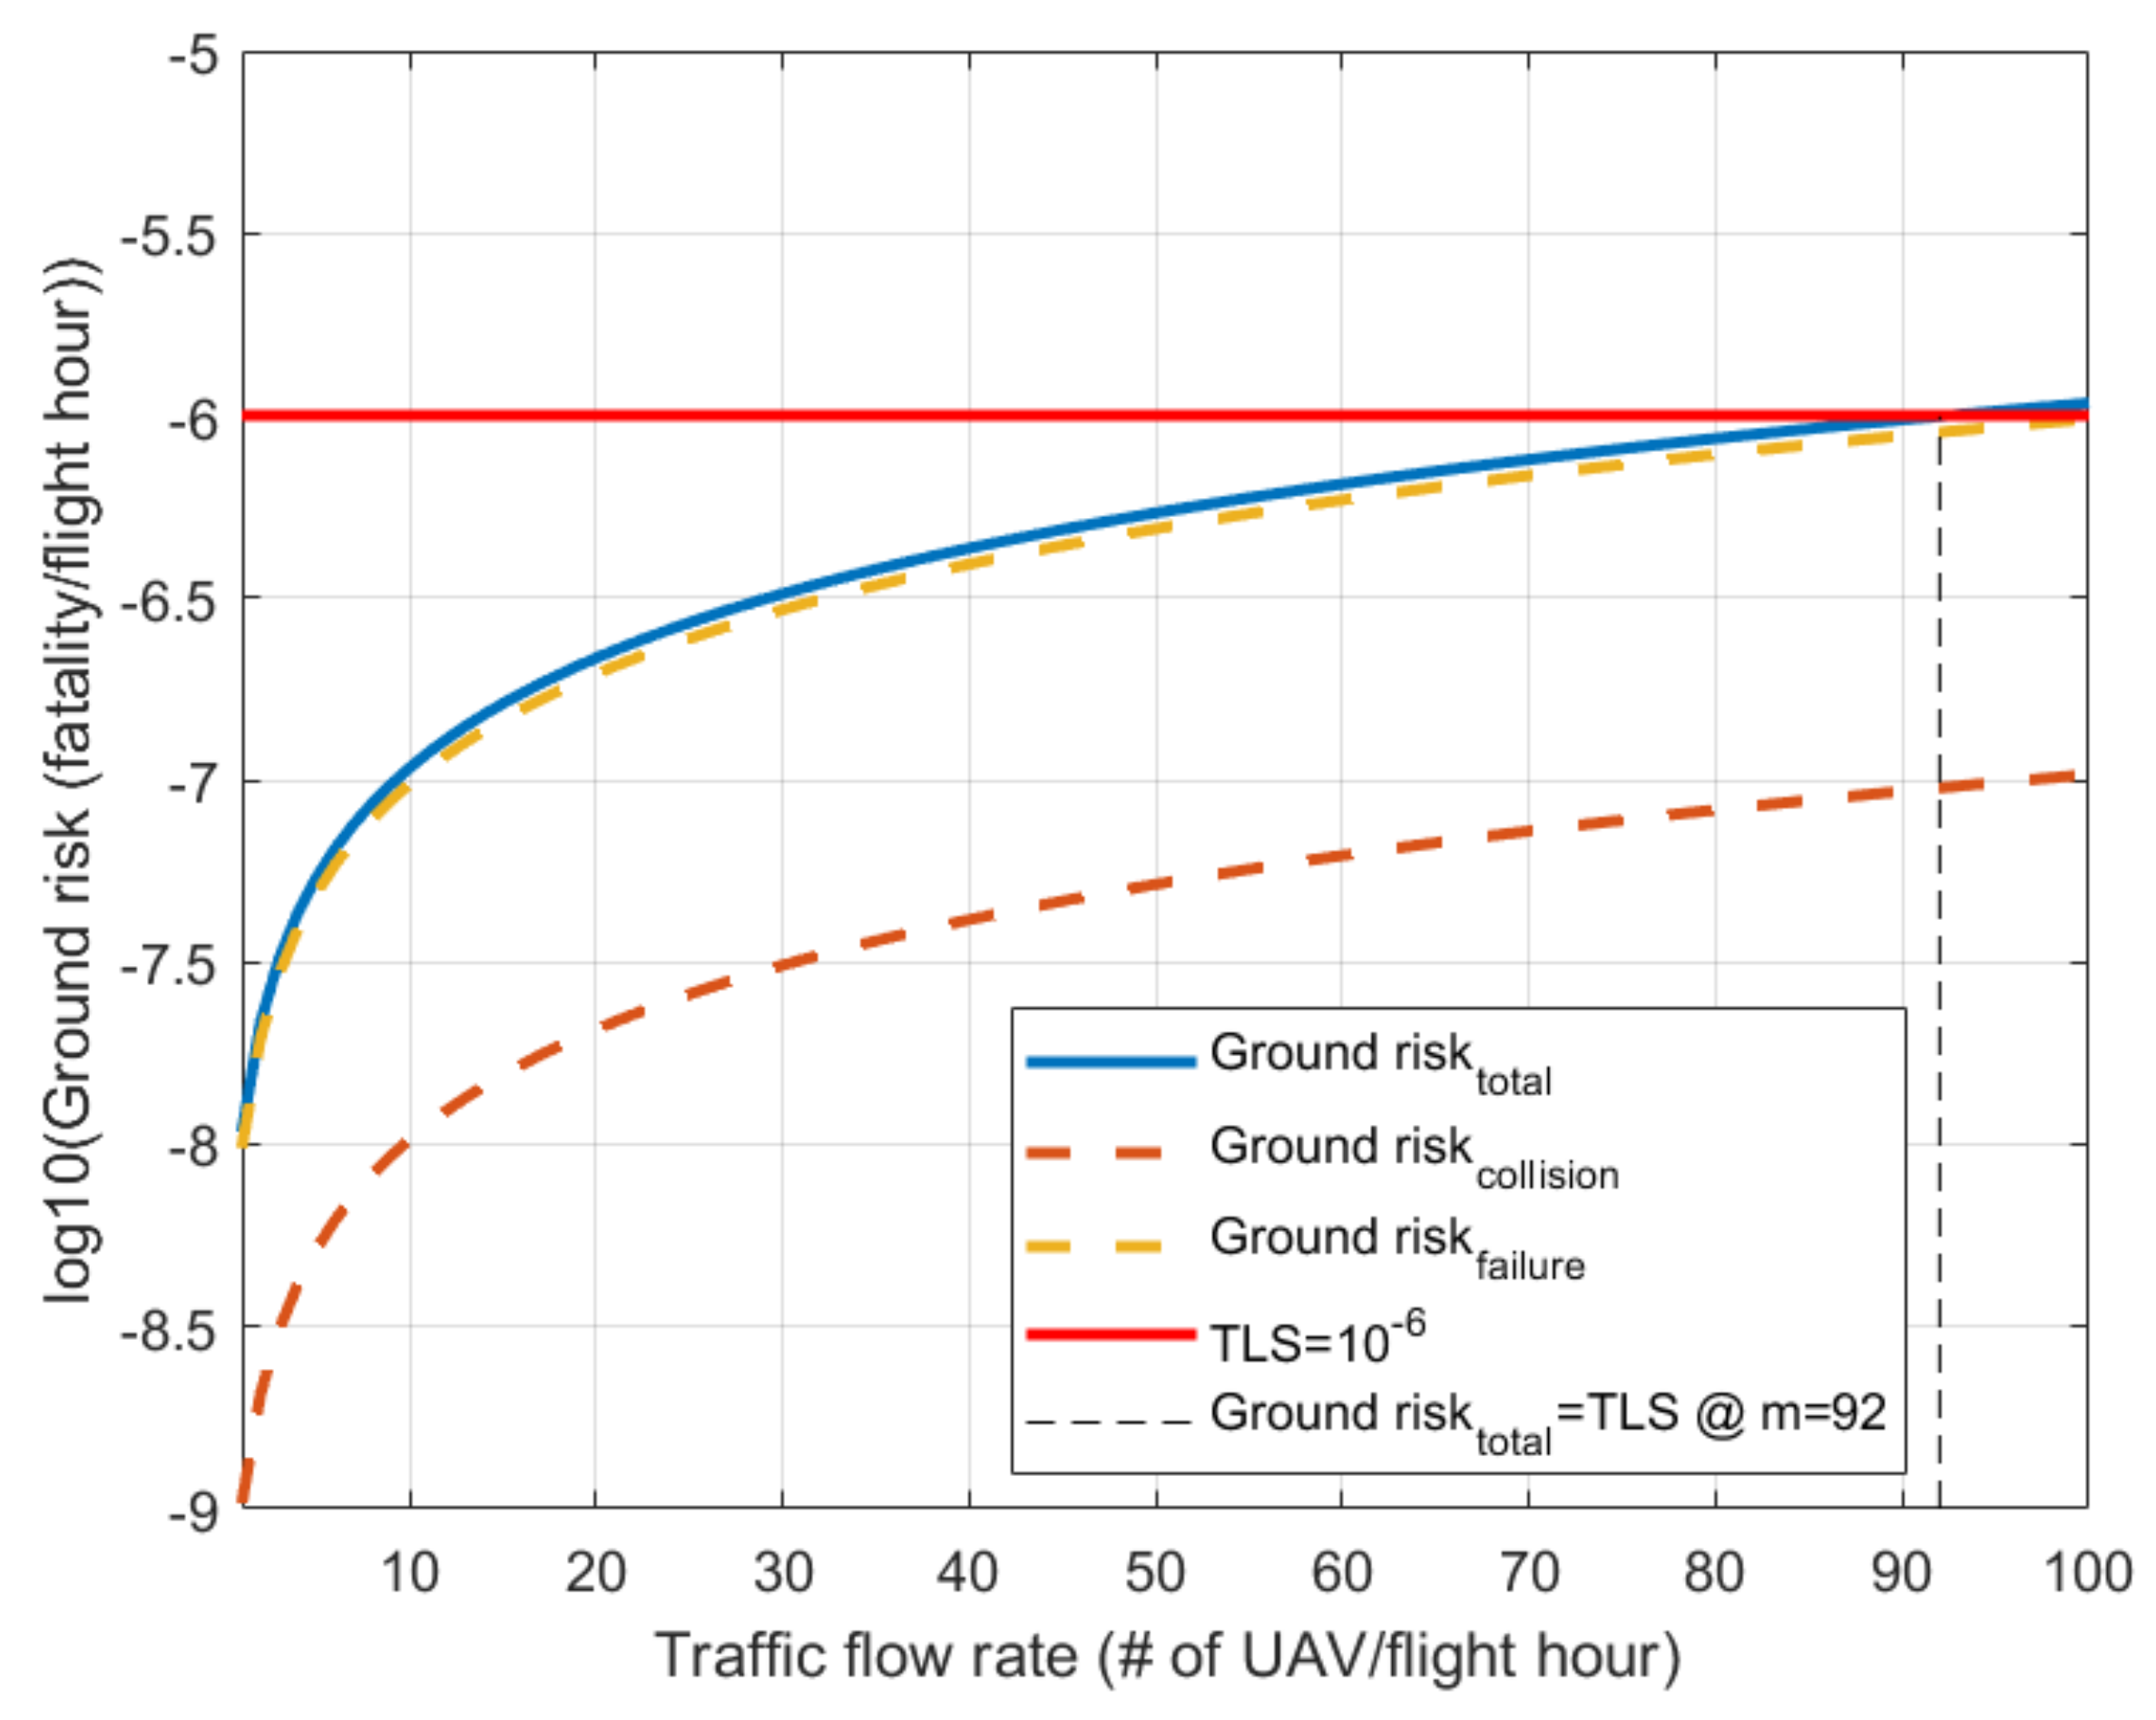
Figure 9 and
Figure 10 show the resulting total ground risk due to failure and collision of UAVs.
Figure 9 is the result of case 1 in
Table 8 in which the failure rate was assumed as 10
−5. Similarly,
Figure 10 is the result of case 2 in
Table 8 with a failure rate of 10
−6. In
Figure 9 and
Figure 10, the total ground risks are evaluated by combining the ground risk due to failure and collision. In this regard, the maximum flow rate of the corridor can be evaluated to satisfy TLS. Note that only the lateral collision risk is considered in the results in
Figure 9 and
Figure 10, because the longitudinal collision risk is negligible, and the vertical collision risk is zero.
For case 1, 10 is the number of UAVs that can be flown in the corridor per hour. In addition, for case 2, 92 is the number of UAVs that can be flown per hour. For convenience, we rounded off the traffic flow rate to the integer value. As a result, the maximum flow rates for both cases are summarized in
Table 11.
From
Figure 9 and
Figure 10, it can be seen that the capacity of the corridor was dominated by the failure rate of UAVs rather than the collision risk. In case 1, the ground risk due to failure was 100 times larger than the ground risk due to collision. In addition, in case 2, the difference was 10 times. If the larger value of the failure rate was used, this difference would increase. Therefore, it can be known from the above results that the failure rate of UAVs is the most important factor for evaluating the third-party risk on the ground.
On the other hand, the ground risk due to longitudinal collisions was also investigated by applying the longitudinal separation of case 2. By using Equation (26), the longitudinal separation can be computed as 587 m. The longitudinal separation was larger in case 1; thus, the longitudinal collision risk would be smaller.
Figure 11 shows the ground risk due to the longitudinal collision risk. The three values of relative velocity were assumed as in
Table 10. For all three values, the ground risks due to the longitudinal collision risk were very small. The maximum value at
and 5 m/s of 95% relative velocity is 2.5661 × 10
−19, which is negligible compared with the ground risk due to the lateral collision risk in
Figure 9 and
Figure 10. This was because of the high position reporting rate of UAVs.
In addition, we investigated the result when number of corridors increased laterally in the case of
. The conditional ground risk was held the same as 0.049. By increasing the number of corridors, the ground risk due to failures would increase by considering Equation (8). In addition, the ground risk due to collisions would increase because the occupancy presented in Equation (17) would increase. If we assume that the corridor was added laterally and the flight direction between two consecutive corridors is opposite and the traffic flow rates of all corridors were identical, then the occupancy in Equation (17) can be written as follows:
Note that the same directional occupancy is zero because the occupancy is evaluated for two consecutive corridor pairs. For this case, every consecutive pair of corridors has an opposite flight direction.
Figure 12 shows the ground risk composition when the total ground risk was equal to TLS in the case of
. It was found that the ground risk due to the failure rate became more dominant as the number of corridors increased. A similar result can be expected when the number of corridors increases in the vertical direction.
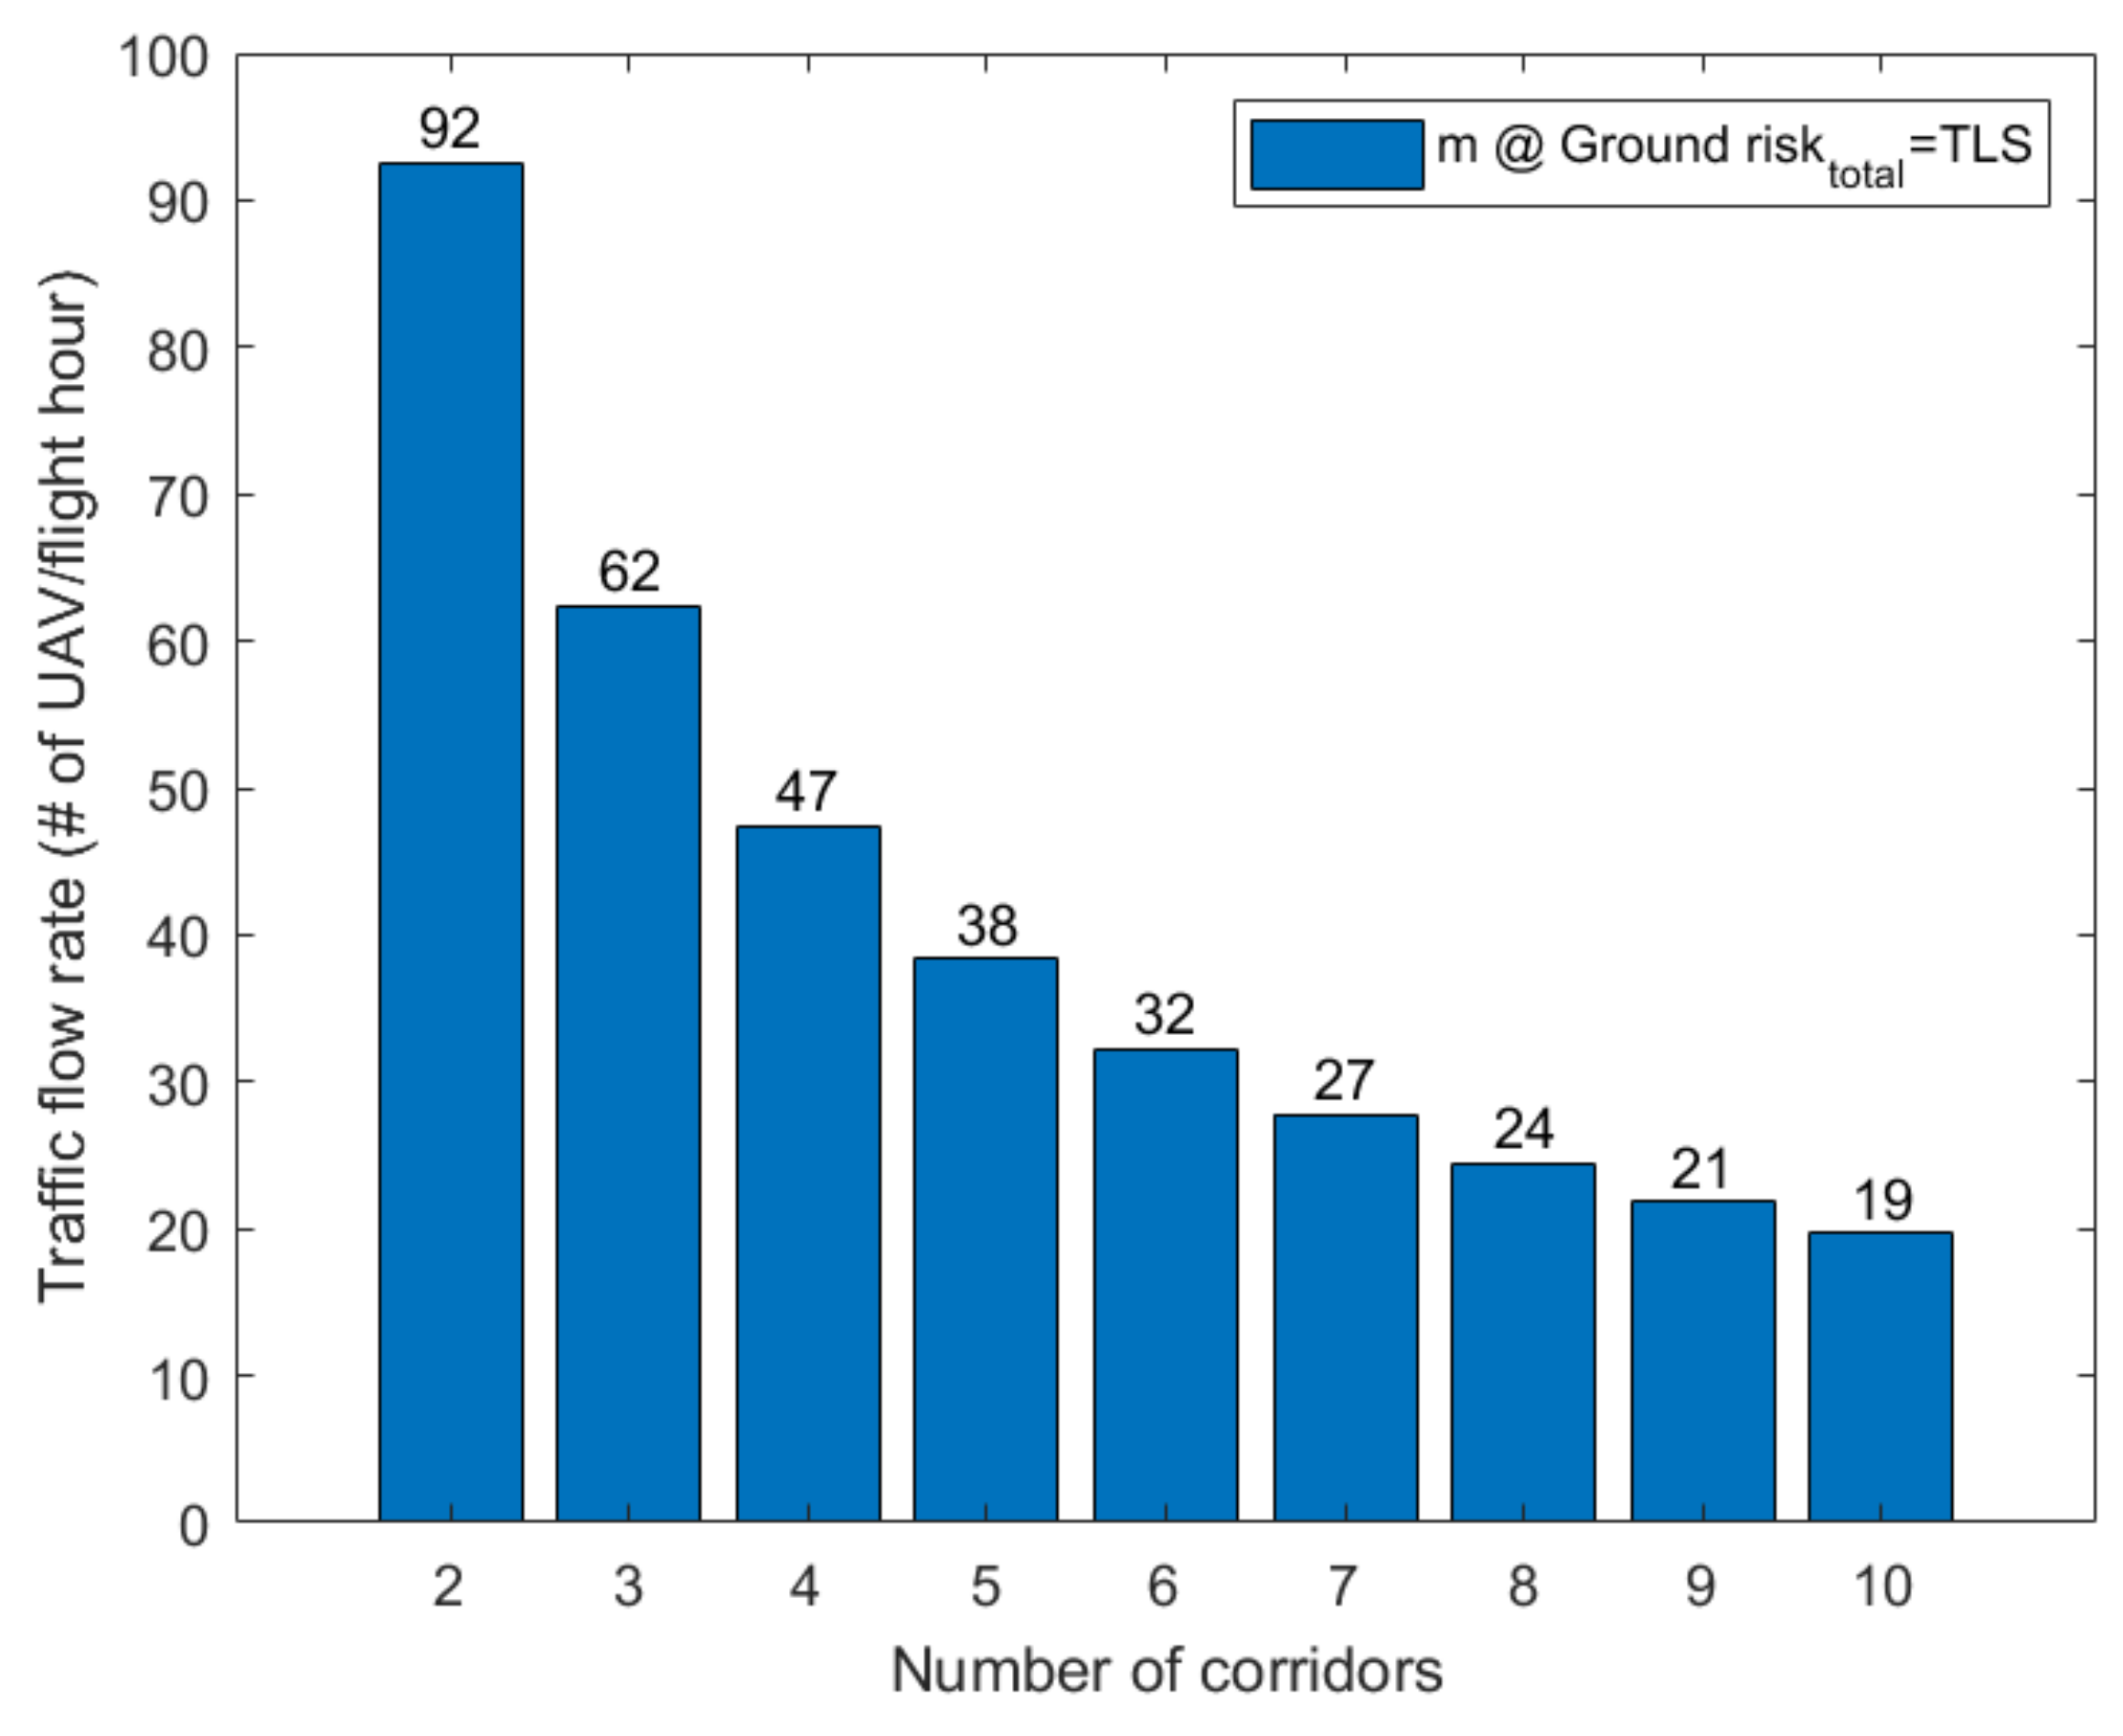
Figure 13 shows the maximum traffic flow rate according to the number of corridors. As expected, as the number of corridors increased, the capacity of the corridor decreased.
In summary, we found that the failure rate of UAVs is the major factor contributing to the ground risk even if the number of corridors increases. This is because the ground risk due to failures is proportional to the number of corridors, , whereas the ground risk due to collisions increased as a function of .


