Article

Payload Capacities of Remotely Piloted Aerial Application Systems Affect Spray Pattern and Effective Swath

by
Daniel E. Martin
* and
Mohamed A. Latheef
United States Department of Agriculture, Aerial Application Technology Research Unit, College Station, TX 77845, USA
*
Author to whom correspondence should be addressed.
Drones 2022, 6(8), 205; https://doi.org/10.3390/drones6080205
Submission received: 7 June 2022 / Revised: 1 August 2022 / Accepted: 9 August 2022 / Published: 12 August 2022
(This article belongs to the Section Drones in Agriculture and Forestry)

Abstract

:
Production agriculture has recently witnessed exponential growth in the use of UAS technology to obtain site-specific, real-time spectral reflectance data for the management of spatial and temporal variability in agricultural ecosystems. The integration of this novel technology and remotely piloted aerial application systems (RPAASs) for pest management requires data curation on spray pattern uniformity, droplet distribution and the operational factors governing such data. The effects of application height and ground speed on spray pattern uniformity and droplet spectra characteristics for four commercially available RPAAS platforms configured with four different payload capacities (5, 10, 15 and 20 L) and factory-supplied nozzles were investigated. Spray pattern was determined by a cotton string deposition analysis system. Spray droplets captured on water-sensitive paper cards were analyzed using a computer-based scanner system. The test results indicated that each RPAAS platform of varying payload capacity was able to produce an acceptable spray pattern. As the payload capacity increased, so did the effective swath. However, the effective swath was comparable between 15 and 20 L units. The theoretical spray application rate decreased with ground speed. The fundamental data reported here may provide guidance to aerial applicators and help in the furtherance of RPAASs as an effective pest management tool.

1. Introduction

The use of remotely piloted aerial application systems (RPAASs) or unmanned aircraft systems (UASs) equipped with high throughput data processing systems to locate and spray at desired locations at different heights and ground speeds with increased precision has gained traction recently in production agriculture in East Asian countries [1,2,3]. In India, where 50% of the population is dependent on agriculture, researchers have advocated the use of UASs for crop monitoring and the application of pesticides and fertilizers [4,5,6]. The book edited by Chakravarthy [7] deals with harnessing UAS technologies in the 21st century and described chapters on satellites, remote sensing, pest surveillance and management as applicable to South Asian countries. Kestur et al. [5] reported that multi-rotor configurations with 10–15 L spray tanks are more popular for agricultural use because they are inexpensive and simple in design; however, the cost of drones is prohibitive for most small and medium farmers for pesticide spraying in the Indian subcontinent. Nevertheless, Yallappa et al. [8] and Shaw et al. [9] designed and developed a hexacopter and an octocopter with 5 and 6 L tanks, respectively, to spray pesticides on small farm holdings in southern India. Giles et al. [10,11] tested an 8 L capacity 100 kg helicopter UAV to spray pesticides on a commercial vineyard in California and found that the spray deposition was comparable to a grower standard application. In Spain, Martinez-Guanter et al. [12] mounted a spray application system with a 5 L tank on a UAS to spray a commercial insecticide as a bait for fruit flies on olive and citrus trees and found that the application cost was comparable to that of conventional equipment. Huang et al. [13] developed a UAS helicopter spray application system with a 5.7 L spray tank mounted on the undercarriage to precisely apply low-volume chemicals with fine droplets for vector control. These drones are usually single-rotor or multi-rotor platforms with a spray tank volume of 5 to 20 L and are especially suited for the low altitude and low payload spraying of small farmland crops against various pests and diseases [14]. The US military UASs also are limited by the size of their payload and endurance [15]. He, Carey, [15] replaced the electric motor of an RQ-11B platform with photovoltaic cells, a renewable source of energy, attached to the wing of the aircraft, which extended the flight time and increased the payload capacity as well. Heavy payloads reduce the flight time of UASs; however, if a UAS has more surface area and motors, then it can store more power, which increases flight time and results in an increased payload which can help the aircraft travel longer with the same accuracy and resolution [16]. Recently, del Cerro [17] provided a comprehensive review of UASs in agriculture and reported on the trade-off between the flight time and payload of the aircraft. If flight time increases by adding more powerful batteries or a higher-capacity fuel tank, the payload decreases due to the increased weight. They, [17], tabulated the values of payload and endurance since these values are strongly interrelated. Increasing the endurance and payload capacities of the RPAAS platforms appear to be the two most important technological challenges facing the spray drone industry in the agricultural sector.
Yang and Mo [18] reported that with more than 60% of the UASs in China having payload capacities less than 15 kg (approximately 15 L), there is a great demand for UASs with larger payloads to cover increasing farm acreages with greater flight times. Wu et al. [19] studied the relationship between farm size and chemical usage in China from farm sizes varying from 0.5 ha to 14.5 ha. They reported that in 2010, 70% of all the farms and 98% of the family farms were less than 2 ha in size. Lu et al. [20] tested and demonstrated a hybrid UAS with a larger payload (25 kg) and flight time to meet the demands of aerial applicators in China. However, in the United States, the regulatory laws, both state and federal, regarding the use of spray drones for pest control operations remain as an impediment to the advancement of RPAASs in production agriculture. Nevertheless, drones have recently received increased attention in production agriculture research in the United States with emphasis on remote sensing for precision agriculture, the inspection of in-season crop growth using spectral sensors, weed identification and determining nutrient variability in the field [21,22,23]. Very few research data exist on protocols for the operation of spray drones on farms in the US and fundamental studies on the operational protocols are essential prerequisites for conducting efficacious aerial applications of agricultural spray products.
The payload of a UAS usually comprises application materials, either liquid or dry [9]. The RPAASs discussed above included models with a payload of varying capacities, spray tank storage, nozzle configuration, landing frame, pump voltage, motors with propellers to produce adequate thrust and lift and battery components to meet voltage and current requirements. A uniform spray pattern is essential to conduct an efficacious spray operation, which is governed largely by application height, ground speed and the nozzle configuration of the RPAAS [24,25,26]. As part of this objective, we sought to determine and characterize the effects of application height, ground speed, effective swath and spray pattern uniformity for drones with varying payload capacities. Additionally, the intent was to determine the droplet spectra of factory-installed nozzle systems on these RPAAS models with varying take-off masses. Although there are many other RPAAS models currently available for use in agricultural operations, these models were chosen because of availability.

2. Materials and Methods

This study was conducted in an unpaved area surfaced with gravel in Burleson County, near College Station, TX (30°40′ N, 96°18′ W). The effects of application height and ground speed on spray pattern, effective swath and spray droplet characteristics for four RPAASs (Models V6A, M6E-1, V6A Pro and V8A Pro, Homeland Surveillance and Electronics, Casselberry, FL, USA) with factory-installed nozzles were determined. Three application heights (2, 3 and 4 m) in combination with four ground speeds (1, 3, 5 and 7 m·s−1) were used as treatments. Each treatment was replicated four times. Table 1 describes the unit power ratings, spray treatment protocols, nozzle setup, pressure and flow rate for each nozzle.

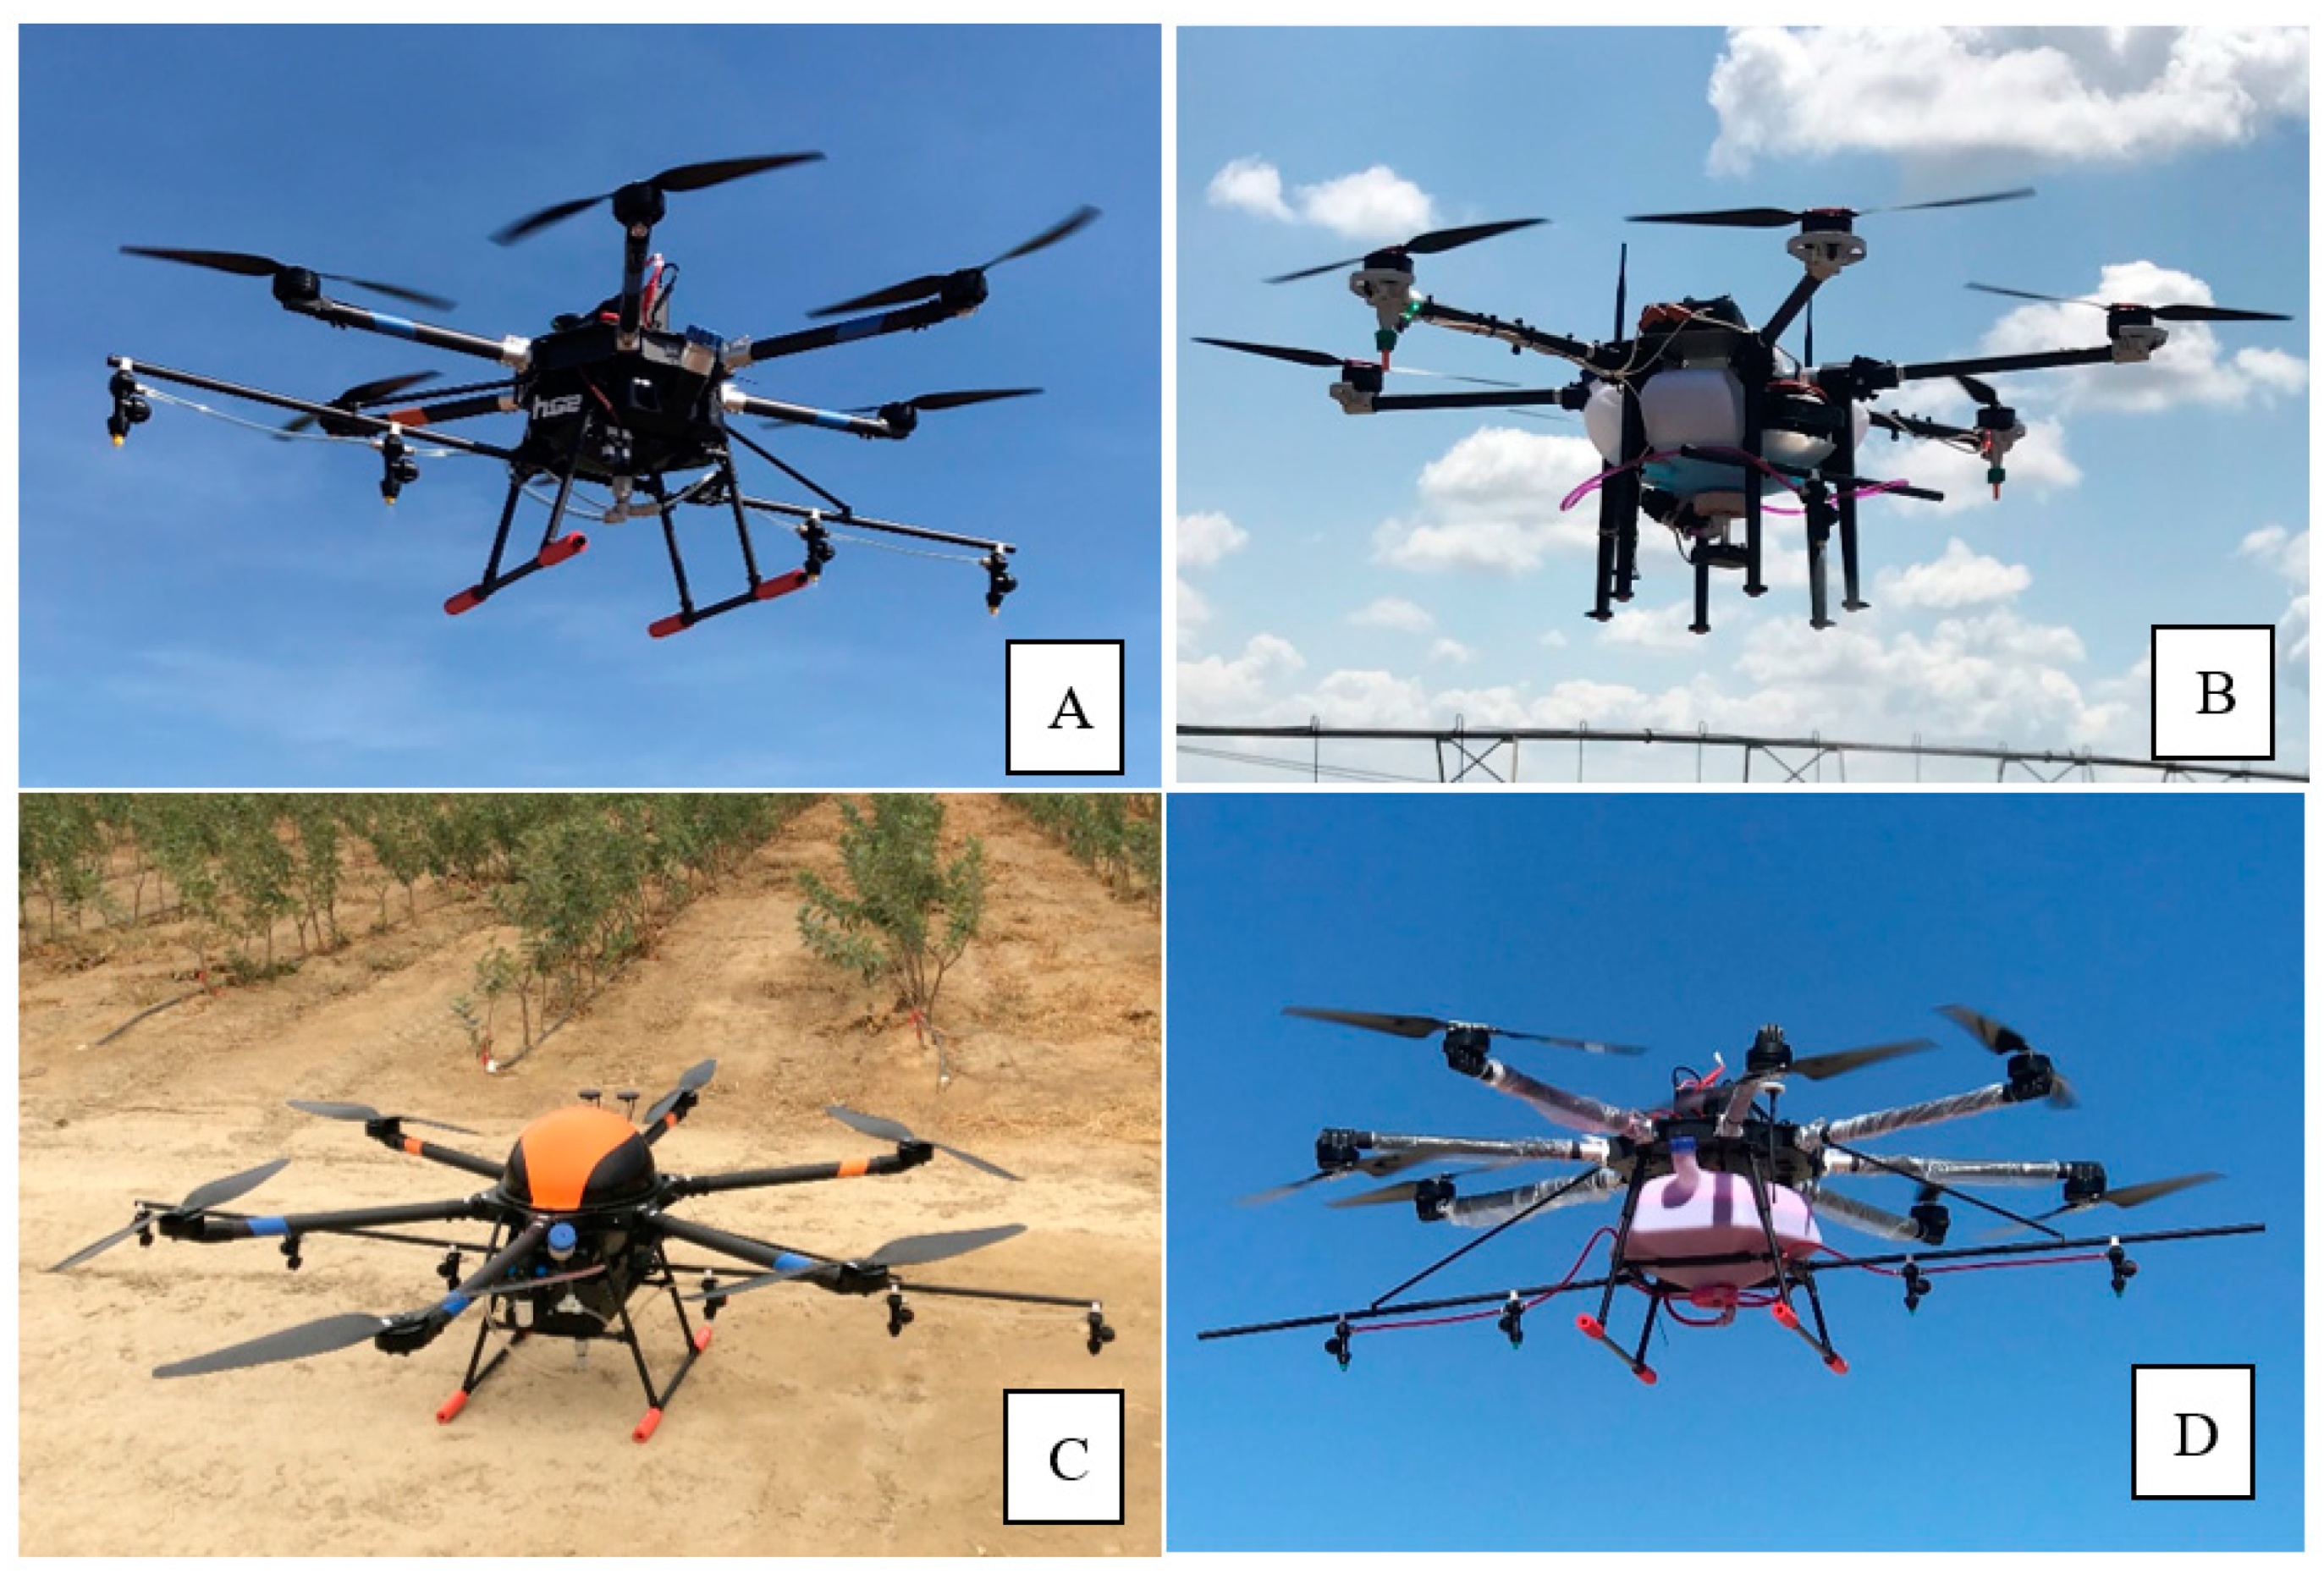
2.1. Descriptions of the RPAAS Models

The V6A and M6E-1 aircrafts were equipped with four TR80-005 hollow-cone nozzles on a boom and two 110-02 flat fan nozzles under a rotor (Lechler GmbH, Metzingen, Germany), each with 5 and 10 L tank volumes, respectively. The V6A Pro and V8A Pro aircraft were fitted, each with six hollow-cone TR80-0067 nozzles on a boom (Lechler GmbH, Metzingen, Germany). For the V6A, the outboard nozzles were positioned 0.41 m away from the inboard nozzles, which were 0.82 m apart. The M6E-1 had two nozzles, one on the left side of the aircraft and one on the right side, spaced 1.40 m apart. The V6A Pro and V8A Pro aircraft had the same boom and nozzle setup with 0.90 m between the inboard nozzles and 0.41 m between the outboard nozzles. A spray mixture of tap water and Vision Pink dye (GarrCo Products, Converse, IN, USA) at 20 mL·L−1 was sprayed parallel to the prevailing wind over the center line of a 15 m long × 1 mm diameter cotton string, suspended 1 m above ground. The aircrafts were flown directly into the wind (±30°). GPS was not used to navigate the drones. All the drones were manually flown over the center of the pattern testing lines. Photos of the RPAASs used in this study are shown in Figure 1.
Due to the time required to complete the studies, we conducted the tests on different dates. Table 2 describes the dates of the studies and the weather data collected during each test. The standard surface meteorological measurements comprised wind speed (m·s−1), wind direction (°), temperature (°C) and relative humidity (%), which were obtained from the Texas Farm Mesonet for the study on the V6A Pro and V8A Pro. These measurements represent the most important meteorological parameters which influence spray deposition and drift [27]. Similar data for the study on the V6A, M6E-1 and V8A Pro were obtained from a Kestrel 5400 hand-held weather meter (Kestrel Instruments, Creek Circle, Boothwyn, PA, USA) mounted on a collapsible tripod positioned near the study area. The meteorological conditions that existed during the study were variable and dynamic, as shown in Table 2. Cognizant of the weather conditions that could influence the results reported here, such effects were minimized by orienting the string analysis system perpendicular to the wind, regardless of the wind direction, during each test spray. If the wind direction varied more than 30° from the flight path, the string test system was reoriented so that it was orthogonal to the prevailing wind direction.

2.2. Determination of Spray Pattern and Effective Swath

The spray pattern and effective swath were determined using two methods. Method 1 was consistent with the standard established by Operation S.A.F.E (Self-Regulating Application and Flight Efficiency), sponsored by the National Agricultural Aviation Association, for the calibration of fixed-wing and rotary-wing aircrafts for spray pattern and drift analysis [28]. This method comprised multiple passes (three or more) which are lapped one over the other to obtain an average spray pattern for a specific aircraft. This average spray pattern is then computer simulated over multiple back-and-forth and racetrack passes. The computer simulation will calculate the coefficient of variation (CV) for multiple swath widths. The CV is an index of the uniformity of spray deposits across the swath width and represents the degree of variation in deposition from the mean [29,30,31,32]. An acceptable swath width is one where the CV ≤ 25%. The greater the CV, the more variability there is in the spray pattern. Method 2 comprised replicated individual passes, each one of them analyzed separately to determine the widest swath with a CV ≤ 25%. This approach results in greater spray pattern variability compared to Method 1 because it does not average multiple passes, which amplifies in-field variations between each pass of the aircraft. A detailed description of these two methods were provided earlier by Martin et al. [24].
The theoretical application rate (TAR) was computed using the following formula for both Method 1 and Method 2: System Flowrate (L·min−1)/[(Ground Speed (m·s−1) × Effective Swath (m))/167], where 167 is a conversion factor to resolve units to L·ha−1. The TAR is the calculated application rate based on the system flow rate, ground speed and effective swath.

2.3. Spray Droplet Spectra

Spray droplet spectra were determined using water-sensitive paper (WSP) samplers (26 × 76 cm) (Spraying Systems, Wheaton, IL, USA). Five wooden blocks, each with a paper clip attached on the top, were spaced 1 m apart on 74 cm tall tables oriented parallel to the cotton string. The WSPs were inserted into each of the paper clips before the RPAASs were launched. Soon after the spray pass was completed but after enough time had elapsed for the spray droplets to dry, the WSPs were removed and placed inside photonegative sleeves and were taken to the laboratory for analysis. The spray droplet images captured on the WSPs were analyzed by the DropletScan (WRK of Arkansas and Oklahoma, and Devore Systems, Inc., Manhattan, KS, USA) scanner-based system [33]. The spray droplet parameters measured were Dv0.1, Dv0.5, Dv0.9, the percent area coverage and the spray application rate. The volume median diameter, DV0.5, is the diameter such that 50% of the total volume of the droplets are in droplets of a smaller diameter. The Dv0.5 is commonly known as the volume median diameter (VMD). The spray droplet parameters measured in the study were the deposited droplets on the WSPs within the swath at the time of the study.

2.4. Data Analysis

The main effect variance components of the spray patterns associated with aerial models, application height and ground speed and their interactions were analyzed using the Proc Glimmix procedure [34]. Because of the difference in the manufacture-supplied nozzles between the spray drones, which could influence the spray droplet spectra, the data for each aircraft were sliced by application height and ground speed. With the effective swath averaged over application height and ground speed, there were 48 observations, 12 of which represented each RPAAS platform. Least square means were separated using the adjust = Tukey option at p < 0.05 and were letter grouped using the PDMIX800 macro procedure [35]. Graphical illustrations were made using JMP® [36]. To determine whether multiple passes or replications influenced the spray droplet spectra for the RPAAs platforms, Fit Model analyses were performed. Additionally, an ANOVA was conducted to determine the effect of the application height and ground speed and their interactions on the droplet spectra for the RPAAS platforms. A one-way ANOVA was conducted to determine whether the TAR varied between the two Methods (1 and 2) tested in this study. Similarly, the effect of ground speed on the TAR was assessed using a one-way ANOVA.

3. Results

3.1. Spray Pattern and Effective Swath

The effective swath determined by Method 1 (the traditional method), in which multiple passes by the aircraft were averaged, is shown in Figure 2. The effective swath significantly varied between platforms. Figure 2 shows that each of these platforms provided an average effective swath (±95% CI) of 5.60 ± 0.76, 8.74 ± 0.98, 10.11 ± 0.78 and 10.60 ± 1.09 m, respectively, for the 5, 10, 15 and 20 L payload capacity units. These data indicate that the effective swath increased as the payload capacity increased from 5 to 15 L units for the RPAAS platforms. However, the V6A Pro and V8A Pro platforms, each with a 15 and 20 L payload, provided a comparable effective swath. The V6A unit provided the lowest effective swath and was significantly different from both the M6E-1 and V6A Pro.
The analysis of variance of the spray pattern using Method 2 indicated that the effective swath significantly varied between the RPAAS models equipped with different payload capacities (Table 3). Application height did not have a significant influence on the effective swath for all the RPAAS models. However, ground speed was a significant factor which influenced the effective swath. There was no significant interaction between application height and ground speed. Overall, as the ground speed increased, the effective swath decreased. There was no significant interaction between platform and application height or between platform and ground speed. Figure 3 shows that the effective swath for the V6A aircraft with a 5 L payload capacity was significantly narrower than those for the M6E-1, V6A Pro and V8A Pro aircraft with payload capacities of 10, 15 and 20 L, respectively. There was no statistical difference in the effective swath between the V6A Pro and V8A Pro aircraft. The differences in the effective swath between the RPAAS platforms shown for Method 2 were like that for Method 1.
The effect of the application height and ground speed on the effective swath is presented in Table 4 and Table 5, respectively, for each of the aircraft models (Method 2). Additionally, presented in Table 5 is the TAR data by ground speed for the RPAAS platforms. Neither application height nor ground speed significantly influenced the effective swath either for the V6A or V6A Pro. For the M6E-1, however, both application height and ground speed significantly influenced the effective swath. For the V8A Pro, neither application height nor ground speed impacted the effective swath.
The test results on the swath shown in Figure 3 indicate that an effective swath of 4.14 m with a 95% confidence interval of ±0.54 m could be expected from the V6A platform at any combination of application height and ground speed. Similarly, for the V6A Pro, an effective swath of 7.85 m with a 95% confidence interval of ±0.73 m could be expected from this platform at any combination of application height and ground speed. Additionally, for the V8A Pro, an effective swath of 7.55 m with a 95% confidence interval of ±0.87 m could be expected, regardless of the application height and ground speed. However, for the M6E-1, the effective swath was significantly affected by the application height and ground speed. Thus, this aircraft has a narrower range of optimal operating conditions and would be expected to provide an effective swath of 7.57 m at a ground speed of 1 m·s−1 when operated at either a 3 or 4 m application height.
The percent reduction in effective swath by using Method 2 over Method 1 did not differ between aerial platforms with different payload capacities. Figure 4 shows that such a reduction in effective swath between the aerial platforms varied from 37.9 to 44.5%.

3.2. Theoretical Application Rate

The theoretical application rate did not differ significantly between the two methods tested (Figure 5). The least square mean for the TAR using Method 1 averaged 9.86 L·ha−1 with a 95% confidence interval of ±5.33, and that for Method 2 averaged 13.20 L·ha−1 with a 95% confidence interval of ±5.32. When the Method 1 and Method 2 data were combined, Figure 6 indicated that the TAR varied significantly between ground speeds. The lower the ground speed, the higher the application rate (Table 5). Although the 1 m·s−1 ground speed resulted in a significantly higher spray application rate compared to higher ground speeds, the spray application rate was comparable between 3, 5 and 7 m·s−1 ground speeds. Both methods are expected to yield an application rate (L·ha−1) equivalent to 26.51 ± 3.95, 9.49 ± 3.94, 6.28 ± 3.95 and 3.84 ± 3.95 ( x ¯ ± 95% CI), respectively, at 1, 3, 5 and 7 m·s−1. These values represent a precipitous decline in the spray application rate (180% (1 vs. 3), 322% (1 vs. 5) and 590% (1 vs. 7)) as ground speed increases.

3.3. Spray Droplet Spectra

Figure 7, Figure 8 and Figure 9 indicate that none of the spray droplet spectra (Dv0.1, DV0.5 and Dv0.9) significantly differed between replications. However, the spray droplet spectra were significantly different between the RPAAS platforms. No significant interactions between the replication and platform were observed (Table 6). This indicated that the droplet spectra remained stable and that there was no evidence that the volume of the spray solutions which got reduced during each replication (take-off mass) influenced the results reported here.
Table 7 shows that the spray droplet spectra (Dv0.1, Dv0.5 and Dv0.9) varied significantly between the RPAAS platforms. The operational protocols, application height and ground speed significantly influenced the spray droplet spectra as well. Additionally, significant interactions occurred between the platforms and the spray droplets. Figure 10 and Figure 11 show the variations in Dv0.5 between the platforms as influenced by the application height and ground speed, respectively. For the M6E-1 platform, Dv0.5 was significantly greater at 3 m than either at a 2 or 4 m application height. For the V6A model, Dv0.5 was significantly greater at 2 m than at either a 3 or 4 m application height. For the V6A Pro and V8A Pro aircraft, Dv0.5 was comparable between application heights.
The effect of ground speed on Dv0.5 indicates that for the V6A platform, Dv0.5 was similar at all the ground speeds tested. For the V6A Pro, the VMD was significantly larger at the 1 m·s−1 ground speed, likely due to its larger orifice nozzle (110-02), but it was comparable at all other ground speeds (3, 5 and 7 m·s−1). Few differences in Dv0.5 were observed between ground speeds for the V8A Pro model. Note that the figures were presented only for Dv0.5.
The spray droplet data are presented individually for each of the aircraft models in Table 8, Table 9, Table 10 and Table 11. The application height significantly influenced the spray droplet spectra for the V6A and M6E-1, but not for the V6A Pro or the V8A Pro. Likewise, the ground speed influenced the spray droplets for the V6A Pro and V8A Pro, but not for the V6A or the M6E-1. The interaction between the application height and ground speed was significant only for the V6A. The 2 m application height and 1 m·s−1 ground speed yielded larger spray droplet spectra for the V6A and V8A Pro, while the 3 m height and 1 m·s−1 ground speed produced larger spray droplets for the M6E-1 and V6A Pro.
Since the tests were conducted during two separate years, the lower humidity conditions in 2019 (33–49%) may have caused slightly smaller spray droplet spectra results when compared to the more humid conditions (67–72%) experienced during the 2018 tests. The application height significantly influenced the percent area coverage for the V6A and V6A Pro, but no such effect was observed for the M6E-1 and V8A Pro. The ground speed significantly influenced the percent area coverage for all aerial platforms. However, interactions between the application height and ground speed occurred only for the V6A and V6A Pro. The percent area coverage was significantly greater at a 2 m height and 1 m·s−1 ground speed for all the aerial vehicles.
Likewise, the ground speed significantly influenced the spray application rate for all the aircraft models. As the ground speed increased, the spray application rate decreased for all the application heights. A significant interaction between application height and ground speed occurred only for the V6A Pro. The application height at 2 m produced a greater spray application rate for all the platforms when operated at the lowest ground speed (1 m·s−1). Regardless of the payload capacity of the aircraft, the ground speed was inversely correlated with the percent area coverage and application rate. A reduced ground speed increased the application rate and percent area coverage and an increased ground speed reduced the application rate and percent area coverage.

4. Discussion

4.1. Spray Pattern Uniformity

An effective swath is a desirable goal for the judicious spray application of the target site to achieve the efficacious control of pest populations. This study has shown that the traditional method of determining the spray pattern based upon averaged multiple passes overall resulted in a wider spray pattern compared to individually analyzed passes. This increase in effective swath is likely due to a reduction in spray pattern variability because of averaging the individual spray passes, and it may not represent the actual performance of the aircraft in the field. Although Method 1 has been used to analyze spray patterns for the last couple of decades, it lacks statistical power to differentiate treatment effects because it is devoid of replications. This method of determining the effective swath is commonly used for testing the spray patterns from manned agricultural aircrafts. Spray pattern testing clinics using this method are conducted by extension personnel and consultants yearly at “fly-ins” where aerial applicators bring their aircraft to be tested. Note that the limiting factors in such a clinical environment are a lack of time and resources to work with so many aerial applicators in a short period of time. These pattern testing clinics are designed to provide guidance to aerial applicators on proper equipment setup. They are not research trials. Thus, multiple replications would be impractical due to time and resource constraints and are not required to provide general guidance.
Although a CV of 25% or less is commonly recognized as an acceptable metric for determining the effective swath, Smith, et al. [37] reported that a CV of ≤15% is more desirable for the treatment of pest control products in order to minimize over or under application problems. They demonstrated that as the CVs increased, the ratio of the maximum-to-minimum spray deposits increased with the concomitant wastage of the pesticides applied. Nevertheless, Qin, et al. [38] achieved an optimum deposition and distribution of spray droplets as well as improved insecticidal efficacy against plant hoppers in a rice crop with a HyB-15L RPAAS operated at a 1.5 m application height and 5 m·s−1 ground speed with a CV near 23%. Similarly, Xue, et al. [39] achieved an effective swath of 7 m with a CV of 25% when flying an RPAAS at a height of 5 m and a wind speed of 0 to 2 m·s−1. Richardson, et al. obtained a spray pattern with a 30% CV for a multi-rotor RPAAS and they, Richardson et al. [26], reported that it was strongly influenced by wind speed, nozzle position, release height, ground speed and droplet size. Shilin, et al. [3] flew four RPAASs on a 15 m sampling line at varying ground speeds (4 to 6 m·s−1) and application heights (1.5 m to 2 m) and found that the spray deposits were uneven with CVs ranging from 43 to 71%. Yongjun, et al. [40] flew a six rotor UAS on different growth stages of maize, Zea mays, and reported that the optimum operational application height and ground speed of the aircraft to maximize spray droplet distribution was largely dependent on the milking stages of the corn ear. Similarly, Qin, et al. [2] reported that spray deposition on wheat canopy improved with the age of the plant as the downward airflow from the rotors helped leaf flipping and droplet penetration into the lower layers of the plant. These data indicate that biological factors should also be considered as important components likely to affect spray deposition from an RPAAS. Improved software and hardware, along with modeling the operational and meteorological variables affecting deposition, may help reduce variability in spray patterns and help improve the effective swath for small-scale aerial applications with RPAAS platforms.
The effective swath produced by the aerial platforms increased with the payload capacity, although the 15 L and 20 L models produced a statistically equivalent effective swath. Marinello, et al. [41] reported that the total load and the battery pack make up a significant portion of the total weight of the aircraft. Although the battery pack provides energy to the UAS to conduct field operations, its weight does limit flight time. Approximately 20 to 25% of the total mass of the aircraft is attributed to battery. The payload, sensors and other devices required for flight operations make up about another 25 to 35% of the total mass [41]. The RPAAS platforms tested in this study possessed spray tanks with varying spray volumes, but also different amounts of thrust, motor RPM and motor power (Table 1). It is likely that these additional characteristics influenced the effective swath as well.

4.2. Spray Droplet Spectra

The application height significantly influenced the spray droplet spectra images deposited on the WSP strips for the 5 and 10 L payload platforms (V6A and M6E-1), but no such effect was observed for the V6A Pro or the V8A Pro aircraft with 15 and 20 L payloads, respectively. Conversely, the ground speed influenced the spray droplets for the V6A Pro and V8A Pro aircraft, while no such effect was observed either for the V6A or the M6E-1 aircraft. The data from this study appear to corroborate Pan, et al. [42], who reported that the application height significantly influenced the spray droplet distribution of Ponceau 2R spray solutions when a 6 L RPAAS was operated at three different application heights and three different ground speeds and that the 1 m application height and 0.9 m·s−1 ground speed produced the best droplet distribution and spray penetration in a citrus canopy. Using a high-speed PIV (Particle Image Velocimetry) system, Qing, et al. [43] measured the movement of spray droplets in the laboratory at different rotor speeds from an eight-rotor RPAAS platform with a TR80-005c nozzle and found that the speed of the droplets within the downwash flow was 2.4 times greater than the initial droplet speed at the time of exit from the nozzle orifice. The downwash flow could increase the deposit discharge area as much as 150%. Drawing from a computational fluid dynamics model, Yang, et al. [44] found that the rotor downwash from an RPAAS caused a pressure difference between the abaxial and the adaxial surfaces of the leaves, facilitating the flipping of the leaves and droplet penetration into the lower canopy. They field tested the model and showed that the spray droplet density on the upper and the lower leaf surfaces of a potted plant were 10.8 and 4.0 cm2, respectively, at 0 m·s−1 wind speed. The data presented here indicate that the trajectory of the spray droplets for each of the aerial platforms tested in this study may likely follow the dispersion pattern described by Yang, et al. [45] during field operations, as the pattern and the velocity of airflow during downwash varies with the design and the power ratings of the aircraft [44,46]. The percent area coverage and the spray application rate were significantly higher at a 2 m application height and 1 m·s−1 ground speed than at higher application heights and ground speeds for all the tested aircraft. The data presented here are in agreement with Lou, et al. [47], who reported that at a 2 m application height, the spray coverage and spray application rate were significantly higher than at a 1.5 m height, and they argued that the increased height caused the weakening of the downward pressure wind field below the rotor. Slower ground speeds naturally are expected to increase the spray application rate and percent area coverage. Lv, et al. [48] reported that the spray droplet density (droplets/cm2) and percent area coverage on WSPs decreased with an increasing flight speed (0.3 to 1 m·s−1) when a UAV was operated under controlled environmental conditions. This study confirmed such a trend and quantified the effect of ground speed on these spray application parameters. For the V6A Pro aircraft flying at 3 m·s−1, increases in wind speed and change in wind direction as shown in Table 2 resulted in less spray collected on the WSP samplers; thus, lower values were obtained for both the spray application rate and the percent area coverage (Table 10).

4.3. Theoretical Application Rate (TAR)

The best spray application technology is expected to minimize the over-application and off-target movement of pest control agents while assuring uniform spray coverage at the target site. Large variations in crop canopy architecture, plant spacing, spatial heterogeneity and sprayer limitations contribute to the differences in spray efficiency under field conditions. However, the study reported herein conducted under similar environmental conditions showed that although there was no statistical difference between the traditional method and replicated studies for determining the effective swath, the effective swath declined as much as 37.9 to 44.5% in Method 2 compared to Method 1 for the aerial platforms tested. Although these differences are not statistically significant, the magnitude of the difference in numerical proportions indicates that the monetary benefits to the growers should be substantial. Further research is required to substantiate these observations by conducting much larger replicated field trials than those used in this study.

5. Conclusions

This research describes the effects of operational parameters on spray pattern uniformity, effective swath and spray droplet spectra for four RPAAS delivery vehicles equipped with factory-installed spray nozzles. The test results indicated that each RPAAS platform of varying payload capacity was able to produce an acceptable spray pattern. As the payload capacity increased, so did the effective swath, but the 15 and 20 L platforms produced statistically equivalent effective swaths. The RPAAS platforms tested in this study possessed not only spray tanks with varying payload capacities, but they also differed in thrust, motor RPM and motor power, and it is likely that these platform parameters influenced the effective swath as well. More data are needed to fully understand the effect of the payload capacity, the design and the power ratings of the spray drones tested on spray droplet uniformity, effective swath and droplet spectra. Application heights greater than 3 m resulted in a sub-optimal percent area coverage and spray application rate. Slower ground speeds resulted in a greater percent area coverage and spray application rate. The traditional method of determining spray pattern uniformity (Method 1), when three or more passes were averaged together, yielded a wider effective swath than those analyzed individually (Method 2). Method 1 lacked replications and was, therefore, without the natural variations associated with field data. The effective swath declined as much as 38 to 45% in Method 2 compared to Method 1 and suggests a significant loss in monetary benefits to the farmer. The theoretical spray application rate (L·ha−1) did not differ significantly between Method 1 and Method 2 and declined precipitously as the ground speed increased. The test results provided here may provide guidance to aerial applicators on the effective swath expected from the different RPAAS platforms tested and may help in furthering spray drone technology for pest management. While the results reported from this study were from RPAAS models with original equipment from the manufacturer, future research should look at spray nozzle setups for optimum spray droplet spectra to control target pests while maximizing coverage and deposition while also mitigating spray drift.

Author Contributions

Conceptualization, D.E.M.; methodology, D.E.M.; formal analysis, M.A.L.; writing—original draft preparation, D.E.M. and M.A.L.; writing—review and editing, M.A.L. and D.E.M. All authors have read and agreed to the published version of the manuscript.

Funding

This research received no external funding.

Institutional Review Board Statement

Not applicable.

Informed Consent Statement

Not applicable.

Data Availability Statement

Not applicable.

Acknowledgments

The authors would like to thank Al Nelson for allowing them to use the research plots at the Texas A&M University Research Farm.

Conflicts of Interest

The authors declare no conflict of interest. The use of trade, firm or corporation names in this publication is for the information and convenience of the reader. Such use does not constitute an official endorsement or approval by the United States Department of Agriculture or the Agricultural Research Service of any product or service to the exclusion of others that may be suitable.

References

  1. Xue, X.; Qin, W.; Sun, Z.; Zhang, S.; Zhou, L.; Wu, P. Effects of N-3 UAV spraying methods on the efficiency of insecticides against planthoppers and Cnaphalocrocis medinalis. Acta Phytophylacica Sin. 2013, 40, 273–278. [Google Scholar]
  2. Qin, W.; Xue, X.; Zhang, S.; Gu, W.; Wang, B. Droplet deposition and efficiency of fungicides sprayed with small UAV against wheat powdery mildew. Int. J. Agric. Biol. Eng. 2018, 11, 27–32. [Google Scholar] [CrossRef]
  3. Wang, S.; Song, J.; He, X.; Song, L.; Wang, X.; Wang, C.; Wang, Z.; Ling, Y. Performances evaluation of four typical unmanned aerial vehicles used for pesticide application in China. Int. J. Agric. Biol. Eng. 2017, 10, 22–31. [Google Scholar] [CrossRef]
  4. Devi, G.; Sowmiya, N.; Yasoda, K.; Muthulakshmi, K.; Balasubramanian, K. Review on application of drones for crop health monitoring and spraying pesticides and fertilizer. J. Crit. Rev 2020, 7, 667–672. [Google Scholar]
  5. Kestur, R.; Omkar, S.N.; Subhash, S. Unmanned aerial system technologies for pesticide spraying. In Innovative Pest Management Approaches for the 21st Century; Chakravarthy, A.K., Ed.; Springer Nature Singapore Pte Ltd.: Singapore, 2020; pp. 47–60. [Google Scholar]
  6. Maslekar, N.V.; Kulkarni, K.P.; Chakravarthy, A.K. Application of unmanned aerial vehicles (UAVs) for pest surveillance, monitoring and management. In Innovative Pest Management Approaches for the 21st Century; Chakravarthy, A.K., Ed.; Springer Nature Pte Ltd.: Singapore, 2020; pp. 27–45. [Google Scholar]
  7. Chakravarthy, A.K. Innovative Pest Management for the 21st Century. Harnessing Automated Unmanned Technologies; Springer Nature Pte Ltd.: Singapore, 2020. [Google Scholar]
  8. Yallappa, D.; Veerangouda, M.; Maski, D.; Palled, V.; Bheemanna, M. Development and evaluation of drone mounted sprayer for pesticide applications to crops. In Proceedings of the 2017 IEEE Global Humanitarian Technology Conference (GHTC), San Jose, CA, USA, 19–22 October 2017; pp. 1–7. [Google Scholar]
  9. Shaw, K.K.; Vimalkumar, R. Design and development of a drone for spraying pesticides, fertilizers and disinfectants. Eng. Res. Technol. 2020, 9, 1181–1185. [Google Scholar]
  10. Giles, D.; Billing, R. Deployment and performance of a UAV for crop spraying. Chem. Eng. Trans. 2015, 44, 307–312. [Google Scholar]
  11. Giles, D.; Billing, R.; Singh, W. Performance results, economic viability and outlook for remotely piloted aircraft for agricultural spraying. Asp. Appl. Biol. 2016, 132, 15–21. [Google Scholar]
  12. Martinez-Guanter, J.; Agüera, P.; Agüera, J.; Pérez-Ruiz, M. Spray and economics assessment of a UAV-based ultra-low-volume application in olive and citrus orchards. Precis. Agric. 2019, 21, 226–243. [Google Scholar] [CrossRef]
  13. Huang, Y.; Hoffman, W.C.; Lan, Y.; Fritz, B.K.; Thomson, S.J. Development of a low-volume sprayer for an unmanned helicopter. J. Agric. Sci. 2015, 7, 148. [Google Scholar] [CrossRef]
  14. Xiongkui, H.; Bonds, J.; Herbst, A.; Langenakens, J. Recent development of unmanned aerial vehicle for plant protection in East Asia. Int. J. Agric. Biol. Eng. 2017, 10, 18–30. [Google Scholar]
  15. Carey, S.B. Increasing the Endurance and Payload Capacity of Unmanned Aerial Vehicles with Thin-Film Photovoltaics. Master’s Thesis, Naval Postgraduate School, Monterey, CA, USA, 2014. [Google Scholar]
  16. Mohsan, S.A.H.; Khan, M.A.; Noor, F.; Ullah, I.; Alsharif, M.H. Towards the Unmanned Aerial Vehicles (UAVs): A Comprehensive Review. Drones 2022, 6, 147. [Google Scholar] [CrossRef]
  17. del Cerro, J.; Cruz Ulloa, C.; Barrientos, A.; de León Rivas, J. Unmanned Aerial Vehicles in Agriculture: A Survey. Agronomy 2021, 11, 203. [Google Scholar] [CrossRef]
  18. Yang, S.; Yang, X.; Mo, J. The application of unmanned aircraft systems to plant protection in China. Precis. Agric. 2018, 19, 278–292. [Google Scholar] [CrossRef]
  19. Wu, Y.; Xi, X.; Tang, X.; Luo, D.; Gu, B.; Lam, S.K.; Vitousek, P.M.; Chen, D. Policy distortions, farm size, and the overuse of agricultural chemicals in China. Proc. Natl. Acad. Sci. USA 2018, 115, 7010. [Google Scholar] [CrossRef]
  20. Lu, B.; Yu, Q.; Fu, X.; Shi, Y.; Cai, M. Parameter matching of hybrid coaxial rotors and multi-rotor UAV’s power system. In Proceedings of the 2016 IEEE International Conference on Aircraft Utility Systems (AUS), Beijing, China, 10–12 October 2016; pp. 1099–1104. [Google Scholar]
  21. Shi, Y.; Thomasson, J.A.; Murray, S.C.; Pugh, N.A.; Rooney, W.L.; Shafian, S.; Rajan, N.; Rouze, G.; Morgan, C.L.; Neely, H.L. Unmanned aerial vehicles for high-throughput phenotyping and agronomic research. PLoS ONE 2016, 11, e0159781. [Google Scholar] [CrossRef]
  22. Tang, L.; Shao, G. Drone remote sensing for forestry research and practices. J. For. Res. 2015, 26, 791–797. [Google Scholar] [CrossRef]
  23. Zhang, C.; Kovacs, J.M. The application of small unmanned aerial systems for precision agriculture: A review. Precis. Agric. 2012, 13, 693–712. [Google Scholar] [CrossRef]
  24. Martin, D.E.; Woldt, W.E.; Latheef, M.A. Effect of Application Height and Ground Speed on Spray Pattern and Droplet Spectra from Remotely Piloted Aerial Application Systems. Drones 2019, 3, 83. [Google Scholar] [CrossRef]
  25. Qin, W.; Xue, X.; Zhou, L.; Zhang, S.; Sun, Z.; Kong, W.; Wang, B. Effects of spraying parameters of unmanned aerial vehicle on droplets deposition distribution of maize canopies. Trans. Chin. Soc. Agric. Eng. 2014, 30, 50–56. [Google Scholar]
  26. Richardson, B.; Rolando, C.A.; Somchit, C.; Dunker, C.; Strand, T.M.; Kimberley, M.O. Swath pattern analysis from a multi-rotor unmanned aerial vehicle configured for pesticide application. Pest Manag. Sci. 2019, 76, 1282–1290. [Google Scholar] [CrossRef]
  27. Teske, M.; Thistle, H.; Ice, G. Technical advances in modeling aerially applied sprays. Trans. ASAE 2003, 46, 985. [Google Scholar] [CrossRef]
  28. Gardisser, D.R. Operation S.A.F.E. For quality performance/web-based decision making. 2010. [Google Scholar]
  29. Grift, T.; Walker, J.; Gardisser, D. Spread pattern analysis tool (SPAT): II. Examples of aircraft pattern analysis. Trans. ASAE 2000, 43, 1351. [Google Scholar] [CrossRef]
  30. Carpenter, T.G.; Reichard, D.L.; Khan, A.S. Spray Deposition from a Row-Crop Airblast Sprayer. Trans. ASAE 1983, 26, 338. [Google Scholar] [CrossRef]
  31. Whitney, R.W.; Kuhlman, D.K. Pattern analysis of agricultural aircraft. SAE Trans. 1983, 92, 169–177. [Google Scholar]
  32. Yates, W.E. Spray pattern analysis and evaluation of deposits from agricultural aircraft. Trans. ASAE 1962, 5, 49–53. [Google Scholar] [CrossRef]
  33. Whittney, R.W.; Gardisser, D.R. DropletScan Operators Manual; WRK of Oklahoma and Arkansas: Fort Smith, AR, USA, 2003. [Google Scholar]
  34. SAS. SAS Version 9.4; SAS Institute Inc.: Cary, NC, USA, 2012. [Google Scholar]
  35. Saxton, A. User’s Guide for Design and Analysis: SAS Macro Collection DandA.Sas.; University of Tennessee: Knoxville, TN, USA, 2012. [Google Scholar]
  36. SAS. JMP® 14; SAS Institute Inc.: Cary, NC, USA, 2018. [Google Scholar]
  37. Smith, D.B.; Oakley, D.; Williams, E.; Kirkpatrick, A. Broadcast spray deposits from fan nozzles. Appl. Eng. Agric. 2000, 16, 109–113. [Google Scholar] [CrossRef]
  38. Qin, W.-C.; Qiu, B.-J.; Xue, X.-Y.; Chen, C.; Xu, Z.-F.; Zhou, Q.-Q. Droplet deposition and control effect of insecticides sprayed with an unmanned aerial vehicle against plant hoppers. Crop Prot. 2016, 85, 79–88. [Google Scholar] [CrossRef]
  39. Xue, X.; Lan, Y.; Sun, Z.; Chang, C.; Hoffmann, W.C. Develop an unmanned aerial vehicle based automatic aerial spraying system. Comput. Electron. Agric. 2016, 128, 58–66. [Google Scholar] [CrossRef]
  40. Zheng, Y.; Yang, S.; Zhao, C.; Chen, L.; Lan, Y.; Tan, Y. Modelling operation parameters of UAV on spray effects at different growth stages of corns. Int. J. Agric. Biol. Eng. 2017, 10, 57–66. [Google Scholar]
  41. Marinello, F.; Pezzuolo, A.; Chiumenti, A.; Sartori, L. Technical analysis of unmanned aerial vehicles (drones) for agricultural applications. In Proceedings of the Engineering for Rural Development, Jelgava, Latvia, 25–27 May 2022; pp. 870–875. [Google Scholar]
  42. Zhang, P.; Deng, L.; Lyu, Q.; He, S.L.; Yi, S.L.; Liu, Y.D.; Yu, Y.X.; Pan, H.Y. Effects of citrus tree-shape and spraying height of small unmanned aerial vehicle on droplet distribution. Int. J. Agric. Biol. Eng. 2016, 9, 45–52. [Google Scholar]
  43. Tang, Q.; Zhang, R.R.; Chen, L.P.; Xu, M.; Yi, T.C.; Zhang, B. Droplets movement and deposition of an eight-rotor agricultural UAV in downwash flow field. Int. J. Agric. Biol. Eng. 2017, 10, 47–56. [Google Scholar]
  44. Yang, Z.; Qi, L.; Wu, Y. Influence of UAV Rotor Down-wash Airflow For Droplet Penetration. In Proceedings of the 2018 ASABE Annual International Meeting, Detroit, MI, USA, 29 July–1 August 2018; p. 1. [Google Scholar]
  45. Yang, S.; Liu, X.; Chen, B.; Li, S.; Zheng, Y. CFD Models and Verification of the Downwash Airflow of an Eight-rotor UAV. In Proceedings of the 2019 ASABE Annual International Meeting, St. Joseph, MI, USA, 7–10 July 2019; p. 1. [Google Scholar]
  46. Zhang, S.C.; Xue, X.Y.; Sun, Z.; Zhou, L.X.; Jin, Y.K. Downwash distribution of single-rotor unmanned agricultural helicopter on hovering state. Int. J. Agric. Biol. Eng. 2017, 10, 14–24. [Google Scholar] [CrossRef]
  47. Lou, Z.; Xin, F.; Han, X.; Lan, Y.; Duan, T.; Fu, W. Effect of Unmanned Aerial Vehicle Flight Height on Droplet Distribution, Drift and Control of Cotton Aphids and Spider Mites. Agronomy 2018, 8, 187. [Google Scholar] [CrossRef]
  48. Lv, M.; Xiao, S.; Yu, T.; He, Y. Influence of UAV flight speed on droplet deposition characteristics with the application of infrared thermal imaging. Int. J. Agric. Biol. Eng. 2019, 12, 10–17. [Google Scholar] [CrossRef]
Figure 1. Photos of the RPAAS models used for the study. (A) V6A with 5 L payload capacity, (B) M6E-1 with 10 L payload capacity, (C) V6A Pro with 15 L payload capacity and (D) V8A Pro with 20 L payload capacity.
Drones 06 00205 g001
Figure 2. Relationship between effective swath and aircraft payload using Method 1. Means followed by the same lower-case letter are not significantly different according to Tukey’s Method at p = 5%.
Drones 06 00205 g002
Figure 3. Relationship between effective swath and aircraft payload using Method 2. Means (±SEM) followed by the same lower-case letter are not significantly different (p < 0.05) according to Tukey’s Method.
Drones 06 00205 g003
Figure 4. Relationship between effective swath and aircraft payload using Method 2. Means (±SEM) followed by the same lower-case letter are not significantly different (p < 0.05) according to Tukey’s Method.
Drones 06 00205 g004
Figure 5. Least square means of theoretical spray application rate for Method 1 and Method 2. Mean ± 95% CIs for Method 1 was 9.86 ± 5.33 and for Method 2 was 13.20 ± 5.35.
Drones 06 00205 g005
Figure 6. Effect of ground speed on theoretical application rate. Means are separated using Tukey–Kramer comparison circles at p = 0.5. Circles with greater than 90° angles are not significantly different. The middle line in each diamond is the response group mean. The vertical endpoints within each diamond are the 95% CI for the mean.
Drones 06 00205 g006
Figure 7. Spray droplet (Dv0.1) ± SEM images collected on WSP samplers deployed in each of four replications. Means followed by the same lower-case letters are not significantly different (p < 0.05) according to Tukey’s HSD test.
Drones 06 00205 g007
Figure 8. Spray droplets (Dv0.5) ± SEM images collected on WSP samplers deployed in each of four replications. Means followed by the same lower-case letters are not significantly different (p < 0.05) according to Tukey’s HSD test.
Drones 06 00205 g008
Figure 9. Spray droplet (Dv0.9) ± SEM images collected on WSP samplers deployed in each of four replications. Means followed by the same lower-case letters are not significantly different (p < 0.05) according to Tukey’s HSD test.
Drones 06 00205 g009
Figure 10. Spray droplet (Dv0.5) ± SEM images collected on WSP samplers for each of four RPAAS models launched at 2, 3 and 4 m application heights. Means followed by the same lower-case letters are not significantly different (p < 0.05) according to Tukey’s HSD test.
Drones 06 00205 g010
Figure 11. Spray droplet (Dv0.5) ± SEM images collected on WSP samplers for each of four RPAAS models when flown at 1,3, 5 and 7 m·s−1 ground speeds. Means followed by the same lower-case letters are not significantly different (p < 0.05) according to Tukey’s HSD test.
Drones 06 00205 g011
Table 1. Spray treatment protocols, aircraft models with payload capacities, power ratings, nozzle descriptions and operating pressures.
Aircraft Model *Payload Capacity (L)Number of Rotors/MotorsKVMaximum ThrustMaximum PowerNozzle OrificeNumber of NozzlesPressure (kPa)Nozzle Flow Rate
(RPMs/V)(kg)(W)(mL/min)
V6A561809200080-0054496250
M6E-110618092000110-022262754
V6A Pro15612014230080-00676367367
V8A Pro20812014230080-00676367367
* Homeland Surveillance and Electronics, Casselberry, FL, USA.
Table 2. Study dates and weather conditions (mean ± SEM) recorded during the test periods.
Meteorological
Data
20182019
Dates9 May25 October 19 March 20 March
RPAASsV6AV6A Pro V8A ProM6E-1V8A ProM6E-1V8A Pro
Wind Speed
(m/s)
4.6 ± 0.207.3 ± 0.264.8 ± 0.246.0 ± 0.841.96 ± 0.142.1 ± 0.17
Wind Direction (°)190.1 ± 1.96318 ± 2.39137.8 ± 3.72141.5 ± 3.10242.0 ± 12.9234.7 ± 10.12
Temperature
(°C)
25.4 ± 0.4518.2 ± 0.0821.1 ± 0.1321.3 ± 0.3522.2 ±0.5720.7 ±0.32
Relative Humidity (%)67.3 ± 2.7472.1 ± 0.6634.6 ± 0.5033.0 ± 0.8044.7 ± 1.9149.1 ± 1.35
Table 3. ANOVA of spray pattern using Method 2.
Source of VariationFpdf
Platform25.810.00013
Application Height0.260.772
Ground Speed2.950.033
Height × Speed0.930.486
Platform × Height2.020.076
Platform × Speed1.800.079
Error df 159
Table 4. Effect of Application Height on Effective Swath (Method 2).
Application Height (m)Effective Swath (m) by Platform
V6AM6E-1V6A ProV8A Pro
24.74a5.14b8.15a7.00a
33.89a6.71a8.31a7.30a
43.66a6.78a7.10a8.30a
F-value1.744.731.071.08
p0.190.010.350.35
df2, 352, 362, 362, 34
Means within each column followed by the lower-case letter are not significantly different (p < 0.05) according to Tukey’s Method.
Table 5. Effect of ground speed on effective swath and theoretical application rate (TAR) (Method 2).
Ground Speed (m·s−1)V6ATARM6E-1TARV6A ProTARV8A ProTAR
(L·ha−1)(L·ha−1)(L·ha−1)(L·ha−1)
14.11a40.637.57a36.538.60a18.996.60a24.75
33.56a15.646.25ab14.758.38a6.508.81a6.18
54.11a8.134.50b12.297.26a4.506.54a5.00
74.60a5.196.53a6.057.16a3.268.28a2.82
F-value0.74 6.76 0.99 2.32
p0.54 0.001 0.41 0.09
df3, 35 3, 36 3, 36 3, 34
Means within each column followed by the lower-case letter are not significantly different (p < 0.05) according to Tukey’s Method.
Table 6. ANOVA statistics showing the effect of replication (take-off mass) on spray droplet spectra.
Source of VariationSum of SquaresFpdf
Dv0.1
Rep2997.90.680.563
Platform269,566.861.18<0.00013
Rep × Platform11,473.40.870.559
Dv0.5
Rep2785.30.310.823
Platform717,324.379.67<0.00013
Rep × Platform17,439.60.640.769
Dv0.9
Rep12,767.20.830.483
Platform1,295,93284.2<0.00013
Rep × Platform89,385.91.940.049
* MSE 849
* Mean Square of Error.
Table 7. ANOVA statistics showing how the droplet spectra (Dv0,1, Dv0.5 and DV0.9, µm) varied between platforms, relative to application height and ground speed.
Source of VariationdfSum of SquaresF RatioProb > F
Dv0.1 (µm)
Platform3145,312.737.813<0.0001
Application Height (m)215,219.735.94070.0027
Ground Speed (m/s)318,531.94.82230.0025
Height × Speed616,989.912.21050.0401
Platform × Height6111,157.414.4626<0.0001
Platform × Speed917,383.991.50790.1405
MSE835
Dv0.5 (µm)
Platform3498
944.1
66.6<0.0001
Application Height (m)224,949.750.007
Ground Speed (m/s)371,753.79.58<0.0001
Height × Speed614,516.10.970.4452
Platform × Height6190,017.812.68<0.0001
Platform × Speed969,168.93.080.0012
MSE835
Dv0.9 (µm)
Platform3920,24679.6125<0.0001
Application Height (m)242,571.145.52440.0041
Ground Speed (m/s)3318,70327.5717<0.0001
Height × Speed635,850.461.55080.1587
Platform × Height6179,659.57.7714<0.0001
Platform × Speed9196,372.85.6629<0.0001
* MSE835
* Mean Square of Error.
Table 8. Spray droplet parameters as influenced by application height and ground speed for V6A model.
Ground Speed (m·s−1)
Application Height (m)1357ANOVA Statistics
Dv0.1
2130a124abc124abc122abcHeight: F = 11.76; p < 0.0001
3113abc104c108bc110abcSpeed: F = 1.49; p > 0.22
4107bc134ab117abc103cHeight × Speed: F = 2.79; p > 0.01
Dv0.5
2225a207ab197abc195abcdHeight: F = 28.51; p < 0.0001
3191bcde172cde166de165deSpeed: F = 6.58; p > 0.0003
4170cde197abcde172cde164eHeight × Speed: F = 2.04; p > 0.06
Dv0.9
2330a296ab266bcd281bcHeight: F = 24.60; p < 0.0001
3287ab251bcde239cde228deSpeed: F = 17.05; p < 0.0001
4260bcde278abcd233cde220eHeight × Speed: F = 1.60; p > 0.15
% Coverage
24.36a1.94b1.67b0.54bHeight: F = 7.33; p > 0.0009
34.71a1.64b0.75b0.41bSpeed: F = 31.73; p < 0.0001
42.05b0.63b0.52b0.36bHeight × Speed: F = 2.15; p > 0.05
Spray Application Rate (L·ha−1)
214.88a6.40b5.34b1.70bHeight: F = 7.61; p > 0.0007
314.93a4.69b2.15b1.19bSpeed: F = 30.41; p < 0.0001
46.36b2.01b1.48b1.0bHeight x Speed: F = 2.07; p > 0.06
Application height × ground speed interaction means followed by the same lower-case letter are not significantly different (p < 0.05) according to Tukey’s Method. Degrees of freedom for Height: 2, 180; Speed: 3, 180; and Height × Speed: 6, 180.
Table 9. Spray droplet spectra captured on WSP collectors as influenced by application height and ground speed for the M6E-1 aircraft.
Ground Speed (m·s−1)
Application Height (m)1357ANOVA Statistics
Dv0.1
2188abc164bc182abc163cHeight: F = 15.88; p < 0.0001; df = 2, 196
3245a201abc229ab244aSpeed: F = 0.79; p > 0.50; df = 3, 196
4186abc197abc183abc181abcHeight × Speed: F = 0.94; p > 0.47; df = 6, 196
Dv0.5
2339ab288b300ab285bHeight: F = 17.44; p < 0.0001
3380a246ab371a338abSpeed: F = 4.50; p > 0.0044
4324ab298ab268b276bHeight × Speed: F = 0.55; p > 0.77
Dv0.9
2480ab397bcd403bcd352dHeight: F = 8.71; p > 0.0002
3515a444abcd464abc419abcdSpeed: F = 16.49; p < 0.0001
4487ab406abcd359d381cdHeight × Speed: F = 0.90; p > 0.50
% Coverage
23.35a0.65c0.59c0.28cHeight: F = 0.36; p > 0.70
32.94a1.02bc0.77c0.41cSpeed: F = 47.23; p < 0.0001
42.30ab0.98bc0.68c0.48cHeight × Speed: F = 1.32; p > 0.25
Spray Application Rate (L·ha−1)
212.78a2.40c2.24c1.04cHeight: F = 0.50; p > 0.60
311.39a3.94bc3.01c1.58cSpeed: F = 47.98; p < 0.0001
48.80ab3.62bc2.46c1.83cHeight × Speed: F = 1.28; p > 0.2
Application height × ground speed interaction means followed by the same lower-case letter are not significantly different (p < 0.05) according to Tukey’s Method. Degrees of freedom for Height: 2, 196; Speed: 3, 196; and Height × Speed: 6, 196.
Table 10. Spray droplet spectra captured on WSP collectors as influenced by application height and ground speed for V6A Pro model.
Ground Speed (m·s−1)
Application Height (m)1357ANOVA Statistics
Dv0.1
2117ab91b109ab89bHeight: F = 0.24; p > 0.78; df
3128a94b100ab97bSpeed: F = 10.31; p < 0.0001
4113ab92b104ab107abHeight × Speed: F = 1.28; p > 0.27
Dv0.5
2209ab162b175ab167abHeight: F = 0.12; p > 0.89
3227a149b159b161bSpeed: F = 12.69; p < 0.0001
4210ab149b153b188abHeight × Speed: F = 0.87; p > 0.51
Dv0.9
2324a233bc234bc210cHeight: 1.73; p > 0.18
3340a207c208c219bcSpeed: 29.99; p < 0.0001
4285ab207c190c235bcHeight × Speed: 1.58: p > 0.15
% Coverage
26.78a1.07b0.88b0.15bHeight: F = 9.39; p > 0.0001
36.37a0.22b0.38b0.20bSpeed: F = 57.56; p < 0.0001
42.07b0.15b0.16b0.13bHeight × Speed: F = 5.18; p < 0.0001
Spray Application Rate (L·ha−1)
222.93a2.91b2.57b0.41bHeight: F = 8.26; p > 0.0003
321.79a0.56b1.05b0.56bSpeed: F = 50.17; p < 0.0001
46.21b0.40b0.44b0.37bHeight × Speed: F = 5.15; p < 0.0001
Application height × ground speed interaction means followed by the same lower-case letter are not significantly different (p < 0.05) according to Tukey’s Method. Degrees of freedom for Height: 2, 228; Speed: 3, 228; and Height × Speed: 6, 228.
Table 11. Spray droplet spectra captured on WSP collectors as influenced by application height and ground speed for V8A Pro model.
Ground Speed (m·s−1)
Application Height (m)1357ANOVA Statistics
Dv0.1
2104a92ab94ab89abHeight: F = 0.20; p > 0.82
399ab96ab95ab96abSpeed: F = 3.01; p > 0.03
497ab100ab85b96abHeight × Speed: F = 1.62; p > 0.14
Dv0.5
2183a161abcde153bcde147deHeight: F = 0.58; p > 0.56
3178ab172abcd151cde159abcdeSpeed: F = 16.96; p < 0.0001
4174abc175abc144e153bcdeHeight × Speed: F = 1.20; p > 0.31
Dv0.9
2269a236abcd228bcd211dHeight: F = 0.13; p > 0.88
3259ab254abc216d218bcdSpeed: F = 20.96; p < 0.0001
4254abc254abc212d215cdHeight × Speed: F = 1.27; p > 0.27
% Coverage
24.25a2.01ab0.75b0.47bHeight: F = 0.12; p > 0.89
33.41a2.34ab0.74b0.27bSpeed: F = 23.57; p < 0.0001
43.78a2.80ab0.56b0.31bHeight × Speed: F = 0.35; p > 0.91
Spray Application Rate (L·ha−1)
213.76a5.70abc2.01c1.27cHeight: F = 0.10; p > 0.90
310.61ab7.01abc2.03c0.74bcSpeed: F = 21.86; p < 0.0001
411.64a8.33abc1.43c0.83cHeight × Speed: F = 0.41; p > 0.87
Application height × ground speed interaction means followed by the same lower-case letter are not significantly different (p < 0.05) according to Tukey’s Method. Degrees of freedom for Height: 2, 213; Speed: 3, 213; and Height × Speed: 6, 213.
Publisher’s Note: MDPI stays neutral with regard to jurisdictional claims in published maps and institutional affiliations.

