Article

Effects of Flight and Smoothing Parameters on the Detection of Taxus and Olive Trees with UAV-Borne Imagery

1
Bio-Research, PXL University College, 3590 Diepenbeek, Belgium
2
Division of Forest, Nature and Landscape, KU Leuven, 3001 Leuven, Belgium
3
Center for Environmental Sciences, Hasselt University, 3590 Diepenbeek, Belgium
4
Laboratory of Remote Sensing, Spectroscopy and GIS, Aristotle University of Thessaloniki, 54124 Thessaloniki, Greece
5
Smart-ICT, PXL University College, 3500 Hasselt, Belgium
6
Laboratory of Forest Management and Remote Sensing, Aristotle University of Thessaloniki, 54124 Thessaloniki, Greece
*
Author to whom correspondence should be addressed.
Drones 2022, 6(8), 197; https://doi.org/10.3390/drones6080197
Submission received: 29 June 2022 / Revised: 27 July 2022 / Accepted: 6 August 2022 / Published: 8 August 2022
(This article belongs to the Special Issue Using Drones for Individual Tree Detection (ITD) and Its Applications)

Abstract

:
Recent technical and jurisdictional advances, together with the availability of low-cost platforms, have facilitated the implementation of unmanned aerial vehicles (UAVs) in individual tree detection (ITD) applications. UAV-based photogrammetry or structure from motion is an example of such a low-cost technique, but requires detailed pre-flight planning in order to generate the desired 3D-products needed for ITD. In this study, we aimed to find the most optimal flight parameters (flight altitude and image overlap) and processing options (smoothing window size) for the detection of taxus trees in Belgium. Next, we tested the transferability of the developed marker-controlled segmentation algorithm by applying it to the delineation of olive trees in an orchard in Greece. We found that the processing parameters had a larger effect on the accuracy and precision of ITD than the flight parameters. In particular, a smoothing window of 3 × 3 pixels performed best (F-scores of 0.99) compared to no smoothing (F-scores between 0.88 and 0.90) or a window size of 5 (F-scores between 0.90 and 0.94). Furthermore, the results show that model transferability can still be a bottleneck as it does not capture management induced characteristics such as the typical crown shape of olive trees (F-scores between 0.55 and 0.61).

1. Introduction

Unmanned aerial vehicles (UAVs), or drones, are becoming an increasingly important research topic in remote sensing applications [1]. Recent technical and jurisdictional advances have facilitated the implementation of UAVs in various research domains [2,3] including forest inventory and individual tree detection (ITD) [4,5,6]. Similarly, recent advancements in capacities have brought them to the forefront of agricultural innovation, becoming a core part of the increasingly data-driven agriculture [7]. Photogrammetry applications based on structure from motion have been presented as low-cost, promising alternatives to active remote sensing techniques such as Light Detection and Ranging (LiDAR) [8]. UAV photogrammetry relies on the acquisition of a large number of images with a specified overlap to generate 3D-products such as point clouds, digital terrain models (DTMs), digital surface models (DSMs), and canopy height models (CHMs). As stated by [9], this approach requires detailed pre-flight planning as varying definitions of flight parameters including flight altitude and image overlap, which might result in different 3D-outputs and computation times. Flight altitude is related to the spatial resolution of the collected imagery, while image overlap has an effect on the quality and density of the resulting point cloud [10,11]. Flying direction, flying speed, and camera pitch have also been mentioned as important flight parameters [12,13]. In addition to these flight parameters, the selection of the Structure from Motion software, the ITD algorithm and processing parameterizations such as point cloud thinning and CHM smoothing intensity can also impact the quality of the resulting inventories [13,14,15,16].
Nowadays, a host of novel and potentially low-cost observational platforms are rapidly maturing and are becoming viable alternatives to costlier solutions that are mainly used for research or large-scale applications. However, these tools need to be tested and evaluated in terms of performance in diverse field conditions, along with the full chain of interconnected systems to pave the way for the development of tailored downstream services aimed at farmers, cooperatives, and decision makers. In this study, we tested an ITD approach on two plantations: a taxus (Taxus baccata L.) tree nursery in Belgium, and an olive (Olea europaea L.) orchard in Greece. In the Belgian study area, the objective was to find the most optimal flight parameter settings (i.e., flight altitude and image overlap) for the ITD of taxus trees. The Greek study area was included with the aim to test model transferability by applying it to a different tree species. For both sites, the effect of different smoothing window sizes on the resulting ITD performance was evaluated.

2. Materials and Methods
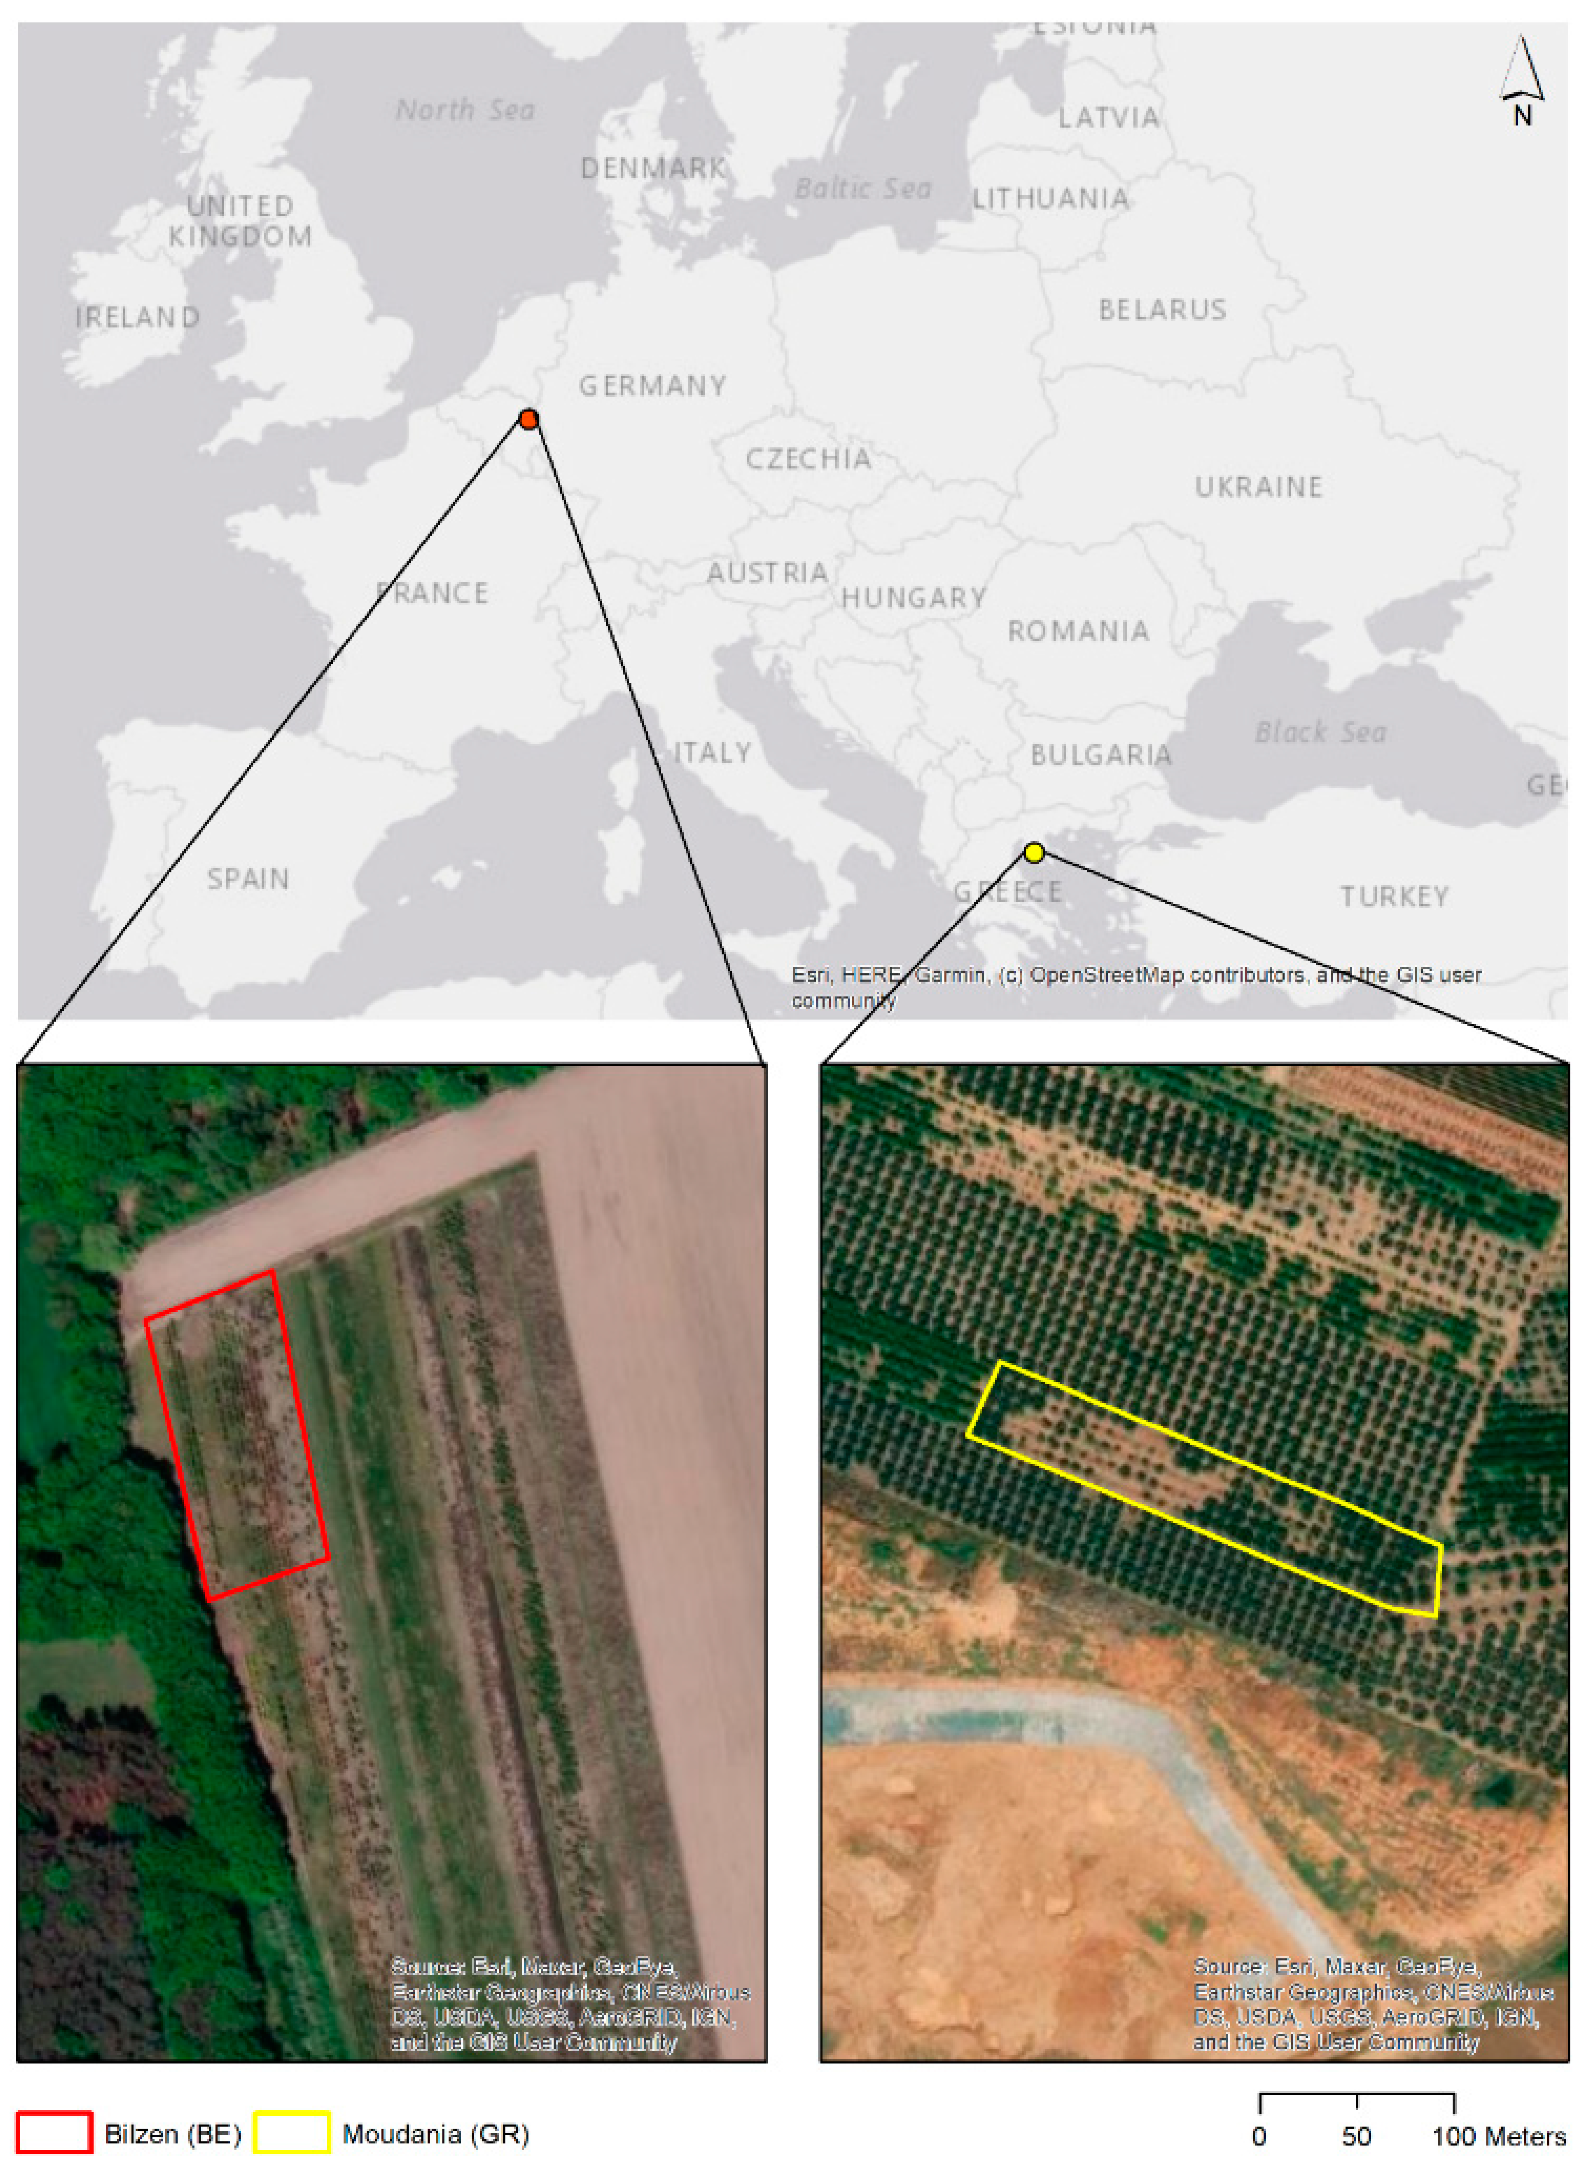
2.1. Study Sites

The study sites include a nursery of taxus (Taxus baccata L.) trees in Bilzen, Belgium and an olive (Olea europaea L.) orchard in Moudania, Greece (Figure 1). In the taxus plantation, an area of 0.40 ha with 237 trees was selected, while the olive orchard consisted of 158 trees on an area of 0.60 ha.

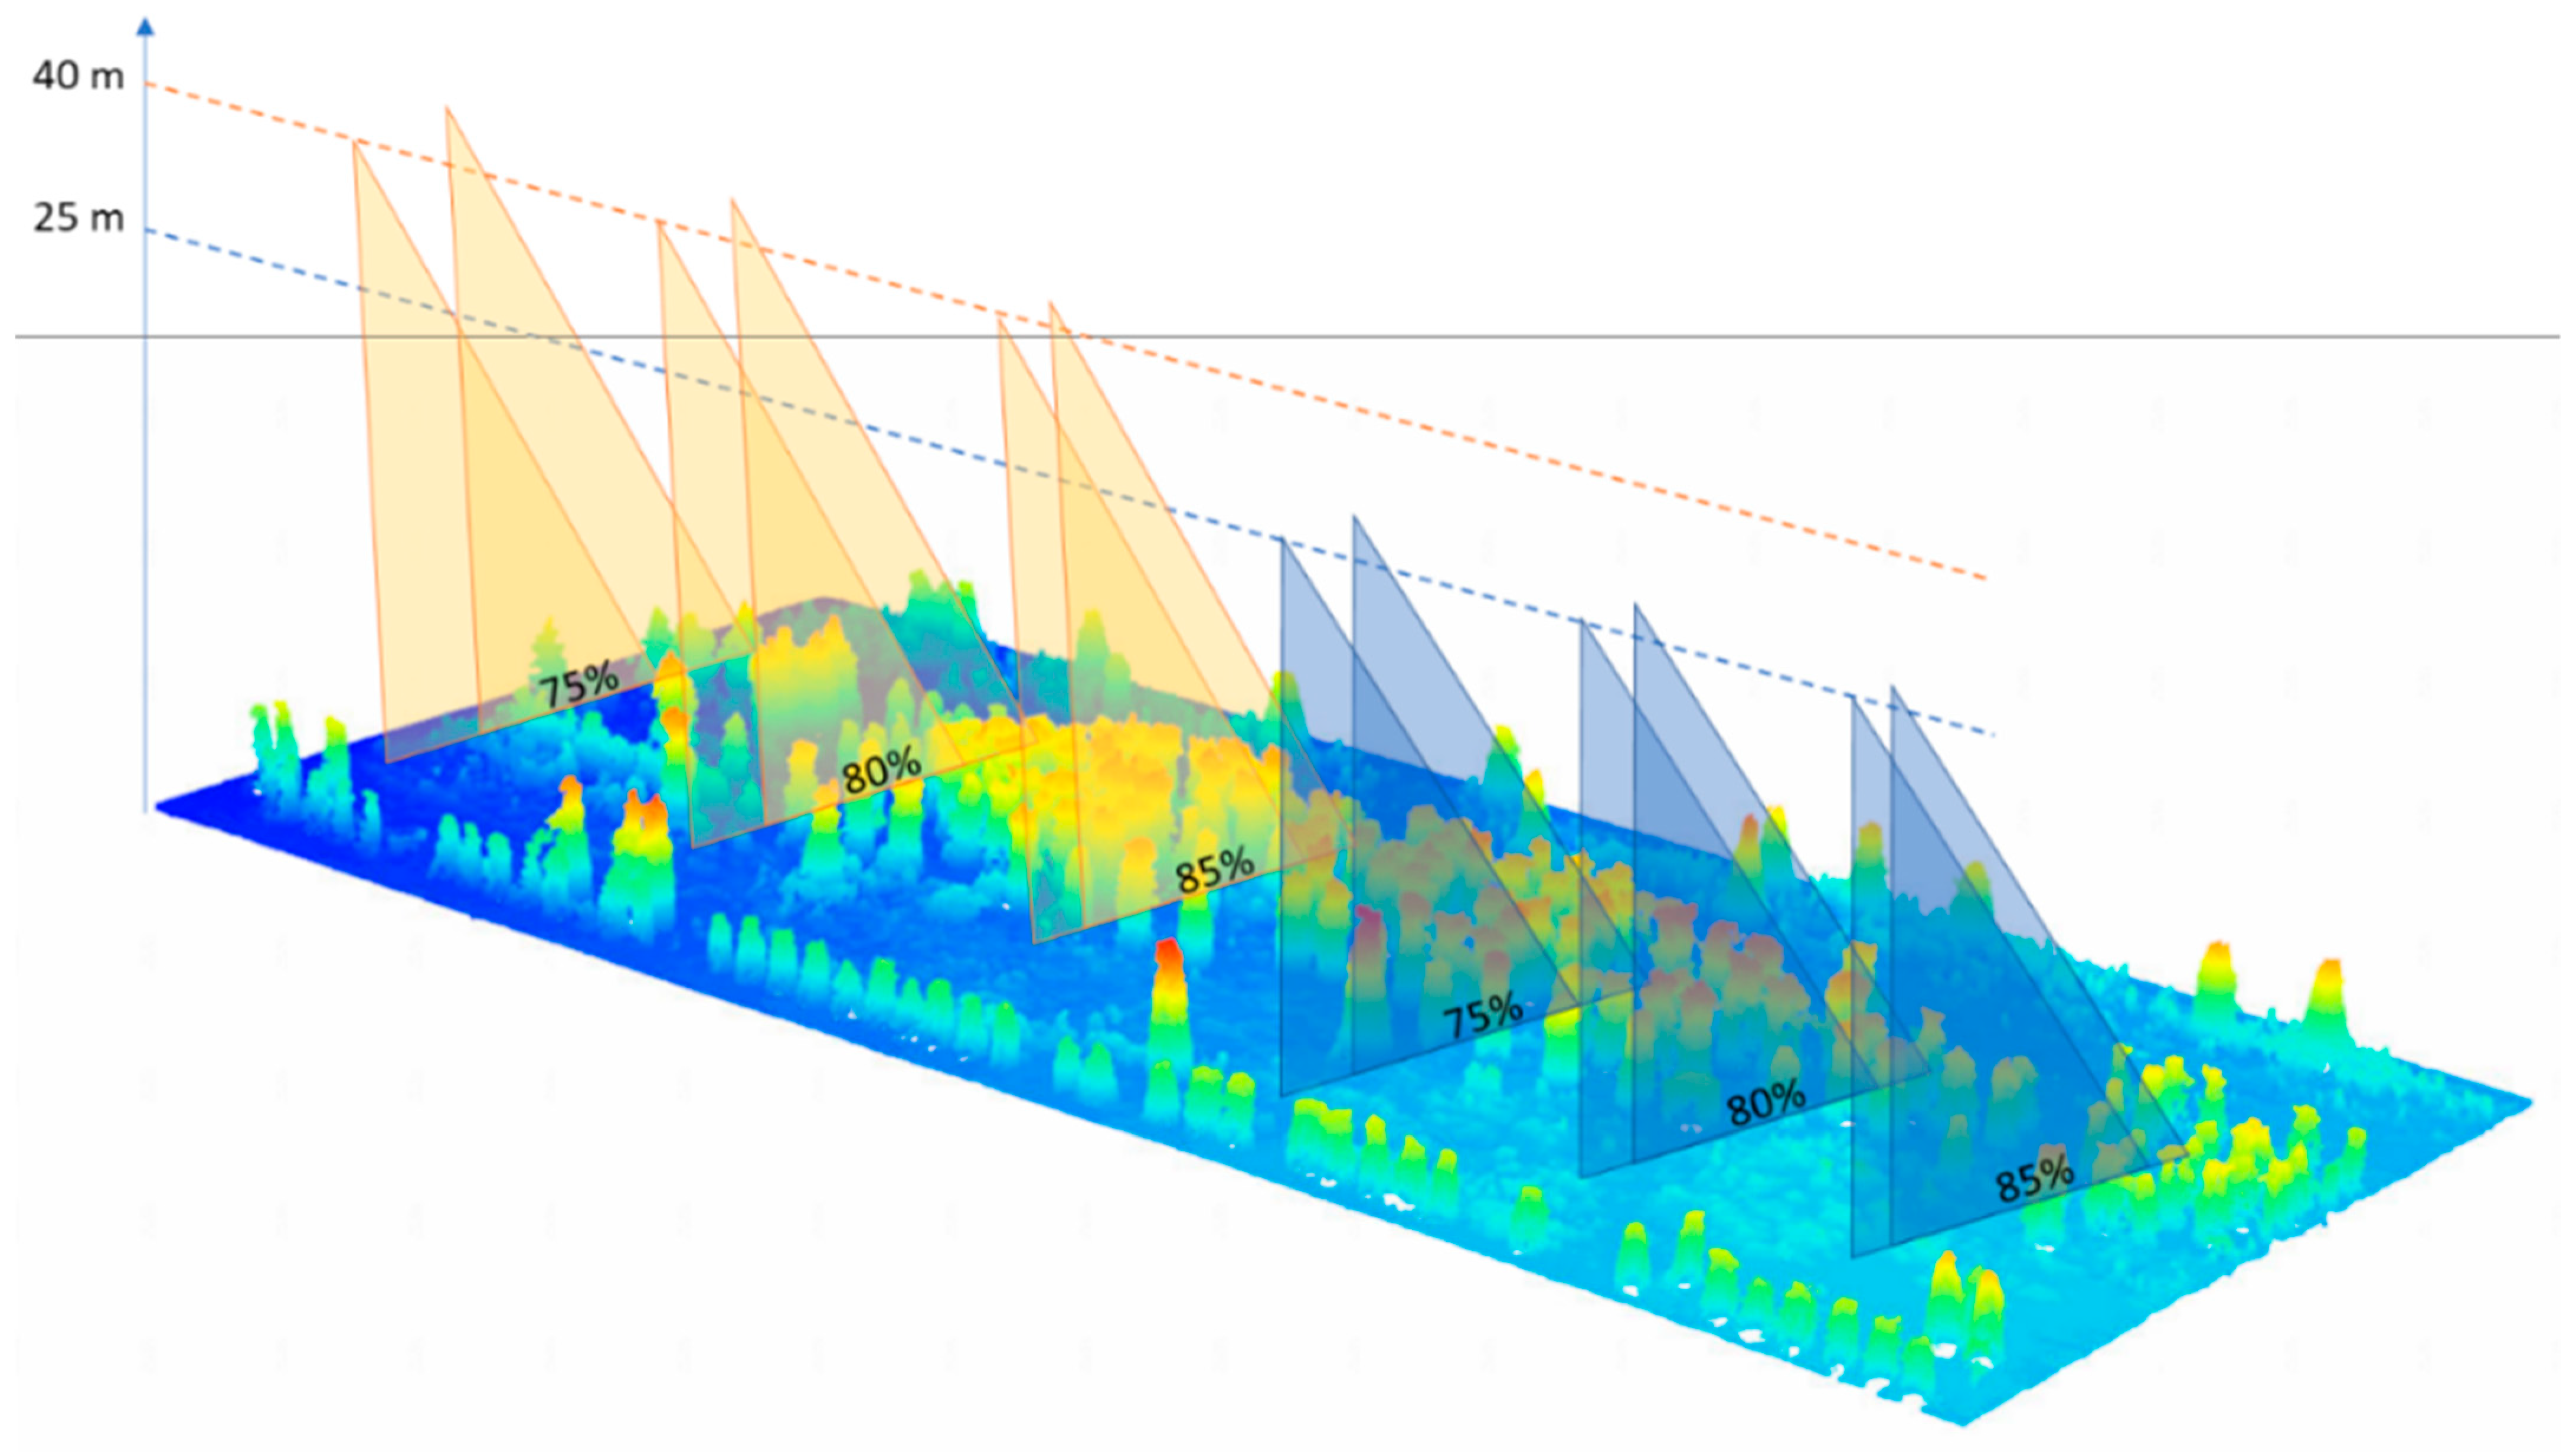
2.2. UAV Data Collection

In the Bilzen site, UAV missions were performed in November 2021 using a multirotor DJI Phantom 4 RTK with RGB (FC6310R_8.8_5472x3648) sensor. During the entire duration of the flight, an RTK (Real-Time Kinematic) connection was established with the reference station network of the Flemish Positioning Service (FLEPOS). In total, six flight missions were conducted with varying flight parameters: two different flight altitudes (25 and 40 m above ground level (AGL)) and three different (front and side) image overlap ratios (75–80–85%; see Table 1 and Figure 2). During all missions, the flying speed was 2 m/s. Imagery of the Moudania site was collected in July 2018 using an RGB-SODA sensor (S.O.D.A._10.6_5472x3648) attached to a fixed-wing eBee plus platform. Here, only one mission was carried out with a flight altitude of 75 m AGL and a front and side image overlap of 80% and 60%, respectively. The average flying speed during this mission was 40 km/h.

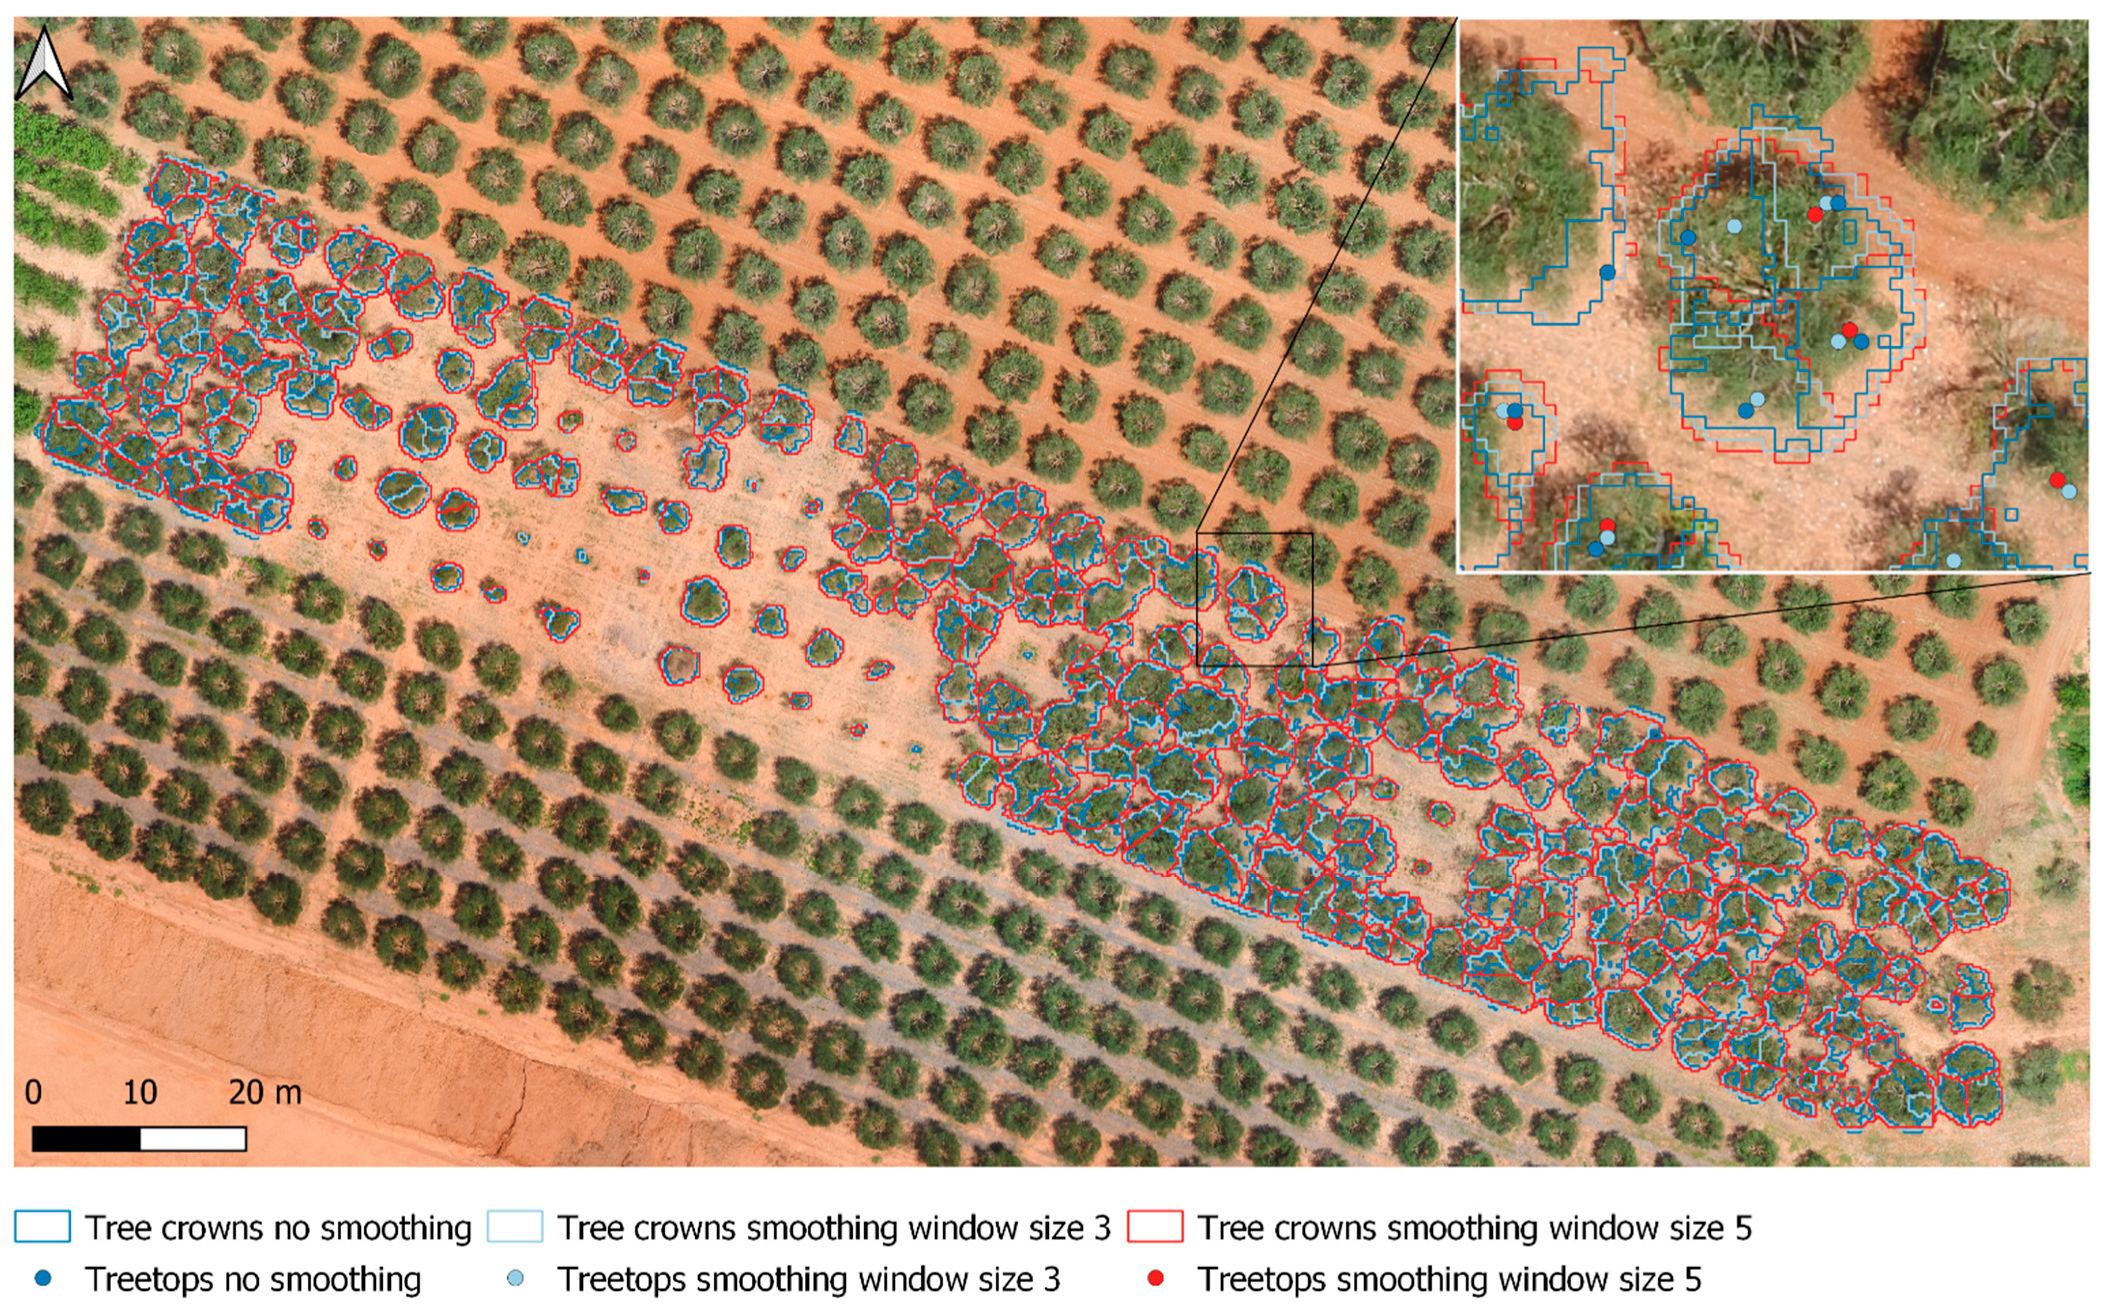
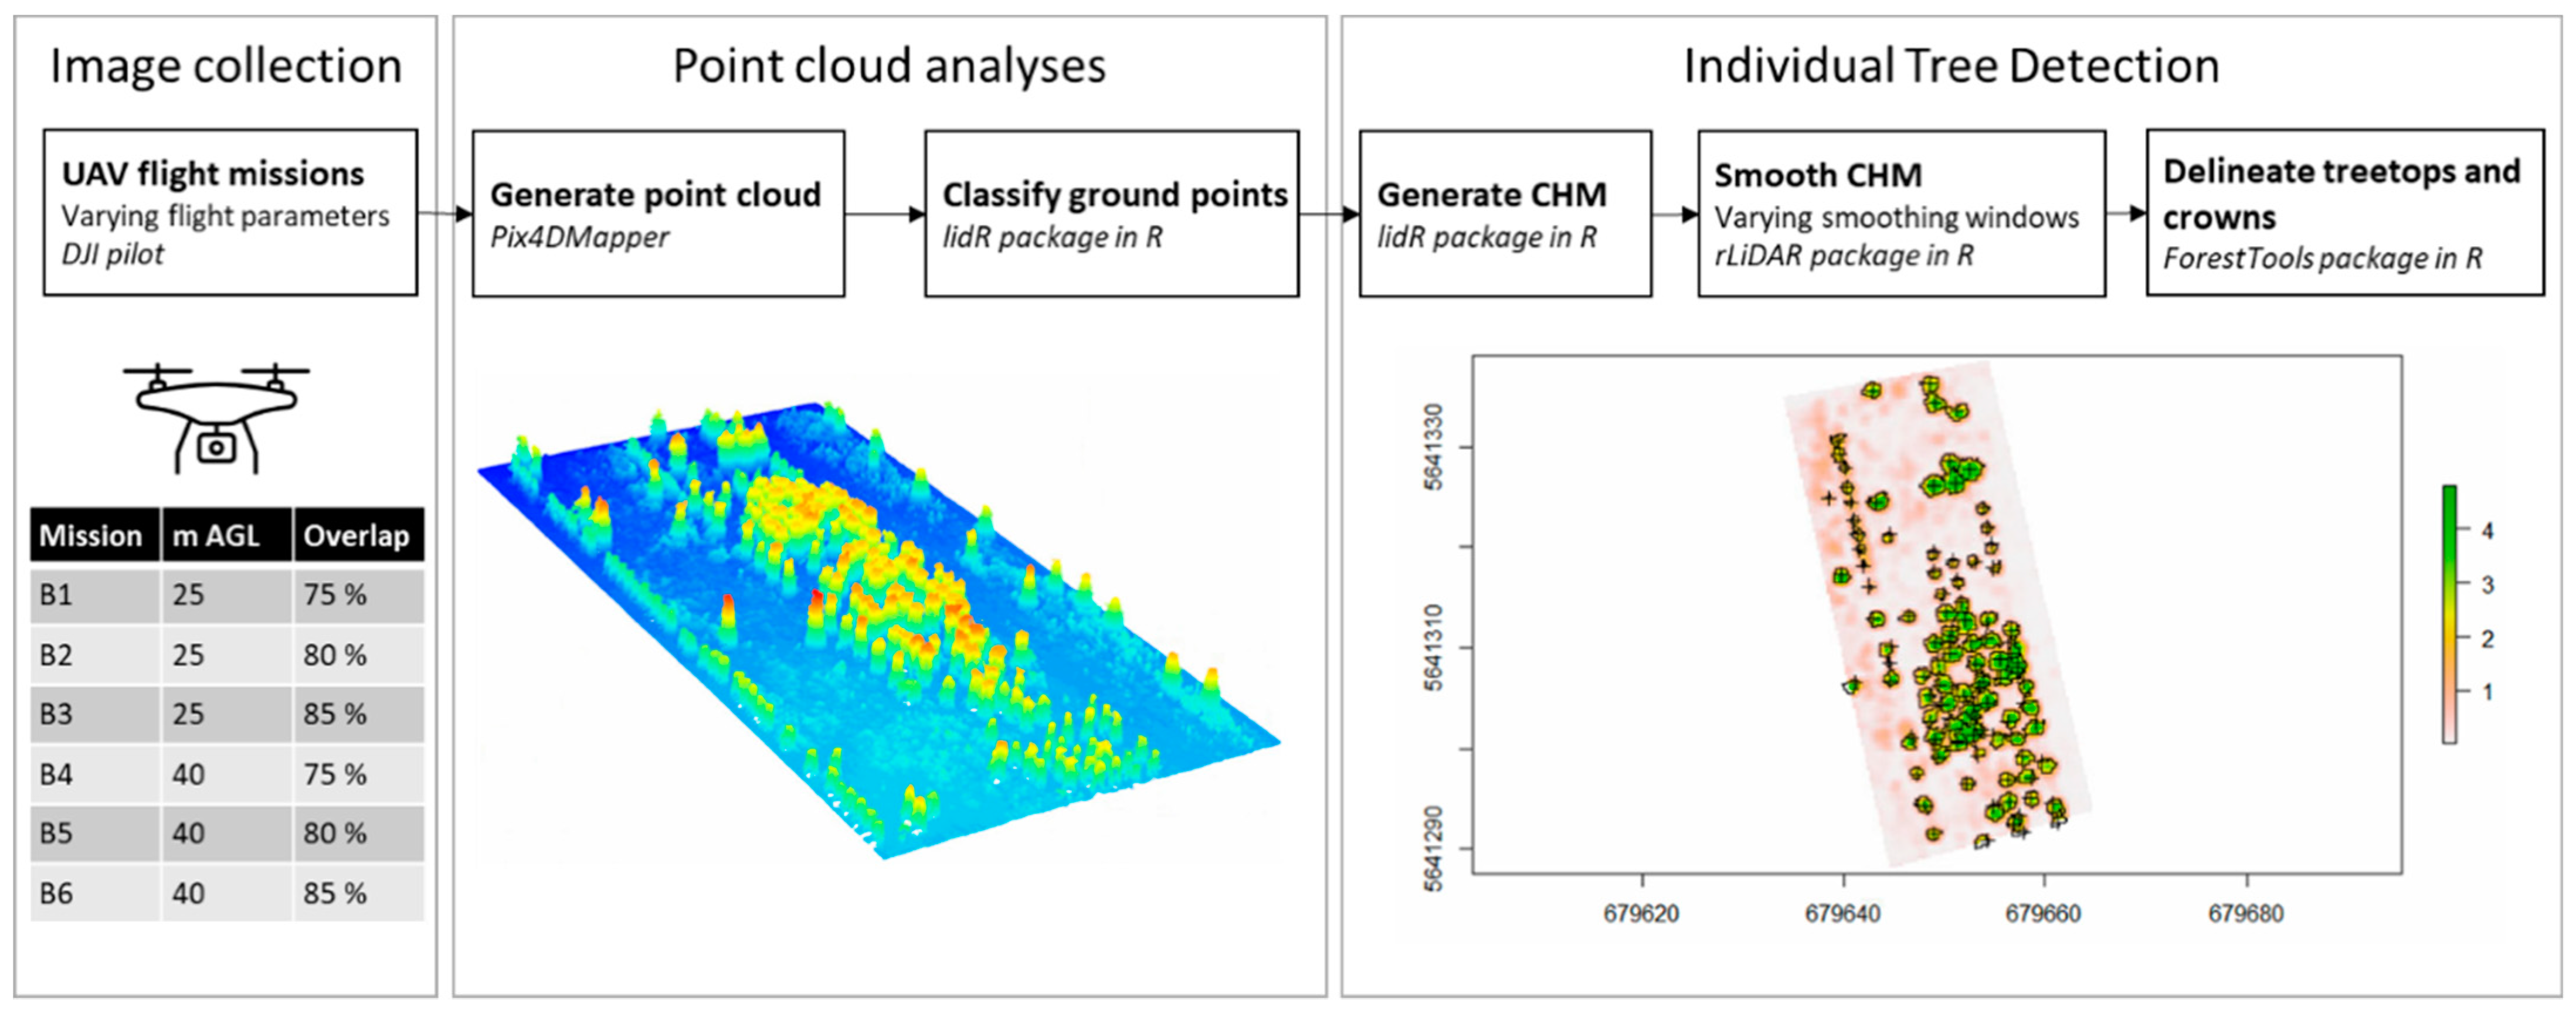
2.3. Image Processing

All collected images were pre-processed using Pix4Dmapper-software (Pix4D S.A., Lausanne, Switzerland). Processing involved image calibration, point cloud generation and densification, and raster mosaicking and was in line with the ‘3D Maps’ processing template. The generated point cloud was used in further analyses to delineate individual treetops and crowns (Figure 3). During this procedure, first, the generated point cloud was classified using the classify_ground function of the lidR-package in R-software [17]. Segmentation of ground points was based on a progressive morphological filter, in line with [8]. Next, the DTM was created using the grid_terrain function. In line with [8], a cell size of 0.25 m was defined, and the function normalize_height was used to normalize the point cloud elevation values. The canopy height model (CHM) was generated based on the upper returns of the point cloud and the generated DTM, as implemented in the grid_canopy function.
The generated CHMs are typically smoothened to improve the effectiveness of treetop detection algorithms by filtering out spread-out tree branches and obtain only one local maximum in each crown [18]. Here, we implemented three different smoothing window sizes: no smoothing, a 3 × 3 pixel window size, and a 5 × 5 pixel window size. Smoothing the CHM was carried out by using the CHMsmoothing function of the rLiDAR package [19]. Treetops were detected using a variable window filter with the vwf function of the ForestTools package [20]. This algorithm applies a moving window to the CHM in order to classify treetops as the pixels with the highest height in a certain radius. Since this radius itself depends on the height of the tree, first, a (linear) model was fitted between the crown radius and the tree height (Equations (1) and (2)). For the Bilzen site, tree height measurements were available for 50 trees. Since no field measurements were available for the olive plantation, tree heights were derived from the computed CHM. The crown radii of 50 trees at each of the sites were computed through manual delineation in QGIS 3.16 software.
Taxus   crown   radius   m = 0.41844 + 0.07912 Tree   height   m
Olive   crown   radius   m = 0.6690 + 0.3624 Tree   height   m
Finally, the computed treetops were used to outline the tree crowns using the mcws function. This function implements a watershed algorithm in combination with marker-controlled segmentation (using the treetops). Spatial statistics of the detected trees were generated using the sp_summarize function.

2.4. ITD Accuracy Assessment

The performance of the tree delineation approaches was tested by computing the number of trees that were detected correctly (true positive, TP), omitted (false negative, FN), and committed (false positive, FP). Based on these metrics, the recall (r, [3]), precision (p, [4]), and F-score (F, [5]) values were computed using the equations below. Recall or sensitivity is a measure of the tree detection rate, while precision indicates the correctness of the detected trees. The F-score is an overall summary of the ITD performance, taking both recall and precision into account, and ranges between 0 (none of the trees detected) and 1 (all trees detected without FPs).
r = TP TP + FN
p = TP TP + FP
F = 2 r p r + p

3. Results

3.1. Data Collection

The varying flight parameters implemented at the Bilzen site resulted in differences in the effective flight time and the number of collected images (Table 1). The flight carried out at 40 m AGL with an image overlap of 75% collected 97 images, which was 35% of the images collected during the flight at 25 m AGL and 85% overlap.

3.2. Taxus Tree Delineation

In total, 237 trees were present in the field. Even though no algorithm was able to detect all trees correctly, for each combination of flight parameters, a smoothing window size of 3 resulted in the best ITD, as reflected by the higher recall, precision, and F-score values (Table 2, Figure 4). In addition, the results indicate that the effects of smoothing application were more pronounced than the effects of varying flight parameters. Not applying smoothing resulted in a higher number of trees that were falsely detected (and thus higher FP and lower precision scores), whereas applying a larger window size of 5 resulted in more trees that were omitted (and thus higher FN and lower recall scores). Average tree heights were generally lower when applying the largest smoothing window of 5 (2.98–3.08 m) compared to no smoothing (3.37–3.48 m) or a smoothing window of 3 (3.42–3.43 m). On the other hand, the average crown areas were lower when no smoothing was applied (1.46–1.52 m2) compared to a smoothing window of 3 or 5 (1.71–1.83 m2 and 1.87–2.07 m2, respectively).

3.3. Olive Tree Delineation

All modeling approaches overestimated the total number of trees (Table 3). This overestimation was higher when no smoothing was applied (FP = 231 trees), compared to a smoothing window of 3 (FP = 198 trees) and 5 (FP = 139 trees). This resulted in an overall low precision, ranging between 0.39 (no smoothing) and 0.48 (smoothing window of 5). Due to the specific habitus of olive trees—lacking a distinct treetop—the delineation algorithm detected multiple trees in one olive tree (Figure 5). The application of a smoothing window decreased the mean tree heights (2.55–2.29–2.12 m) and increased the mean crown area (6.83–8.70–11.13 m2).

4. Discussion

4.1. Tree Delineation Performance

In this study, we trained an ITD algorithm to detect the taxus trees and assessed its transferability on olive trees. The results showed varying accuracy and precision values, depending on the tree species and its structural characteristics. For the taxus trees, the delineation algorithm performed better, as reflected by F-scores ranging between 0.88 and 0.99. For olive trees, on the other hand, the delineation approach was less accurate and precise, resulting in F-scores between 0.55 and 0.61. Earlier studies, focusing on ITD in conifer-dominated forest stands, obtained F-scores between 0.71 and 0.87, and even below 0.60 in high-density stands or understory trees (see overview in [13]). The authors of [14] reported ITD accuracies of 97% for dominant overstory, and 67% for suppressed understory trees. Similarly, [21] found higher F-scores for low-density stands (0.94) compared to the medium- (0.8) and high-density (0.44) stands. Since this study focused on tree plantations, which are typically less complex than forest systems since individual trees do not overlap, the higher F-scores for the taxus trees were to be expected. In the olive orchard, however, the trees were also planted at relatively fixed distances from each other and the tree crowns did not overlap. Caution is required when comparing the two sites, since UAV-imagery was collected using different UAV-platforms and flight planning parameters. However, the lower precision and F-scores are likely to be explained by the specific architecture of the tree crown, characterized by a multiplex [22] or top-open spherical canopy [23]. Since the ITD algorithm looks for local maxima and uses the maxima in a marker-controlled watershed segmentation, the absence of a clear treetop can lead to the division of a sole tree into multiple trees. To avoid such inaccuracies, smoothing can be applied [8,18]. In this study, smoothing did indeed improve the delineation results, but a smoothing window of 5 × 5 pixels did not suffice. A larger smoothing window could result in improved detection results but might lead to the underestimation of tree heights as maximum values tend to be filtered out. In such cases, the adoption of a more smoothed CHM to delineate the trees, in combination with an less smoothed CHM to compute the tree, heights might be a solution. The availability of quantitative information about the trade-off between smoothing application and ITD performance will be useful for individual end users to select the most appropriate settings. Another possible approach to overcome the inaccuracies above-mentioned is the inclusion of multispectral imagery in ITD approaches [24,25,26].

4.2. Flight Parameterization

For the Bilzen site, we were able to test the effect of different flight parameters (flight altitude and image overlap) on the delineation of taxus trees. From these results, we can conclude that these parameters (as expected) have a large effect on the total flight time and total number of images collected. Whereas the total number of images and required storage space ranged between 97 images/767 MB (40 m–75% overlap) and 277/2.21 GB (25 m AGL–85% overlap), only minor differences in the recall, precision, and F-score were noted. The availability of such information on the trade-off between ITD performance and battery/computational capacity is important when setting up a flight plan. To this end, suboptimal flight parameters resulting in minor losses of accuracy could be preferable when flying over large areas because of the limitations associated with flight time, storage capacity, and computational capacity. These findings are in line with the results of [9], who recommends higher flight altitudes (100 m instead of 50 m) with sufficient overlap above olive orchards, as these missions reduce the processing time without causing losses in accuracy. Young et al. (2022) [13] found that a flight altitude of 120 m performed better than lower altitude flights (90 m) when the image overlaps were lower (below 90% front and side overlap) and similar when the overlaps were larger than 90%. In addition, de Lima et al. (2021) [27] tested the varying front and side overlaps and found that a flight at 120 m with 90% lateral and 70% longitudinal overlap was the most optimal combination for ITD in a pine forest.

5. Conclusions

The maintenance and management of tree nurseries and orchards can benefit from efficient and low-cost inventory techniques such as structure from motion based on UAV imagery. In this study, we showed that the availability of 3D-point clouds is useful to delineate individual trees, but that model transferability across sites can be a bottleneck. We found that a marker-controlled watershed segmentation algorithm worked well for taxus trees (F-scores between 0.88 and 0.99), but was not able to accurately delineate olive trees (F-scores between 0.55 and 0.61) due to their specific habitus lacking a clear treetop. In addition, we found that processing parameters such as the smoothing window had a larger effect on the accuracy and precision of ITD than flight parameters such as flight altitude and image overlap. The availability of such quantitative information about the trade-off between ITD performance and collection/processing capacity can support more efficient pre-flight planning. The fusion of the applied 3D-segmentation with multispectral imagery can further improve the ITD algorithms.

Author Contributions

Conceptualization, S.O., N.T., I.A., G.Z. and A.D.V.; Methodology, S.O., N.T. and I.A.; Software, S.O., K.V.M. and S.T.; Validation, M.S., D.S., K.V.M., G.Z. and A.D.V.; Formal analysis, S.O. and I.A.; Writing—original draft preparation, S.O.; Writing—review and editing, S.O., N.T., I.A., S.T., M.S., D.S., I.Z.G., K.V.M., G.Z. and A.D.V.; Visualization, S.O.; Supervision, G.Z. and A.D.V. All authors have read and agreed to the published version of the manuscript.

Funding

This research was partly funded by Fonds Wetenschappelijk Onderzoek, grant number V410722N.

Institutional Review Board Statement

Not applicable.

Informed Consent Statement

Not applicable.

Data Availability Statement

Not applicable.

Acknowledgments

We acknowledge the logistic support of the field owners and managers. We also thank the three anonymous reviewers for their constructive comments and suggestions.

Conflicts of Interest

The authors declare no conflict of interest. The funders had no role in the design of the study; in the collection, analyses, or interpretation of data; in the writing of the manuscript; or in the decision to publish the results.

References

  1. Toth, C.; Jóźków, G. Remote Sensing Platforms and Sensors: A Survey. ISPRS J. Photogramm. Remote Sens. 2016, 115, 22–36. [Google Scholar] [CrossRef]
  2. Demir, K.A.; Cicibas, H.; Arica, N. Unmanned Aerial Vehicle Domain: Areas of Research. Def. Sci. J. 2015, 65, 319–329. [Google Scholar] [CrossRef]
  3. Tsiamis, N.; Efthymiou, L.; Tsagarakis, K.P. A Comparative Analysis of the Legislation Evolution for Drone Use in Oecd Countries. Drones 2019, 3, 75. [Google Scholar] [CrossRef] [Green Version]
  4. Dainelli, R.; Toscano, P.; Di Gennaro, S.F.; Matese, A. Recent Advances in Unmanned Aerial Vehicles Forest Remote Sensing—a Systematic Review. Part II: Research Applications. Forests 2021, 12, 397. [Google Scholar] [CrossRef]
  5. Rodríguez-Puerta, F.; Gómez-García, E.; Martín-García, S.; Pérez-Rodríguez, F.; Prada, E. UAV-Based LiDAR Scanning for Individual Tree Detection and Height Measurement in Young Forest Permanent Trials. Remote Sens. 2022, 14, 170. [Google Scholar] [CrossRef]
  6. Mohan, M.; Silva, C.A.; Klauberg, C.; Jat, P.; Catts, G.; Cardil, A.; Hudak, A.T.; Dia, M. Individual Tree Detection from Unmanned Aerial Vehicle (UAV) Derived Canopy Height Model in an Open Canopy Mixed Conifer Forest. Forests 2017, 8, 340. [Google Scholar] [CrossRef] [Green Version]
  7. Liu, J.; Xiang, J.; Jin, Y.; Liu, R.; Yan, J.; Wang, L. Boost Precision Agriculture with Unmanned Aerial Vehicle Remote Sensing and Edge Intelligence: A Survey. Remote Sens. 2021, 13, 4387. [Google Scholar] [CrossRef]
  8. Mohan, M.; Leite, R.V.; Broadbent, E.N.; Wan Mohd Jaafar, W.S.; Srinivasan, S.; Bajaj, S.; Dalla Corte, A.P.; Do Amaral, C.H.; Gopan, G.; Saad, S.N.M.; et al. Individual Tree Detection Using UAV-Lidar and UAV-SfM Data: A Tutorial for Beginners. Open Geosci. 2021, 13, 1028–1039. [Google Scholar] [CrossRef]
  9. Torres-Sánchez, J.; López-Granados, F.; Borra-Serrano, I.; Manuel Peña, J. Assessing UAV-Collected Image Overlap Influence on Computation Time and Digital Surface Model Accuracy in Olive Orchards. Precis. Agric. 2018, 19, 115–133. [Google Scholar] [CrossRef]
  10. Ni, W.; Sun, G.; Pang, Y.; Zhang, Z.; Liu, J.; Yang, A.; Wang, Y.; Zhang, D. Mapping Three-Dimensional Structures of Forest Canopy Using UAV Stereo Imagery: Evaluating Impacts of Forward Overlaps and Image Resolutions With LiDAR Data as Reference. IEEE J. Sel. Top. Appl. Earth Obs. Remote Sens. 2018, 11, 3578–3589. [Google Scholar] [CrossRef]
  11. Swayze, N.C.; Tinkham, W.T.; Vogeler, J.C.; Hudak, A.T. Influence of Flight Parameters on UAS-Based Monitoring of Tree Height, Diameter, and Density. Remote Sens. Environ. 2021, 263, 112540. [Google Scholar] [CrossRef]
  12. Tu, Y.H.; Phinn, S.; Johansen, K.; Robson, A.; Wu, D. Optimising Drone Flight Planning for Measuring Horticultural Tree Crop Structure. ISPRS J. Photogramm. Remote Sens. 2020, 160, 83–96. [Google Scholar] [CrossRef] [Green Version]
  13. Young, D.J.N.; Koontz, M.J.; Weeks, J.M. Optimizing Aerial Imagery Collection and Processing Parameters for Drone-based Individual Tree Mapping in Structurally Complex Conifer Forests. Methods Ecol. Evol. 2022, 2022, 1447–1463. [Google Scholar] [CrossRef]
  14. Creasy, M.B.; Tinkham, W.T.; Hoffman, C.M.; Vogeler, J.C. Potential for Individual Tree Monitoring in Ponderosa Pine Dominated Forests Using Unmanned Aerial System Structure from Motion Point Clouds. Can. J. For. Res. 2021, 51, 1093–1105. [Google Scholar] [CrossRef]
  15. Pouliot, D.A.; King, D.J.; Bell, F.W.; Pitt, D.G. Automated Tree Crown Detection and Delineation in High-Resolution Digital Camera Imagery of Coniferous Forest Regeneration. Remote Sens. Environ. 2002, 82, 322–334. [Google Scholar] [CrossRef]
  16. Kameyama, S.; Sugiura, K. Effects of Differences in Structure from Motion Software on Image Processing of Unmanned Aerial Vehicle Photography and Estimation of Crown Area and Tree Height in Forests. Remote Sens. 2021, 13, 626. [Google Scholar] [CrossRef]
  17. Roussel, J.-R.; Auty, D.; Coops, N.C.; Tompalski, P.; Goodbody, T.R.H.; Meador, A.S.; Bourdon, J.-F.; de Boissieu, F.; Achim, A. lidR: An R Package for Analysis of Airborne Laser Scanning (ALS) Data. Remote Sens. Environ. 2020, 251, 112061. [Google Scholar] [CrossRef]
  18. Korpela, I.; Anttila, P.; Pitkänen, J. The Performance of a Local Maxima Method for Detecting Individual Tree Tops in Aerial Photographs. Int. J. Remote Sens. 2006, 27, 1159–1175. [Google Scholar] [CrossRef]
  19. Silva, C.A.; Crookston, N.L.; Hudak, A.T.; Vierling, L.A.; Klauberg, C.; Cardil, A.; Hamamura, C. rLiDAR: Data Processing and Visualization. R Package Version 0.1.5. 2021. Available online: https://CRAN.R-project.org/package=rLiDAR (accessed on 28 June 2022).
  20. Plowright, A.; Roussel, J.-R. ForestTools: Analyzing Remotely Sensed Forest Data. R Package Version 0.2.5. 2021. Available online: https://CRAN.R-project.org/package=ForestTools (accessed on 28 June 2022).
  21. Belmonte, A.; Sankey, T.; Biederman, J.A.; Bradford, J.; Goetz, S.J.; Kolb, T.; Woolley, T. UAV-Derived Estimates of Forest Structure to Inform Ponderosa Pine Forest Restoration. Remote Sens. Ecol. Conserv. 2020, 6, 181–197. [Google Scholar] [CrossRef]
  22. Stateras, D.; Kalivas, D. Assessment of Olive Tree Canopy Characteristics and Yield Forecast Model Using High Resolution UAV Imagery. Agriculture 2020, 10, 385. [Google Scholar] [CrossRef]
  23. Fernández, J.E.; Diaz-Espejo, A.; D’Andria, R.; Sebastiani, L.; Tognetti, R. Potential and Limitations of Improving Olive Orchard Design and Management through Modelling. Plant Biosyst. 2008, 142, 130–137. [Google Scholar] [CrossRef] [Green Version]
  24. Šiljeg, A.; Panđa, L.; Domazetović, F.; Marić, I.; Gašparović, M.; Borisov, M.; Milošević, R. Comparative Assessment of Pixel and Object-Based Approaches for Mapping of Olive Tree Crowns Based on UAV Multispectral Imagery. Remote Sens. 2022, 14, 757. [Google Scholar] [CrossRef]
  25. Karydas, C.; Gewehr, S.; Iatrou, M.; Iatrou, G.; Mourelatos, S. Olive Plantation Mapping on a Sub-Tree Scale with Object-Based Image Analysis of Multispectral UAV Data; Operational Potential in Tree Stress Monitoring. J. Imaging 2017, 3, 57. [Google Scholar] [CrossRef] [Green Version]
  26. Jurado, J.M.; Ortega, L.; Cubillas, J.J.; Feito, F.R. Multispectral Mapping on 3D Models and Multi-Temporal Monitoring for Individual Characterization of Olive Trees. Remote Sens. 2020, 12, 1106. [Google Scholar] [CrossRef] [Green Version]
  27. de Lima, R.S.; Lang, M.; Burnside, N.G.; Peciña, M.V.; Arumäe, T.; Laarmann, D.; Ward, R.D.; Vain, A.; Sepp, K. An Evaluation of the Effects of Uas Flight Parameters on Digital Aerial Photogrammetry Processing and Dense-Cloud Production Quality in a Scots Pine Forest. Remote Sens. 2021, 13, 1121. [Google Scholar] [CrossRef]
Figure 1. The location of the two different sites in Bilzen, Belgium and Moudania, Greece.
Drones 06 00197 g001
Figure 2. A graphical overview of the different flight parameters (flight altitude (m AGL) and image overlap) applied in the Bilzen site.
Drones 06 00197 g002
Figure 3. An overview of the procedure consisting of three steps: image collection, point cloud analyses, and individual tree detection.
Drones 06 00197 g003
Figure 4. The results of the ITD approaches with different smoothing window sizes using the imagery collected at a flight altitude of 40 m AGL and an image overlap of 80%.
Drones 06 00197 g004
Figure 5. The results of the ITD approach applied to olive trees. Due to the specific canopy shape of the olive trees, individual branches were falsely identified as individual trees.
Drones 06 00197 g005
Table 1. The varying flight parameters implemented at the Bilzen site in Belgium.
Mission IDFlight Altitude (m AGL)Image Overlap (%)Total Flight TimeTotal Number of Images (Size)
B125757 min 9 s155 (1.22 GB)
B225808 min 32 s200 (1.59 GB)
B3258510 min 55 s277 (2.21 GB)
B440756 min 56 s97 (767 MB)
B540807 min 20 s124 (994 MB)
B640859 min 11 s202 (1.59 GB)
Table 2. An overview of the results of the ITD approach in the taxus plantation, using different flight parameters and smoothing window size.
No Smoothing WindowSmoothing Window Size 3Smoothing Window Size 5
B1B2B3B4B5B6B1B2B3B4B5B6B1B2B3B4B5B6
TTC281285292280296283236233235231237236203211209195209209
TP231233235230234235234233233231235234201210208194208208
FN642732344623362729432929
FP505257506248202022211111
r0.970.980.990.970.990.990.990.980.980.970.990.990.850.890.880.820.880.88
p0.820.820.800.820.790.830.991.000.991.000.990.990.991.001.000.991.001.00
F0.890.890.890.890.880.900.990.990.990.990.990.990.910.940.930.900.930.93
TH (m, mean ± SD)3.37 ± 1.053.39 ± 1.013.37 ± 1.053.47 ± 1.033.40 ± 1.173.48 ± 1.103.42 ± 0.893.42 ± 0.863.43 ± 0.83.42 ± 0.903.43 ± 0.953.42 ± 0.923.01 ± 0.912.98 ± 0.903.04 ± 0.933.08 ± 0.933.03 ± 0.953.00 ± 0.91
CA (m2, mean ± SD)1.47 ± 0.901.46 ± 0.871.49 ± 0.921.52 ± 0.911.47 ± 0.911.50 ± 0.831.71 ± 0.951.76 ± 0.951.83 ± 1.011.82 ± 1.081.79 ± 1.011.73 ± 0.971.91 ± 1.221.87 ± 1.182.01 ± 1.252.07 ± 1.341.96 ± 1.241.89 ± 1.20
TTC: total tree count, TP: true positive, FN: false negative, FP: false positive, r: recall, p: precision, F: F-score, TH: tree height, CA: crown area.
Table 3. The results of the ITD application in the olive orchard using different smoothing window sizes.
No SmoothingSmoothing Window Size 3Smoothing Window Size 5
TTC389356297
TP147152130
FN11628
FP231198139
r0.930.960.82
p0.390.430.48
F0.550.600.61
TH (m, mean ± SD)2.55 ± 1.142.29 ± 0.982.12 ± 0.85
CA (m2, mean ± SD)6.83 ± 6.328.70 ± 5.9911.13 ± 6.57
TTC: total tree count, TP: true positive, FN: false negative, FP: false positive, r: recall, p: precision, F: F-score, TH: tree height, CA: crown area.
Publisher’s Note: MDPI stays neutral with regard to jurisdictional claims in published maps and institutional affiliations.

