Article

SDWBF Algorithm: A Novel Pedestrian Detection Algorithm in the Aerial Scene

1
College of Engineering, Huaqiao University, Quanzhou 362021, China
2
Fujian Provincial Academic Engineering Research Centre in Industrial Intellectual Techniques and Systems, Quanzhou 362021, China
3
Industrial Intelligent Technology and System Fujian University Engineering Research Center, Quanzhou 362021, China
*
Author to whom correspondence should be addressed.
Drones 2022, 6(3), 76; https://doi.org/10.3390/drones6030076
Submission received: 26 November 2021 / Revised: 3 March 2022 / Accepted: 7 March 2022 / Published: 14 March 2022

Abstract

:
Due to the large amount of video data from UAV aerial photography and the small target size from the aerial perspective, pedestrian detection in drone videos remains a challenge. To detect objects in UAV images quickly and accurately, a small-sized pedestrian detection algorithm based on the weighted fusion of static and dynamic bounding boxes is proposed. First, a weighted filtration algorithm for redundant frames was applied using the inter-frame pixel difference algorithm cascading vision and structural similarity, which solved the redundancy of the UAV video data, thereby reducing the delay. Second, the pre-training and detector learning datasets were scale matched to address the feature representation loss caused by the scale mismatch between datasets. Finally, the static bounding extracted by YOLOv4 and the motion bounding boxes extracted by LiteFlowNet were subject to the weighted fusion algorithm to enhance the semantic information and solve the problem of missing and multiple detections in UAV object detection. The experimental results showed that the small object recognition method proposed in this paper enabled reaching an mAP of 70.91% and an IoU of 57.53%, which were 3.51% and 2.05% higher than the mainstream target detection algorithm.

1. Introduction

In recent years, the development of smart cities has set off a wave of trends, including unmanned and intelligent systems. Smart cities foster sustainable urban development by harnessing networked and integrated sustainable urban technologies [1]. As an emerging technology, drones play a key role in smart city environments such as intelligent transportation [2], crowd management [3], and natural disasters [4]. Intelligent transportation uses vehicle detection and pedestrian detection technology to detect vehicle flow and pedestrian flow information in real time [5]. Using drones for detection can allow for a more comprehensive and continuous understanding of traffic nodes. UAVs can be used for crowd management by monitoring the crowd and realizing more intelligent police work. UAVs play a key role in smart cities for pedestrian detection and use detection technology integrated in people’s daily lives. Therefore, the combination of UAV and pedestrian detection is being explored and studied. The detection data can be collected by a digital camera installed on the drone [6]. However, unlike ordinary target detection, the videos taken by drones are generally ultra-high definition. The amount of stored and transmitted data is large. The aerial images of drones have the problems of small object sizes, low signal-to-noise ratios, and complex backgrounds. Therefore, quickly and accurately detecting small-sized pedestrian objects in UAV images is a challenging problem.
Object detection usually obtains the position and proportion of the object according to the probability of the bounding boxes and their categories to detect the object instances of known classes in video frames [7]. Object detection is mainly divided into traditional object detection algorithms and those based on deep learning object detection. Traditional object detection algorithms are only suitable for apparent features and simple backgrounds. However, in object detection, the UAVs’ scene usually has complex and changeable backgrounds, and it is difficult to detect the objects through general abstract features [8]. The deep-learning-based object detection algorithm uses a Convolutional Neural Network (CNN) to richly extract the same object features to complete the object detection. Although the object detection algorithm based on deep learning has made great progress, detecting small-sized pedestrian objects from the unique perspective of the UAV still poses significant challenges. These challenges mainly include the following aspects: (i) For human body detection, the UAV will distort the human body when it is photographed aerially, and the movement speed of the object is slow, coupled with the complex background, which can easily to lead to a false detection. (ii) There is a high degree of similarity between UAV video frames: pedestrians move slowly; the difference between frames is tiny; there is much redundancy between frames. Performing detection directly from the video will lead to a large amount of calculation. (iii) The scale mismatch between the dataset in the pre-training and the small object dataset will result in the loss of object feature representation, which will reduce the detector’s performance. (iv) The motion information of the moving object cannot be ignored. However, the input data of the object detector are static video frames, for which the motion information of the UAV video cannot be used fully. This will lead to the object in the video frame of the UAV containing a minimal amount of information. Therefore, it is difficult for the object detector to accurately identify all objects, resulting in missing and multiple detections.
Therefore, to solve the above problems, we propose a novel small-sized pedestrian detection algorithm based on the weighted fusion of static and dynamic bounding boxes (the SDWBF Algorithm). First, because of the significant difference between UAV video frames, the weighted redundant frame filtration algorithm is proposed to reduce the algorithm’s time delay and calculation amount for the redundant frames. Secondly, when designing the algorithm, based on the features of small-size pedestrians, we propose a method of weighted fusion static bounding boxes and dynamic bounding boxes to identify small-size pedestrians and improve the detection accuracy. Yu et al. [9] pointed out that due to the tiny object sizes and low signal-to-noise ratios, tiny objects will result in very poor feature representation. Scale matching can allow better studying and using micro-scale information, making it more complex for Convolutional Neural Networks to represent tiny targets. Inspired by this, we introduced scale matching before the weighted fusion of the static and dynamic bounding boxes to increase the feature representation ability of the detector.
The SDWBF Algorithm can improve the ability of small object detection, which is very important for pedestrian scene detection. Our contributions are as follows:
  • A weighted filtration algorithm for redundant frames is proposed to reduce redundant frames and calculations;
  • A weighted fusion algorithm for static and dynamic bounding boxes is proposed to improve the detection accuracy;
  • We introduced scale matching to reduce the loss of detector features and further improve the accuracy of the detector.
The experimental results and analysis showed that compared with the current mainstream methods [10,11,12,13], the SDWBF Algorithm improves the problem of missed and multiple detections in target detection, improves the accuracy, and reduces the time delay.

2. Related Work

In terms of object detection from the perspective of UAVs, the deep-learning-based object detection algorithm has been widely used, but at the same time, there are still some difficulties that need to be solved. First, the background of UAV images contains much noise information, weakening the detection of or obscuring the object, making it a challenge to continuously and wholly detect the object. Zhang R. et al. [14] used improved multi-scale dilated convolution to extract features, enlarged the receptive field of features, and improved the detection effect of occluded objects under complex backgrounds. Zhang et al. [15] proposed a coarse-to-fine object detection based on the deep motion saliency. This method uses the information from deep motion saliency in combination with the detector to improve the detection accuracy, and the recognition effect of small objects has been improved. Liu et al. [16] improved the YOLOv3 network structure, the performance of small objects detection was significantly improved by increasing the computation of the convolutional layer in the early stage to enrich the spatial information. Yu et al. [9] proposed a scale match method to keep the feature distribution of the network pre-training dataset and the detector dataset consistent and improve the quality of the small object detection model by improving the similarity of the data distribution.
Besides, there are plenty of redundant frames in drone videos. For the processing of redundant video frames, Chen et al. [17] proposed to convert all frames into a pixel-by-pixel comparison of the grayscale images to arrive at the difference between two adjacent frames and extract keyframes based on the degree of difference. However, due to the slow movement of UAV objects, the foreboding objects of the front and rear frames will have a large amount of reclosing, which will cause the extracted image to be hollow. Zhang et al. [15] proposed a scheme of selecting frames at equal intervals and then using similarity to select keyframes. The fixed interval may lead to excessive object loss and a low detection rate. Canel et al. [18] proposed a keyframe detection algorithm that automatically extracts keyframes based on the semantic differences between frames. However, such methods may produce too many redundant frames and increase computation.
Therefore, this paper proposes a small-size pedestrian detection algorithm—the SDWBF Algorithm. In terms of redundant frame filtering, redundant frames can be filtered by combining inter-frame pixel differences algorithm cascading vision and structural similarity to filter out many redundant frames. In terms of target detection, first, extract the static bounding box and the moving bounding box, and then weight fusion the static and dynamic bounding boxes to enhance the semantic information and improve the detection accuracy. In addition, this paper uses the scale matching method to improve the target feature representation ability to improve the performance of the detector. This paper evaluates the proposed method on the Stanford drone data (SDD) set of the public dataset. Its dataset is mainly based on pedestrian scenes. The proposed method can further improve the performance of the object detector to detect small-sized objects. Furthermore, it should point out that the main detection target of the paper is humans, primarily pedestrians and cyclists.

3. Proposed Method

The flow chart of the SDWBF Algorithm proposed in this paper is shown in Figure 1. (i) Redundant frame filtering: First, the UAV video is filtered through the pixel differences between frames; then, based on the initial filtering, weighted fusion with visual and structural similarity, it is filtered again to obtain the final dataset. (ii) Target detection: First, adjust the scale of the pre-training dataset to improve the performance of the detector. Then, use the target detector to extract static semantic features to obtain the target’s initial category and visual position. Finally, perform the final dataset deep optical flow estimation, transform the deep optical flow result into a dynamic bounding box, and perform weighted fusion with the static bounding box to improve the preliminary detection results.

3.1. Weighted Filtering Algorithm for Redundant Frames of Drone Video

Due to high frame rate photography, many video frames have high similarity and high redundancy in UAV videos. If the drone video is detected frame by frame, the calculation is enormous and time-consuming. Therefore, this paper first proposes a weighted filtration algorithm for redundant frames. The method primarily uses the inter-frame pixel difference algorithm to perform preliminary frame filtration. On this basis, filtration with the weighted fusion of the visual and structural similarity of the frames reduces the computational complexity of detection. The picture is essentially a two-dimensional signal, which is composed of multiple different frequency components [19]. The inter-frame pixel difference algorithm mainly takes advantage of the low-frequency components of the picture. It removes the high-frequency part of the picture to reduce the amount of image information by narrowing the picture and using the gray image method, which is suitable for pictures of extremely high similarity to be primarily selected. Image similarity measurement is to fuse visual similarity and structural similarity. Visual similarity is measured by image features (color, shape, texture, etc.) that conform to human vision. Structural similarity is a global way to compare image quality by statistical indicators (entropy, grayscale, etc.). However, the image background in the experimental dataset has high similarity, and the object’s moving speed is slow, resulting in a large amount of calculation to extract the image features. The method proposed in this paper does not require a large amount of calculation of image features but compares frames from a global perspective.
A weighted filtration algorithm for redundant frames proposed in this paper first extracts the frame of the UAV video through the inter-frame pixel difference algorithm. The method for judging the pixel difference value between frames is as follows:
D i , j ( k ) = H i ( k ) H j ( k )
i , j = k D i , j ( k )
Formula (1), H i ( k ) and H j ( k ) , respectively, represent the binary value of the kth hash value conversion of the ith frame and jth frame image, ⊕ represents the exclusive OR operation, D i , j represents the calculation result of the difference value of the ith and jth frame. In Formula (2), i , j represents the similarity measurement parameter between two frames. When the similarity measurement parameter is 5, when the similarity measurement parameter i , j is less than 5, we consider the two frames to be similar and filter this frame. When i , j is greater than 5, we consider it dissimilar.
Then, the frame is filtered again, combining with visual image similarity and structural similarity on the former basis. EMD [20] has better robustness than other methods of measuring visual similarity [15]. The main idea of EMD is to measure the distance between two distributions. The distance of the histogram calculated by EMD is used as the visual similarity of the image. Compared with other methods of measuring structural similarity, SSIM [21] is a complete evaluation index of reference image quality [15]. It combines brightness, contrast, and structure to measure image similarity. To accelerate the processing speed, the RGB image is converted into gray space, and SSIM is calculated in gray space [22]. This algorithm fuses visual and structural similarity using weight ratio and defines parameter w as the weight coefficient. The PDCSF (Pixel difference cascade similarity fusion) algorithm is as follows.
A E M D P , Q = 1 E M D P , Q μ σ
P D C S F P , Q = w A E M D P , Q + 1 w S S I M P , Q
D ( P , Q ) = 0 P D C S F a v g ( P D C S F ) 1 P D C S F < a v g ( P D C S F )
A E M D ( P , Q ) means normalizing the mean value of EMD distance, μ means the mean value of EMD distance between all original frames, and σ means the standard deviation of EMD distance between all original frames. When the EMD distance value is larger, the image is less similar. To facilitate the later calculation, the smaller the A E M D ( P , Q ) value is, the more dissimilar it will be, which is the same as the SSIM value. The Formula (5) indicates whether to filter this frame. When the value is 1, the frame is filtered, and similar frames are filtered.

3.2. Small-Sized Pedestrians Detection Method Based on the Weighted Fusion of Static and Dynamic Bounding Boxes

The ideal detector must achieve high accuracy in positioning and recognition and high efficiency in terms of time. In recent years, many effective object detection methods have been proposed, such as SSD [11] and Fast R-CNN [23]. This paper selects the recently proposed CNN architecture YOLOv4 [13] as the object detector for extracting static features. Compared with other networks, this network achieves an optimal balance between speed and accuracy. Because the distance between the target and the camera from the UAV’s perspective is too far, resulting in smaller target size, tiny objects pose a big challenge for feature representation. In addition, the datasets used for network pre-training and the dataset learned by the detector may degrade the feature representation and the detector [9], increasing the risk of false detection in large-scale and complex backgrounds. Therefore, YOLOv4 will cause missed detections or multiple detections of small objects.
To further improve the accuracy of moving object detection, this paper proposes a small-size pedestrian detection method based on the weighted fusion of static and dynamic bounding boxes. First, the pre-training and detector learning datasets are scale-matched to improve the detector’s feature representation and performance. Secondly, on this basis, the difference in consecutive frames is used to correspond to the motion information of the moving object, and the static and motion boxes are weighted fusion to improve detection capabilities. Currently, the most usual method of extracting the motion information is optical flow [24], and deep learning methods have achieved great success in solving the problem of optical flow estimation, such as Flownet [25], PWC-net [26], etc. The recently proposed LiteFlowNet3 [24] is more accurate than other optical flow estimation networks. Therefore, this paper uses LiteFlowNet3 to generate optical flow images, extract motion boxes through threshold segmentation, and finally, the weighted fusion of the moving boxes with the static boxes extracted by the previous object detector. This paper uses the concept of Intersection-over-Union (IoU) [27] to achieve static and motion boxes weight fusion by calculating the static boxes generated by YOLOv4 and the IoU based on the motion boxes generated by LiteFlowNet3. IoU is the ratio of the intersection area of two bounding boxes to their union. A and B are the areas of two different bounding boxes. The calculation formula is as follows:
I o U ( A , B ) = A B A B

3.2.1. Scale Matching to Reduce the Loss of Detector Features

In this paper, the scale matching between the pre-training and detector learning datasets is put forward to improve the feature representation. The static boxes of the object detector and the dynamic boxes are based on optical flow estimation is weighted fusion, which makes full use of the motion information of objects to reduce the miss rate and achieve more accurate small-size pedestrian detection. In this paper, the static boxes collection generated by YOLOv4 is defined as Y i , and the motion boxes collection generated based on LiteFlowNet3 is defined as L i . The method of object detection based on static and motion boxes weighted fusion mainly includes the following steps.
The pre-training dataset and the detector learning dataset are scale-matched to improve the feature representation and improve the performance of the detector. The scale matching essentially makes the target scale histogram distribution of the pre-training dataset and the detector learning dataset similar. First, we calculate the average size s 1 of the label box in any picture in the pre-training dataset, select a bin in the scale histogram of the detector learning dataset. Secondly, we determine the used bin on the size s 2 of the scale-matched label, the scale migration ratio s 2 / s 1 is obtained. Finally, scale matching is performed on the pictures in the pre-training dataset according to the scale migration ratio. The calculation formula for scale matching is shown in Equation (7). Among them, s 0 [ m i n ( s 1 ) , m a x ( s 1 ) ] , m i n ( s 1 ) and m a x ( s 1 ) represent the minimum and maximum size of the object, respectively. p s i z e represents the general density function, the probability density function of the scale s of any dataset X is expressed as P s i z e ( s ; X ) . Then E represents the pre-training dataset, and D t r a i n represents the target training set. The abscissa of the probability density function is the size of the dataset label frame, and the ordinate is the probability density. The scale matching function f maps the label box size s 1 in the pre-training set E to s 2 .
m i n s 1 s 0 P s i z e s 1 ; E d s 1 = f m i n s 1 f s 0 p s i z e s 2 ; D t r a i n d s 2
After the pre-training dataset and the detector learning dataset are scale-matched, and the performance of the object detector is improved, the extracted keyframes are input into it to extract the deep semantic features, then the static bounding boxes set Y i is obtained.

3.2.2. A Weighted Fusion Algorithm for Static and Dynamic Bounding Boxes

The optical flow image is obtained by LiteFlowNet3. The binary motion map is obtained by threshold segmentation of the optical image, analyzing the connected components of the binary motion image, and finally obtaining the motion feature set L i . The overall flow chart is shown in Figure 2.
(1)
To obtain an RGB optical flow image, we convert the optical flow vector generated by LiteFlowNet3. Different colors in the RGB image represent different directions of motion, and the color depth indicates the speed of motion.
(2)
We perform threshold segmentation on the optical flow image to obtain a binary motion image. Threshold segmentation is divided into global and local threshold methods [28]. The global threshold method uses global information to find the optimal segmentation threshold for the entire image. However, for small-size pedestrian images, it is difficult to separate the object and background using the threshold of the whole image because of the small area that the objects occupied in the image. Therefore, this paper uses the local threshold method to obtain the binary motion image by segmenting the RGB optical flow image. Its idea is to self-adaptively calculate different thresholds according to the brightness distribution of different areas of the image. For image P, calculate the value G x , y of each pixel x , y in the image through Gaussian filtering, the Gaussian filter function can denoize the optical flow image to a certain extent, and set σ as a constant, the Gaussian filter function [29] is Equation (8).
G x , y = 1 2 π σ 2 e x 2 + y 2 2 σ 2
Forward binarization point by B x , y value.
D s t x , y = 0 i f P ( x , y ) < G ( x , y ) 1 i f P ( x , y ) G ( x , y )
where P x , y is the pixel value of x , y in the RGB optical flow image, and D s t x , y is the binary image of the image P.
(3)
Analyzing the connected components of D s t x , y [30], the motion feature bounding box collectionset L i . Connected component analysis is to find a continuous subset of pixels in D s t x , y and mark them. These marked subsets constitute the motion feature box collection set L i of the object.
The static bounding boxes collection set Y i generated by YOLOv4 is merged with the motion boxes collection set L i generated based on LiteFlowNet3 to compare the size of the IoU of the static and motion boxes at a certain distance. Among them, the static and dynamic bounding boxes are mainly weighted and fused by Formula (10), where box corresponds to the bounding box coordinates, and σ L i , Y j 2 represents the variance.
W e i g h t L i , Y j = b o x L i , Y j / σ L i , Y j 2 1 / σ L i , Y j 2
In addition, we carry out statistical analysis on the speed of the object movement between video frames. The size of pedestrians is 50px × 50px (px is pixel), and the size of cyclists is 70px × 70px. Because there are far more pedestrians than cyclists in the data, this paper takes the size of pedestrians as the standard. Then, the moving speed between the video frames, namely pixel offset between frames of pedestrians and cyclists, is 1px and 3px, respectively. Moreover, the moving bounding box usually exceeds the static bounding box. This paper retains an error range of about five frames. Therefore, this paper sets the distance r to 55px ± 10px according to the object pixel size and its inter-frame pixel offset, ( γ 1 , γ 2 ) is the value range of IOU, when γ 1 = 0.2 , γ 2 = 0.5 , the recognition effect is best and the pseudocode of the fusion algorithm is shown in Algorithm 1.
Algorithm 1: A weighted fusion algorithm for static and dynamic bounding boxes.
  • Input: Static feature box collection Y i , Motion feature box collection L i
1:
for i = 0 To l e n g t h L i  do
2:
for  j = 0 To l e n g t h Y j  do
3:
   / / d i s t a n c e ( ) is the calculation distance function
4:
  if  d i s t a n c e L i , Y j < r  then
5:
     if  I o U L i , Y j ( γ 1 , γ 2 )  then
6:
       // W e i g h t ( ) is weighted fusion area function.
7:
       R e s u l t B o x i W e i g h t L i , Y j
8:
     end if
9:
     if  I o U L i , Y j < γ 1  then
10:
       R e s u l t B o x i L i , R e s u l t i i
11:
     end if
12:
     if  I o U L i , Y j > γ 2  then
13:
       R e s u l t B o x i Y j
14:
     else
15:
       R e s u l t i i
16:
       R e s u l t B o x i L i
17:
     end if
18:
  end if
19:
end for
20:
end for
  • Output: The final set of test results: R e s u l t i , the final test result boxes: R e s u l t B o x i

4. Experimental Section

In this section, a series of experiments will be performed to verify the performance of the proposed method and compare it with the current mainstream methods. The experiment platform is a PC with a @2.0 GHz CPU and 16 G memory. The experiment is mainly implemented on MATLAB2016a and Python 3.7 based on PyTorch and is accelerated by NVIDIA GeForce TITAN XP with 12 GB memory.

4.1. Performance Evaluation Standard

The publicly available Stanford Drone Dataset (SDD) contains experimental data collected on a university campus with examples of pedestrians and cyclists. So the main detection object in this paper is humans. SDD is very challenging. The size of all object instances is no larger than 0.2% of the image size, and most instances account for 0.1% to 0.15%. The video is randomly selected, and its frames are extracted as the dataset of this project. The training and verification sets contain 120,201 frames, and the test set contains 51,514 frames. To evaluate the performance of the proposed method, the following evaluation indicators will be used for evaluation.
Harmonic mean (F) is the harmonic mean [31] of recall (R) and precision (P), which is used to comprehensively measure the effectiveness of the redundant frame filter result set. The recall rate is used to measure the missed detection of as shown in Formula (11), and the precision rate reflects the accuracy of the extraction results as shown in Formula (12). Among them, N c , N m , and N t represent the number of result frames, the number of missing frames, and the number of redundant frames correctly extracted in the result set.
R = N c N c + N m × 100 %
P = N c N c + N t × 100 %
F = 2 × R × P R + P
Compression Rate (CR) is used to measure the compactness of video clips and is related to frame extraction. N F i represents the number of result frames, and N K F j is the number of original video frames.
C R = N F i N K F j × 100 %
Frame Per Second (FPS) measures the speed of object detection, representing the number of video frames that the detector can process per second. The experiment tests the FPS of different object detectors on a single GPU.
Intersection over Union (IoU) represents the overlap between the generated candidate bound and the ground truth bound [32]. The ideal situation is complete overlap. That is, the ratio is 1. between the generated candidate bound and the ground truth bound [32]. The ideal situation is complete overlap. That is, the ratio is 1.
The mAP is the standard for the detection accuracy of the object detector. It is related to the value of IoU. In the experiment, the value of IoU is set to 0.5, and mAP is the area under the curve of precision and recall. Among them, TP represents the number of detection boxes with I o U > 0.5 , FP represents the number of detection boxes with I o U 0.5 , and FN represents the number of undetected. The definition of precision and recall are:
P r e c i s i o n = T P T P + F P
R e c a l l = T P T P + F N

4.2. Experimental Results and Analysis

4.2.1. Select the Best Weight Coefficient

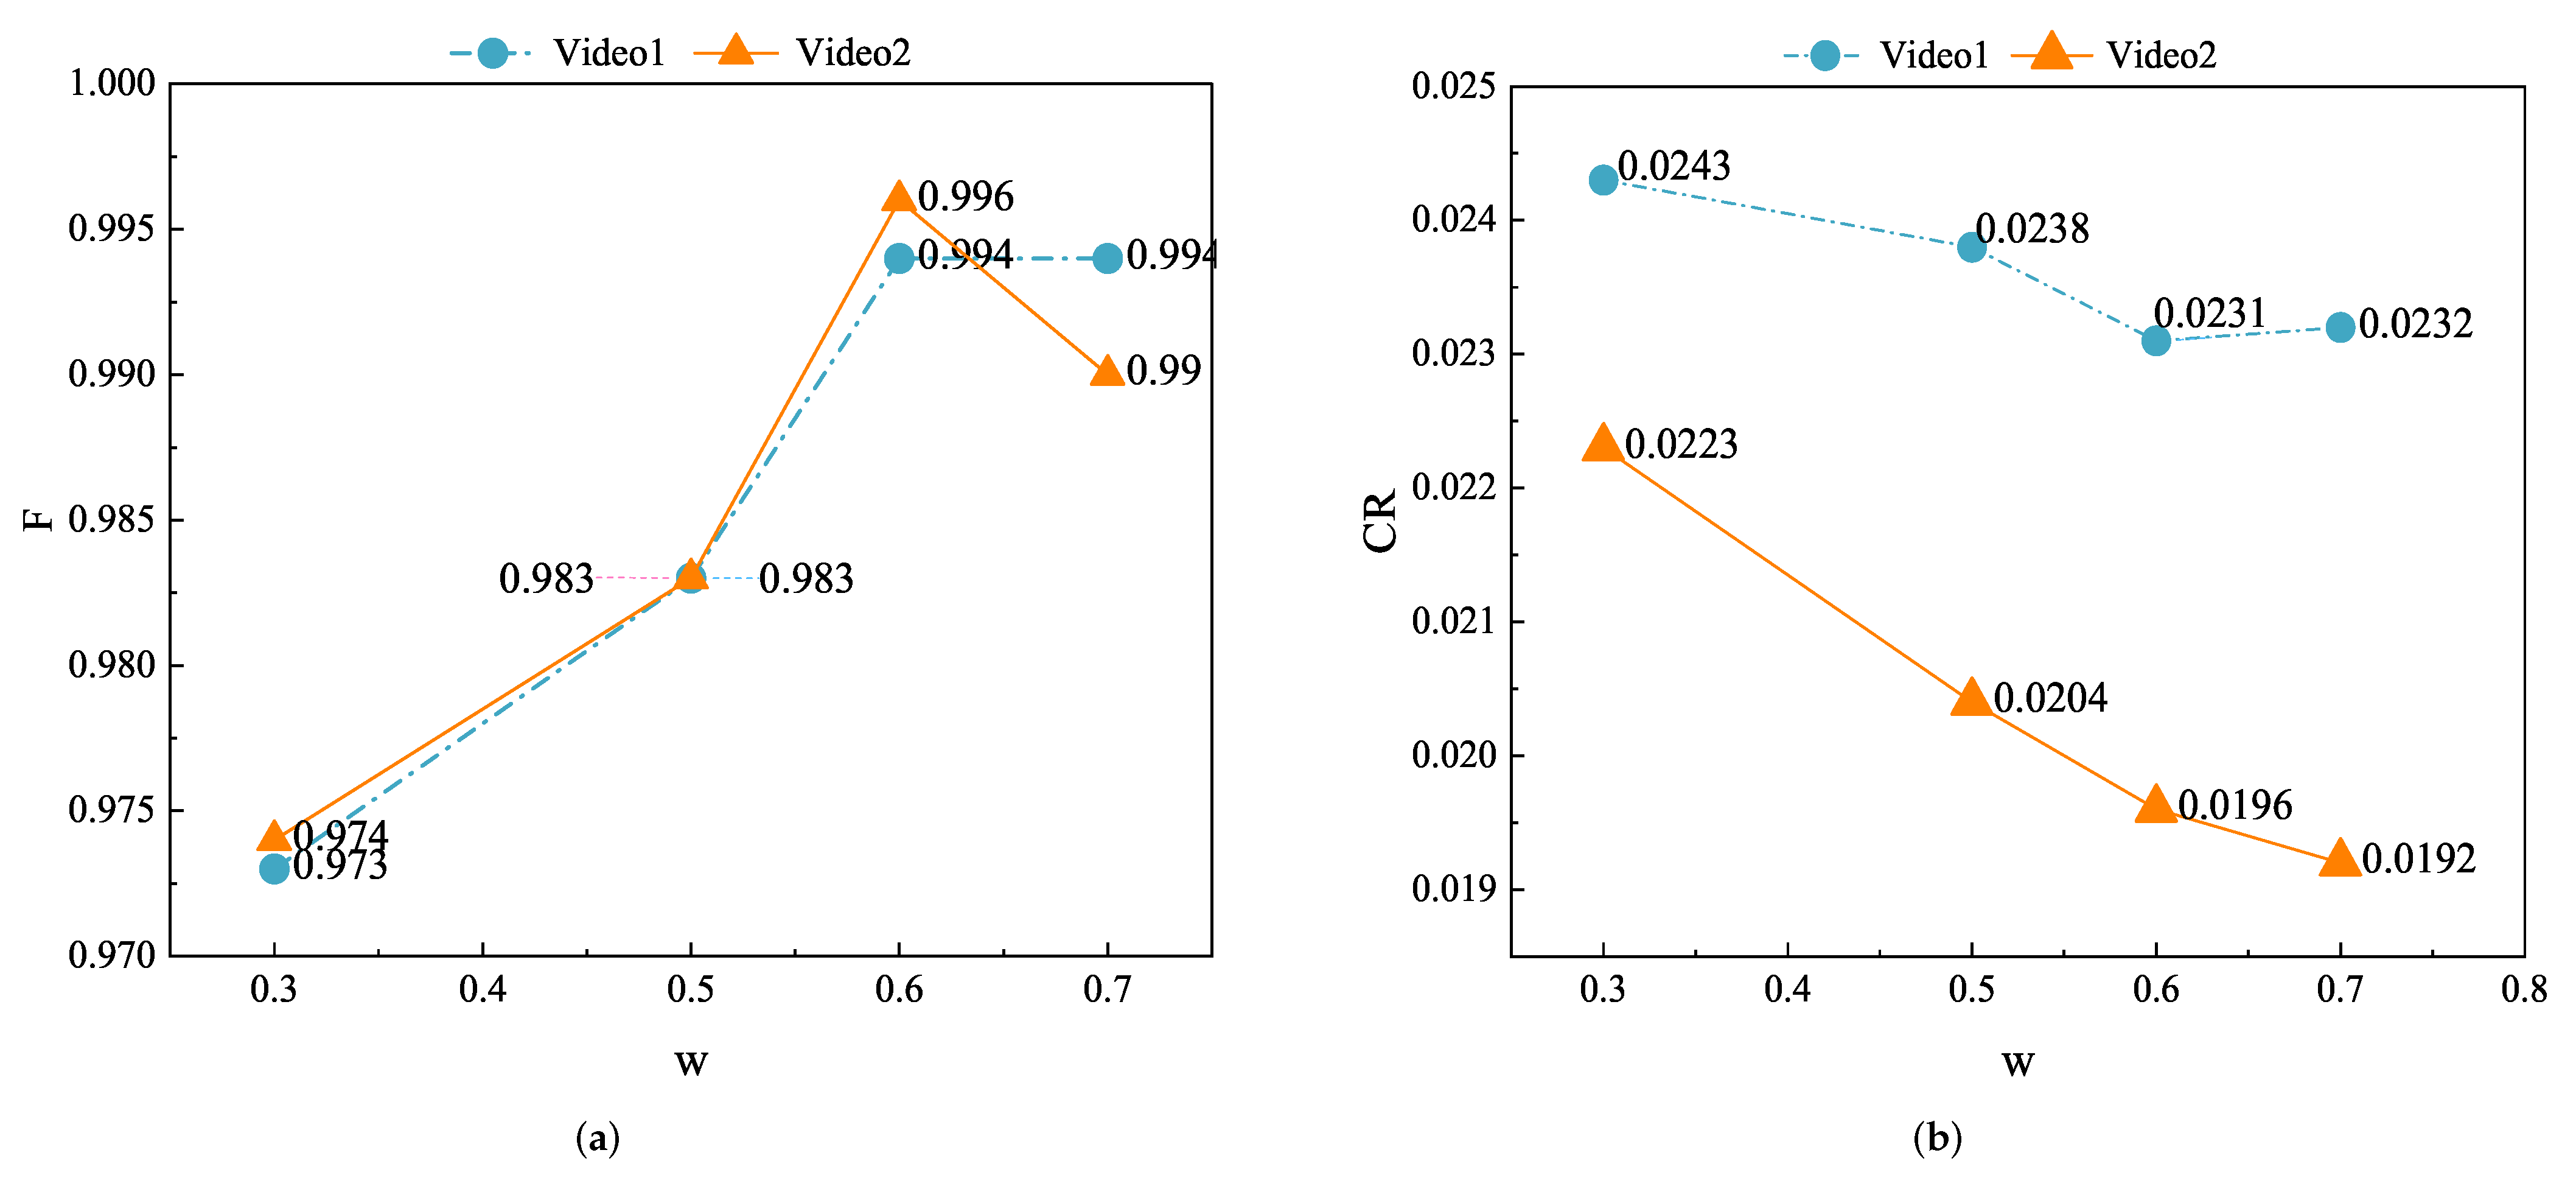
To select the best weight coefficient in the proposed redundant frame filter method, different weight coefficients are set in this experiment. The harmonic mean F and compression ratio CR of different weight coefficients are compared to select the best weight coefficient. In theory, the higher the harmonic mean F, the lower the CR value, and the better the redundant frame filter. This paper selects two videos for a redundant frame filter. From Table 1 and combining Figure 3, it can be seen that when w is 0.6, the number of redundant frames is lower than when the weight coefficient w is 0.5. The number of missing frames is less than when the weight coefficient w is 0.7. It should be low, which means that when w is 0.6, the effect reaches balance. The value of harmonic mean and compression ratio is the best, and the extracted result frames contain the least redundant frames and no missing frames.

4.2.2. Reduce Redundant Frames

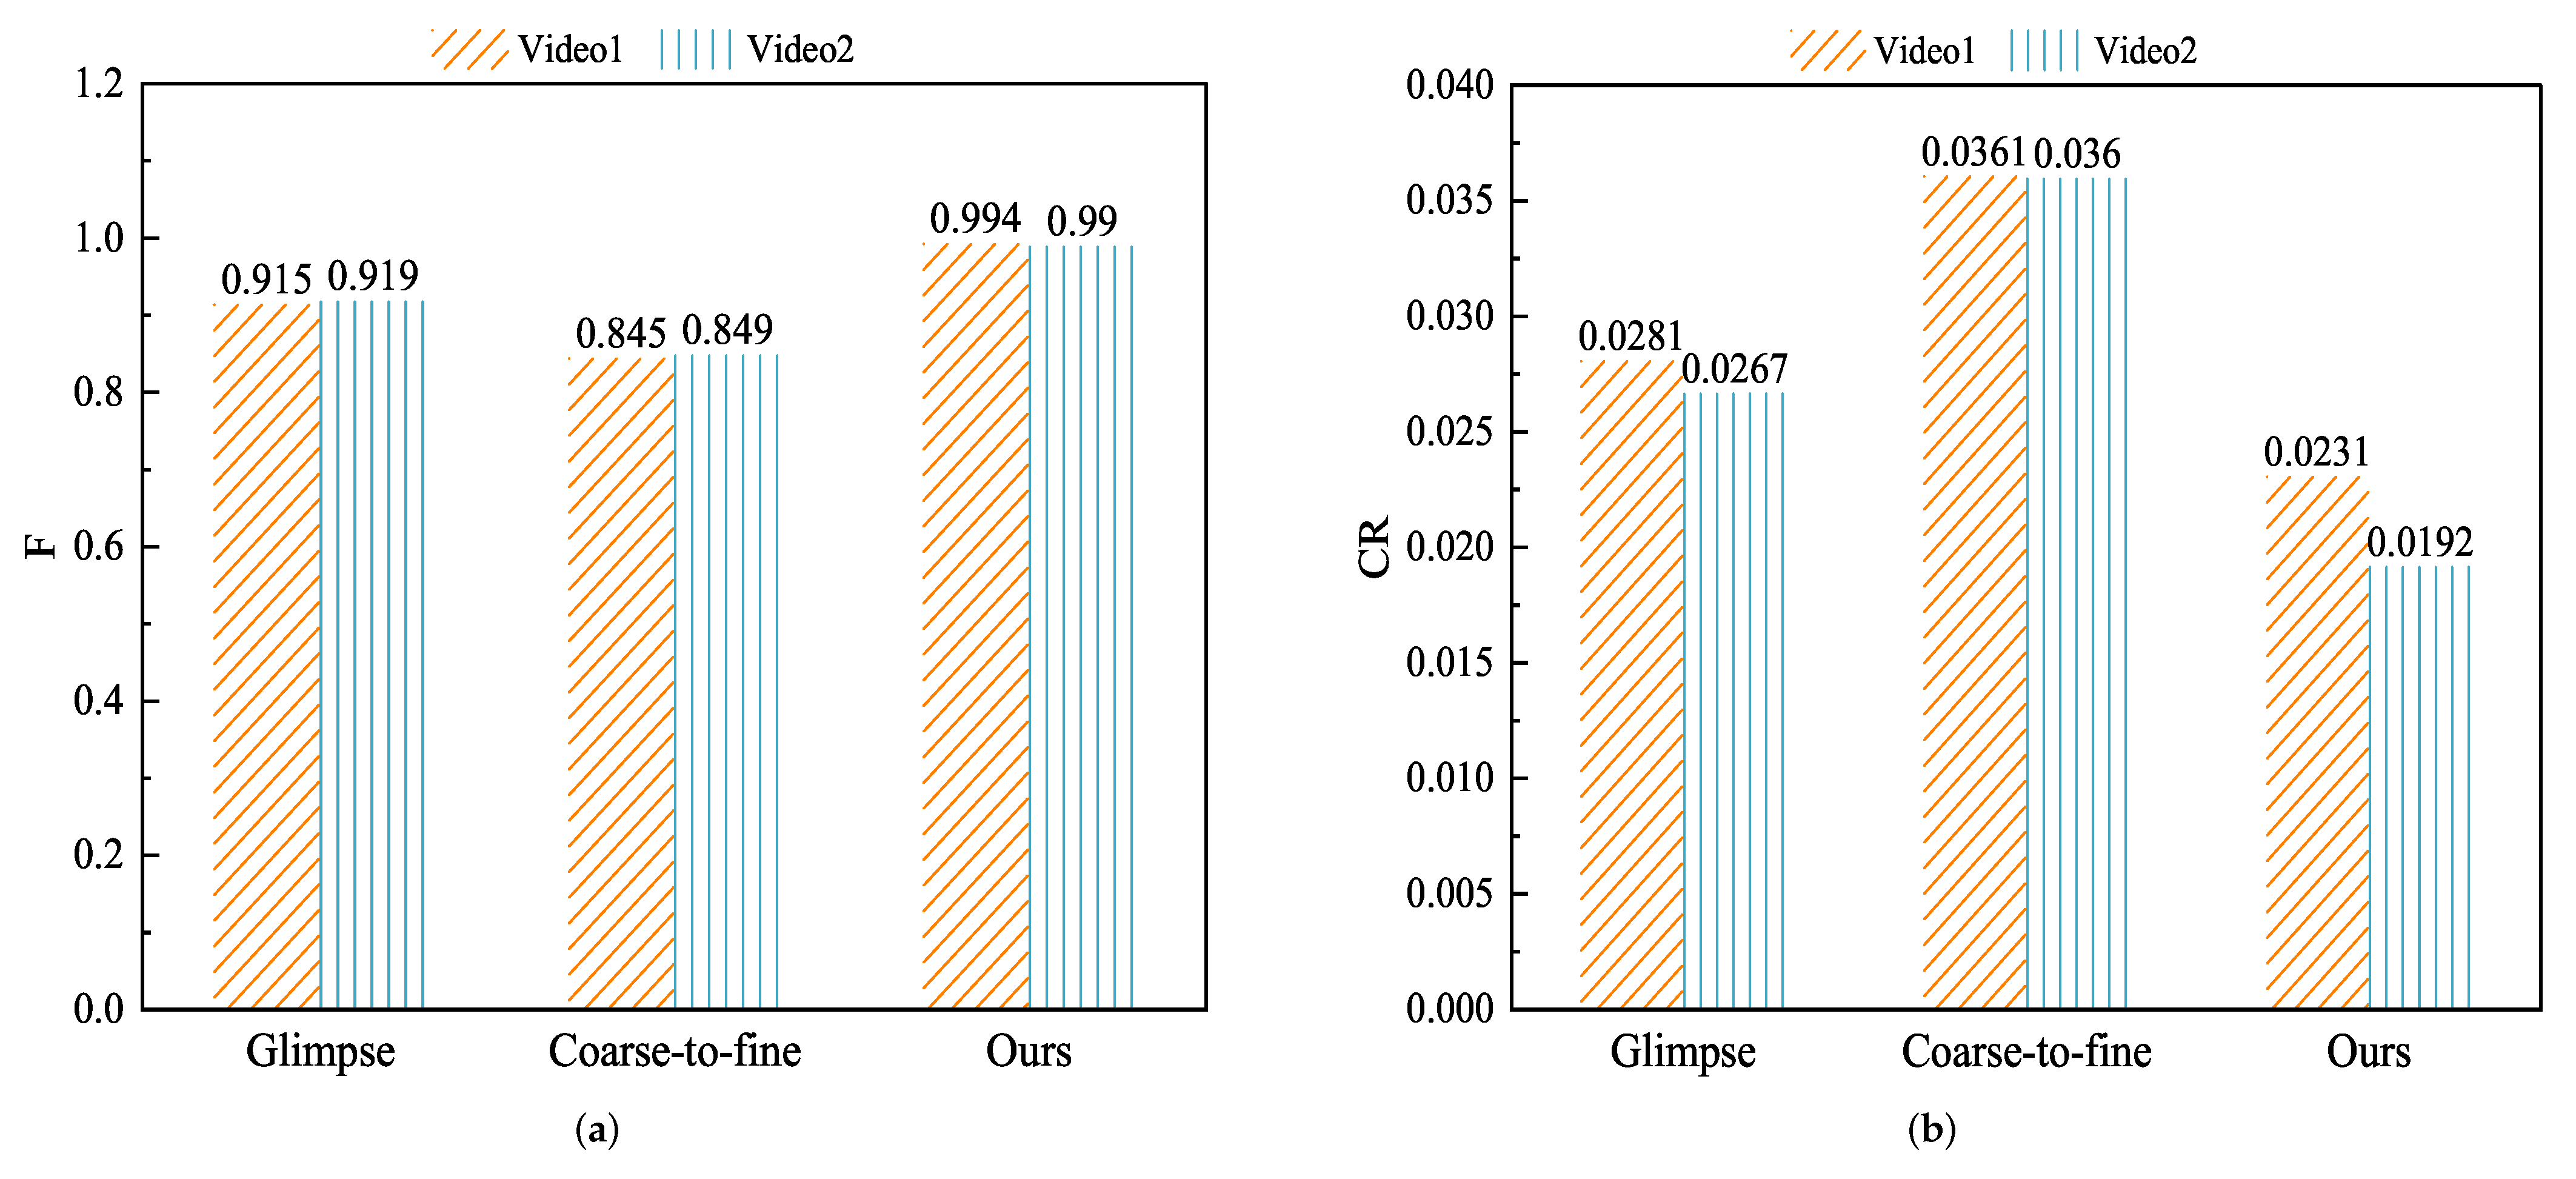
To verify the effect of the proposed redundant frame filter method, this paper conducts a comparative experiment with the resulting frame extraction method in [15,17]. It can be seen from Table 2 that the algorithm in [17] takes the least time. The reason for this is that this method is only filtered by the frame difference method once, which can greatly reduce the running time. However, although this method is simple and fast, the result frame selection often exists deviation. Compared with the algorithm in [15], the algorithm in this paper is used to extract the video frame of the drone video through the pixel difference between frames. In contrast, ref. [15] performs the preliminary extraction at equal intervals, which can greatly reduce the data required to be processed. Therefore, the execution time of the algorithm in this paper is slightly higher than that in [15]. However, it can be seen from Figure 4 that in the same video, the algorithm in this paper has the highest harmonic mean. The lowest compression rate, compared with the results obtained in [15,17], indicates that the result frames extracted retain both the visual and structural content of the original data and reduce useless frames. Therefore, the algorithm proposed in this paper has better all-around performance, and the result frames are more accurate in the expression of the original video.

4.2.3. Ablation Experiment

To verify the effectiveness of the proposed method, we set up an ablation experiment to verify the accuracy and time-consuming of each module. First, we conducted the redundant frame filter experiment based on Baseline. It can be seen from Table 3 that when redundant frame filtering is not performed, it takes 268 s, and when redundant frame filtering is performed, it takes 29.12 s. The accuracy is maintained without change, and the time-consuming rate is reduced by 89.13%. The result shows the effectiveness of the weighted filtration algorithm for redundant frames. Secondly, weighted fusion for static and dynamic bounding boxes is performed based on redundant frame filtering. The accuracy is increased by 1.89% and 0.73%, respectively, showing the effectiveness of weighted fusion and scale matching of static and motion features. Finally, we performed scale matching. The accuracy is increased by 3.51%, which shows that the combined effect of the two methods is better than the independent effect of the two. Therefore, the overall results show the effectiveness and rationality of our method.

4.2.4. Test Result Comparison Experiment

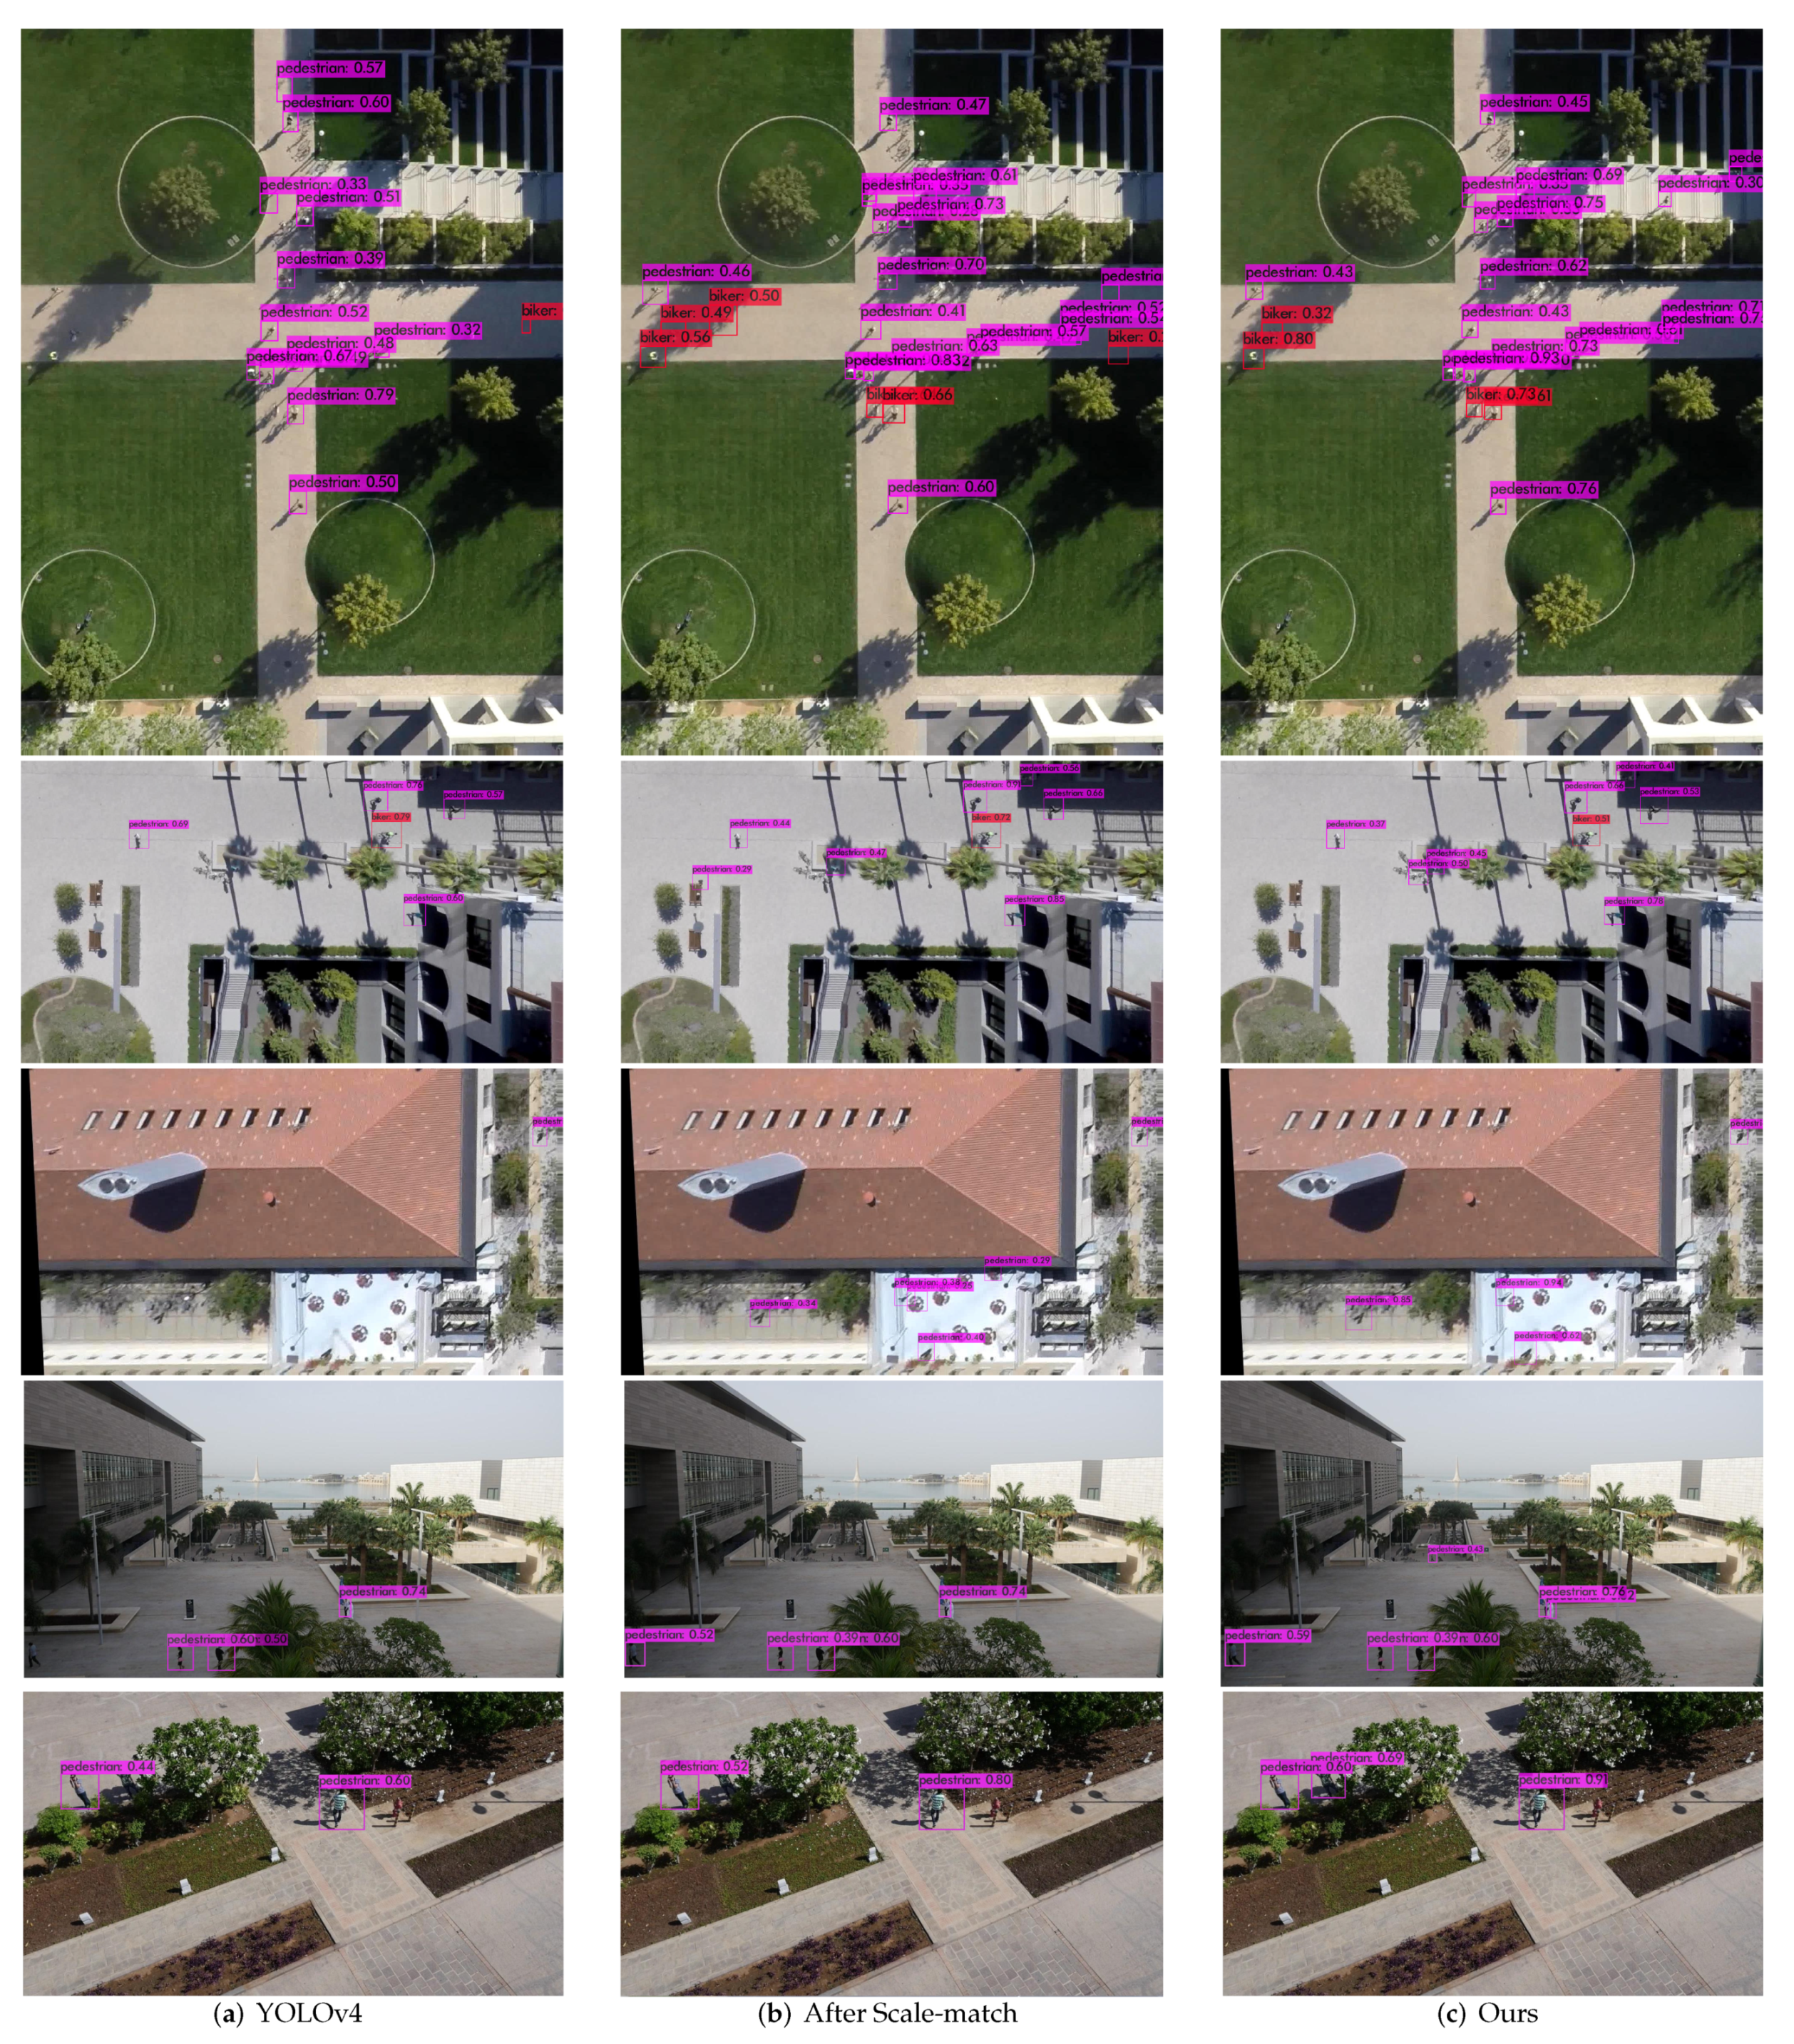
To intuitively prove the effectiveness of the proposed method, introduce a new dataset UAV123 to verify the generalization ability of the algorithm. This experiment compares the detection results after scale matching and the final static and motion boxes weighted fusion. As shown in Figure 5, the proposed object detection method of static and motion boxes weighted fusion can eliminate false-positive object instances and increase false negative object instances, which improves the performance of the object detector. For example, before the scale-match, there are many instances of missing detection in the first example. After the scale-match, the missing detection rate decreases, but no false-positive instances of cyclists are detected in the red bounding box on the right side of the video frame. After the static and motion boxes are fused, the missing detection rate is reduced based on scale matching, and false-positive instances are eliminated. Because this instance does not exist in the frame, there is no motion bounding box in the corresponding position in the motion feature, so after the static and motion boxes fusion, this bounding box will be deleted. In the third example, the detection ability of YOLOv4 is significantly reduced when there are obstructions. After the scale-match, the detection ability improves, but two false-positive instances appear. The false-positive instances are eliminated after the static and motion boxes are fused. The latter two examples are the UAV123 data set. It can be seen from the figure that the algorithm works well under different data sets and has strong generalization ability. The results show that the fusion of static and motion features will improve detection accuracy.

4.2.5. Compare Experiments with Advanced Detectors

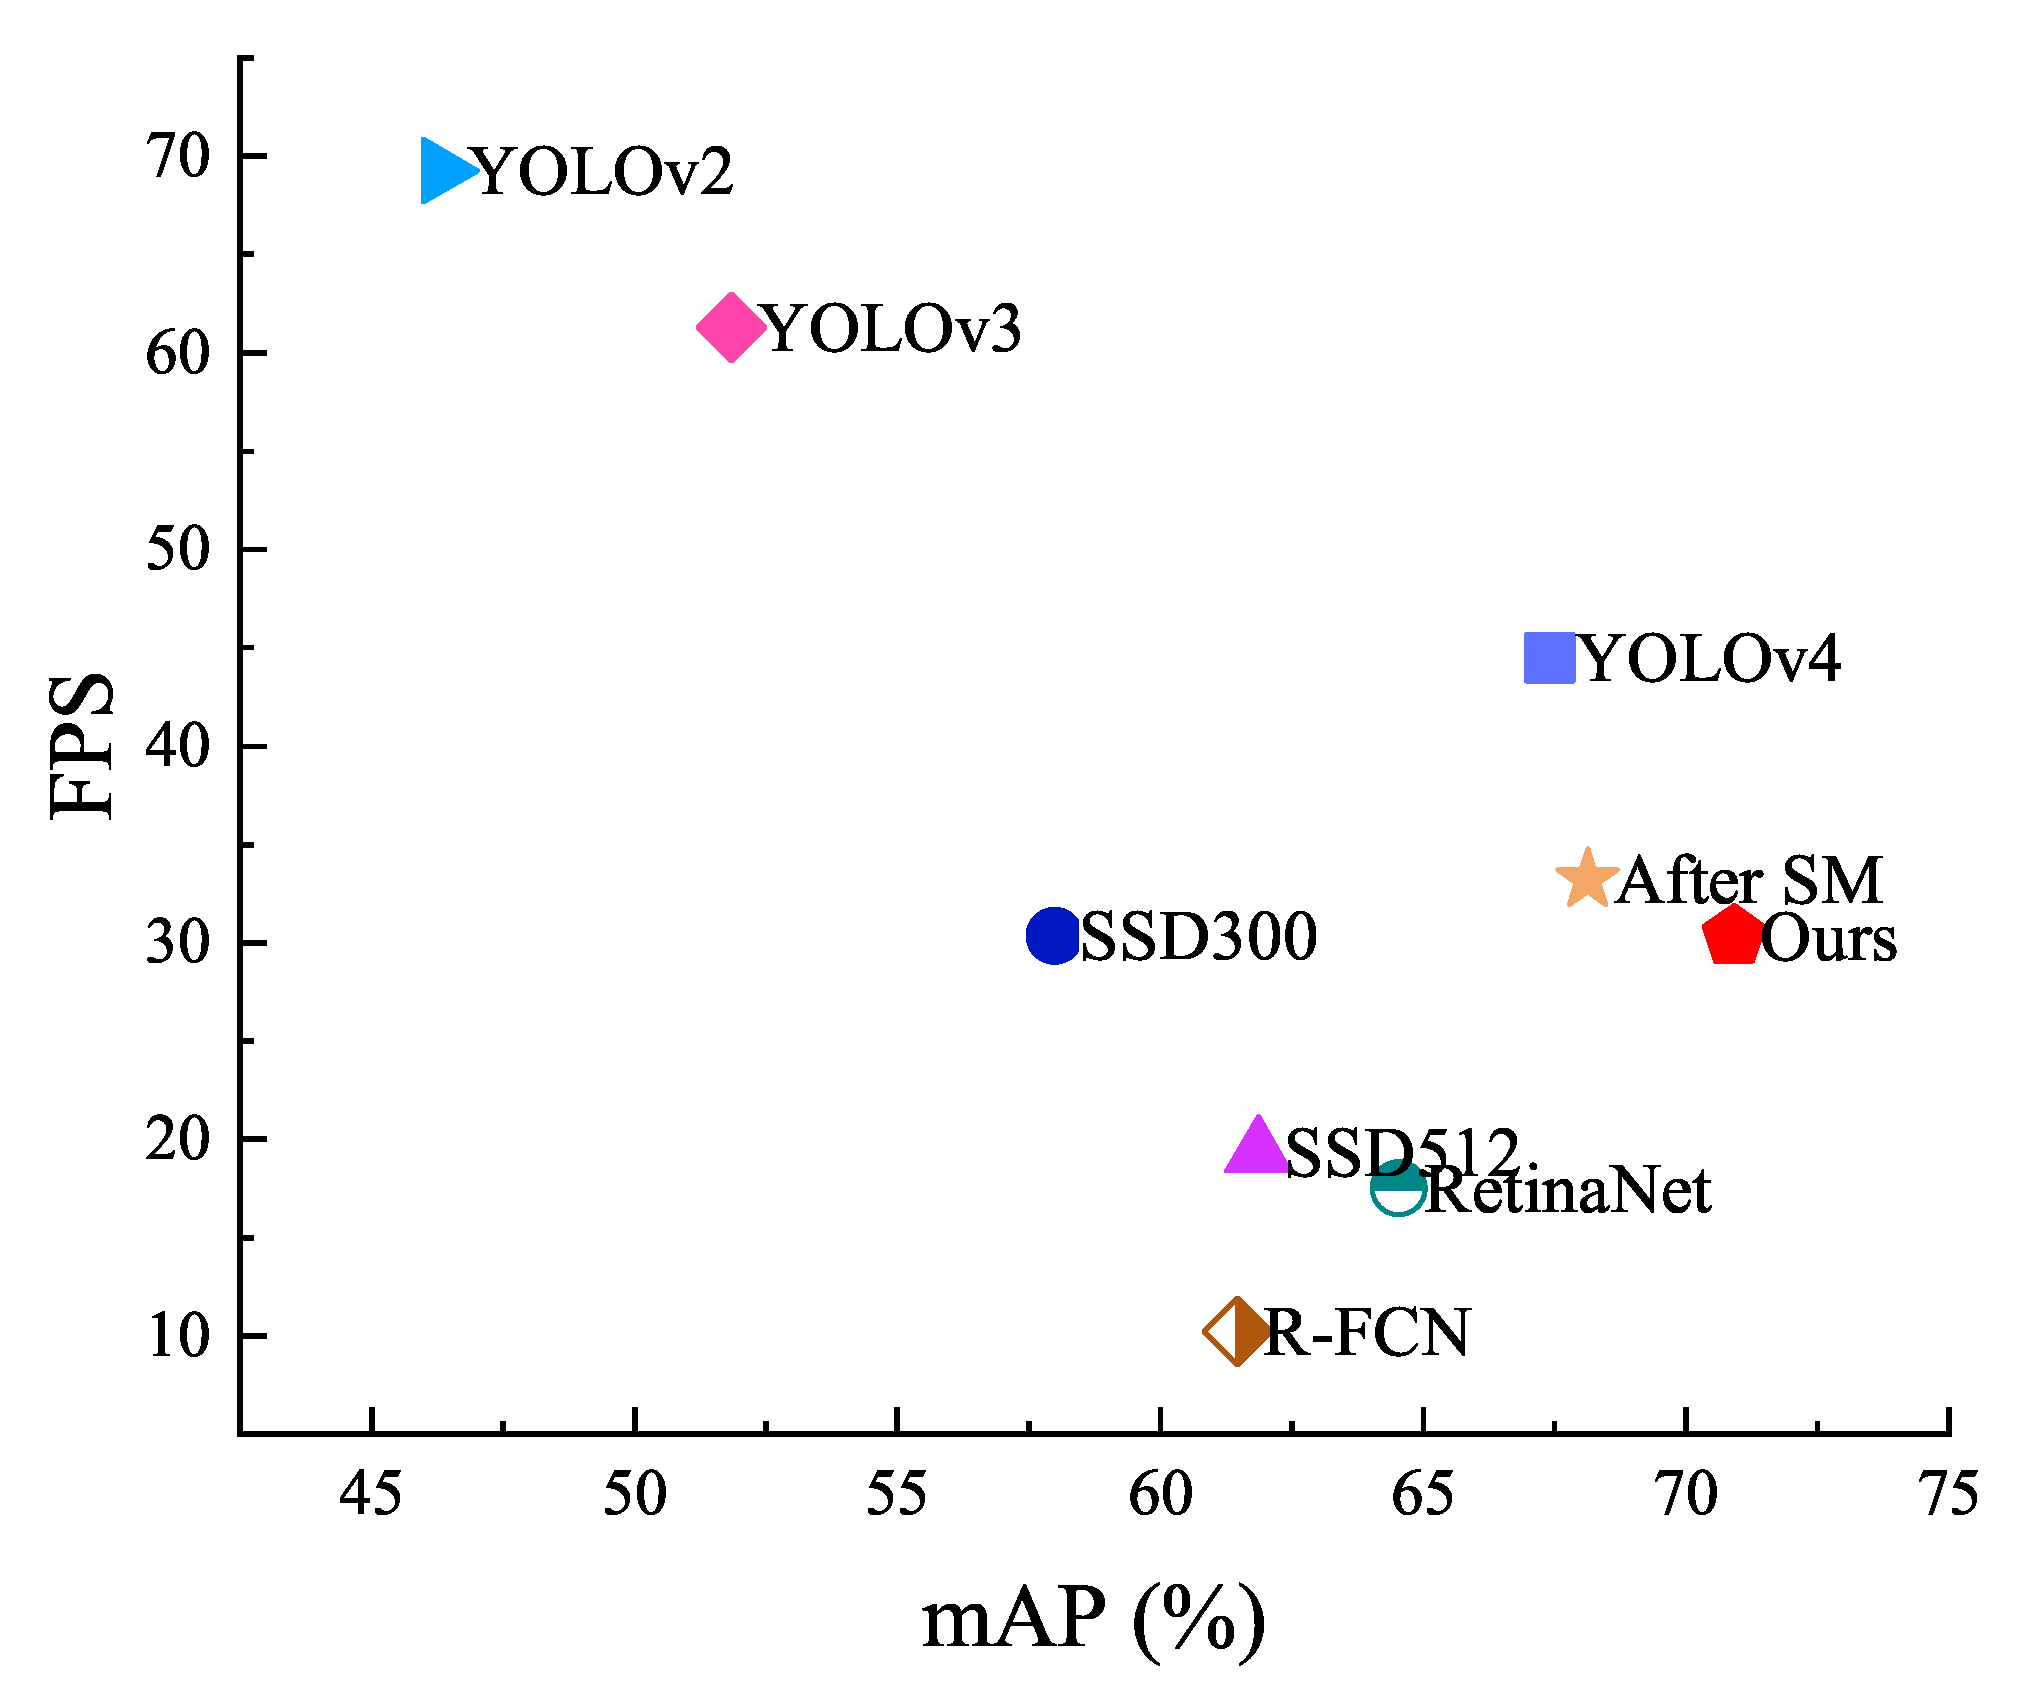
To verify the performance of the proposed object detection method, this paper compares the detection accuracy and speed with mainstream detectors. All object detectors use the COCO dataset as the pre-training dataset and are trained based on the SDD. As shown in Figure 6, compared with the original YOLOv4, when only scale-match is used, mAP is increased by 0.63%, IoU is increased by 0.60%. Furthermore, after static and motion boxes weighted fusion, the proposed method mAP is increased by 3.51%, IoU increased by 2.05% overall, achieving the highest mAP and IoU, reaching 70.91% and 57.53% respectively. Due to the weighted fusion of motion and static boxes during the detection process, the detection speed drops slightly, and the FPS is 30.3. As shown in Table 4, the detailed detection results of different object detectors in the SDD are shown. The SSD detector uses a deeper network model, so the accuracy is high, but the calculation complexity increases, resulting in poor real-time performance. Although YOLOv3 achieves the best real-time performance, it has a poor detection effect on small objects, low performance, and cannot achieve a balance between accuracy and delay. In general, the method proposed in this paper improves the detection accuracy while ensuring real-time performance in small object detection.

5. Conclusions

This paper proposes a target detection algorithm in the aviation scene, a small-size pedestrian detection algorithm based on the weighted fusion of static and dynamic bounding boxes—the SDWBF Algorithm. It is composed of redundant frame weighted filtration algorithm, scale matching algorithm, static and dynamic bounding box weighted fusion algorithm. The SDWBF Algorithm mainly solves the problem of missed inspection and multiple inspections of the UAV pedestrian detection model structure in the high-altitude scene. Secondly, it solves the redundancy problem of UAV pedestrian video data. The SDWBF Algorithm improves the pedestrian detection accuracy of the model through static and dynamic bounding box weighted fusion algorithm and scale matching algorithm and uses redundant frame weighted filtration algorithm to filter out redundant frames to reduce computing amount. We tested the SDWBF Algorithm in a real hardware environment. Compared with other detection algorithms, the performance of the SDWBF Algorithm is outstanding, and the accuracy results were good. In future work, we will conduct more in-depth research to optimize the network structure and implement it in embedded devices.

Author Contributions

Conceptualization, X.M., Y.Z. and W.Z.; Formal analysis, X.M., H.Z. and H.Y.; Methodology, X.M. and W.Z.; Project administration, W.Z.; Software, X.M.; Supervision, Y.Z., H.Z. and H.Y.; Writing—original draft, X.M.; Writing—review & editing, X.M. All authors have read and agreed to the published version of the manuscript.

Funding

This research was funded by the Natural Science Foundation of China (Grant No. 61976098), the Key Science and Technology Project of Xiamen City (Grant No. 3502Z20201008) and Technology Development Foundation of Quanzhou City (Grant No. 2020C067).

Institutional Review Board Statement

Not applicable.

Informed Consent Statement

Not applicable.

Data Availability Statement

This study analyzes publicly available datasets. This datasets can be found here: https://cvgl.stanford.edu/projects/uav_data/ (accessed on 10 March 2022).

Conflicts of Interest

The authors declare no conflict of interest.

Abbreviations

The following abbreviations are used in this manuscript:
UAVUnmanned Aerial Vehicle
CNNConvolutional Neural Network
SDDStanford Drone Dataset
EMDEarth Movers Distance
SSIMStructural Similarity

References

  1. Hudson, L.; Sedlackova, A.N. Urban Sensing Technologies and Geospatial Big Data Analytics in Internet of Things-enabled Smart Cities. Geopolit. Hist. Int. Relations 2021, 13, 37–50. [Google Scholar]
  2. Kamate, S.; Yilmazer, N. Application of Object Detection and Tracking Techniques for Unmanned Aerial Vehicles. Procedia Comput. Sci. 2015, 61, 436–441. [Google Scholar] [CrossRef] [Green Version]
  3. Al-Sheary, A.; Almagbile, A. Crowd monitoring system using unmanned aerial vehicle (UAV). J. Civ. Eng. Archit. 2017, 11, 1014–1024. [Google Scholar] [CrossRef] [Green Version]
  4. Estrada, M.A.R.; Ndoma, A. The uses of unmanned aerial vehicles –UAV’s-(or drones) in social logistic: Natural disasters response and humanitarian relief aid. Procedia Comput. Sci. 2019, 149, 375–383. [Google Scholar] [CrossRef]
  5. Chen, C.; Liu, B.; Wan, S.; Qiao, P.; Pei, Q. An Edge Traffic Flow Detection Scheme Based on Deep Learning in an Intelligent Transportation System. IEEE Trans. Intell. Transp. Syst. 2021, 22, 1840–1852. [Google Scholar] [CrossRef]
  6. Fromm, M.; Schubert, M.; Castilla, G.; Linke, J.; McDermid, G. Automated Detection of Conifer Seedlings in Drone Imagery Using Convolutional Neural Networks. Remote Sens. 2019, 11, 2585. [Google Scholar] [CrossRef] [Green Version]
  7. Kyrkou, C.; Plastiras, G.; Theocharides, T.; Venieris, S.I.; Bouganis, C. DroNet: Efficient convolutional neural network detector for real-time UAV applications. In Proceedings of the 2018 Design, Automation Test in Europe Conference Exhibition (DATE), Dresden, Germany, 19–23 March 2018; pp. 967–972. [Google Scholar] [CrossRef] [Green Version]
  8. Junos, M.H.; Mohd Khairuddin, A.S.; Thannirmalai, S.; Dahari, M. Automatic detection of oil palm fruits from UAV images using an improved YOLO model. Vis. Comput. 2021, 1–15. [Google Scholar] [CrossRef]
  9. Yu, X.; Gong, Y.; Jiang, N.; Ye, Q.; Han, Z. Scale Match for Tiny Person Detection. In Proceedings of the IEEE/CVF Winter Conference on Applications of Computer Vision 2020, Snowmass Village, CO, USA, 1–5 March 2020. [Google Scholar]
  10. Dai, J.; Li, Y.; He, K.; Sun, J. R-FCN: Object Detection via Region-Based Fully Convolutional Networks. In Proceedings of the 30th International Conference on Neural Information Processing Systems; Curran Associates Inc.: Red Hook, NY, USA, 2016; pp. 379–387. [Google Scholar]
  11. Liu, W.; Anguelov, D.; Erhan, D.; Szegedy, C.; Reed, S.E.; Fu, C.; Berg, A.C. SSD: Single Shot MultiBox Detector. In Proceedings of the European Conference on Computer Vision, Amsterdam, The Netherlands, 8–16 October 2016. [Google Scholar]
  12. Redmon, J.; Farhadi, A. YOLOv3: An Incremental Improvement. arXiv 2018, arXiv:1804.02767. [Google Scholar]
  13. Bochkovskiy, A.; Wang, C.Y.; Liao, H.Y.M. Yolov4: Optimal speed and accuracy of object detection. arXiv 2020, arXiv:2004.10934. [Google Scholar]
  14. Pang, J.; Li, C.; Shi, J.; Xu, Z.; Feng, H. R2 -CNN: Fast Tiny Object Detection in Large-Scale Remote Sensing Images. IEEE Trans. Geosci. Remote Sens. 2019, 57, 5512–5524. [Google Scholar] [CrossRef] [Green Version]
  15. Zhang, J.; Liang, X.; Wang, M.; Yang, L.; Zhuo, L. Coarse-to-fine object detection in unmanned aerial vehicle imagery using lightweight convolutional neural network and deep motion saliency. Neurocomputing 2020, 398, 555–565. [Google Scholar] [CrossRef]
  16. Liu, M.; Wang, X.; Zhou, A.; Fu, X.; Ma, Y.; Piao, C. UAV-YOLO: Small Object Detection on Unmanned Aerial Vehicle Perspective. Sensors 2020, 20, 2238. [Google Scholar] [CrossRef] [PubMed] [Green Version]
  17. Chen, T.Y.H.; Ravindranath, L.; Deng, S.; Bahl, P.; Balakrishnan, H. Glimpse: Continuous, Real-Time Object Recognition on Mobile Devices. In Proceedings of the 13th ACM Conference on Embedded Networked Sensor Systems, Seoul, Korea, 1–4 November 2015; Association for Computing Machinery: New York, NY, USA, 2015; pp. 155–168. [Google Scholar] [CrossRef] [Green Version]
  18. Canel, C.; Kim, T.; Zhou, G.; Li, C.; Lim, H.; Andersen, D.G.; Kaminsky, M.; Dulloor, S.R. Picking interesting frames in streaming video. In Proceedings of the 2018 SysML Conference, Stanford, CA, USA, 15–16 February 2018; pp. 1–3. [Google Scholar]
  19. Jiaheng, H.; Xiaowei, L.; Benhui, C.; Dengqi, Y. A Comparative Study on Image Similarity Algorithms Based on Hash. J. Dali Univ. 2017, 2, 32–37. [Google Scholar]
  20. Rubner, Y.; Tomasi, C.; Guibas, L.J. The earth mover’s distance as a metric for image retrieval. Int. J. Comput. Vis. 2000, 40, 99–121. [Google Scholar] [CrossRef]
  21. Horé, A.; Ziou, D. Image Quality Metrics: PSNR vs. SSIM. In Proceedings of the 2010 20th International Conference on Pattern Recognition, Istanbul, Turkey, 23–26 August 2010; pp. 2366–2369. [Google Scholar] [CrossRef]
  22. Gao, Z.; Lu, G.; Lyu, C.; Yan, P. Key-frame selection for automatic summarization of surveillance videos: A method of multiple change-point detection. Mach. Vis. Appl. 2018, 29, 1101–1117. [Google Scholar] [CrossRef]
  23. Ren, S.; He, K.; Girshick, R.; Sun, J. Faster R-CNN: Towards Real-Time Object Detection with Region Proposal Networks. IEEE Trans. Pattern Anal. Mach. Intell. 2017, 39, 1137–1149. [Google Scholar] [CrossRef] [Green Version]
  24. Hui, T.W.; Loy, C.C. LiteFlowNet3: Resolving Correspondence Ambiguity for More Accurate Optical Flow Estimation. In Computer Vision—ECCV 2020; Vedaldi, A., Bischof, H., Brox, T., Frahm, J.M., Eds.; Springer International Publishing: Cham, Switzerland, 2020; pp. 169–184. [Google Scholar]
  25. Dosovitskiy, A.; Fischer, P.; Ilg, E.; Häusser, P.; Hazirbas, C.; Golkov, V.; Smagt, P.; Cremers, D.; Brox, T. FlowNet: Learning Optical Flow with Convolutional Networks. In Proceedings of the 2015 IEEE International Conference on Computer Vision (ICCV), Santiago, Chile, 11–18 December 2015; pp. 2758–2766. [Google Scholar] [CrossRef] [Green Version]
  26. Sun, D.; Yang, X.; Liu, M.; Kautz, J. PWC-Net: CNNs for Optical Flow Using Pyramid, Warping, and Cost Volume. In Proceedings of the IEEE Conference on Computer Vision and Pattern Recognition, Salt Lake City, UT, USA, 18–23 June 2018. [Google Scholar]
  27. Rahman, M.A.; Wang, Y. Optimizing Intersection-Over-Union in Deep Neural Networks for Image Segmentation. In Proceedings of the International Symposium on Visual Computing, Las Vegas, NV, USA, 12–14 December 2016. [Google Scholar]
  28. Zhao, X.M.; Deng, Z.M. The Energy Gradient Method Based on Two-Dimensional Discrete Wavelet to Extract the Feature of Pilling. In Affective Computing and Intelligent Interaction; Luo, J., Ed.; Springer: Berlin/Heidelberg, Germany, 2012; pp. 779–787. [Google Scholar] [CrossRef]
  29. Haddad, R.A.; Akansu, A.N. A class of fast Gaussian binomial filters for speech and image processing. IEEE Trans. Signal Process. 1991, 39, 723–727. [Google Scholar] [CrossRef]
  30. Grana, C.; Borghesani, D.; Cucchiara, R. Optimized Block-Based Connected Components Labeling With Decision Trees. IEEE Trans. Image Process. 2010, 19, 1596–1609. [Google Scholar] [CrossRef] [PubMed] [Green Version]
  31. Yang, H.; Tian, Q.; Zhuang, Q.; Li, L.; Liang, Q. Fast and robust key frame extraction method for gesture video based on high-level feature representation. Signal Image Video Process. 2021, 15, 617–626. [Google Scholar] [CrossRef]
  32. Rahman, M.A.; Wang, Y. Optimizing Intersection-Over-Union in Deep Neural Networks for Image Segmentation. In Advances in Visual Computing; Bebis, G., Boyle, R., Parvin, B., Koracin, D., Porikli, F., Skaff, S., Entezari, A., Min, J., Iwai, D., Sadagic, A., et al., Eds.; Springer International Publishing: Cham, Switzerland, 2016; pp. 234–244. [Google Scholar]
  33. Lin, T.; Goyal, P.; Girshick, R.B.; He, K.; Dollár, P. Focal Loss for Dense Object Detection. In Proceedings of the IEEE International Conference on Computer Vision, Venice, Italy, 22–29 October 2017. [Google Scholar]
  34. Redmon, J.; Farhadi, A. YOLO9000: Better, Faster, Stronger. arXiv 2016, arXiv:1612.08242. [Google Scholar]
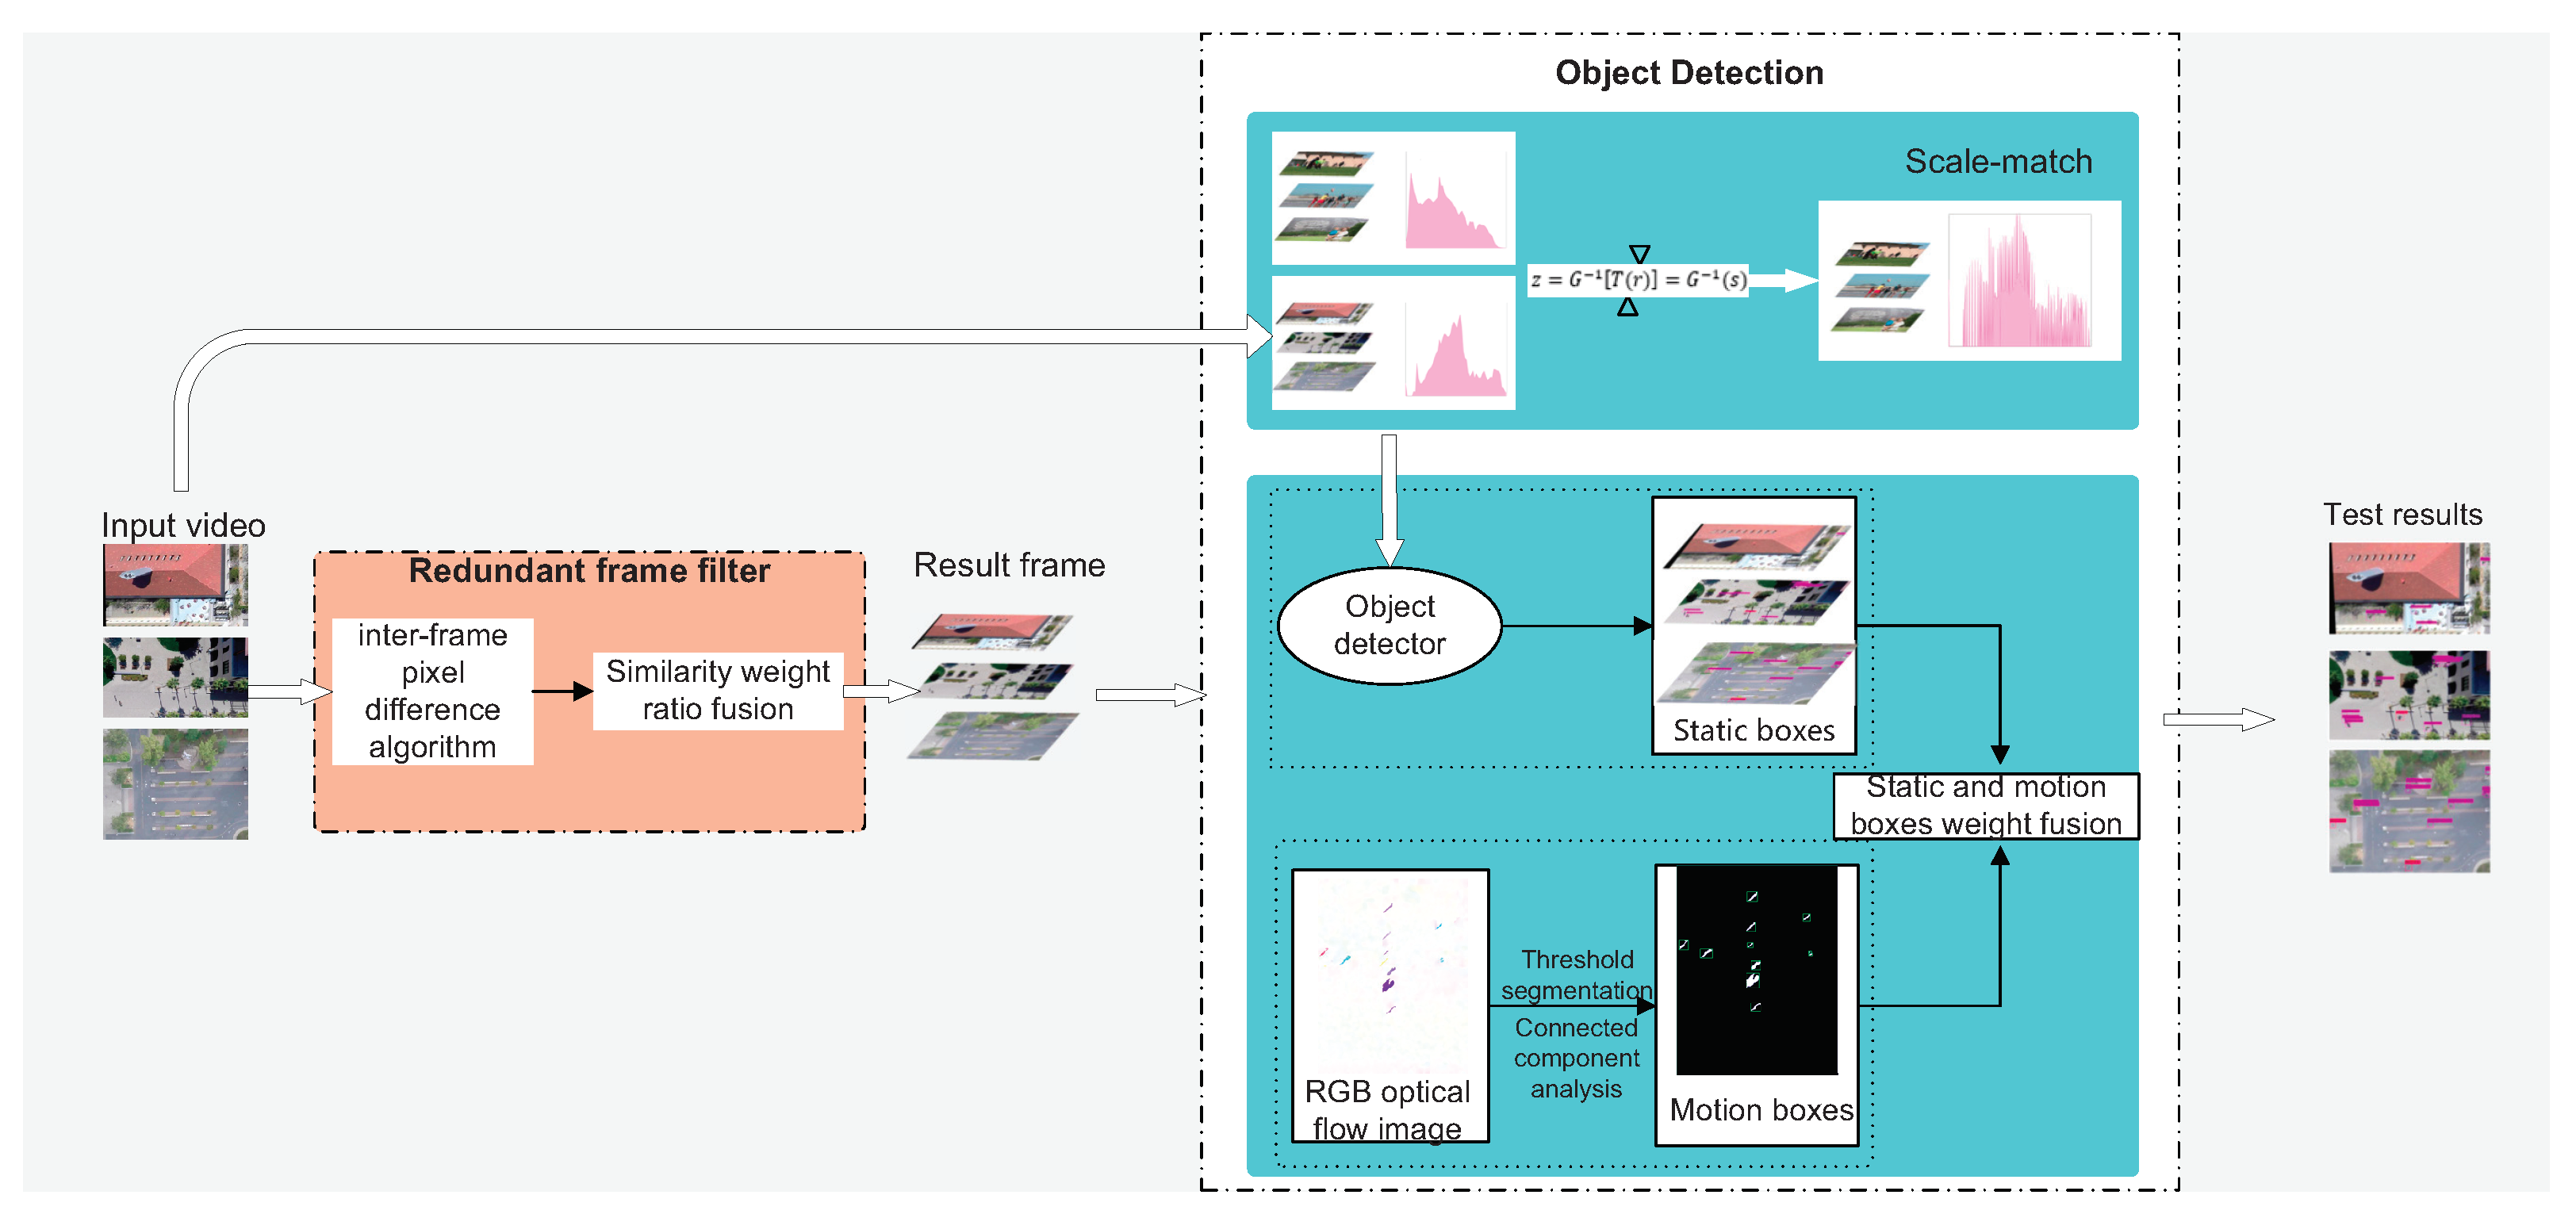
Figure 1. The proposed object detection method for UAV images.
Drones 06 00076 g001
Figure 2. The flow chart of obtaining moving boxes.
Drones 06 00076 g002
Figure 3. Different weight coefficients are set and the harmonic mean F and compression ratio CR of different weight coefficients are compared. (a) Trend chart of harmonic mean F. (b) Trend chart of compression ratio.
Drones 06 00076 g003
Figure 4. Harmonic mean and compression ratio comparison with other paper in the same video. (a) Contrast of harmonic mean. (b) Contrast of compression ratio.
Drones 06 00076 g004
Figure 5. Comparing detection results using two datasets. (It should point out that the first three rows of detection results are SDD datasets, and the last two rows are UAV123 datasets).
Drones 06 00076 g005
Figure 6. Speed and accuracy comparison with mainstream target detection algorithms.
Drones 06 00076 g006
Table 1. Weight coefficient setting in redundant frame filter method.
WFramesInitialResultUndetectedRedundantFCR
0.311,9667292910160.9732.43%
0.511,9667292850100.9832.38%
0.611,966729277030.9942.31%
0.711,966729274210.9942.32%
0.312,7216192840150.9742.23%
0.512,721619260090.9832.04%
0.612,721619249020.9961.96%
0.712,721619244320.9901.92%
Table 2. Compare with existing methods to reduce redundant frames.
MethodsFramesResultUndetectedRedundantFCRAverage Time/s
Coarse-to-fine [15]11,9663360620.9152.810.027
Glimpse [17]11,96643201580.8453.610.007
Ours11966277030.9942.310.055
Coarse-to-fine [15]12,7213270600.9192.670.027
Glimpse [17]12,72145901670.8473.600.007
Ours12,721249000.9901.920.055
Table 3. Results of ablation experiments.
MethodsPedestrian APBiker APmAPTime/s
Baseline [13]74.3460.4567.40268
+Frame filtering74.3460.4567.4029.12
+Frame filtering and Feature fusion75.9362.6569.2931.46
+Frame filtering and Scale match75.1461.1168.1331.25
Ours77.5364.2870.9132.05
Table 4. Comparison between the proposed method and the mainstream target detection algorithms.
MethodsInputPedestrian AP/%Biker AP/%mAP/%IoUFPS
R-FCN (ResNet-101) [10]1000 × 60067.2155.7161.4653.2610.24
RetinaNet [33]800 × 80071.7757.2964.5354.4317.5
SSD300 [11]300 × 30065.0350.9457.9952.6730.36
SSD512 [11]512 × 51268.9054.8161.8653.8019.32
YOLOv2 [34]416 × 41653.4639.1846.3242.9369.27
YOLOv3 [12]416 × 41659.5444.1551.8550.4561.3
YOLOv4 [13]416 × 41674.3460.4567.4055.4844.5
After SM416 × 41675.1461.1168.1356.0833.2
Ours416 × 41677.5364.2870.9157.7330.3
Publisher’s Note: MDPI stays neutral with regard to jurisdictional claims in published maps and institutional affiliations.