1. Introduction
As the development of unmanned aerial vehicle (UAV) technology is becoming rapid, new demands from countless fields are emerging due to its advantages of having small dimensions, low operating cost, and minimal risk to the environment and human life. UAVs are already commonly used in the military [
1]. Furthermore, they have a promising future in forestry [
2], medical [
3], and meteorology [
4]. Ever-growing demands mean that UAVs need to be developed in a variety of shapes and sizes to satisfy and achieve limitless kinds of mission.
Despite being relatively new entrants to the airspace, UAVs have already come in a variety of configurations. UAVs are generally classified into two configurations, namely rotary-wing and fixed-wing. Each configuration has its advantages and disadvantages. A vertical take-off and landing plane (VTOL plane) is a combination of those two configurations, affording the benefit of high cruising range and efficiency from a fixed wing and the capability of taking off and landing in a limited area from a rotary wing [
5]. VTOL Planes are ideal for usage in a remote area, rough terrain, or a vast body of water, making it excellent for application to monitoring and surveillance.
Numerous design concepts for VTOL plane UAVs are available, such as a fixed-wing VTOL and a tiltrotor. The main difference between the two is how the UAV transitions from the VTOL phase to the cruising phase, and vice versa. However, the tiltrotor concept uses a complicated mechanism to change the orientation of the rotors with a control system too complex to be used as a design reference. On the other hand, the fixed-wing VTOL is simpler to manufacture and operate, making it easier to develop and expand further.
VTOL plane design requires arms to mount its rotary-wing rotors. Many UAV designs and configuration concepts can be utilized as a VTOL plane design by placing arms as mountings for the VTOL motors, namely a quad-plane [
6], a twin-tail boom [
7,
8,
9], a tandem wing [
10,
11], and a transverse arm. Moreover, the quad-plane, twin-tail boom, and tandem wing configurations are already available on the market [
6,
7,
8,
9,
11]. The transverse arm is a newly proposed idea based on the configuration’s geometry that could work as a VTOL plane configuration. As such, it is not a common configuration and can not be found in the market.
Even though there are already CFD simulations [
12,
13,
14] and experimental studies [
10,
15] of those configurations’ performances, no research has been conducted to compare and determine which arm configuration performs the best aerodynamically. Furthermore, different missions demand different performances of the UAV. Even though the configurations being compared are already developed and quite mature, the comparison result could work as a basis for customers or users to choose which configuration to develop based on the mission’s need. As a result, this study will discuss each configuration’s advantages and disadvantages, determine which configuration performs the best overall, and what kind of mission each is suitable for.
Each configuration has its characteristics. Quad-plane configuration is the most common because it resembles the conventional fixed-wing configuration the most with the addition of VTOL arms. However, due to the fuselage stretching to the tailplane, it has more drag than the twin-tail boom configuration. The tandem wing configuration uses its two wings to support the VTOL motors, so it does not require additional beams. The drawbacks include being more prone to wind gusts or less stable in crosswind conditions due to its two wings [
16]. The transverse arm configuration has two horizontal stabilizer surfaces, in the forward and aft fuselage, as supports to mount the VTOL motors, making it stable but susceptible to higher drag.
The arm configurations mentioned are all acceptable for a VTOL plane design. However, the design geometries are quite different. To determine which configuration performs the best, all four configurations’ designs were analyzed using a CFD approach to find out their aerodynamic performance in various wind situations to simulate real flight conditions.
2. Research Methods
The UAV is designed through several steps, beginning with conceptual design, preliminary design, and detailed design [
17,
18,
19,
20,
21,
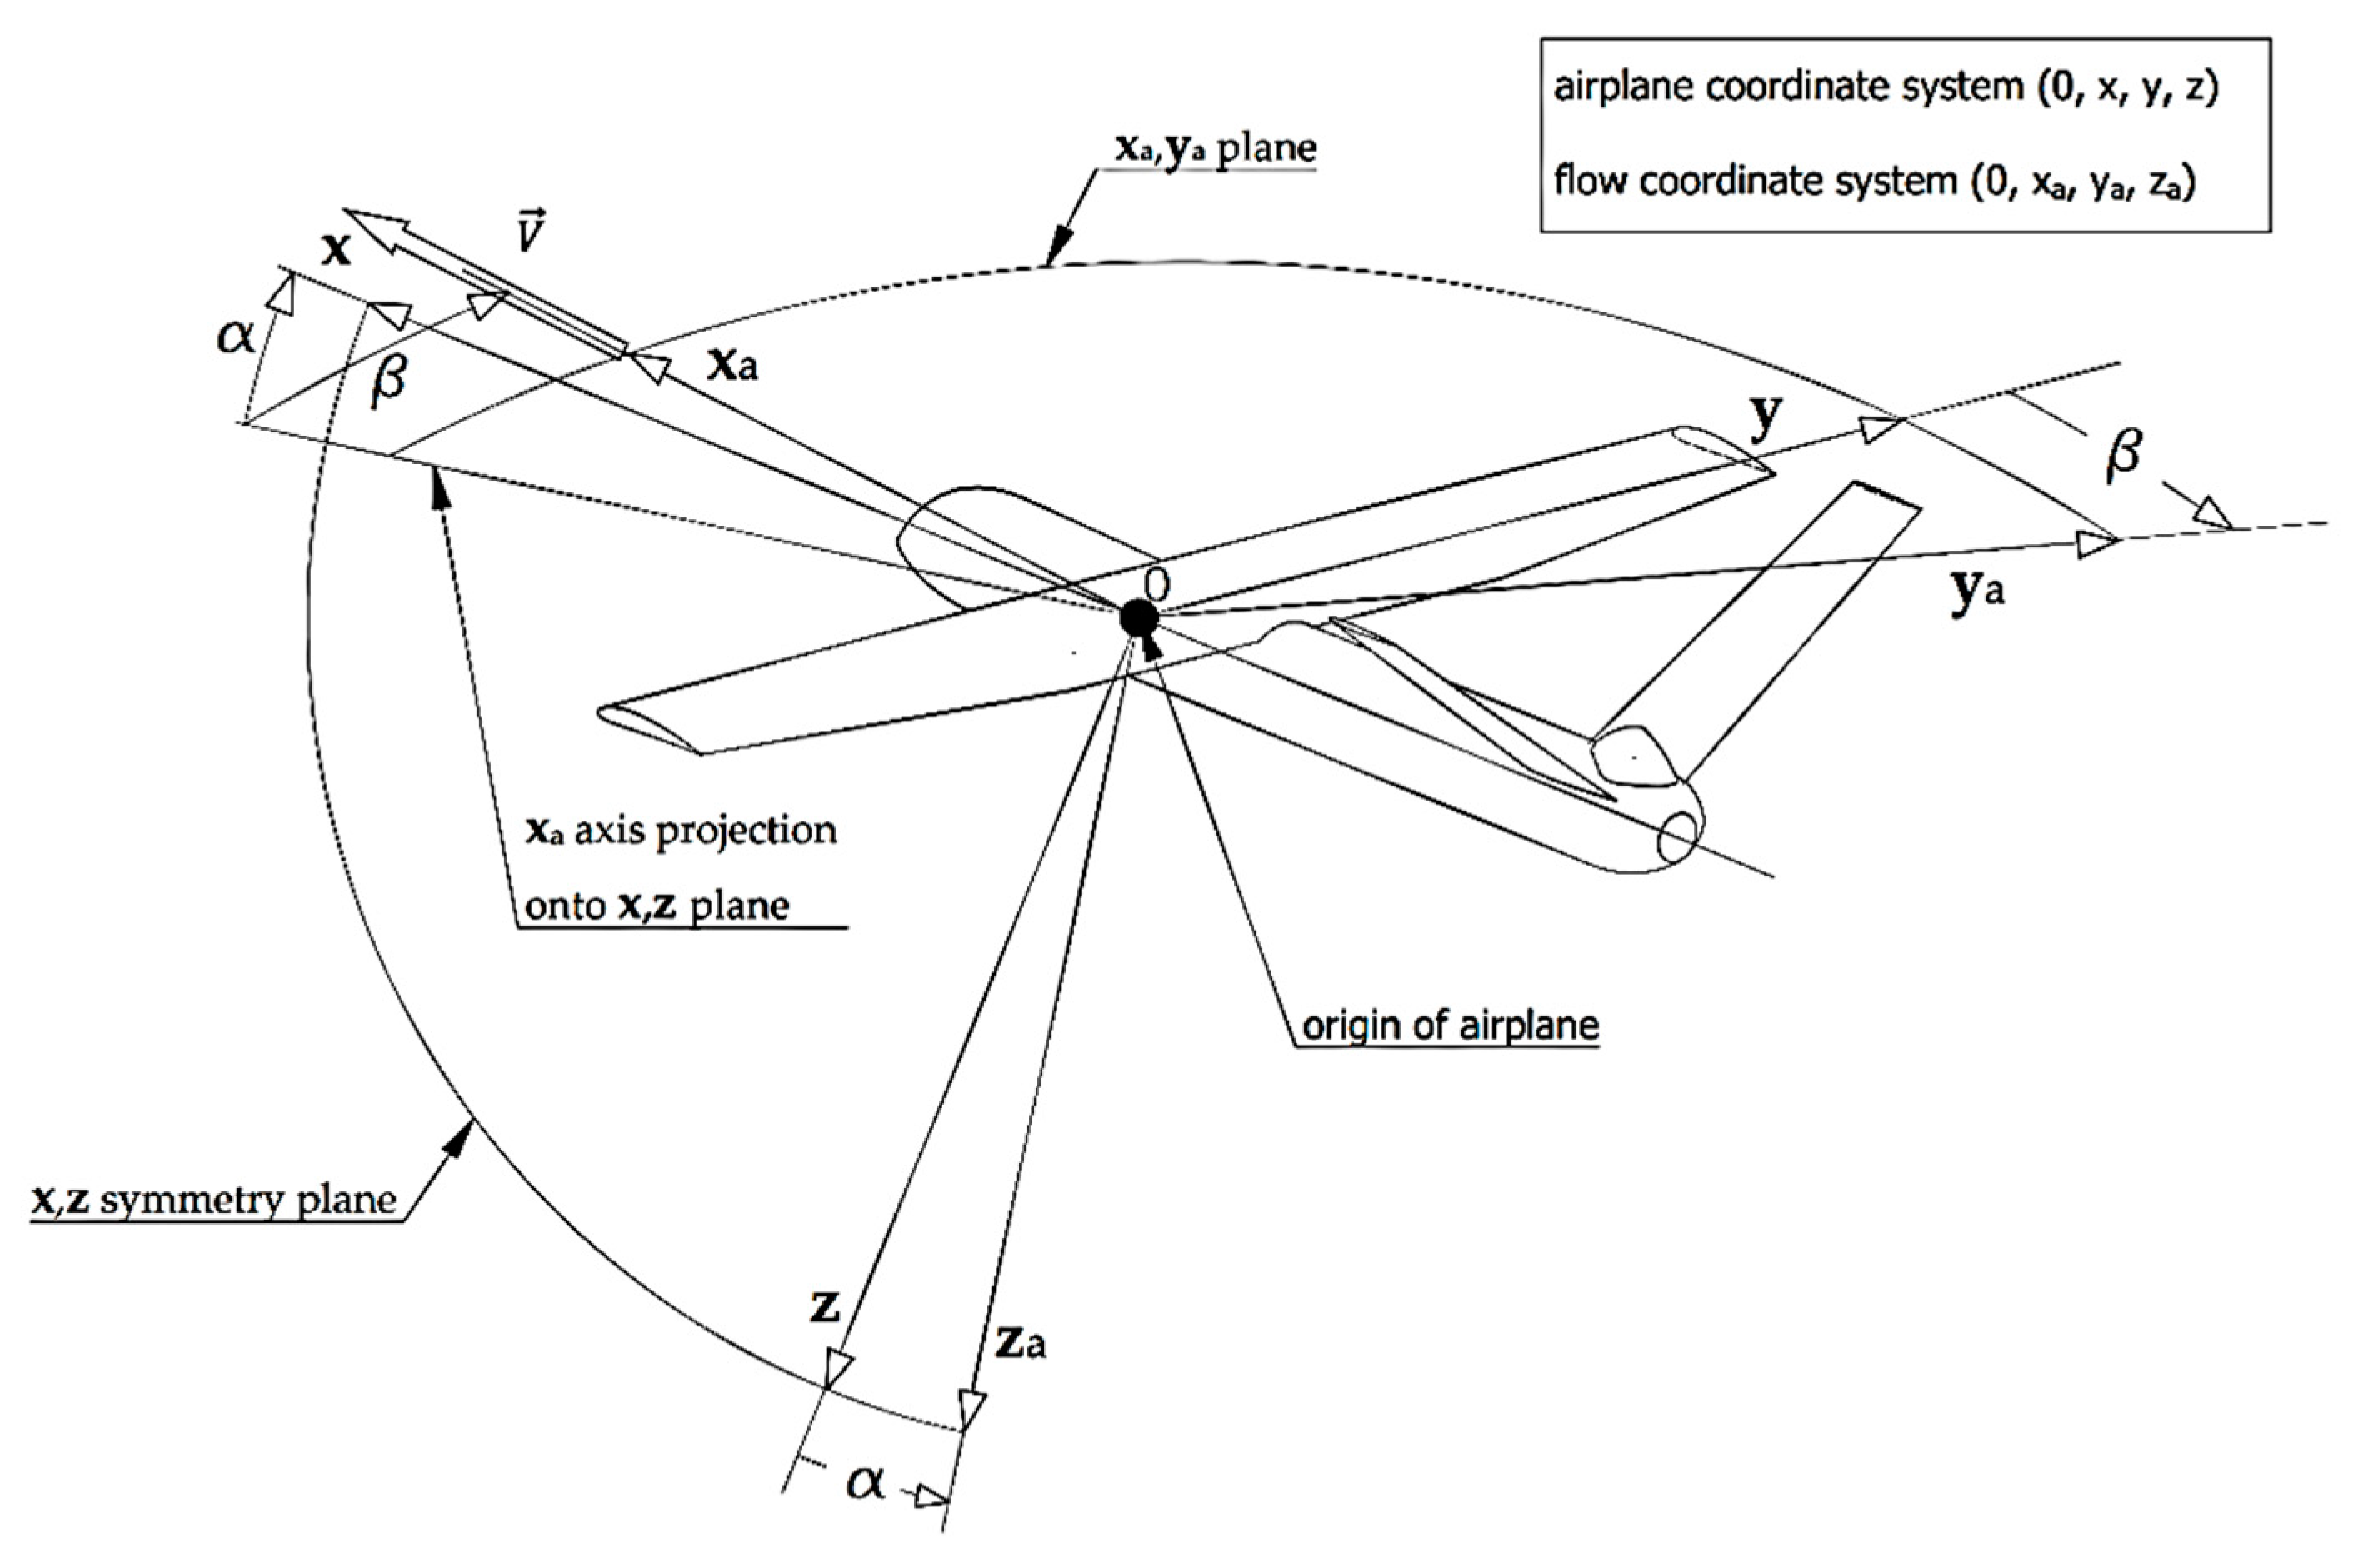
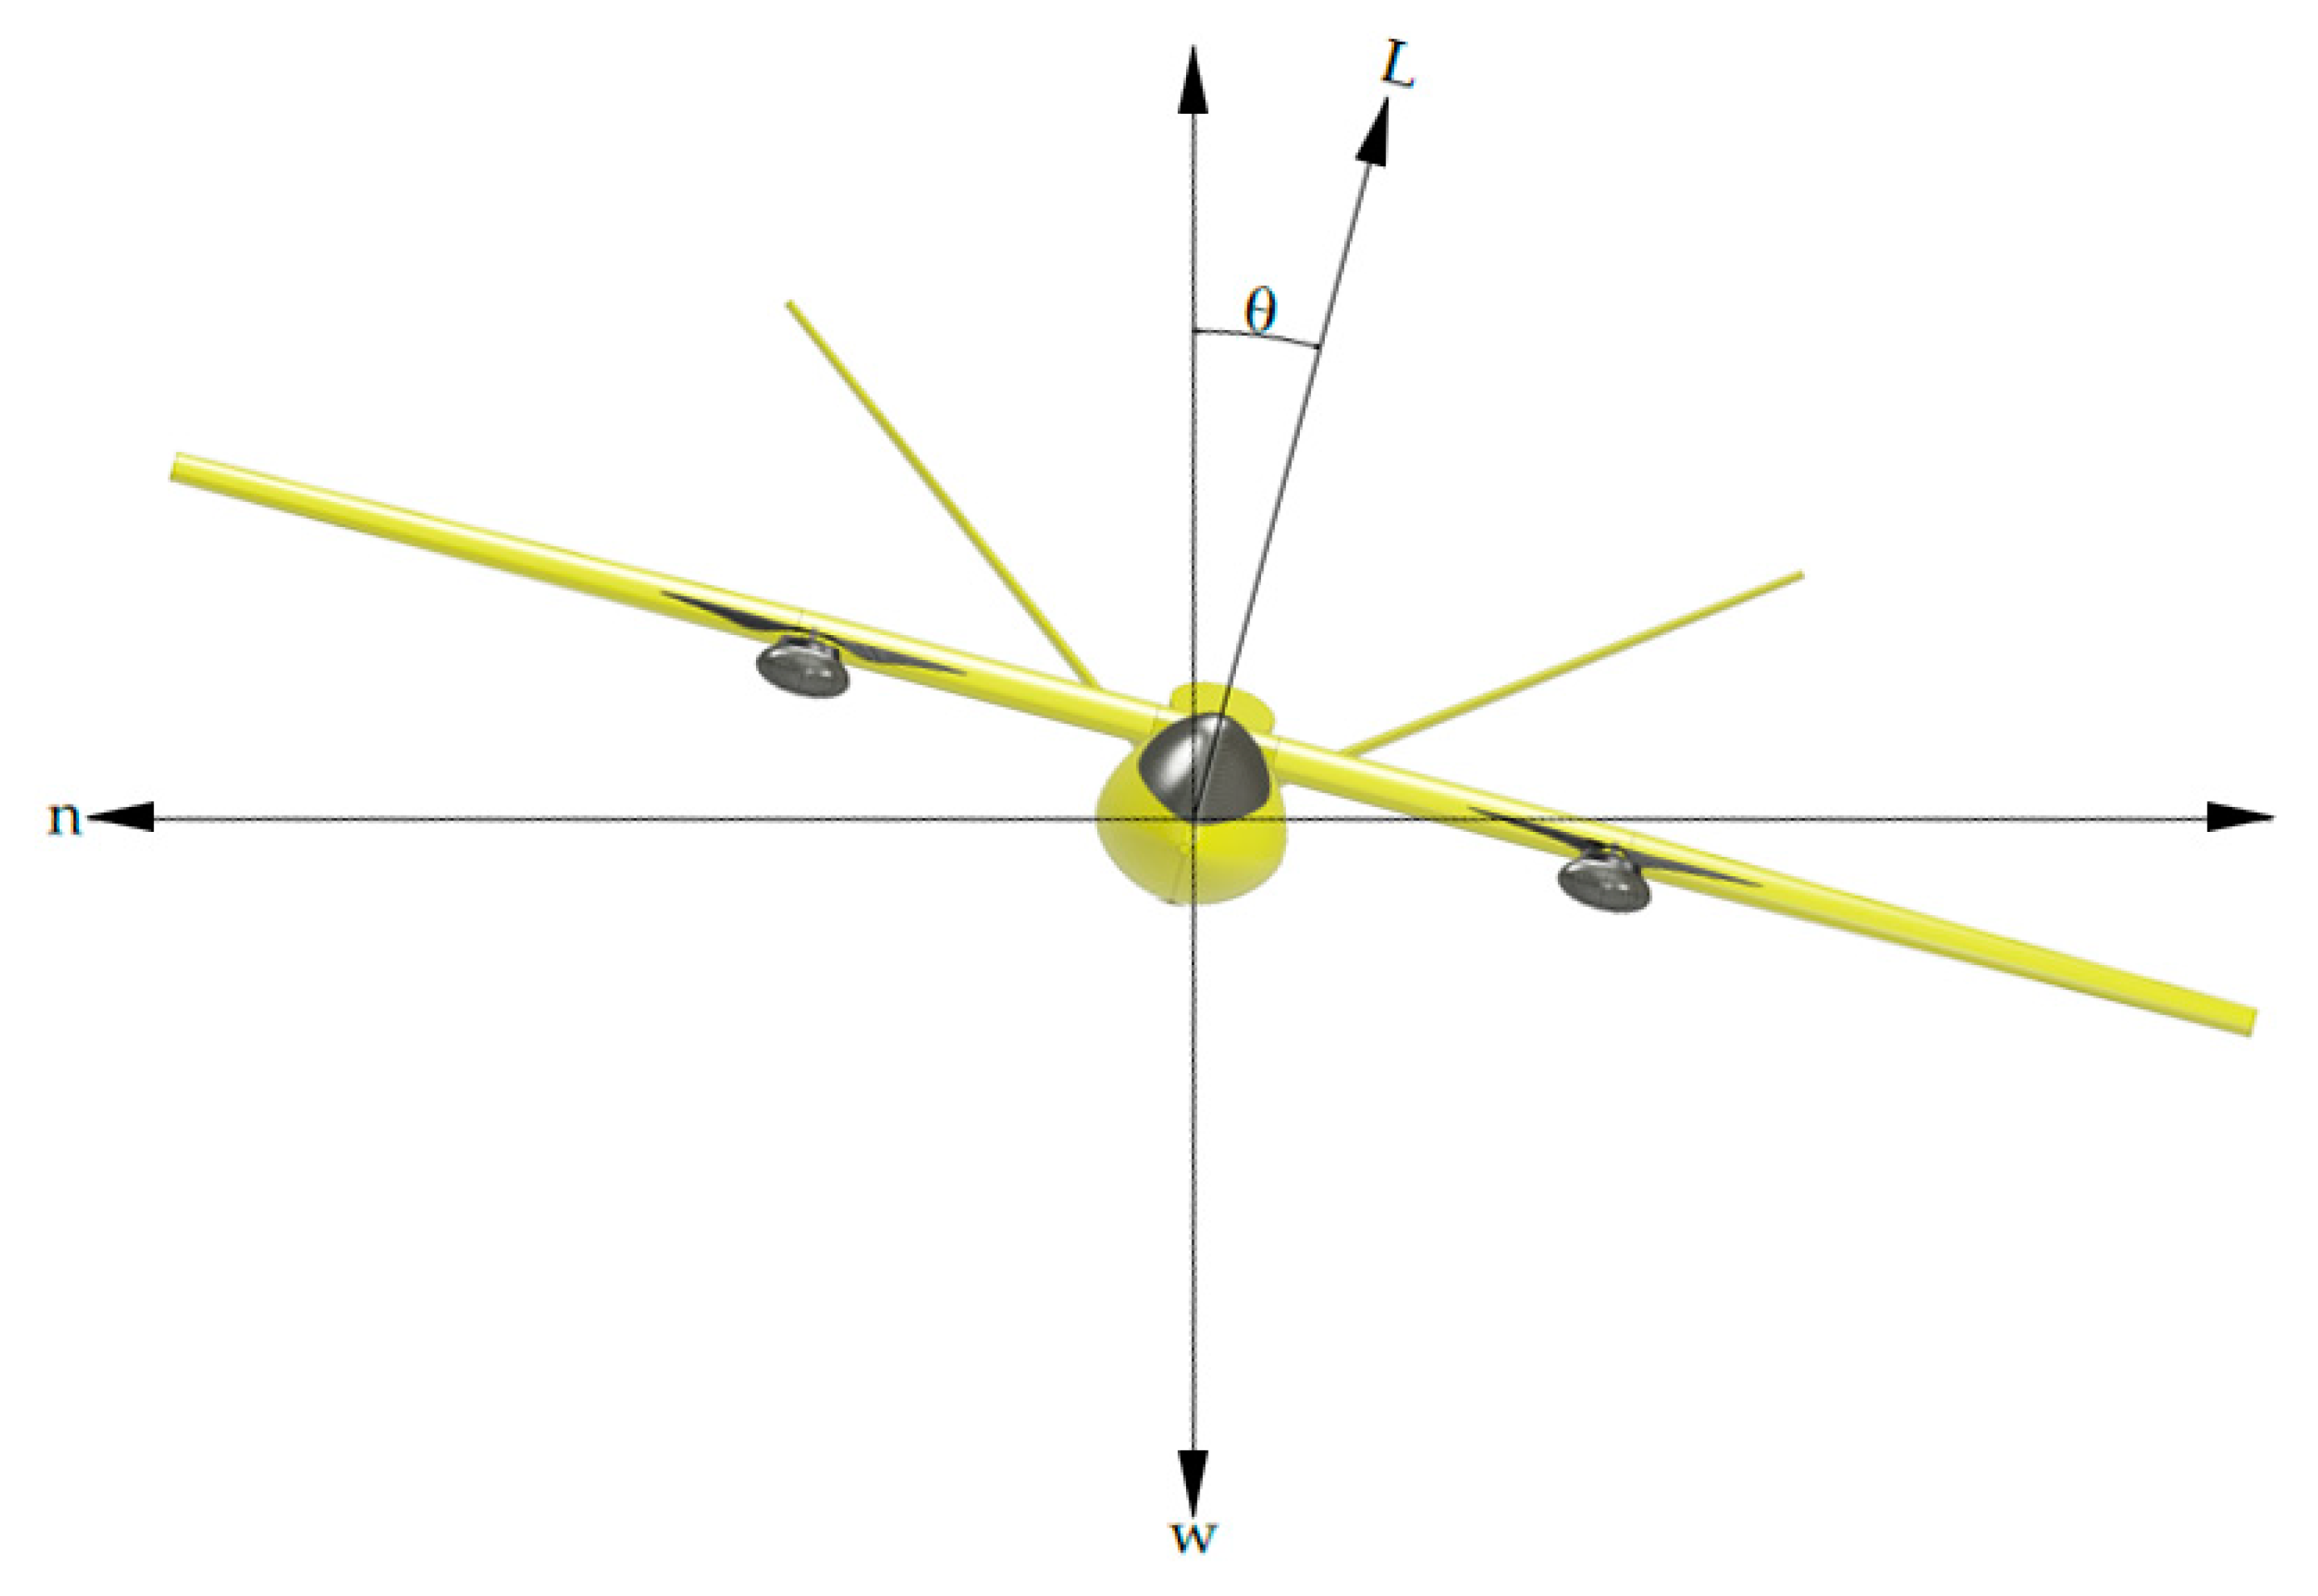
22]. These steps are necessary to ensure that the UAV being designed is reliable and satisfies the DR&O. The performances being compared are the lift and drag characteristics, stall conditions, efficiency, stability, and maneuverability. To ensure that the performances are comprehended in various flight conditions, the angle of attack and sideslip angle need to be considered since they influence stability [
23]. The angle of attack, α, is the angle between the longitudinal axis x and the projection of the vector speed
on the plane of symmetry x, z. The sideslip angle, β, is the angle between the vector of speed relative to the air
and the plane of the aircraft x, z [
24]. Both angles are illustrated in
Figure 1.
A computational fluid dynamics approach was used to analyze the overall design because it is more feasible than using a wind tunnel as an experimental approach. Furthermore, it does not require excessive cost. The simulation was conducted using an accurate turbulence model to acquire accurate data.
The VTOL plane was designed to be hybrid, where the VTOL propulsion uses electric motors, and the fixed-wing propulsion uses an internal combustion engine (ICE) with gasoline to increase the cruise range and energy efficiency. The conversion to other configurations follows several processes to make each configuration work based on similar studies or comparison planes. We attempted to keep the variables, including the aircraft weight, the cruise speed, the wing area, the wing planform design, horizontal and vertical stabilizer volume coefficient, fuselage geometry, and the forward propulsion system intake and exhaust geometry the same in all configurations. The following arm configurations were used in the comparison:
2.1. Design Requirements and Objectives
The VTOL plane is designed to fly at low speed with low stall speed to accommodate the transition from the vertical take-off phase to the cruising phase and then to the vertical landing phase. The VTOL plane must not stall until the VTOL motors take over the lifting duty and fully support the aircraft’s weight so the transition from forward flight to hovering remains stable and smooth [
25]. The civil aviation safety regulation (CASR) [
26] was also used to determine the requirements to ensure the aircraft conformed to governing body regulations so it could be certified.
Table 1 lists the DR&O, followed by
Figure 2, which shows the mission profile of the VTOL plane.
2.2. Conceptual Design
The conceptual design step configures the wing configuration, fuselage geometry, empennage, and propulsion systems. To fulfill the requirement of a low stall speed, a high-lift wing configuration is needed. Therefore, the high-wing configuration was chosen due to its superior lift-to-drag ratio (L/D) to the mid-wing and the low-wing configurations [
27]. The wing was designed without dihedral angles to simplify the geometries in the CFD simulation.
The geometry of the fuselage is a combination of several comparison planes. The dimensions of the fuselage were adapted to the electronic components and fuel tank volume requirements. The propulsion system configuration chosen was a pusher with the ICE mounted in the aft fuselage, to avoid obstructing the pitot tube, camera, and sensors mounted at the nose of the fuselage. In a twin-tail boom design, the fuselage does not need to be stretched to the tailplane because the tailplane is mounted on the twin-boom, which shortens the fuselage length but still accommodates enough room for the necessary electronic components and the fuel tank.
ALTI Ascend [
7], ALTI Transition [
8], and Foxtech Great Shark 330 [
9] have similar DR&O to the designed VTOL plane, so they were chosen as comparison planes in this study. Those comparison planes were used as a reference to determine the fuselage geometry and their specifications were needed as reference data to solve equations in the sizing step.
2.3. Preliminary Design
Preliminary design was divided into two steps, namely weight sizing and performance sizing. In weight sizing, several values such as take-off weight, empty weight, fuel weight, and fuel fraction were calculated. Data from comparison planes were used as a reference to calculate those values, according to the equations provided by [
18]. Fuel fraction is the amount of fuel weight needed for a mission phase divided by the empty weight of the aircraft.
In performance sizing, the values to be calculated are the power loading (
W/P) and wing loading (
W/S). They are obtained by calculating each phase’s performance equations provided by [
18] to obtain every phase’s range of accepted wing loadings and power loadings based on the DR&O. The wing loading and power loading are then plotted in one (
W/P) vs. (
W/S) graph to obtain an area where all design points within that area are acceptable to fulfill the aircraft’s mission profile.
2.3.1. Weight Sizing
Table 2 shows the fuel fractions of each phase of the mission and
Table 3 shows the calculated weight sizing.
2.3.2. Performance Sizing
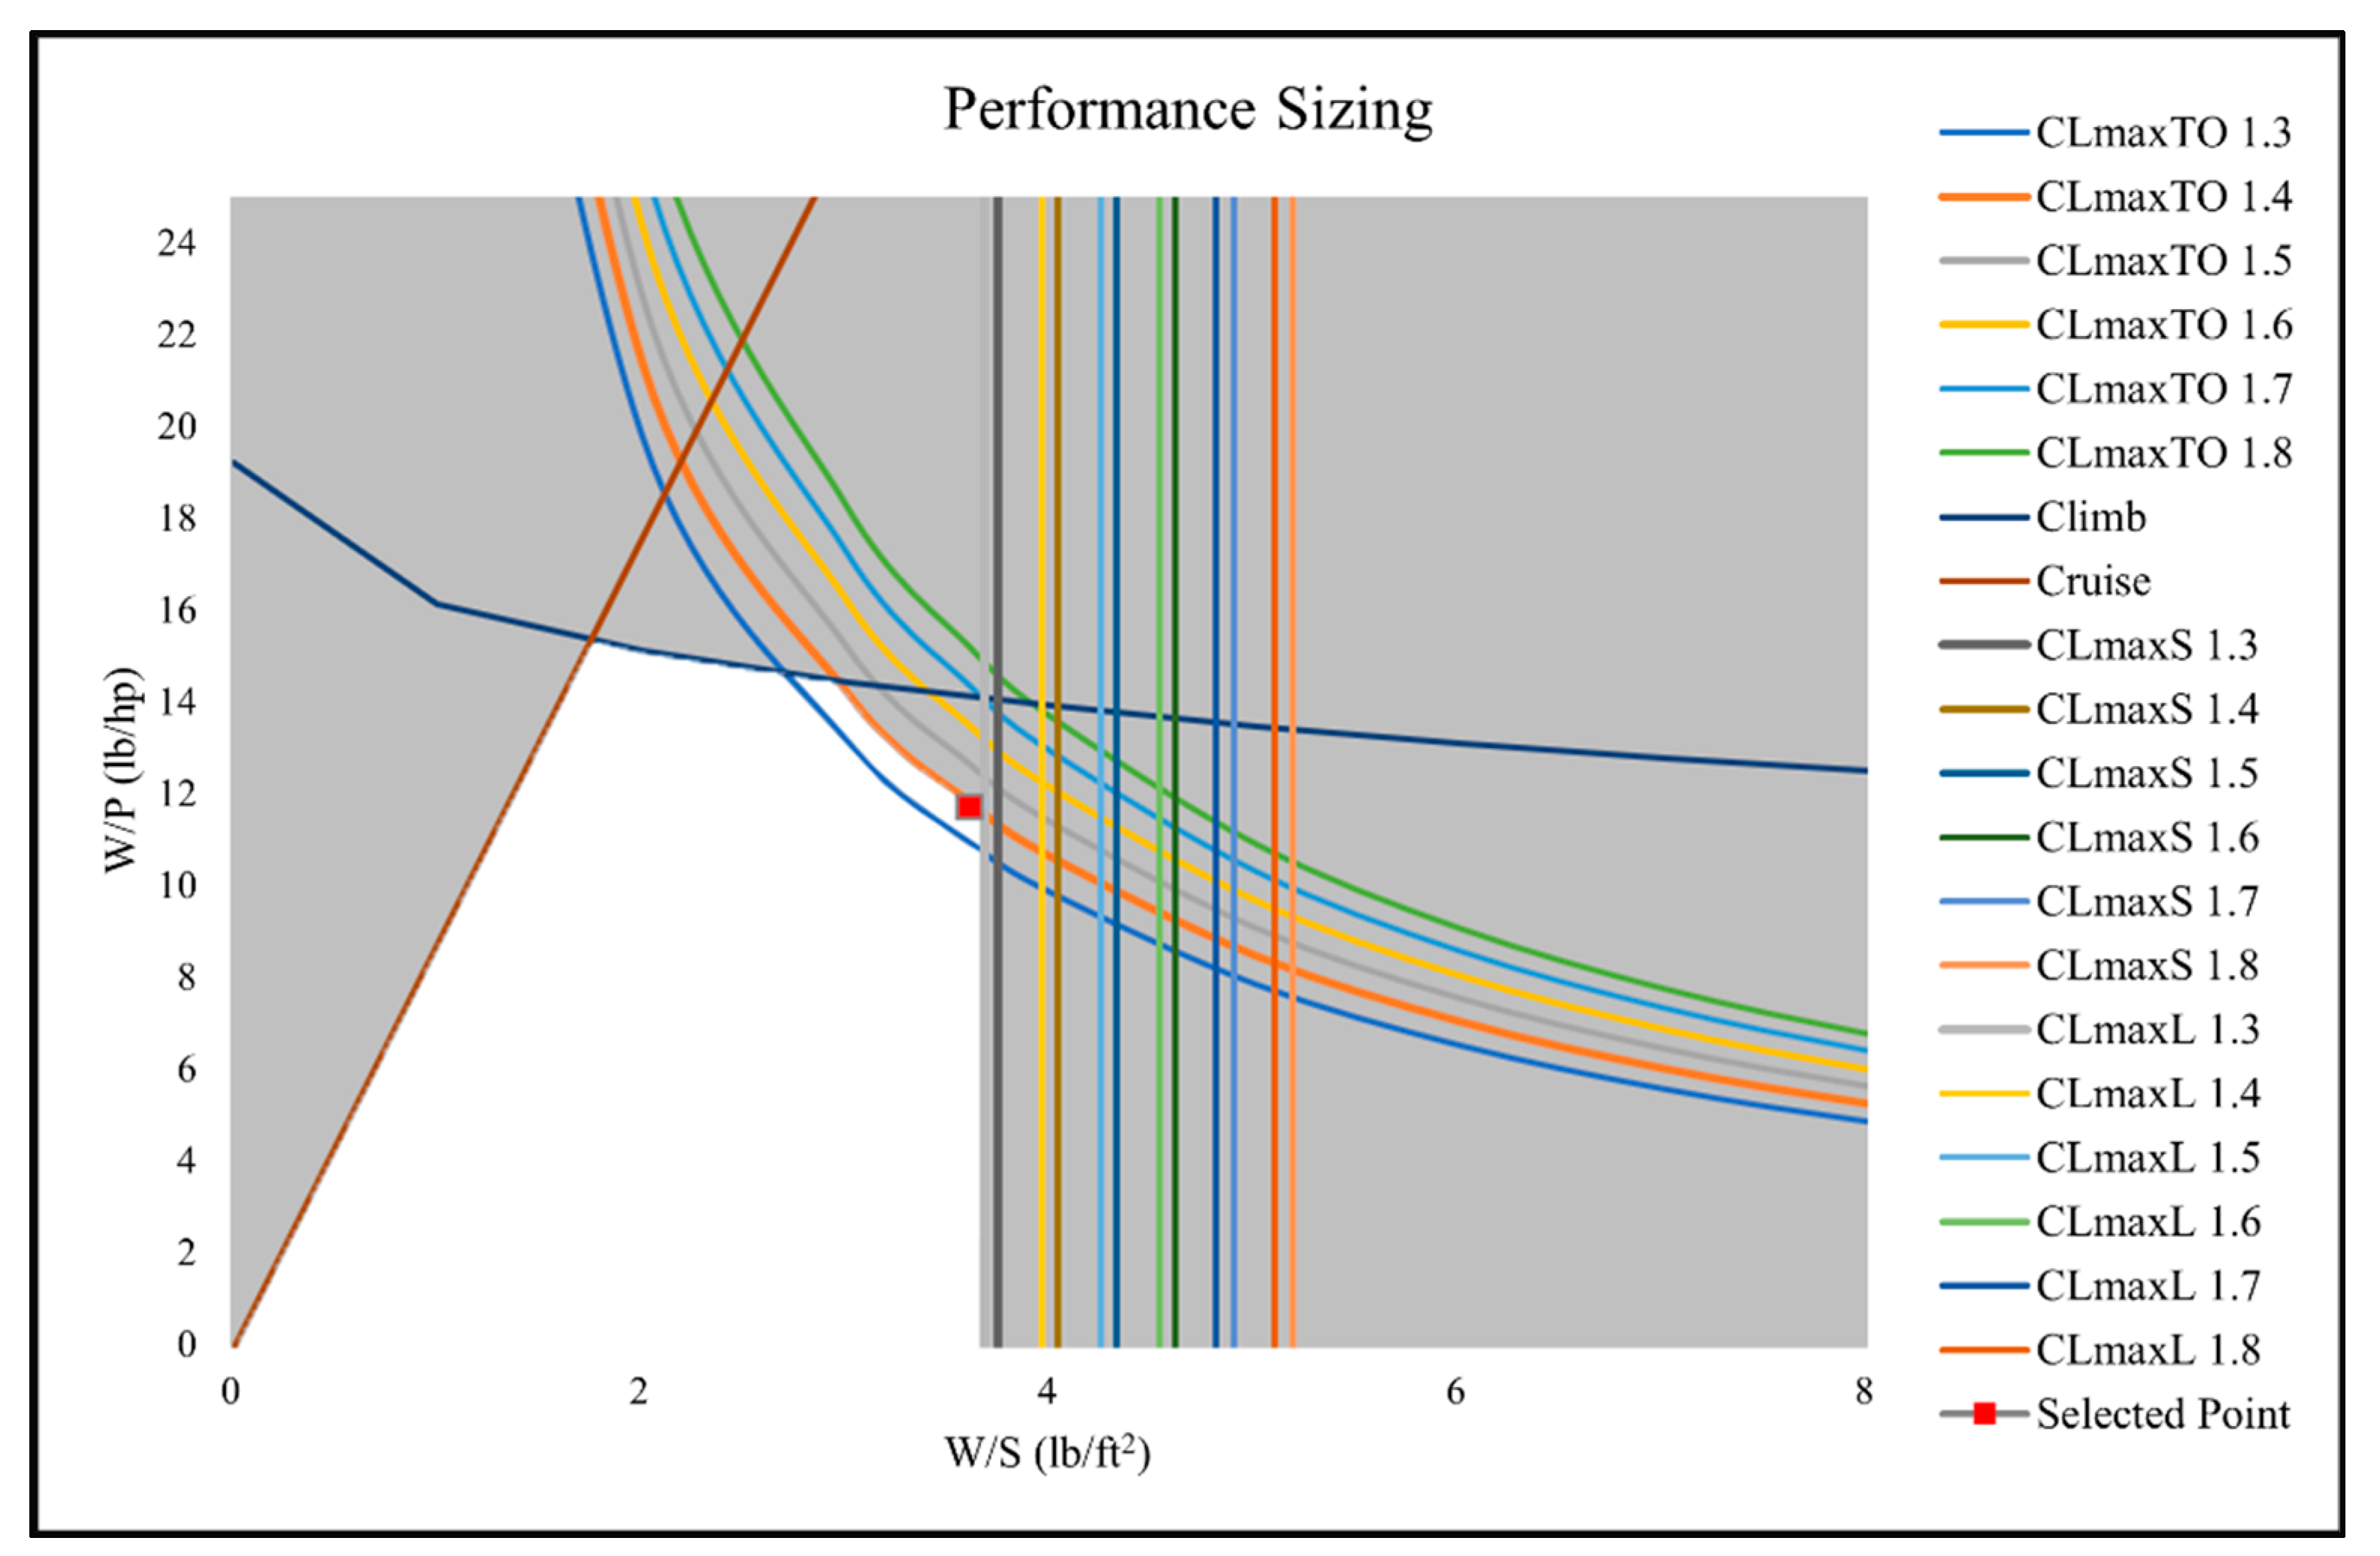
Figure 3 shows the (
W/P) vs. (
W/S) matching plot of every phase’s performance curve, which resulted in an area where all points within are considered acceptable and capable of fulfilling the DR&O. The white area shows the acceptable range for a design point. A design point was then picked considering the optimum wing area and power needed. The wing loading and the power loading values were provided by the selected design point, shown as a red dot in
Figure 3. The results of the performance sizing are listed in
Table 4.
2.4. Detailed Design
Data that were obtained through the preliminary design step were used to design the wing, VTOL arm, and empennage. After the calculations to obtain the dimensions had been completed, a 3D design was created. Several simplifications had been carried out to the design as it was solely used for simulation purposes, which means manufacturing processes were not taken into consideration.
2.4.1. Wing Detailed Design
The planform of the wing was designed using equations from [
18]:
where: s = wing area (m
2), b = wingspan (m), Cr = root chord (m), Ct = tip chord (m), AR = aspect ratio.
According to
Table 4, the required coefficient of lift (C
L) was 1.4, so the NACA 4412 was selected as the wing airfoil because it had a C
L of 1.6 [
28].
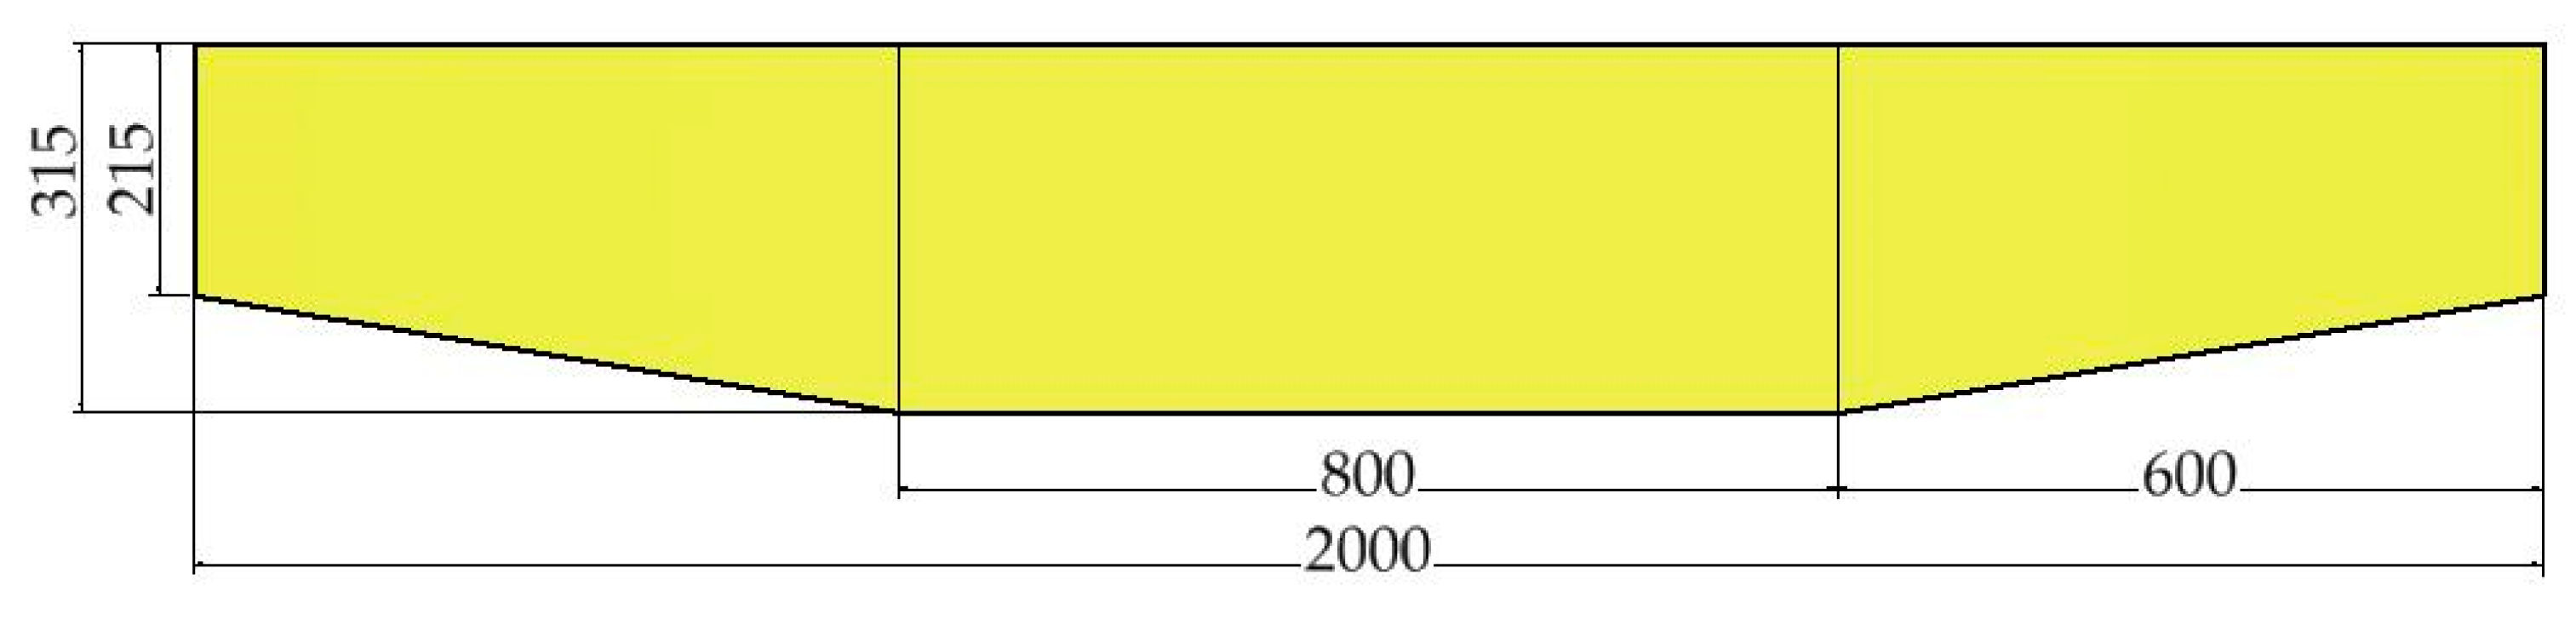
Table 5 shows the results of the wing design calculated using Equations (1)–(4).
Figure 4 shows the wing planform design.
2.4.2. VTOL Arm Design
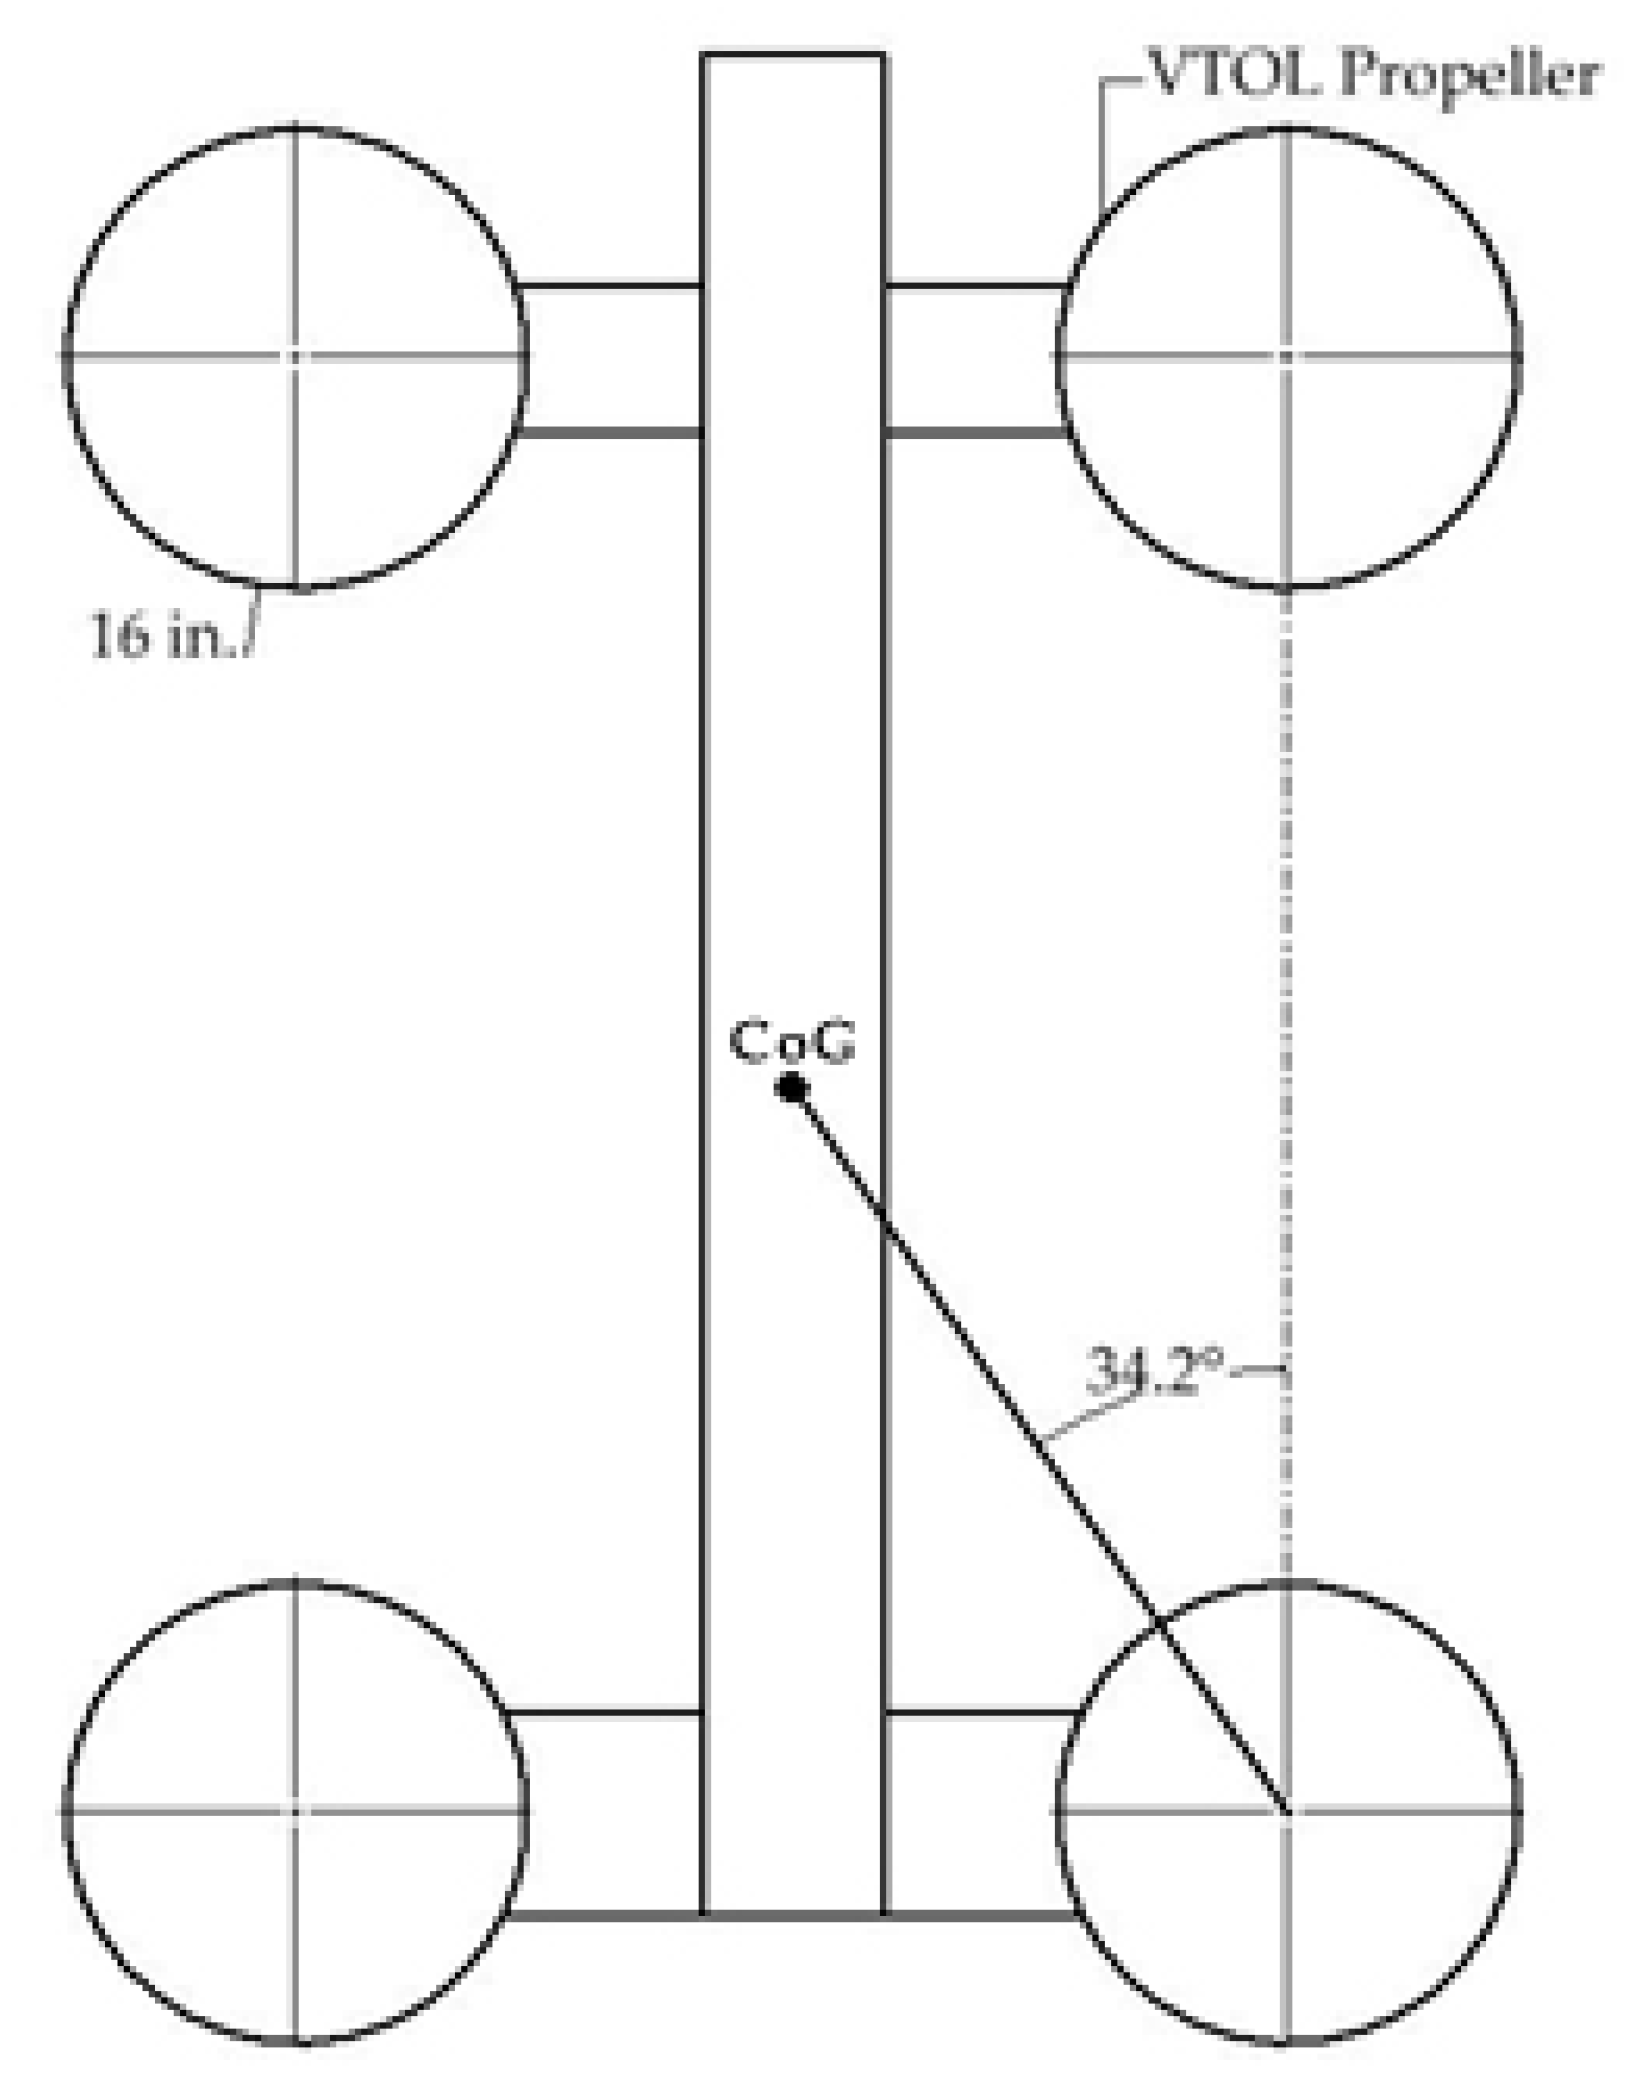
The VTOL arm design determines the position of the VTOL motors. The VTOL motors used were Brushless DC Motors 490KV with 16-inch propellers, so the arms were designed with enough clearance so the propellers would not hit the fuselage. The stability of the VTOL plane was the next consideration, as it is affected by the motors’ position relative to the plane’s center of gravity. It was determined that the angle range should be between 30° and 60°.
Figure 5 schematically shows the position of the VTOL motor.
2.4.3. Empennage Detailed Design
In a twin-tail boom configuration, the tail boom is an extension of the VTOL arm. As such, the horizontal stabilizer span is constrained. NACA 0006 was chosen for the empennage airfoil as it has zero C
L at 0° angle of attack [
28]. Using equations provided by [
20], the necessary values and dimensions to design the empennage were calculated, such as the vertical tail volume coefficient (V
v), the horizontal tail volume coefficient (V
h), the vertical tail moment arm (L
v), and the horizontal tail moment arm (L
v). The tail moment arm is the distance from 25% wing mean aerodynamic chord (MAC) to 25% tail mean aerodynamic chord (MAC).
Table 6 shows the results of the empennage design calculations.
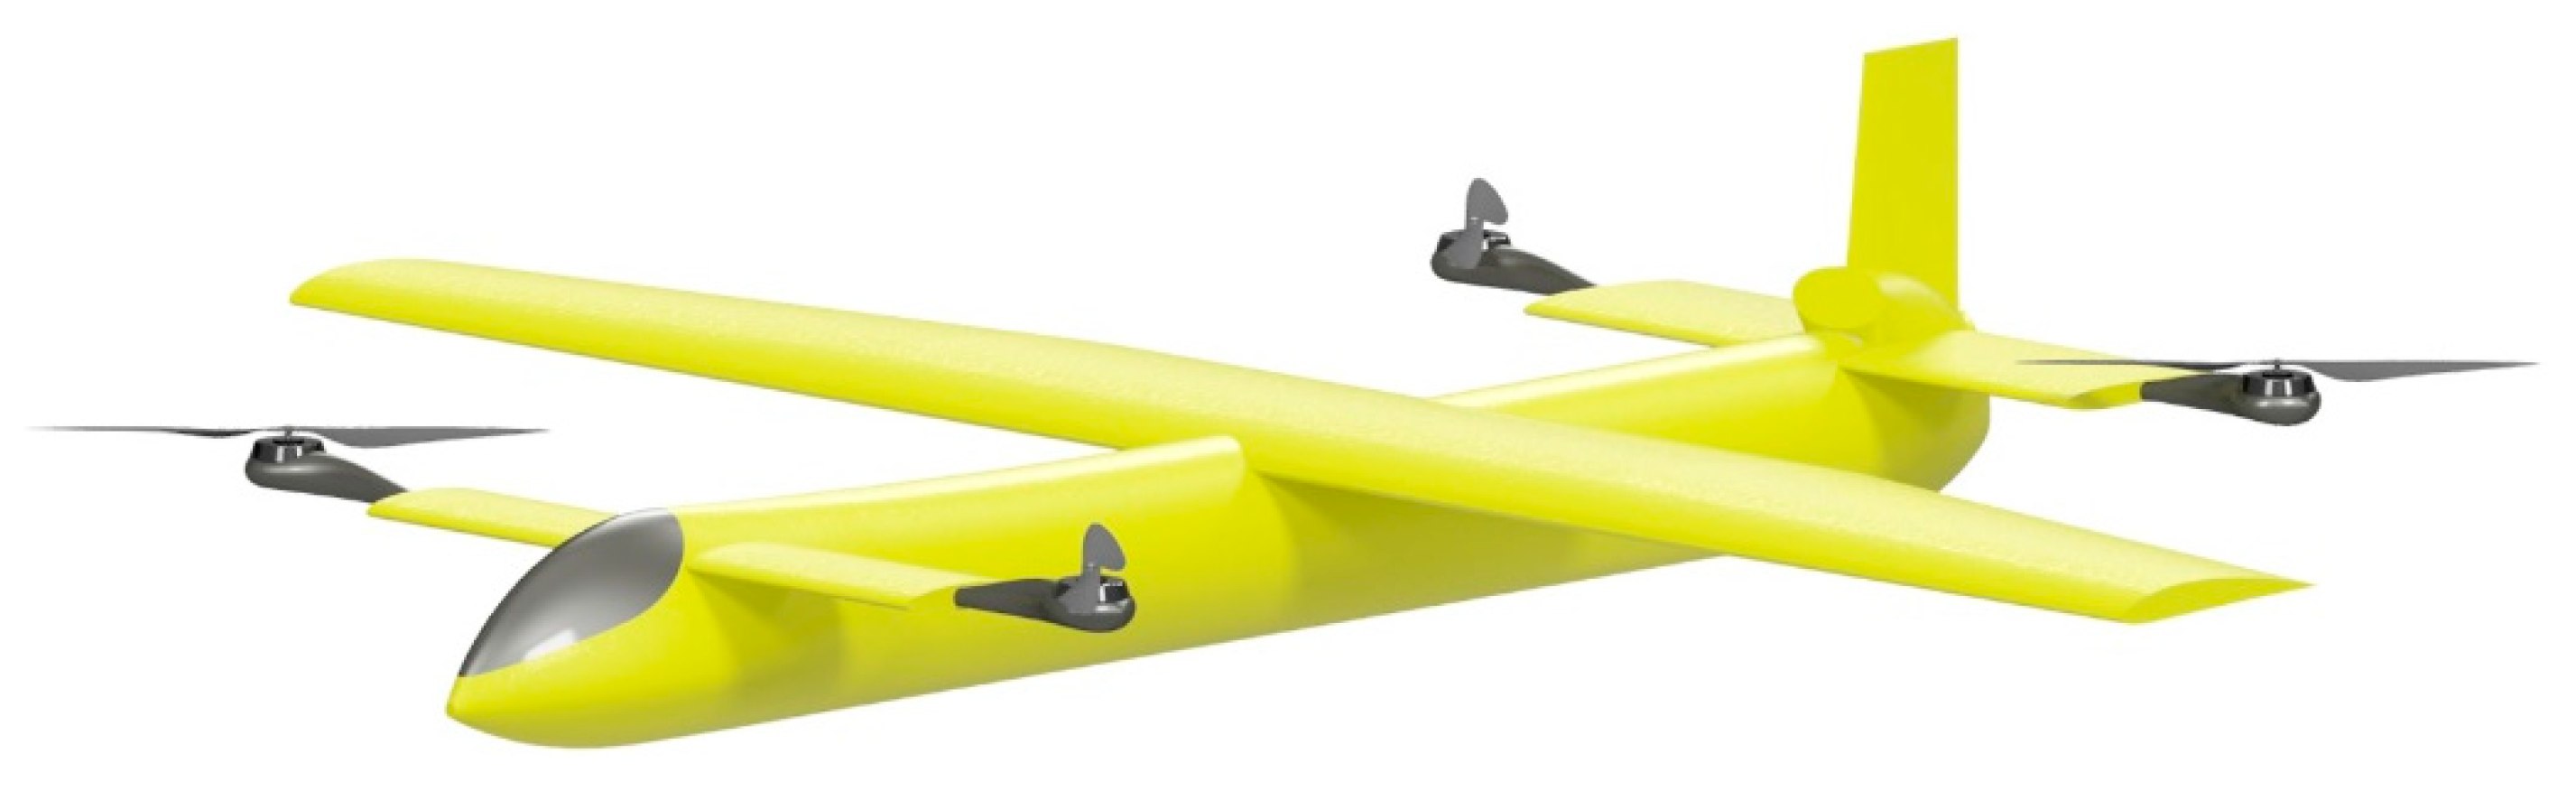
2.4.4. Twin-Tail Boom Final Design
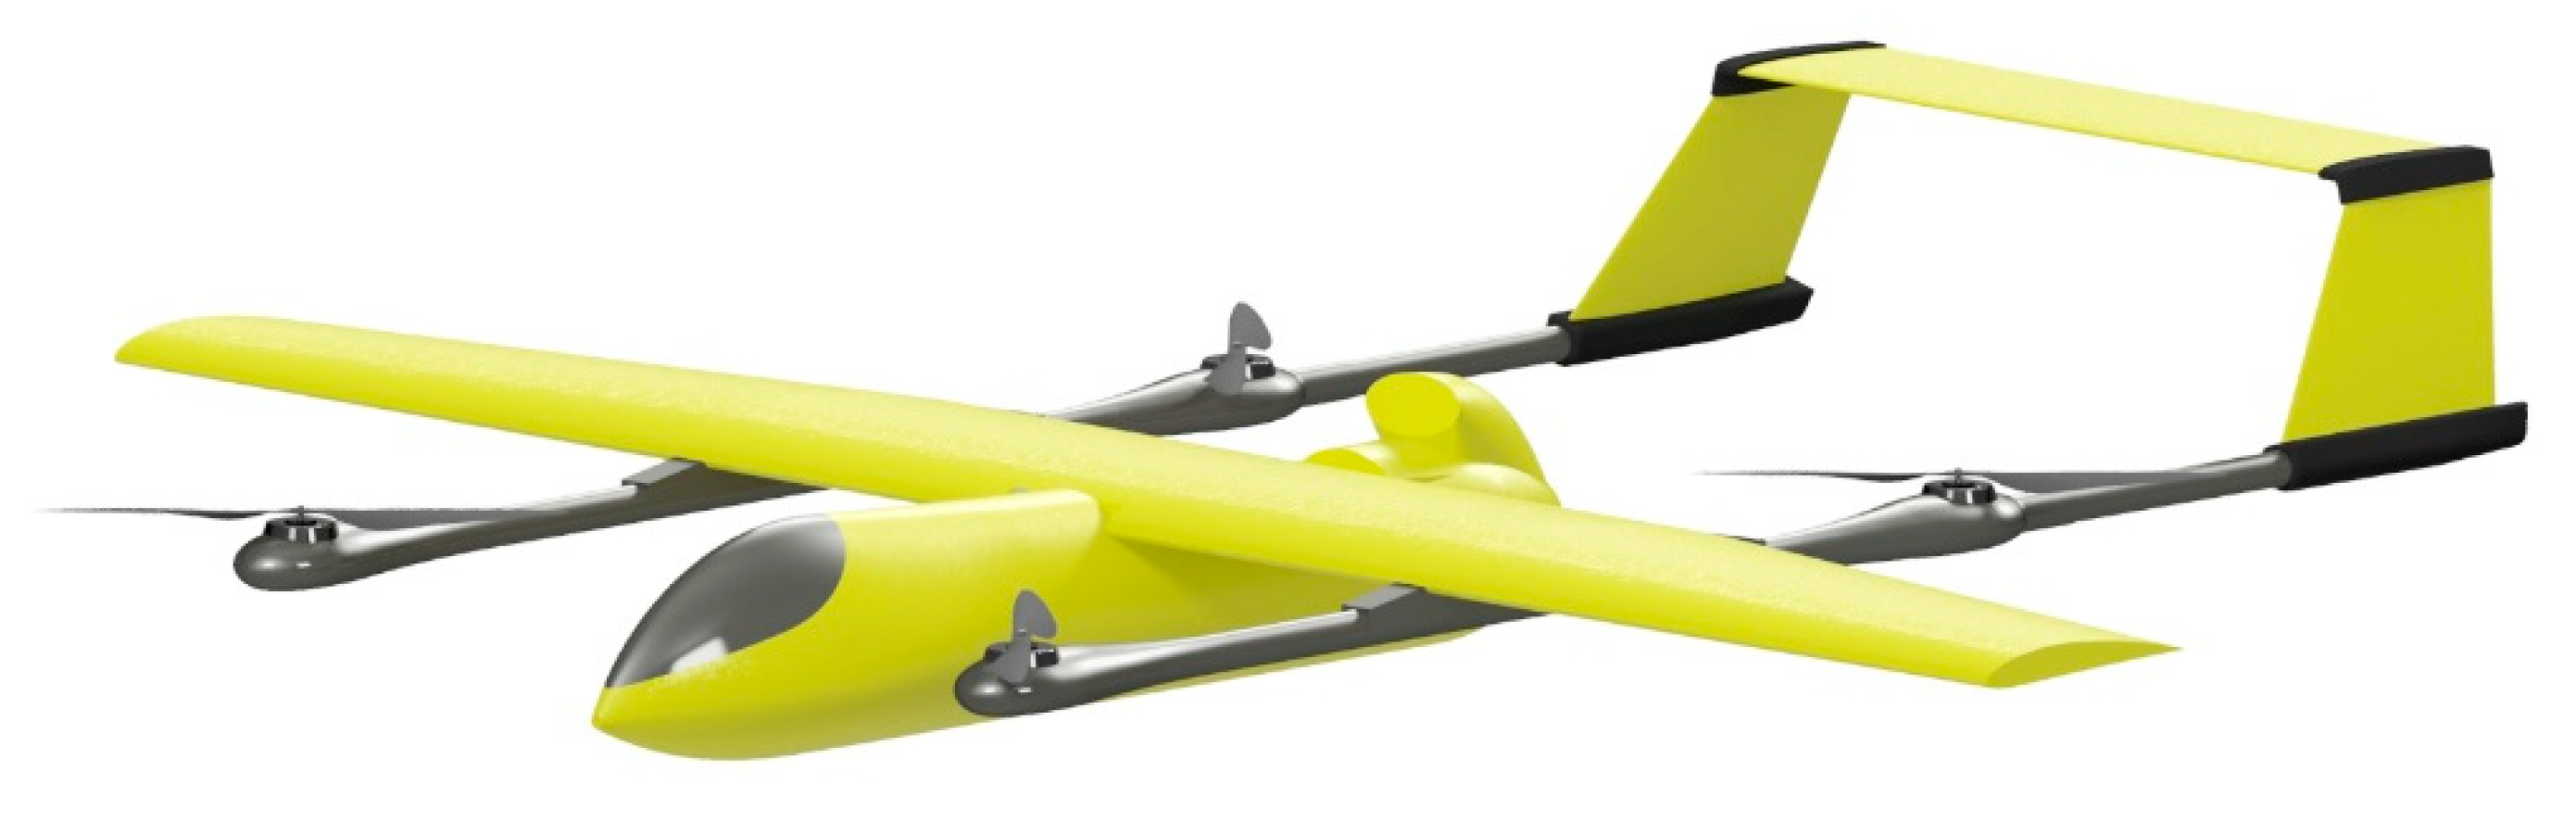
After all the size data had been obtained, a three-dimensional model was created. The model was created using Autodesk Inventor Professional 2022 software.
Figure 6 shows a three-dimensional model of the VTOL plane with a twin-tail boom configuration.
2.5. Conversion to Other Configurations
The twin-tail boom design acted as a reference for other configurations, namely the quad-plane, the tandem wing, and the transverse arm.
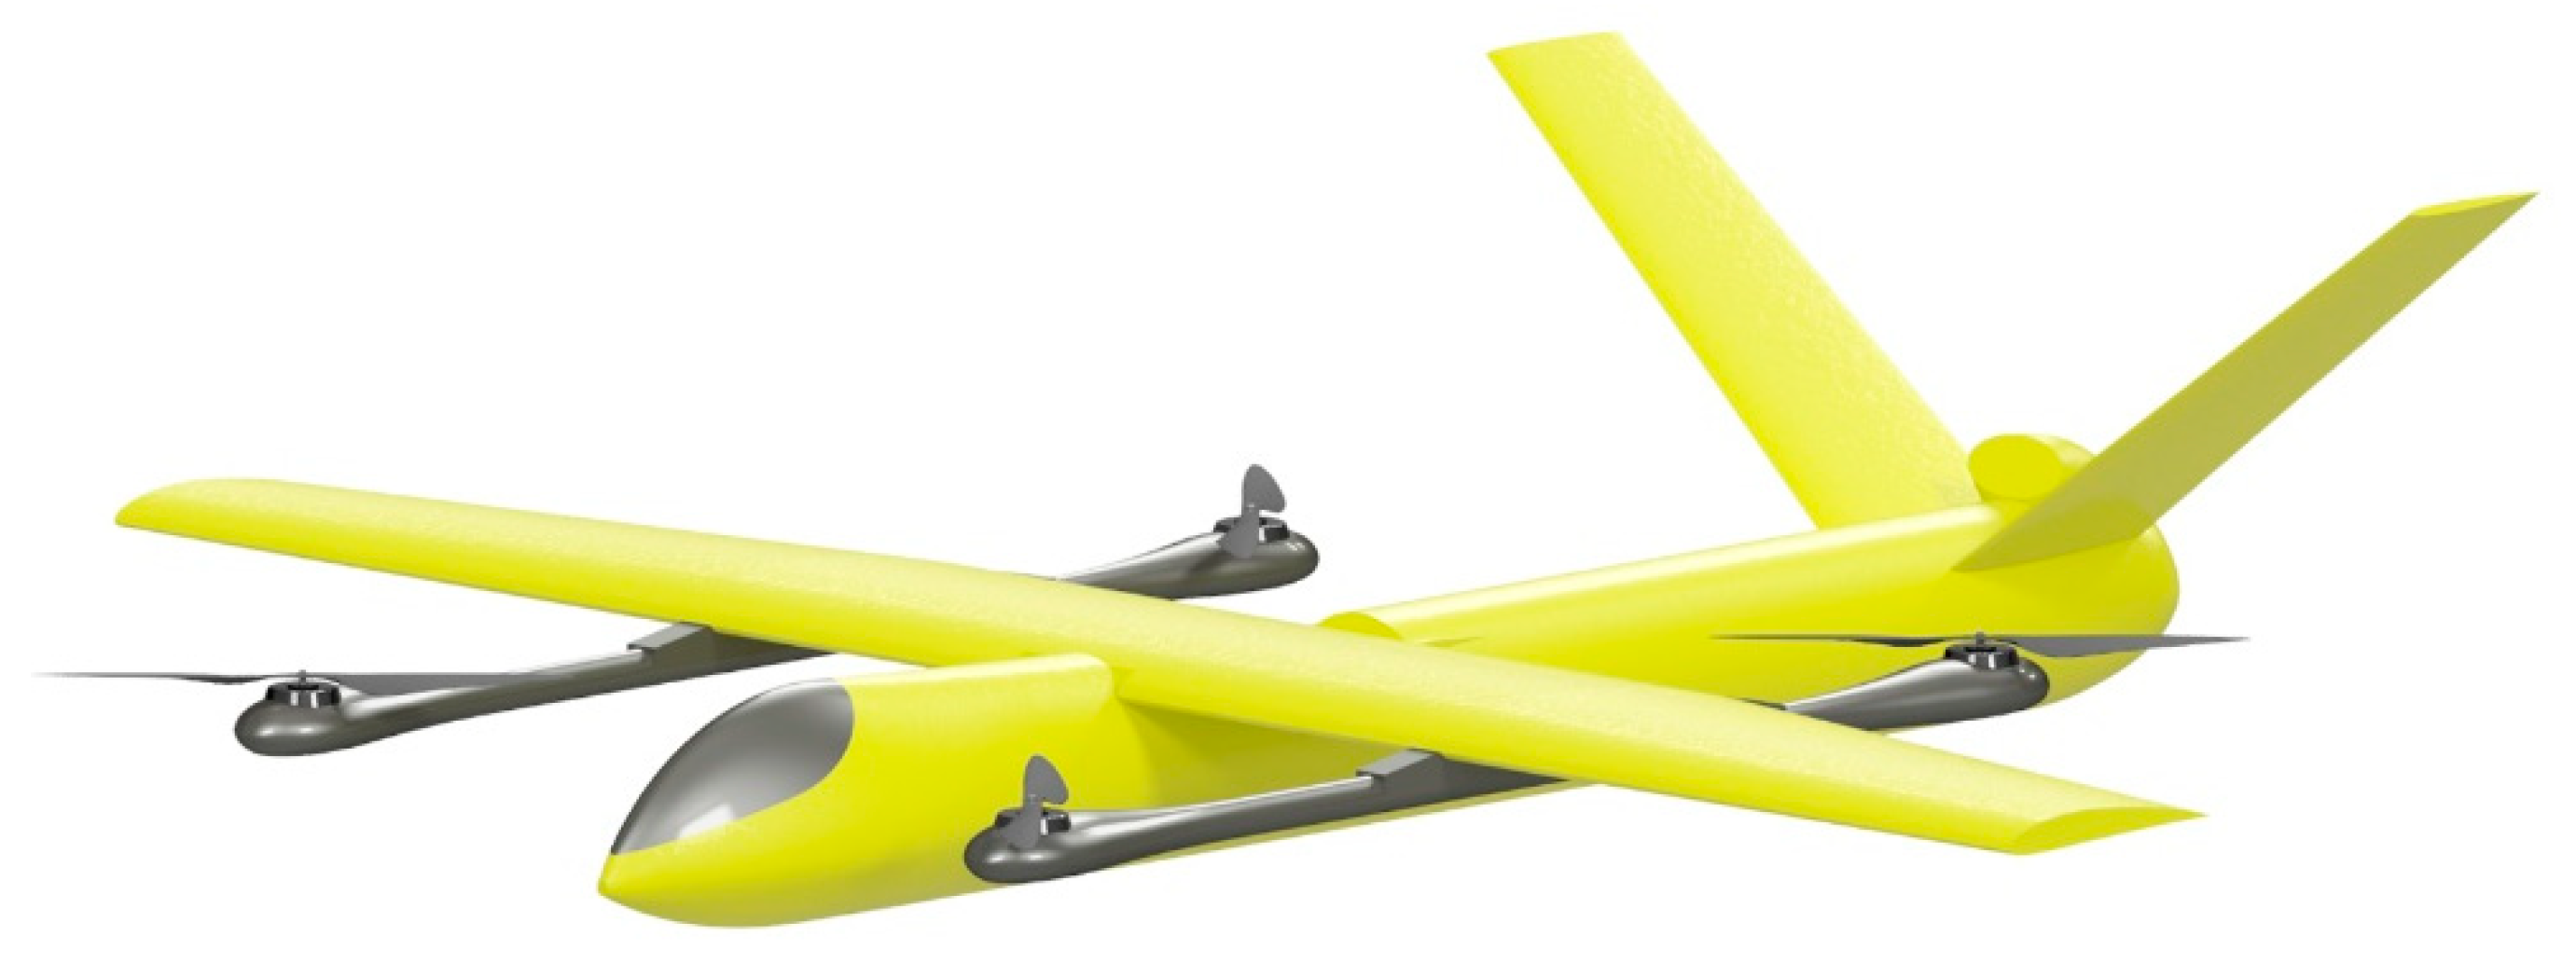
2.5.1. Quad-Plane Design
The difference between the twin-tail boom and the quad-plane configuration is mainly in the empennage configuration. V-tail was selected as the empennage configuration for the quad-plane design. The V-tail was found to be a stable configuration in crosswind conditions [
28]. The fuselage was extended to the V-tail as the tails needed to be mounted on it. The V-tail geometry used the same V
v, V
h, L
v, and L
h values as the twin-tail boom configuration. Those values were then used to determine the V-tail dimensions using the equation provided by [
20].
where Γ is the dihedral angle from the horizontal plane.
Table 7 shows the results of the V-tail geometry calculations, and
Figure 7 shows the three-dimensional model of the quad-plane configuration.
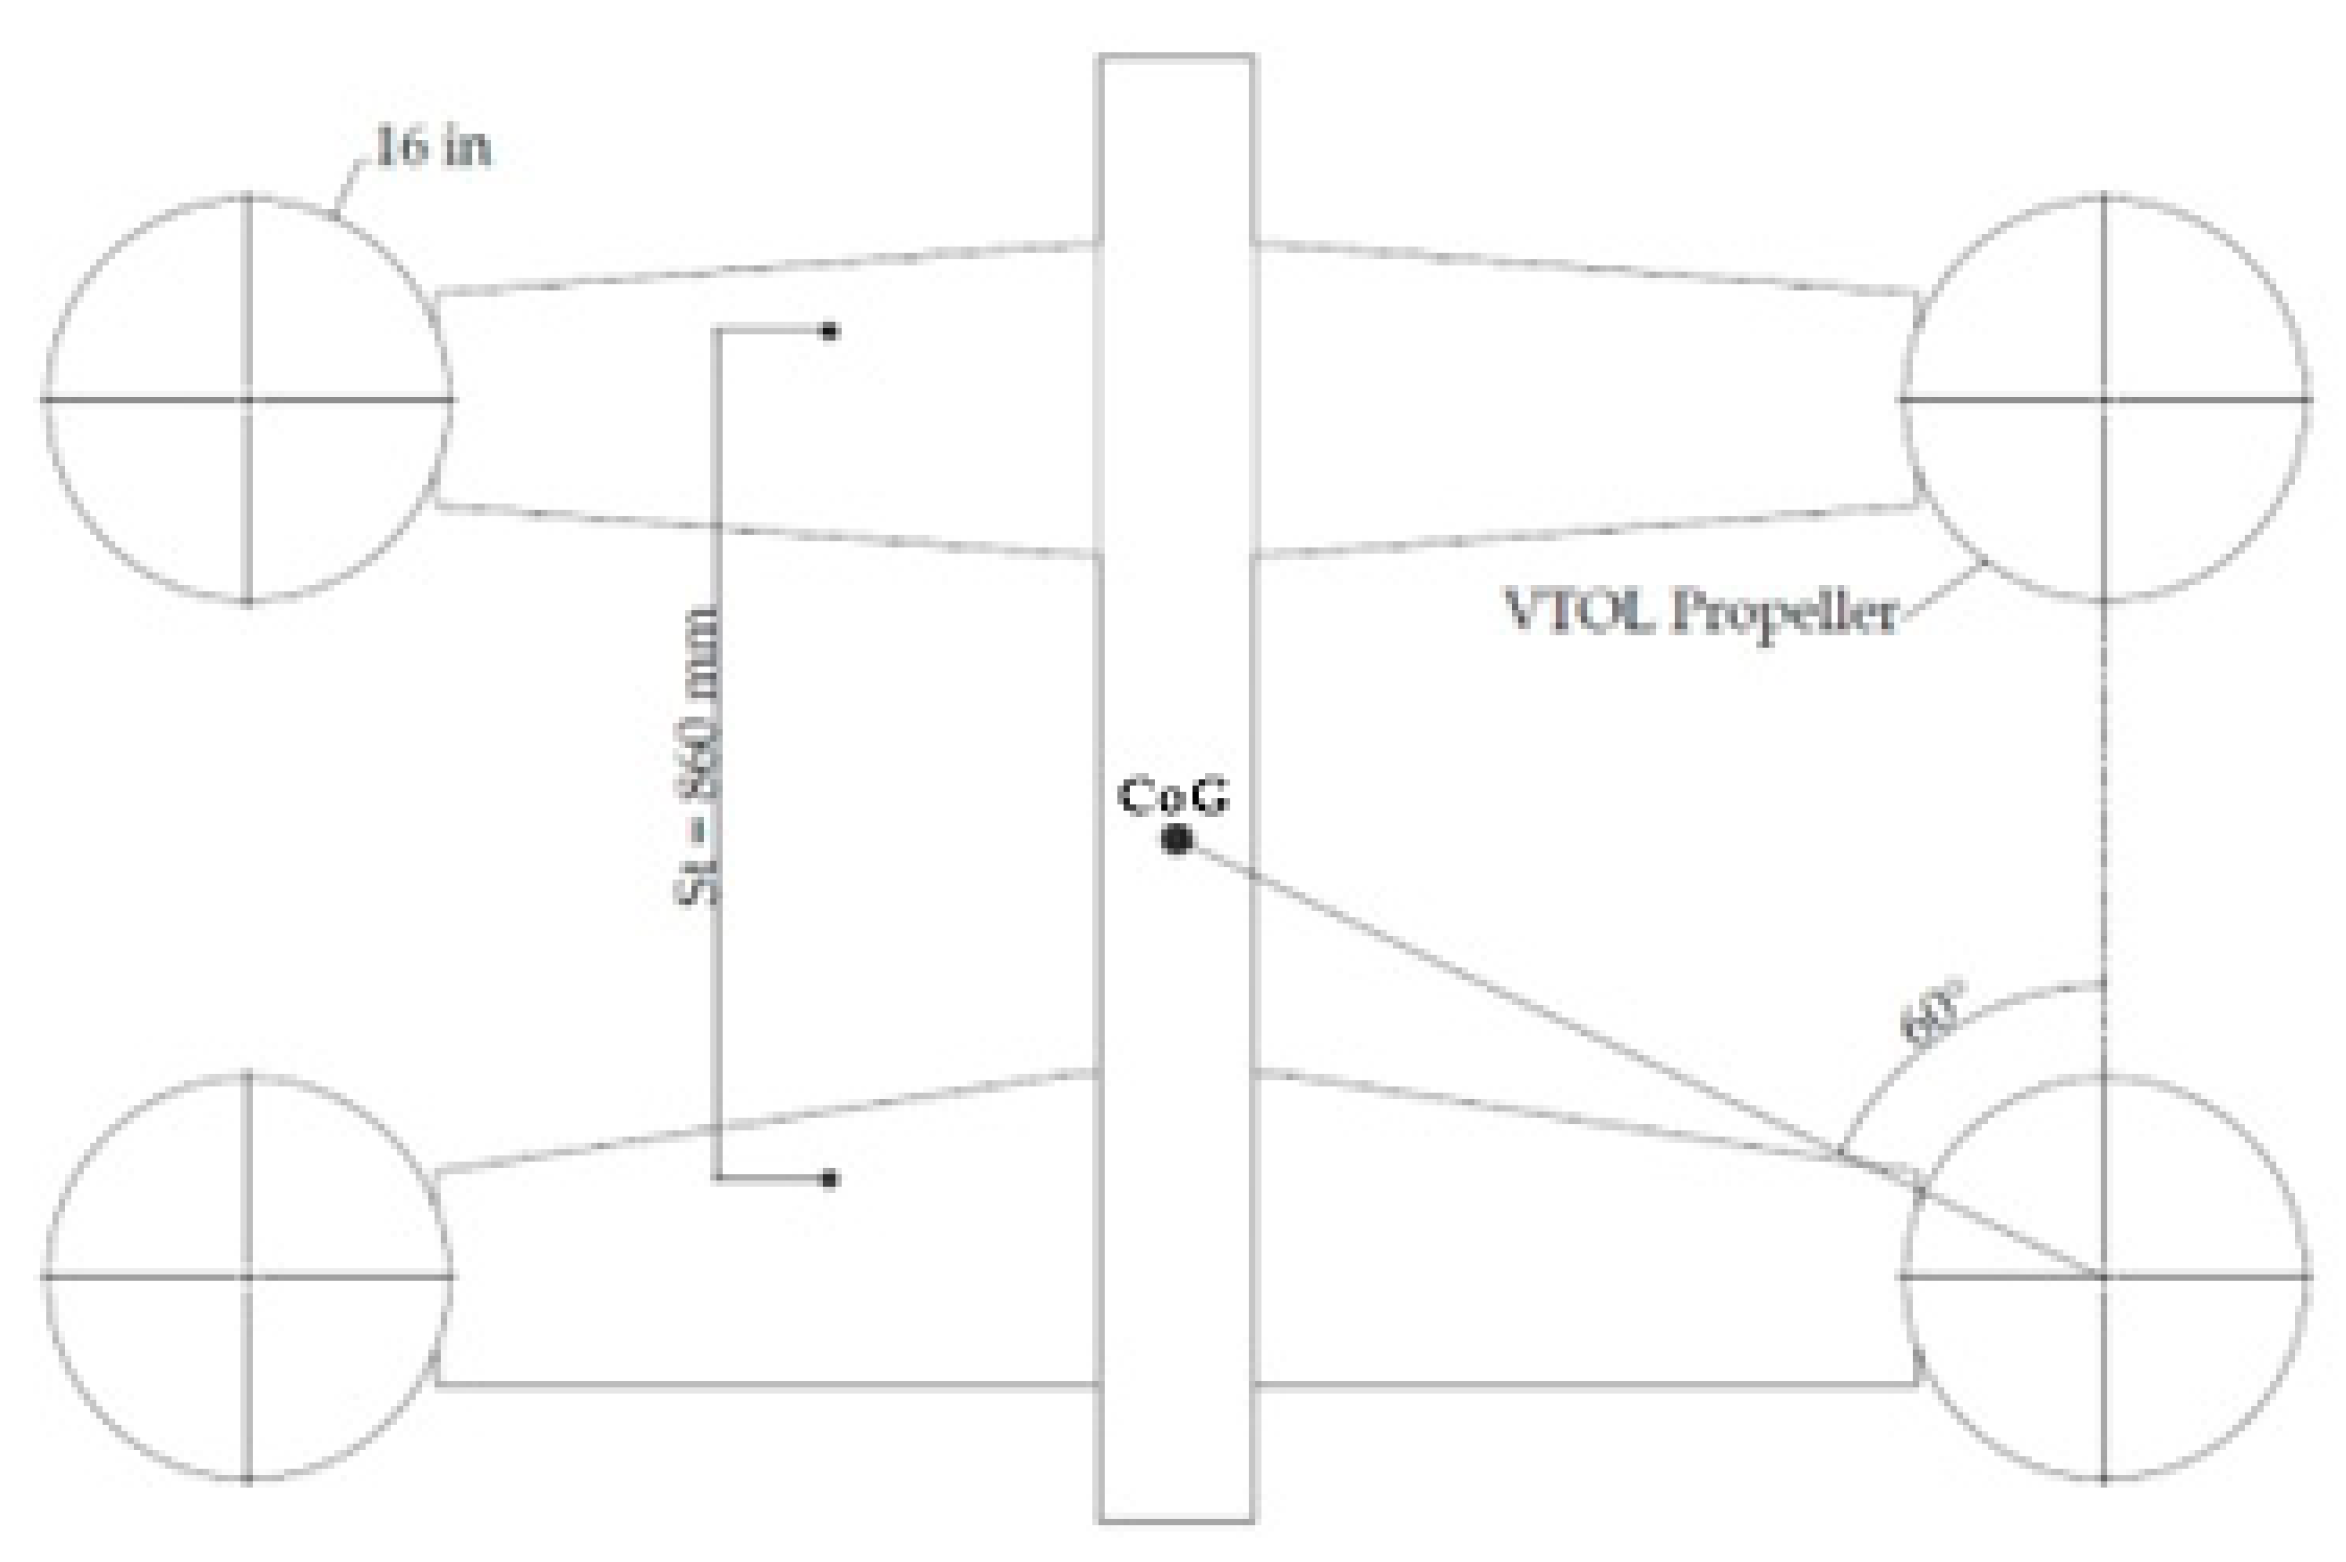
2.5.2. Tandem Wing Design
The tandem wing configuration is unlike the other configurations in several parameters. The CoG of a tandem wing is located between the fore and the hind wings, not at the wing, like a classic fixed-wing configuration. Moreover, the hind wing acts as a horizontal stabilizer and a lifting surface, causing major concerns for stability and controllability [
16]. The aerodynamic performance of the hind wing is also heavily affected by the downwash of the forewing. The effect of longitudinal and vertical gaps between the two wings was reported in [
29].
Creating a gap vertically would mean creating a gap in the vertical positions of the front and the rear VTOL motors because the motors were to be mounted at the tip of the wings. The gap would cause stability problems in the hovering phase, so no vertical gap was created between the forewing and the rear wing. Nonetheless, a bigger longitudinal gap, also called a stagger (St), was created to minimize the downwash effect, with the angle of the VTOL motors’ positions against the CoG taken into consideration. Specifically, stagger is the longitudinal distance from the 25% forewing MAC to the 25% hind wing MAC. The taper ratio of the forewing also has a significant effect on the aerodynamic performance of the hind wing [
30].
A V-tail configuration was chosen as the empennage configuration to help with the pitch stability of the VTOL plane despite the hind wing acting as a horizontal stabilizer. Nonetheless, the need for a horizontal stabilizer was diminished, and the horizontal area of the V-tail was relatively small.
Table 8 shows the tandem wing sizing.
Figure 8 shows the schematic drawing of the configuration, and
Figure 9 shows a three-dimensional model of the tandem wing configuration.
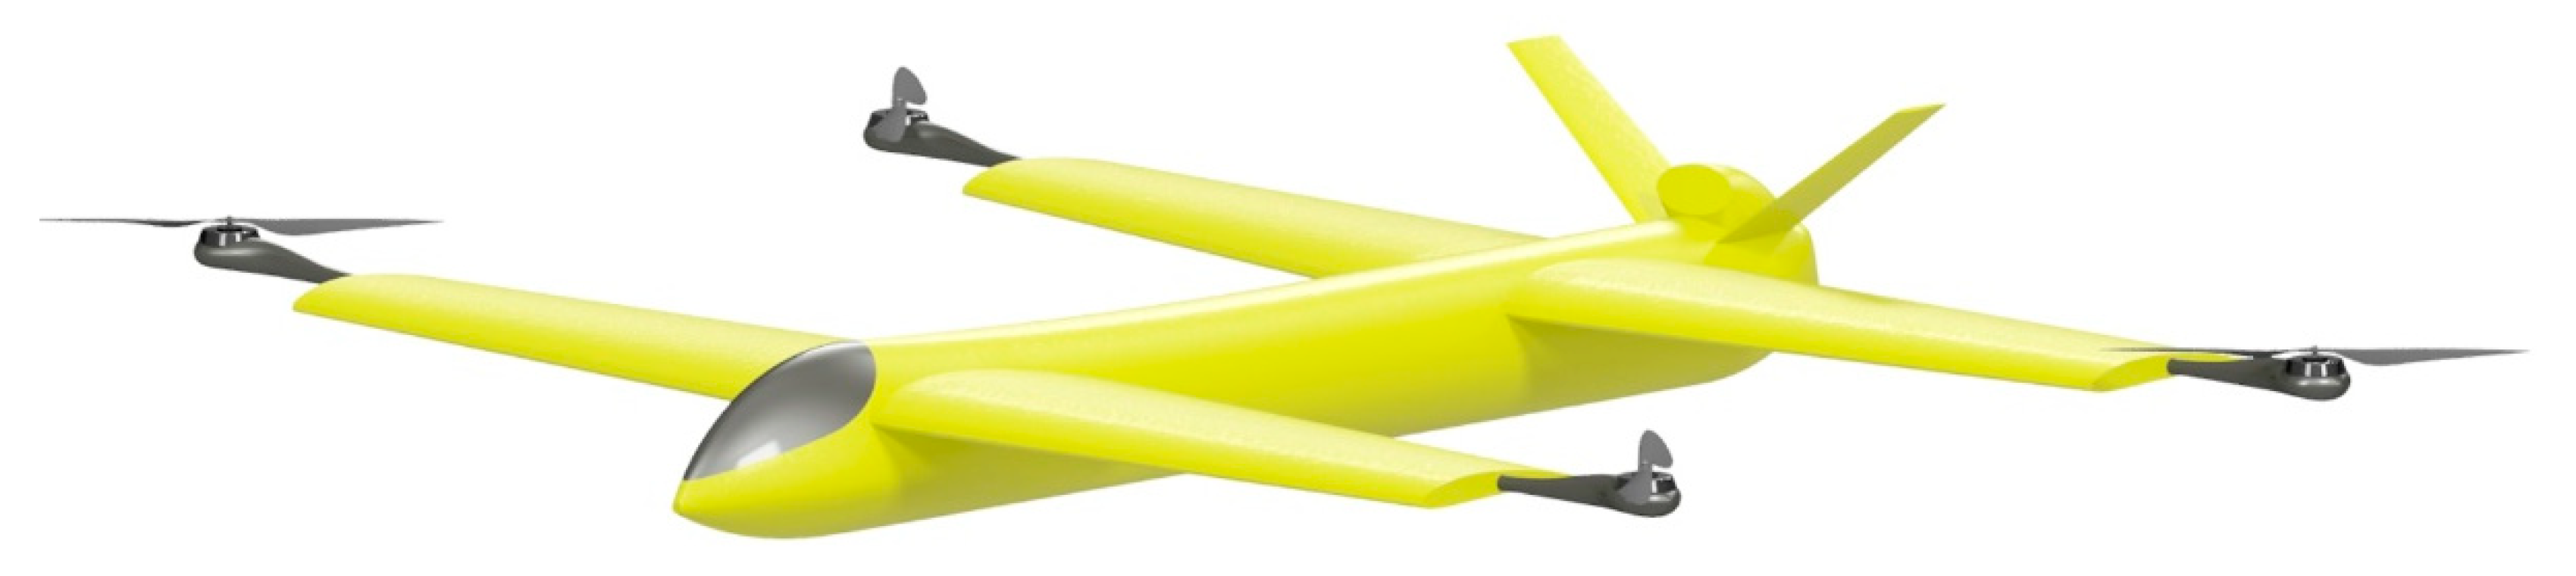
2.5.3. Transverse Arm Design
In the transverse arm configuration, there are two horizontal stabilizers, a canard, and a horizontal tailplane. This configuration is also known as a three-surface aircraft. The VTOL motors were to be mounted at the tip of the horizontal stabilizers. The parameters needed to be calculated to make the conversion were the tailplane geometry and the VTOL motors’ position.
Table 9 shows the results of the tailplane sizing.
Figure 10 shows a schematic drawing of the configuration and
Figure 11 shows a three-dimensional model.
2.6. CFD Simulation
A CFD simulation was run after all the configurations had been designed to determine the parameters needed to compare the aerodynamic performances of the configurations. The parameters sought were the coefficient of lift (C
L), the coefficient of drag (C
D), the lift-to-drag ratio (L/D), the stall speed, the coefficient of pitch moment (C
p), the coefficient of roll moment (C
r), the coefficient of yaw moment (C
y), and the turn radius (r). the parameters for lift, drag, stall conditions, efficiency, and stability could be obtained using equations provided by [
31].
Parameters for maneuverability could be obtained by parsing the resultant force acting on the aircraft.
Figure 12 shows a free-body diagram of the aircraft. Good maneuverability means the aircraft can make a small turning radius without stalling.
2.6.1. Simulation Parameters
In this study, various flight conditions were simulated. The sideslip angle variations were 0°, 15°, and 30° to simulate headwind and crosswind conditions. The angle of attack also varied between 0° and 24° with an interval of 4° for the headwind condition, and between 0° and 15° with an interval of 5° for crosswind conditions. The bank angle simulated was varied between 0° and 40° with an interval of 10°. The wind speed was set to 23 m/s (the aircraft’s designed cruising speed) and the air density was set to 1.225 kg/m3.
2.6.2. Simulation Setup
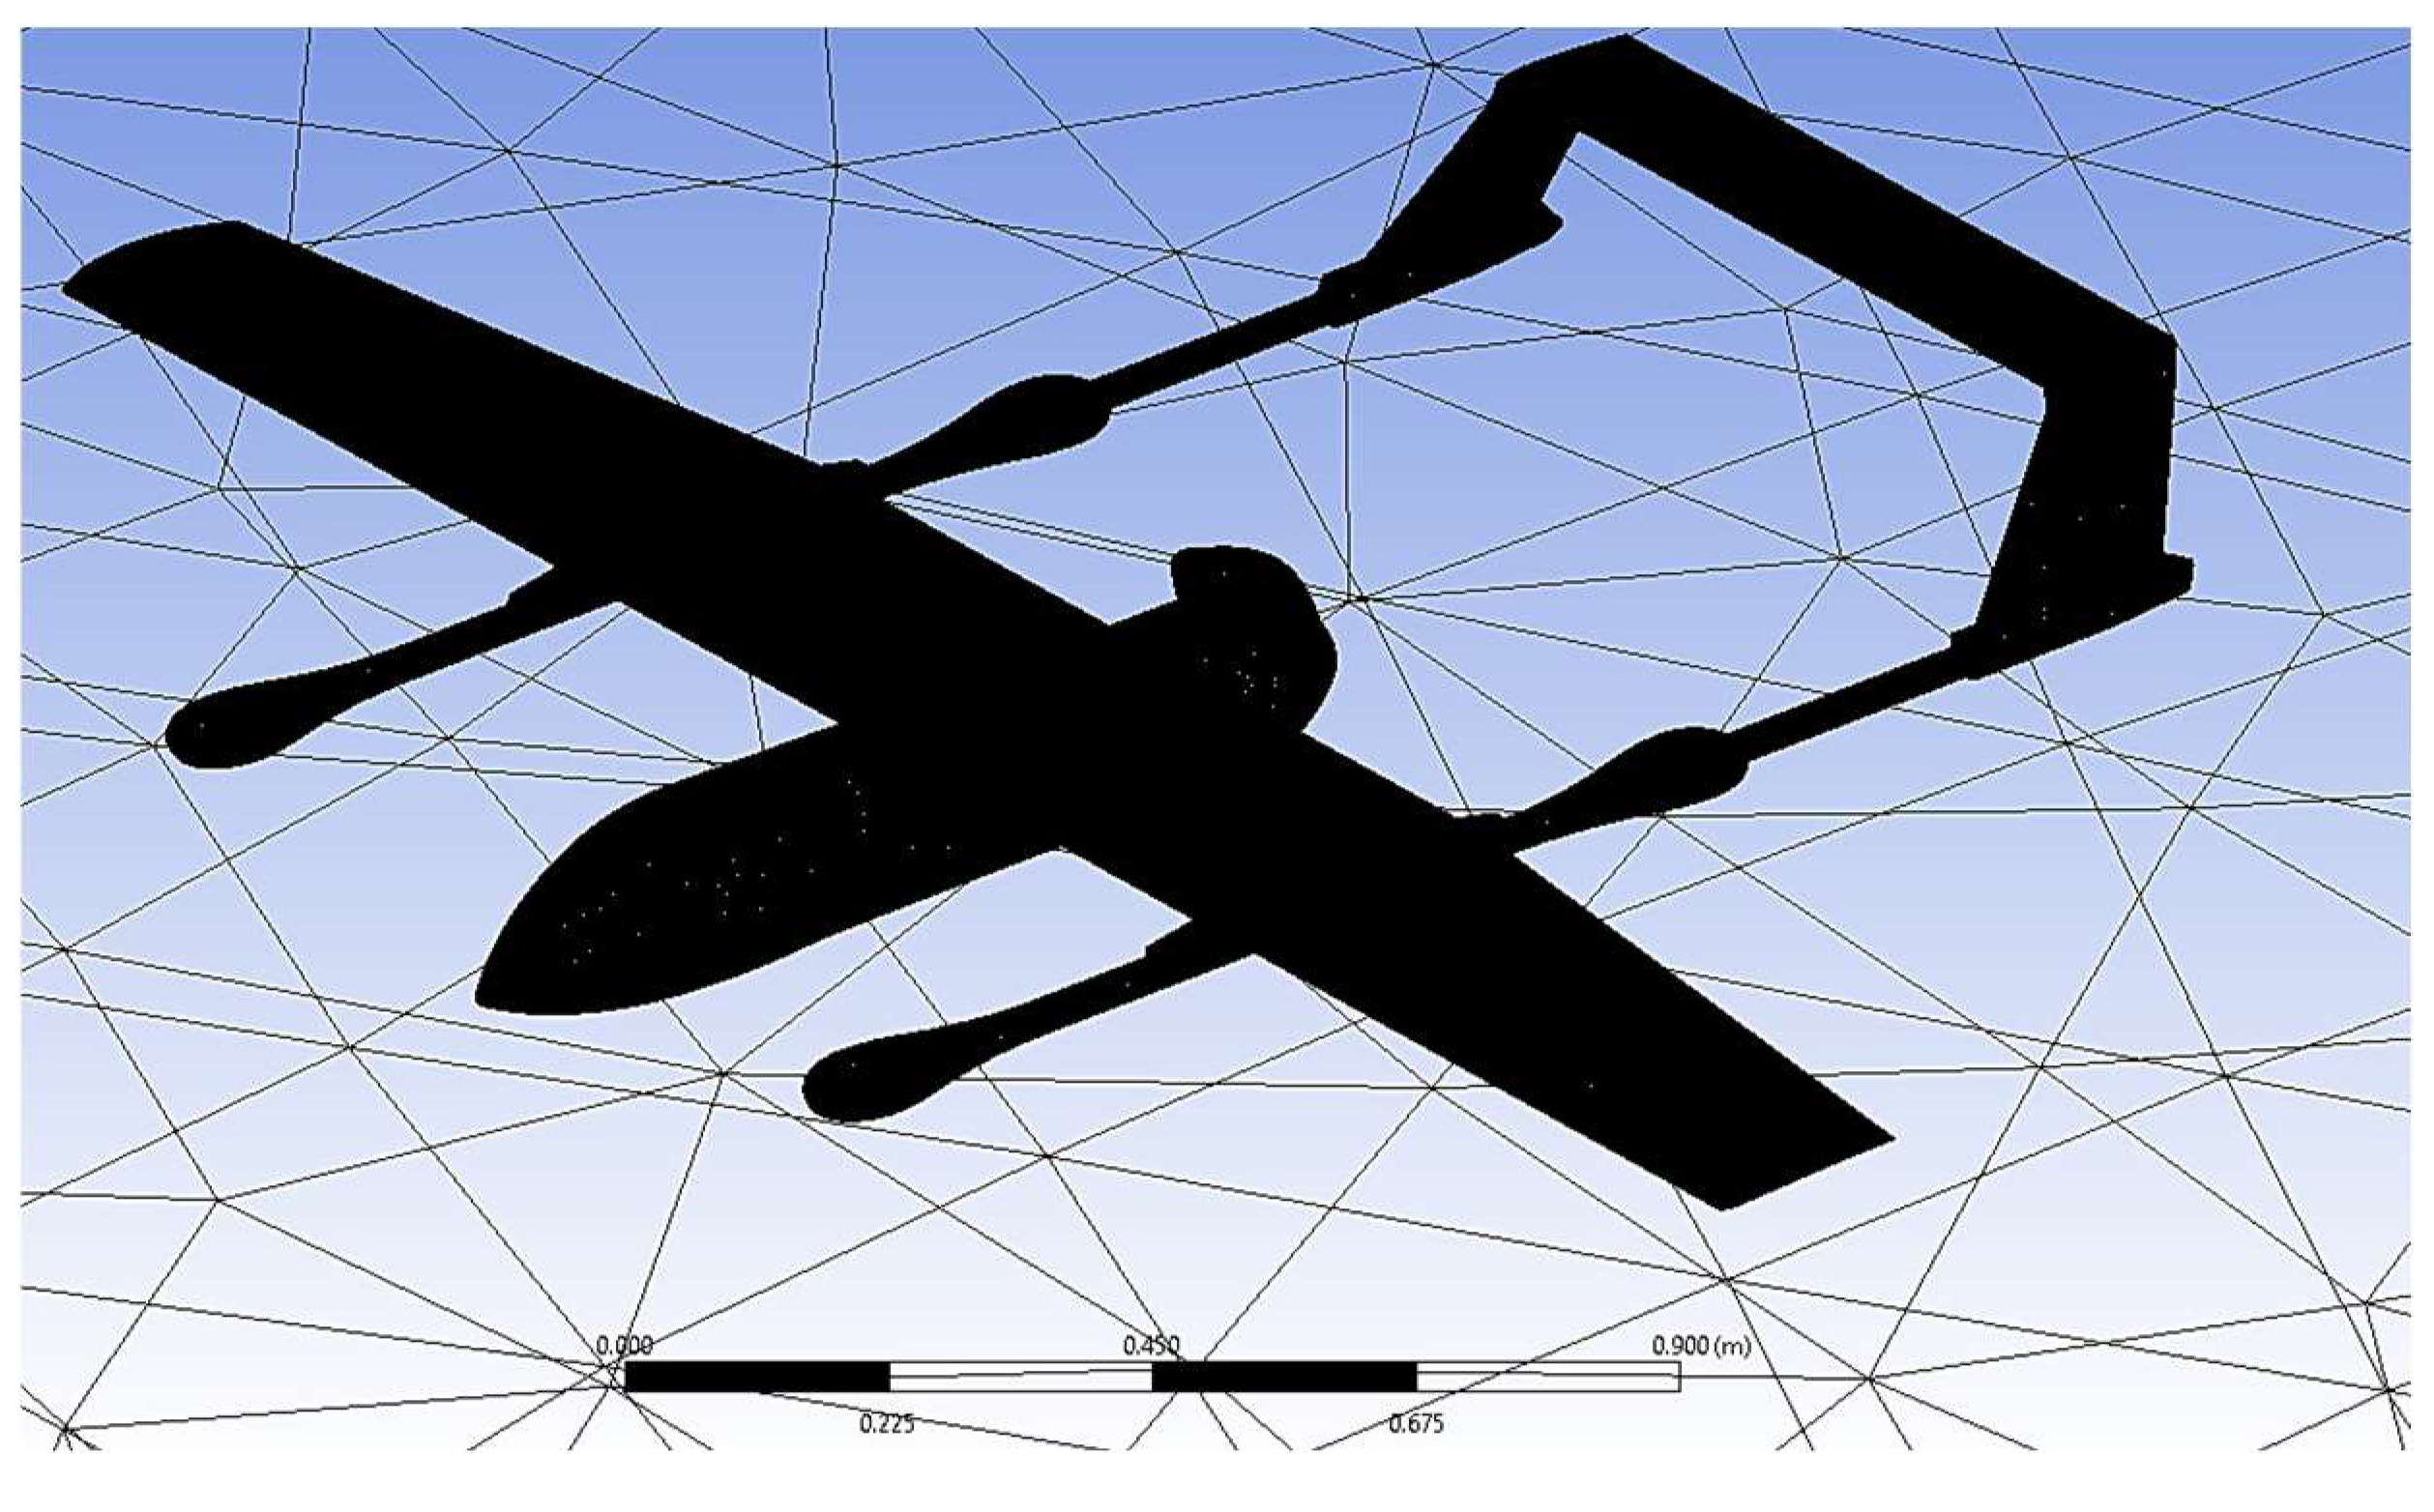
In the headwind simulations, the fluid domain of the CFD only used half of the plane to reduce processing time. Unfortunately, the crosswind simulations could not do so because of the asymmetrical airflow direction between the right side and the left side of the aircraft.
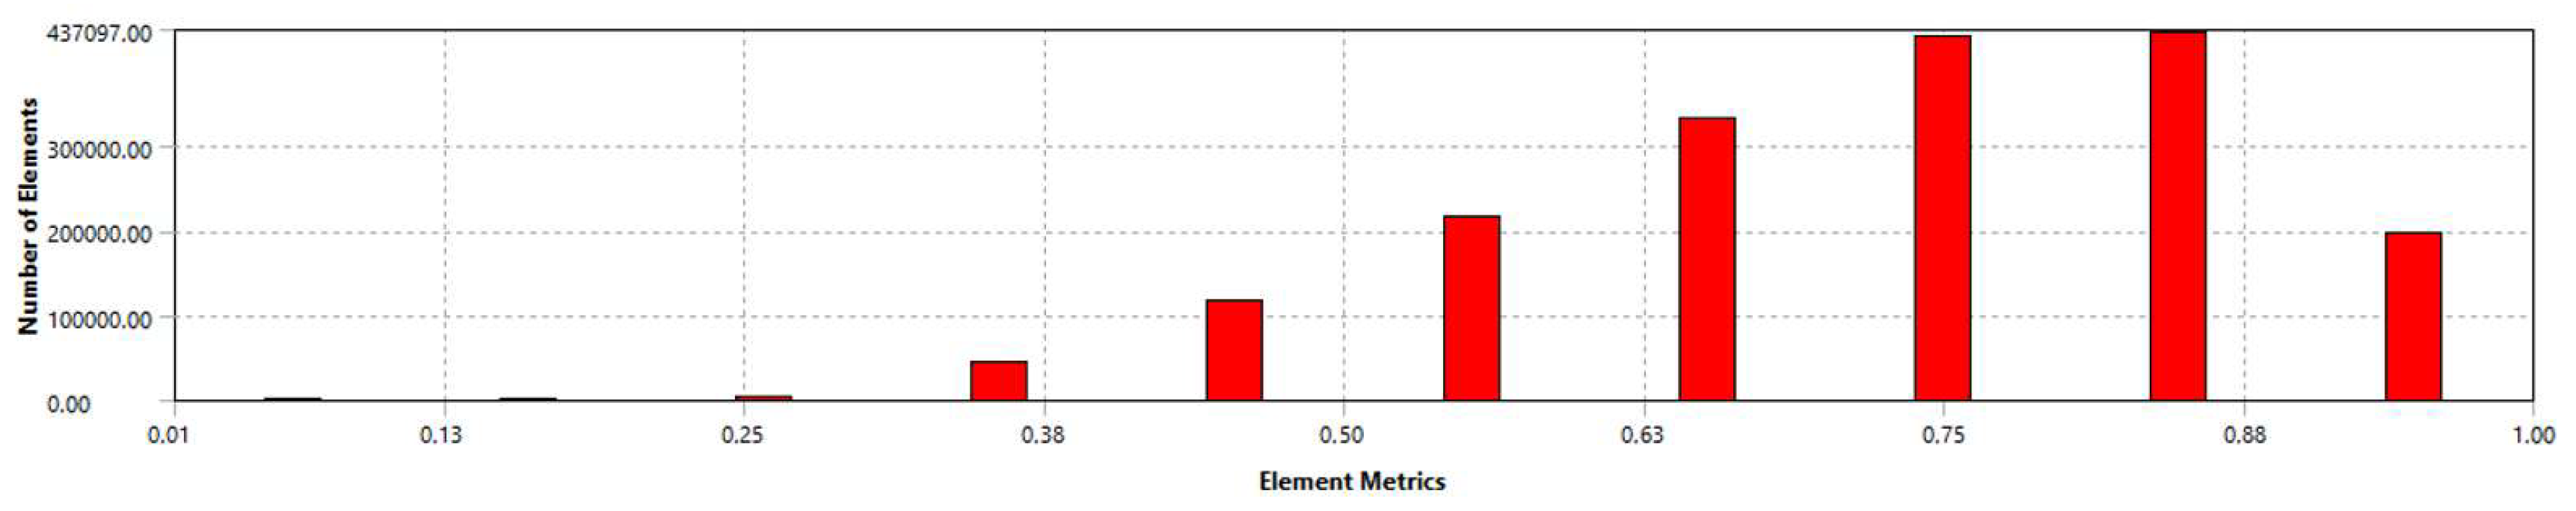
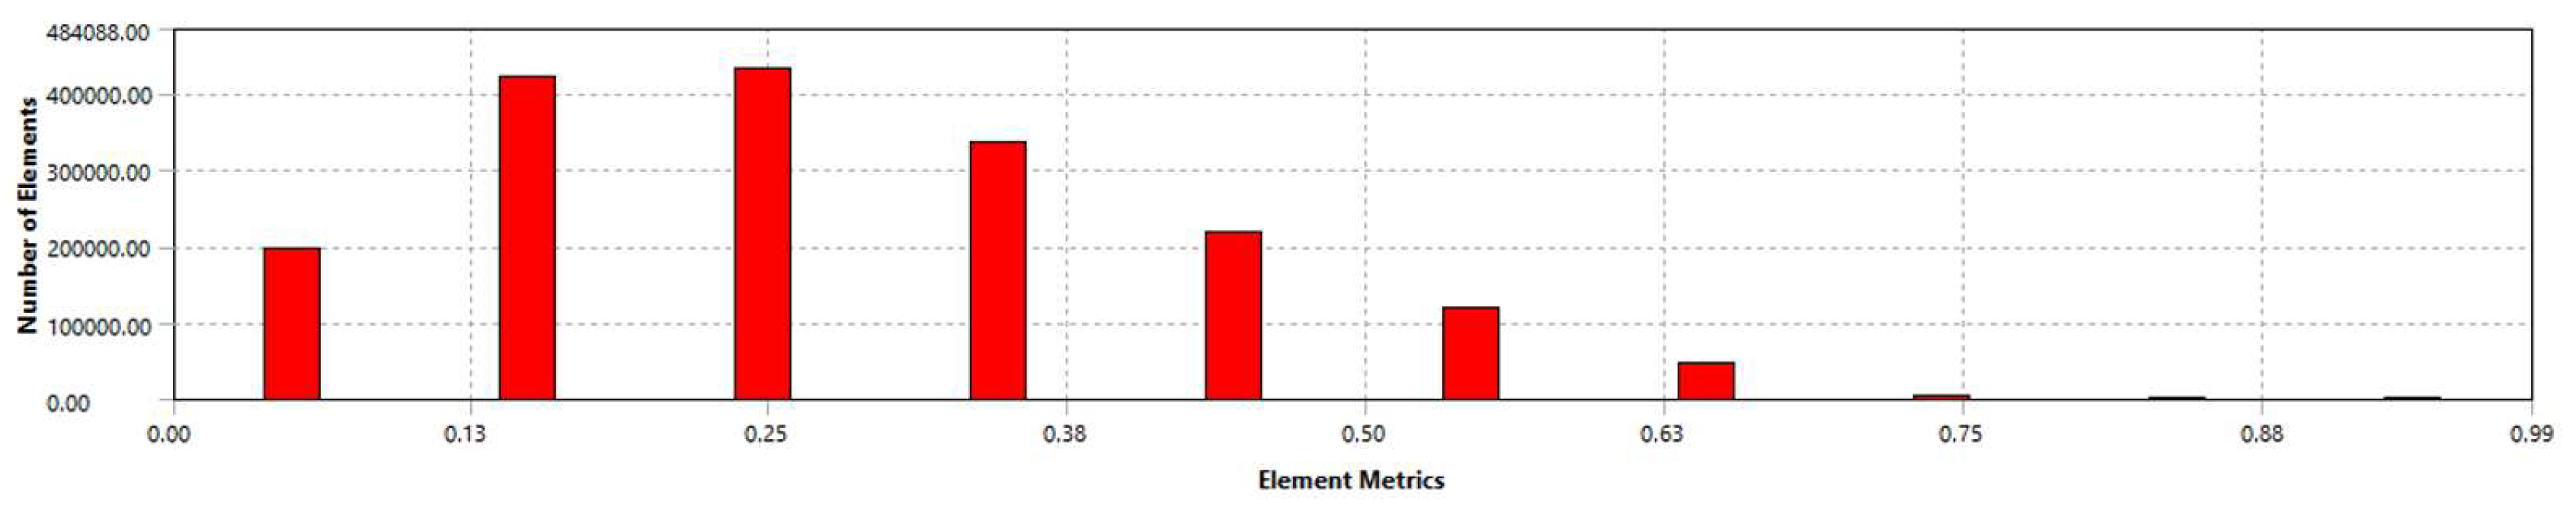
After creating the fluid domain model, the next step was to mesh the model. The global mesh size was 0.8 m. To improve accuracy, further mesh sizing was added to the domain, such as a body of influence sizing of the domain with 0.05 m. The body of influence enveloped a small area within the fluid domain, which included the aircraft. A face sizing of 0.005 m was added to the aircraft’s faces. For the simulation of the boundary layer and surrounding airflow to be accurate, inflation of an 8e-5 m thick first layer was added.
To validate the mesh quality, the orthogonal quality and skewness were checked. The average value of the orthogonal quality of the mesh was 0.74, and the average value of the skewness was 0.25. The mesh quality was considered acceptable for further simulations [
32].
Figure 13,
Figure 14 and
Figure 15 shows the results of the mesh.
A turbulent SST k-Omega was applied in this simulation. This model uses the k-Epsilon model’s advantage in simulating free-stream conditions and the k-Omega model’s advantage in simulating areas near the wall [
33]. As the simulation’s Mach number was less than 0.36, the fluid was incompressible, and the simulation was steady-state. The determined convergence criteria were
for all the residuals and the force reports.
3. Results
3.1. Lift, Drag, and Efficiency
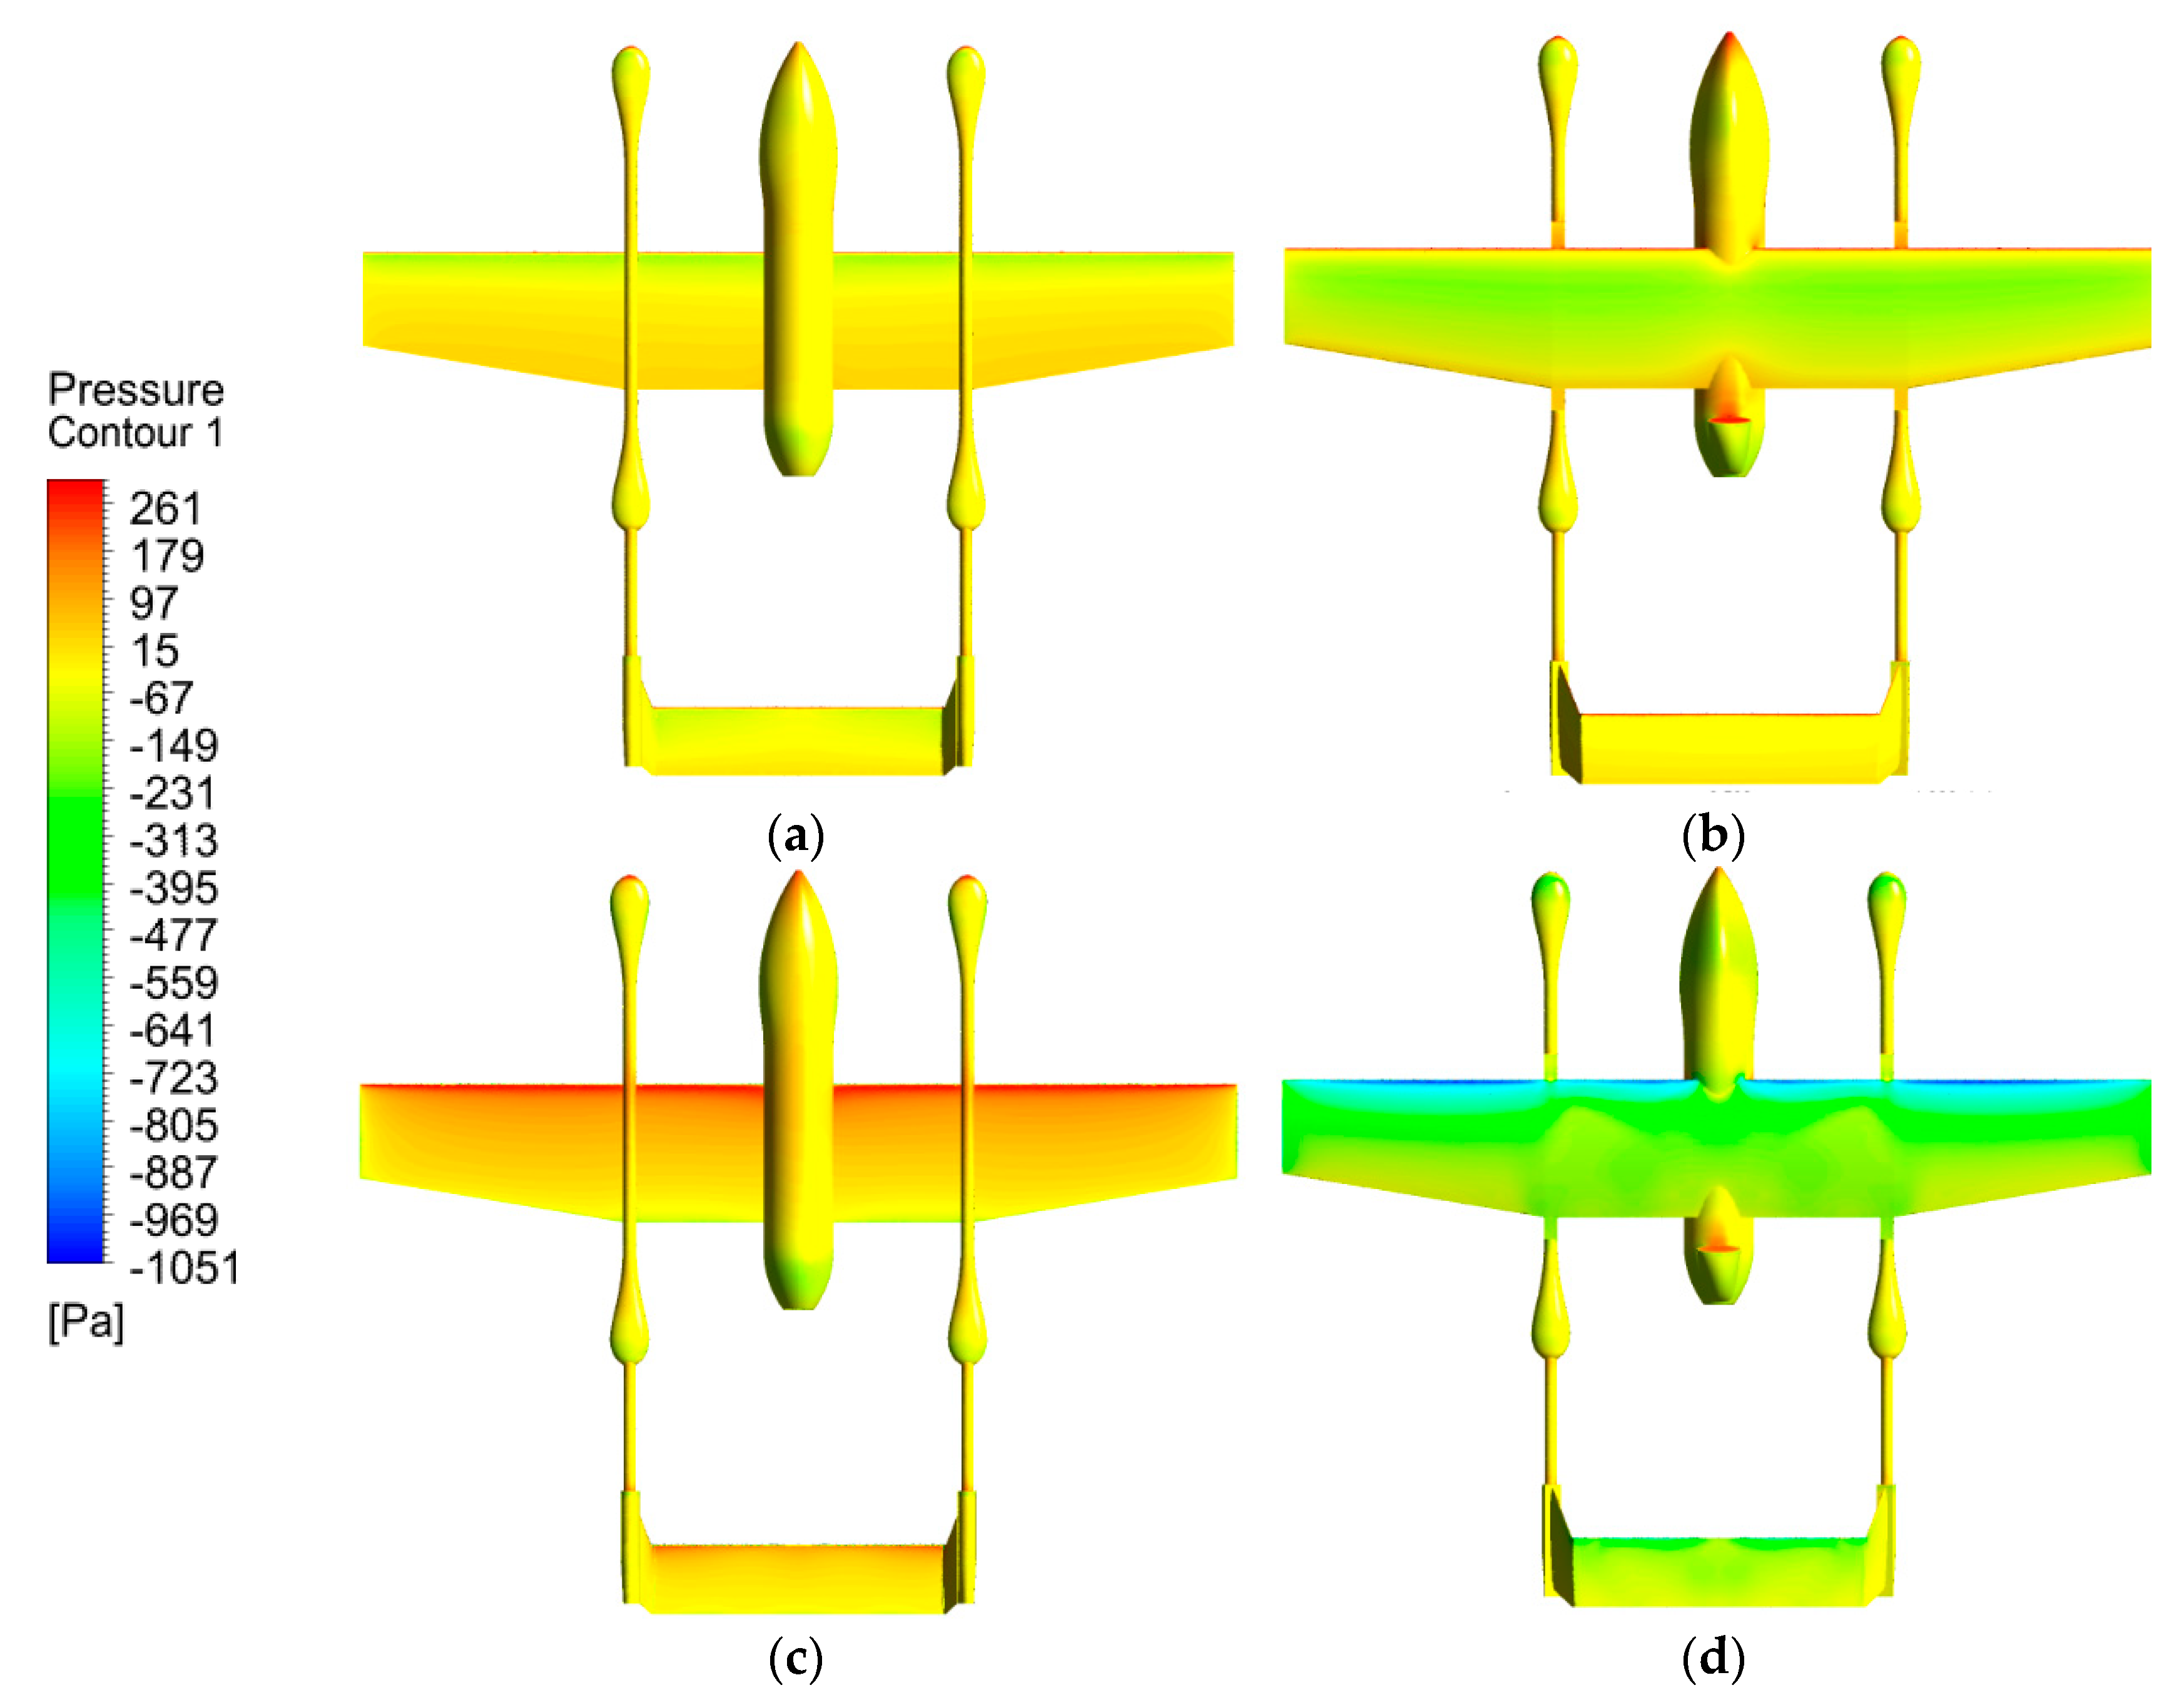
This study analyzed the performance of the lift force, drag force, and flight efficiency. The greater the angle of attack, the bigger the lifting force is. However, the drag also increases because the air encounters more surface area as the aircraft pitches up.
Figure 16 shows the pressure contour of the VTOL plane at 0° AoA and 16° AoA, which visualizes the lift and drag phenomenon. The bottom of the VTOL plane has greater pressure than the top, which generates lift. The bigger the difference between the pressure at the bottom and the top of the VTOL lane, the bigger the lift being generated, as well as the drag.
Using Equations (9) and (10), the C
L and C
D values for all configurations were obtained.
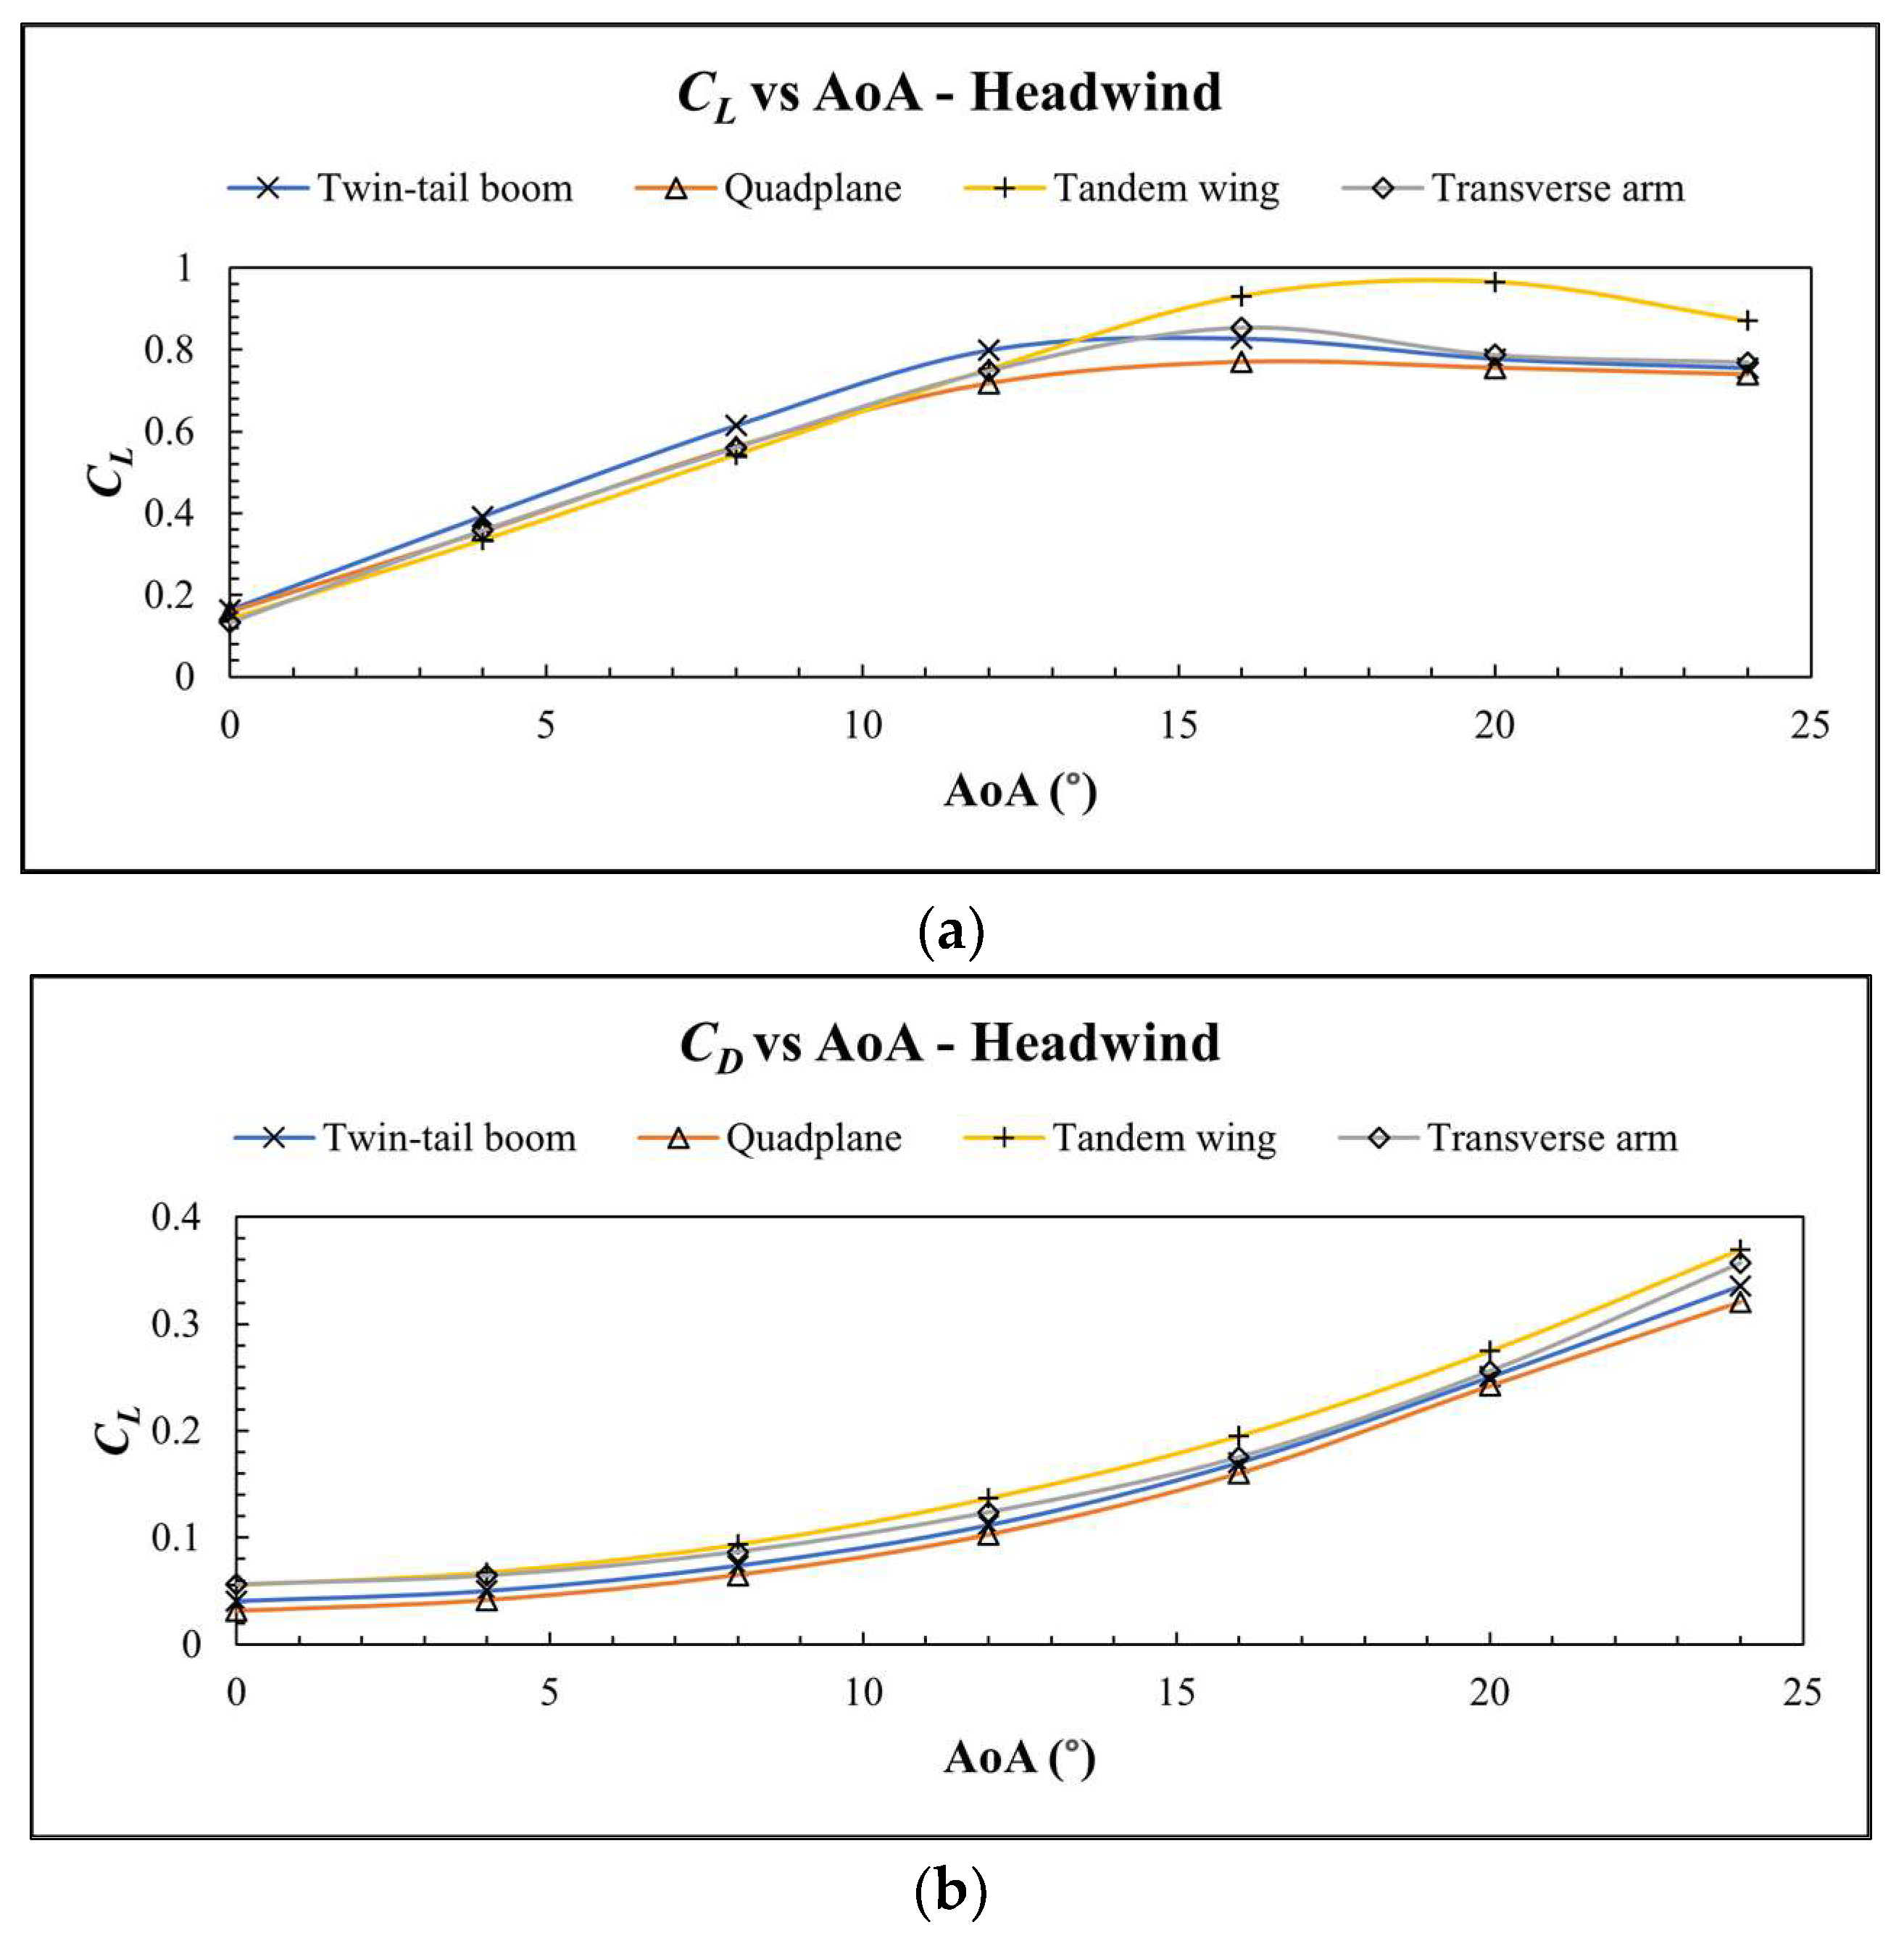
Figure 17 shows the C
L and C
D of all configurations at the simulated angles of attack in headwind conditions.
Figure 17a depicts that the C
L increases as the AoA increases, which is consistent with the prediction and the data that the pressure contours in
Figure 16 depict. With the same consistency,
Figure 17b depicts that the C
D also increases as the AoA increases.
At lower AoA, the twin-tail boom had the highest C
L, while the other three configurations did not differ significantly. However, at AoA higher than 12°, the tandem wing had the highest C
L overall. The twin-tail boom, the quad-plane, and the transverse arm configurations started to lose lifting capabilities after 16° AoA, as could be seen in
Figure 17a, where the three configurations’ C
L values started to drop. The tandem wing configuration’s C
L continued to increase and only started to drop at 20° AoA.
All four configurations’ drag did not differ significantly, although the tandem wing configuration had the highest overall CD, as predicted, due to the extra wing compared to the other configurations. The transverse arm had the second-highest overall CD because of its extra surface, the canard. Meanwhile, the quad-plane had the lowest CD overall.
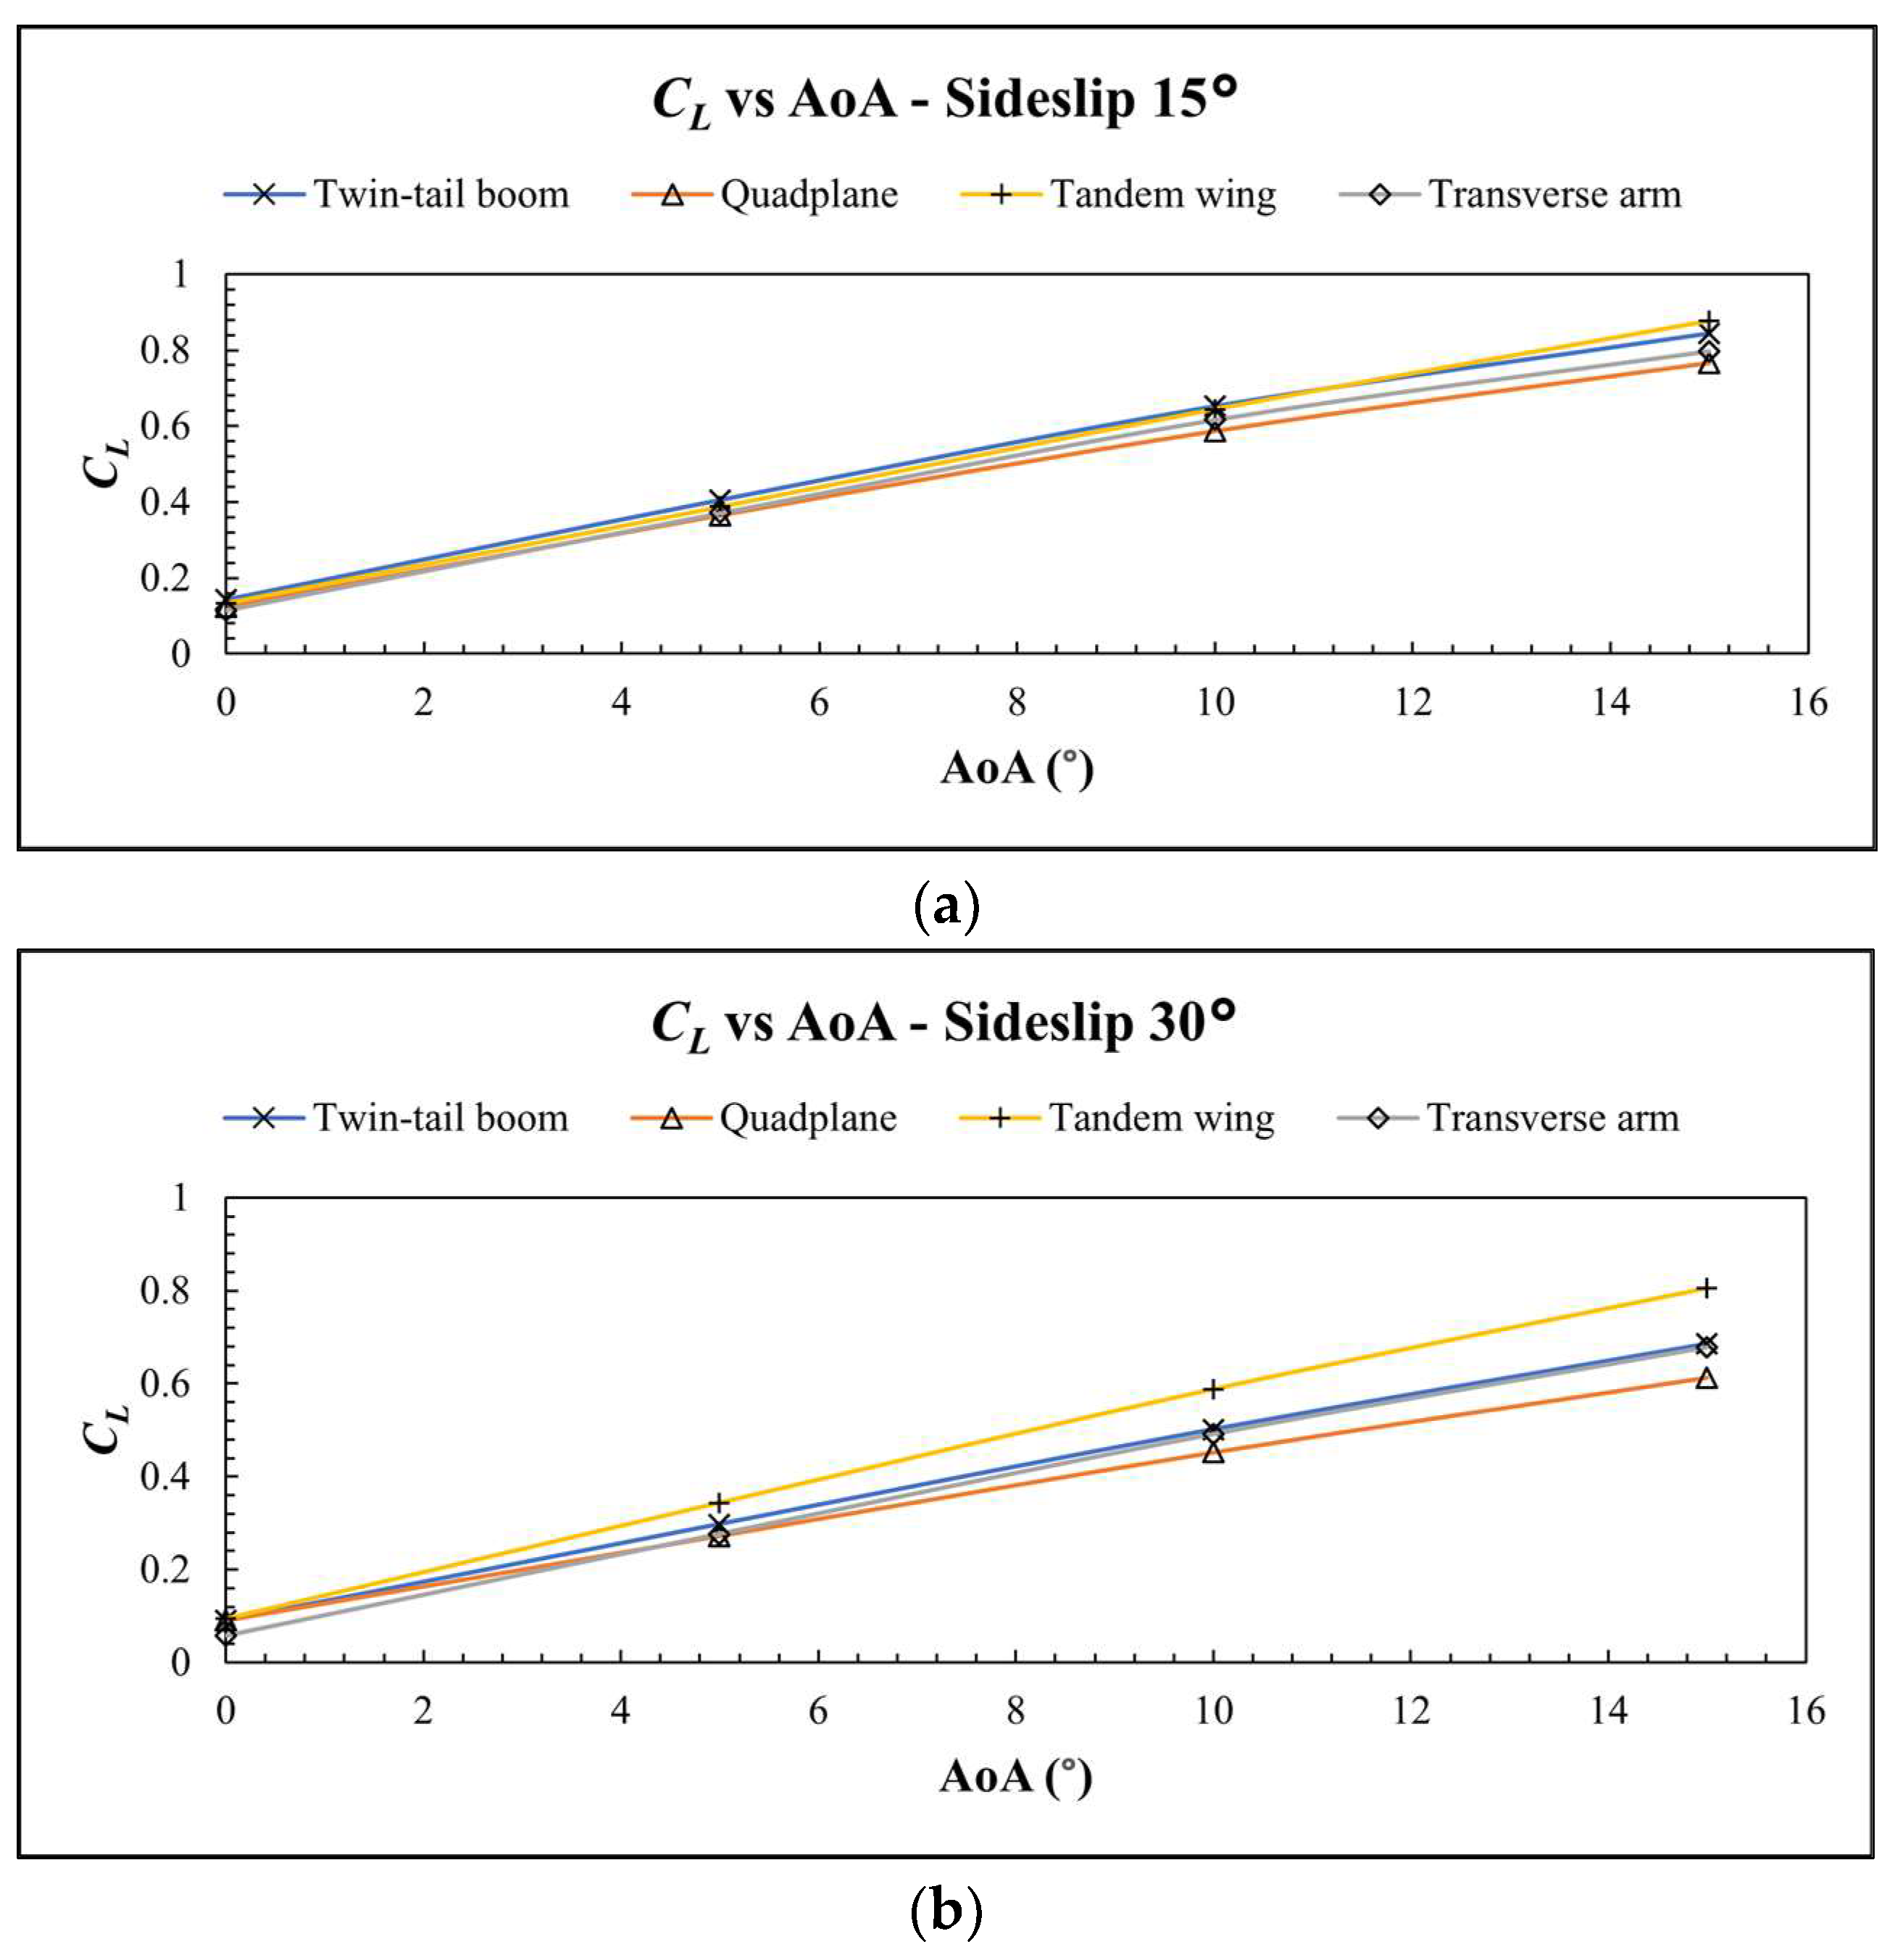
In crosswind conditions, the wing generates less lift than in the headwind condition because one side of the wing does not receive clean air, as the air is already disturbed by the fuselage.
Figure 18 depicts the coefficient of lift in crosswind conditions. In crosswind conditions with a sideslip angle of 15°, the coefficients of lift were almost the same at lower AoA. Even so, the phenomenon remained that at lower AoA, the twin-tail boom configuration had the highest C
L than the others, and then after a certain angle the tandem wing generated more lift and the highest C
L value.
When the sideslip angle was 30°, the tandem wing had the highest CL value overall, as predicted, because it had an extra surface on either side of the wing. Meanwhile, data of the twin-tail boom and the transverse arm configuration were almost matching. Overall, the twin-tail boom had better lifting capabilities at lower AoA until the sideslip angle reached 15°. Meanwhile, the tandem wing was better at higher AoA and sideslip angle. The quad-plane configuration was found to be poor in all conditions in terms of lifting capabilities, but it was the better one in drag as it had the lowest CD value. In contrast, the tandem wing had the highest CD value because of the two-wing configuration.
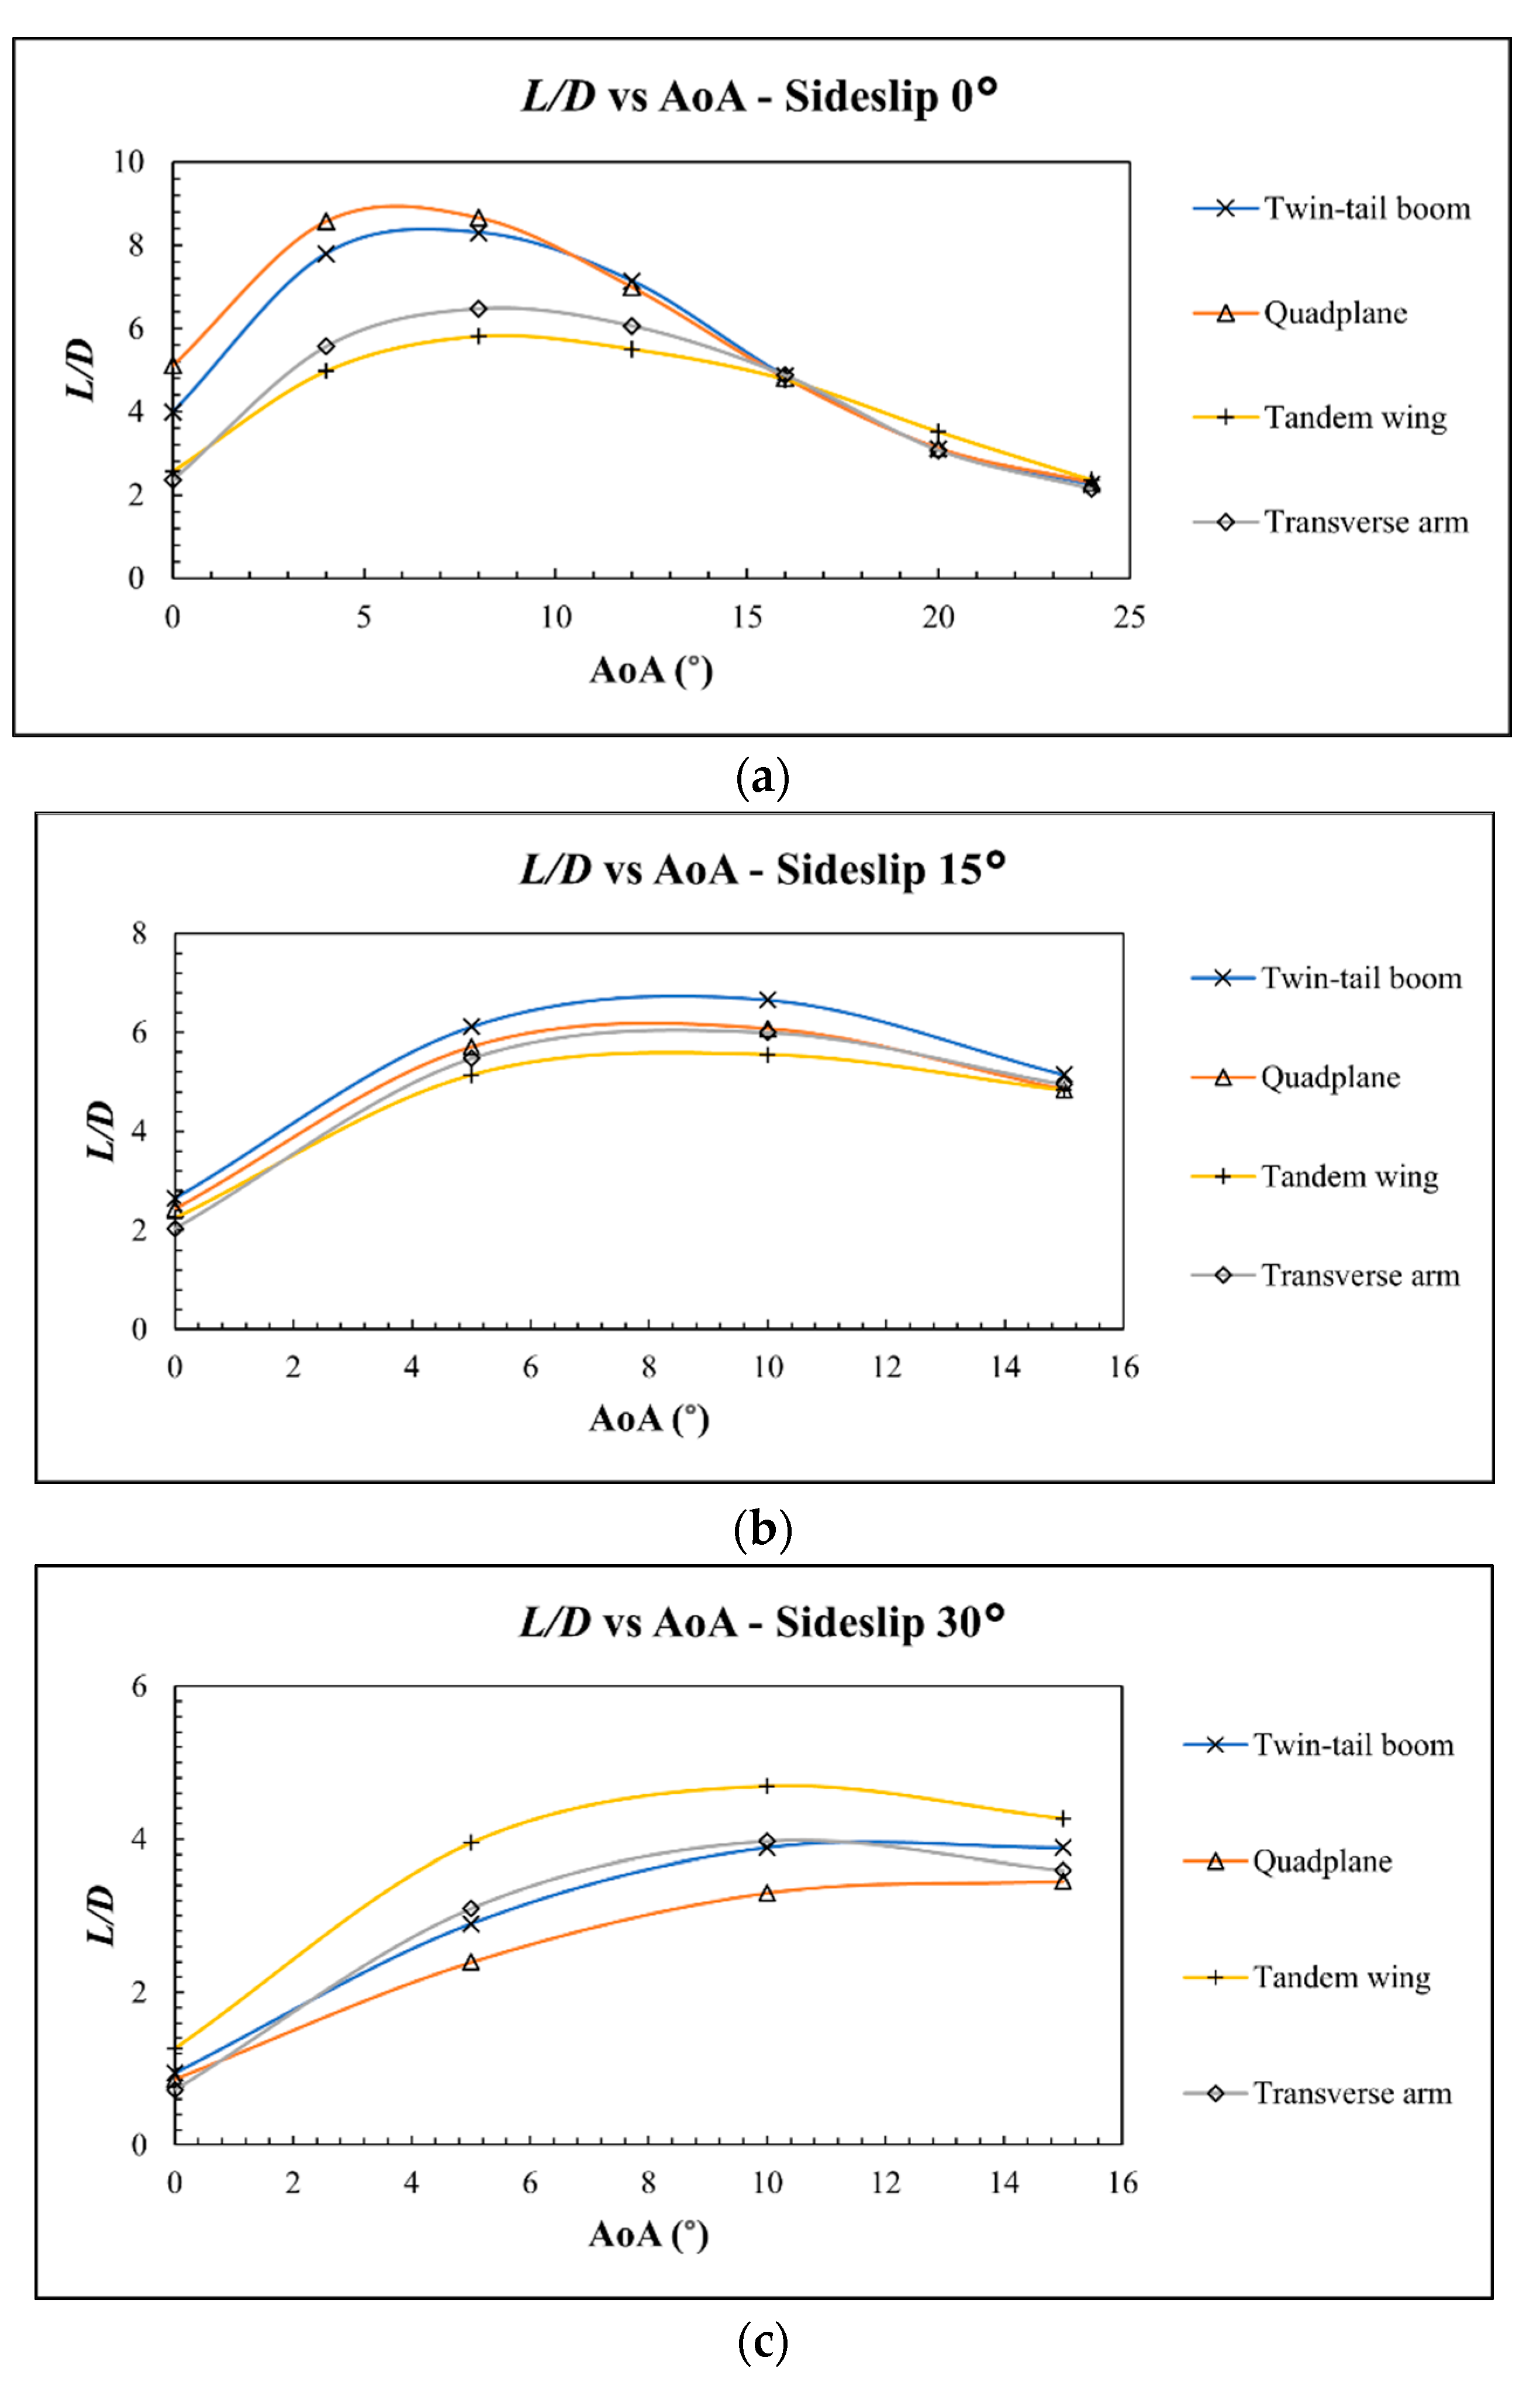
As the drag force is directly opposite to the thrust, the propulsion system has to work harder to generate more thrust as the drag increases, causing inefficiency. Using Equation (14), the L/D data could be obtained and used as a parameter to analyze efficiency in the headwind and crosswind conditions. A higher L/D value means higher efficiency.
Figure 19 shows the L/D data.
Based on
Figure 19a, it was found that the quad-plane configuration had the highest efficiency in the headwind condition between 0° and 10° and then the twin-tail boom was the most efficient from 10° to 16° even though the quad-plane was not far below the twin-tail boom in that AoA range. In contrast, the tandem wing configuration was the most inefficient at low AoA (0°–16°). At AoA higher than 16° though, the tandem wing was the most efficient mostly because of its superior lifting capabilities.
In the crosswind condition with a 15° sideslip angle depicted by
Figure 19b, the only difference was that the twin-tail boom configuration was the most efficient. This was caused by the lower drag of the twin-tail boom configuration because the fuselage is shorter than the quad-plane configuration.
At a 30° sideslip angle, the tandem wing was far superior in efficiency because of its far greater lifting capabilities. In contrast, the quad-plane configuration was found to be the least efficient than the others even though at level flight (0° AoA), every configuration besides the tandem wing had almost the same efficiency.
3.2. Stalling Performance
A stall is the loss of the wing’s capabilities to generate lift. It can be visualized as the breakdown of the smooth airflow over the wing, suddenly changing into turbulent airflow.
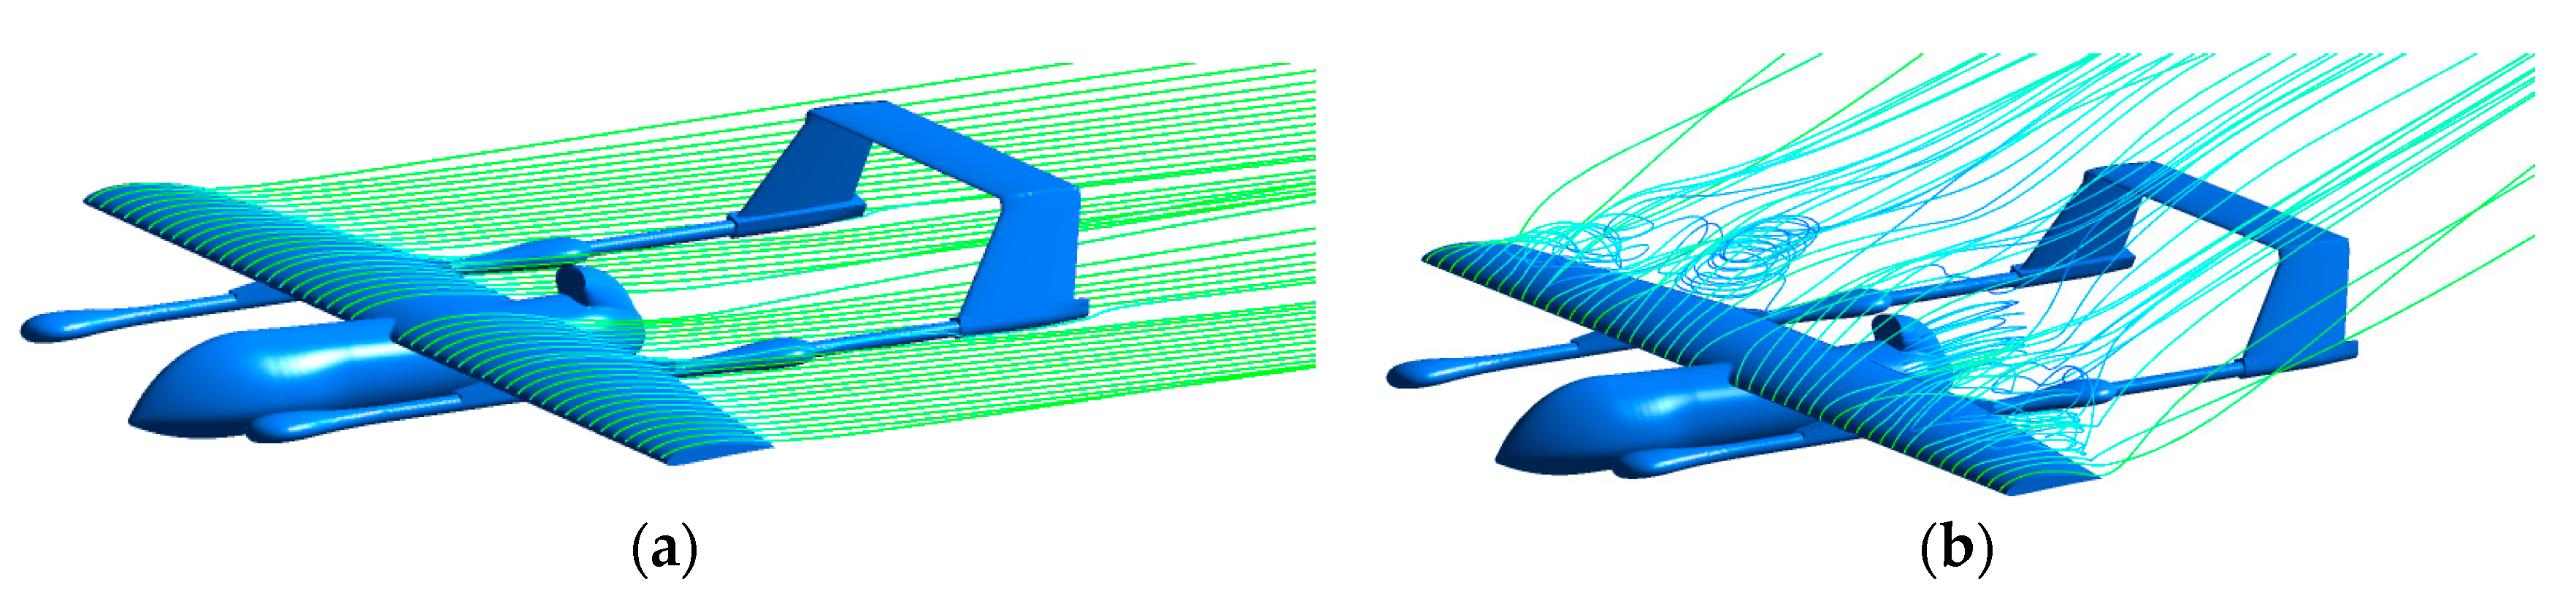
Figure 20 visualizes the stall phenomenon occurring on the twin-tail boom configuration, where it can be seen that the airflow over the wing at 0° AoA is smooth, but at 24°, the airflow does not stick to the wing surface anymore and becomes turbulent and violent.
To understand the stalling performance of each configuration, the critical angle and the stall speed need to be analyzed. The critical angle is an angle of attack at which the VTOL plane generates the greatest amount of lift force. Beyond the critical angle, the C
L value drops, meaning the aircraft has stalled. According to
Figure 17a, the twin-tail boom, the quad-plane, and the transverse arm configuration had the same critical angle, which is 16°. The tandem wing configuration had a higher critical angle, 20°, meaning the aircraft could pitch with a greater angle before it stalled.
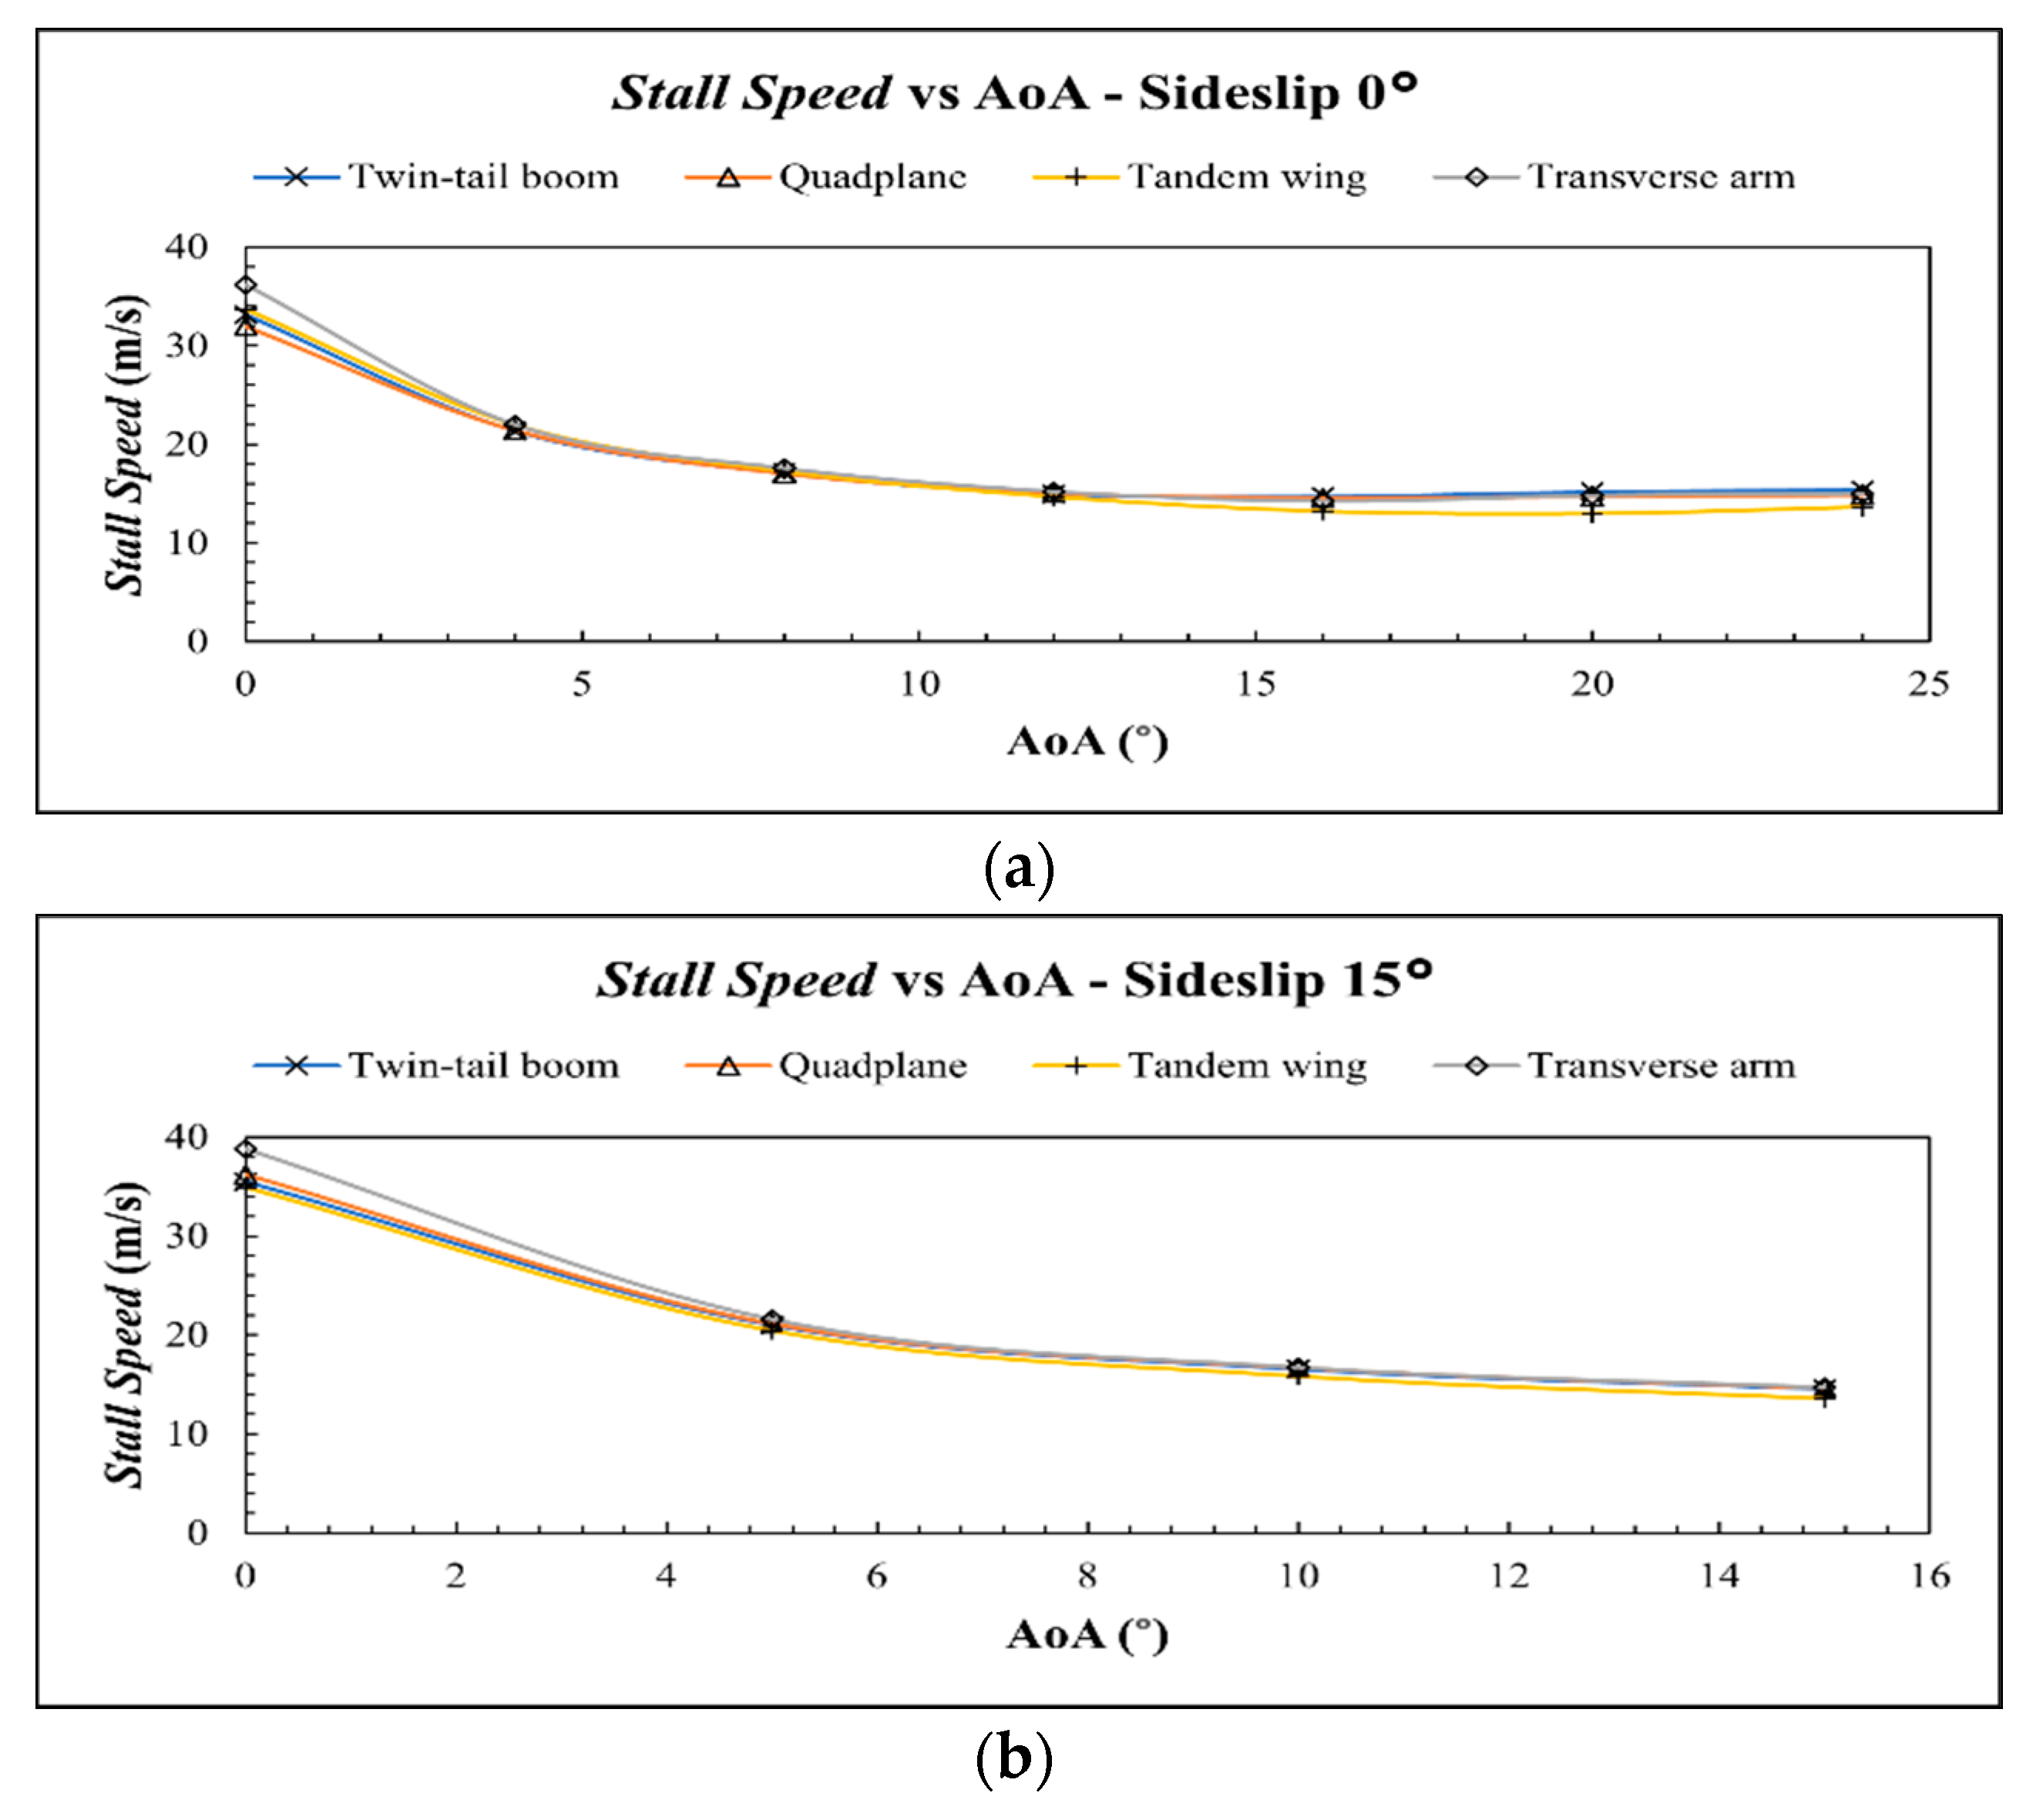
The stall speed refers to the transition of the VTOL plane from hovering mode to forward flight mode. A low stall speed is determined as a good performance. The stall speed data could be necessary for flight controller input or for monitoring the flight. The stall speed value was obtained by using Equation (9), using the weight of the aircraft (98.5 N) as the lift force variable. In doing so, the speed variable is the speed required to support the aircraft’s weight.
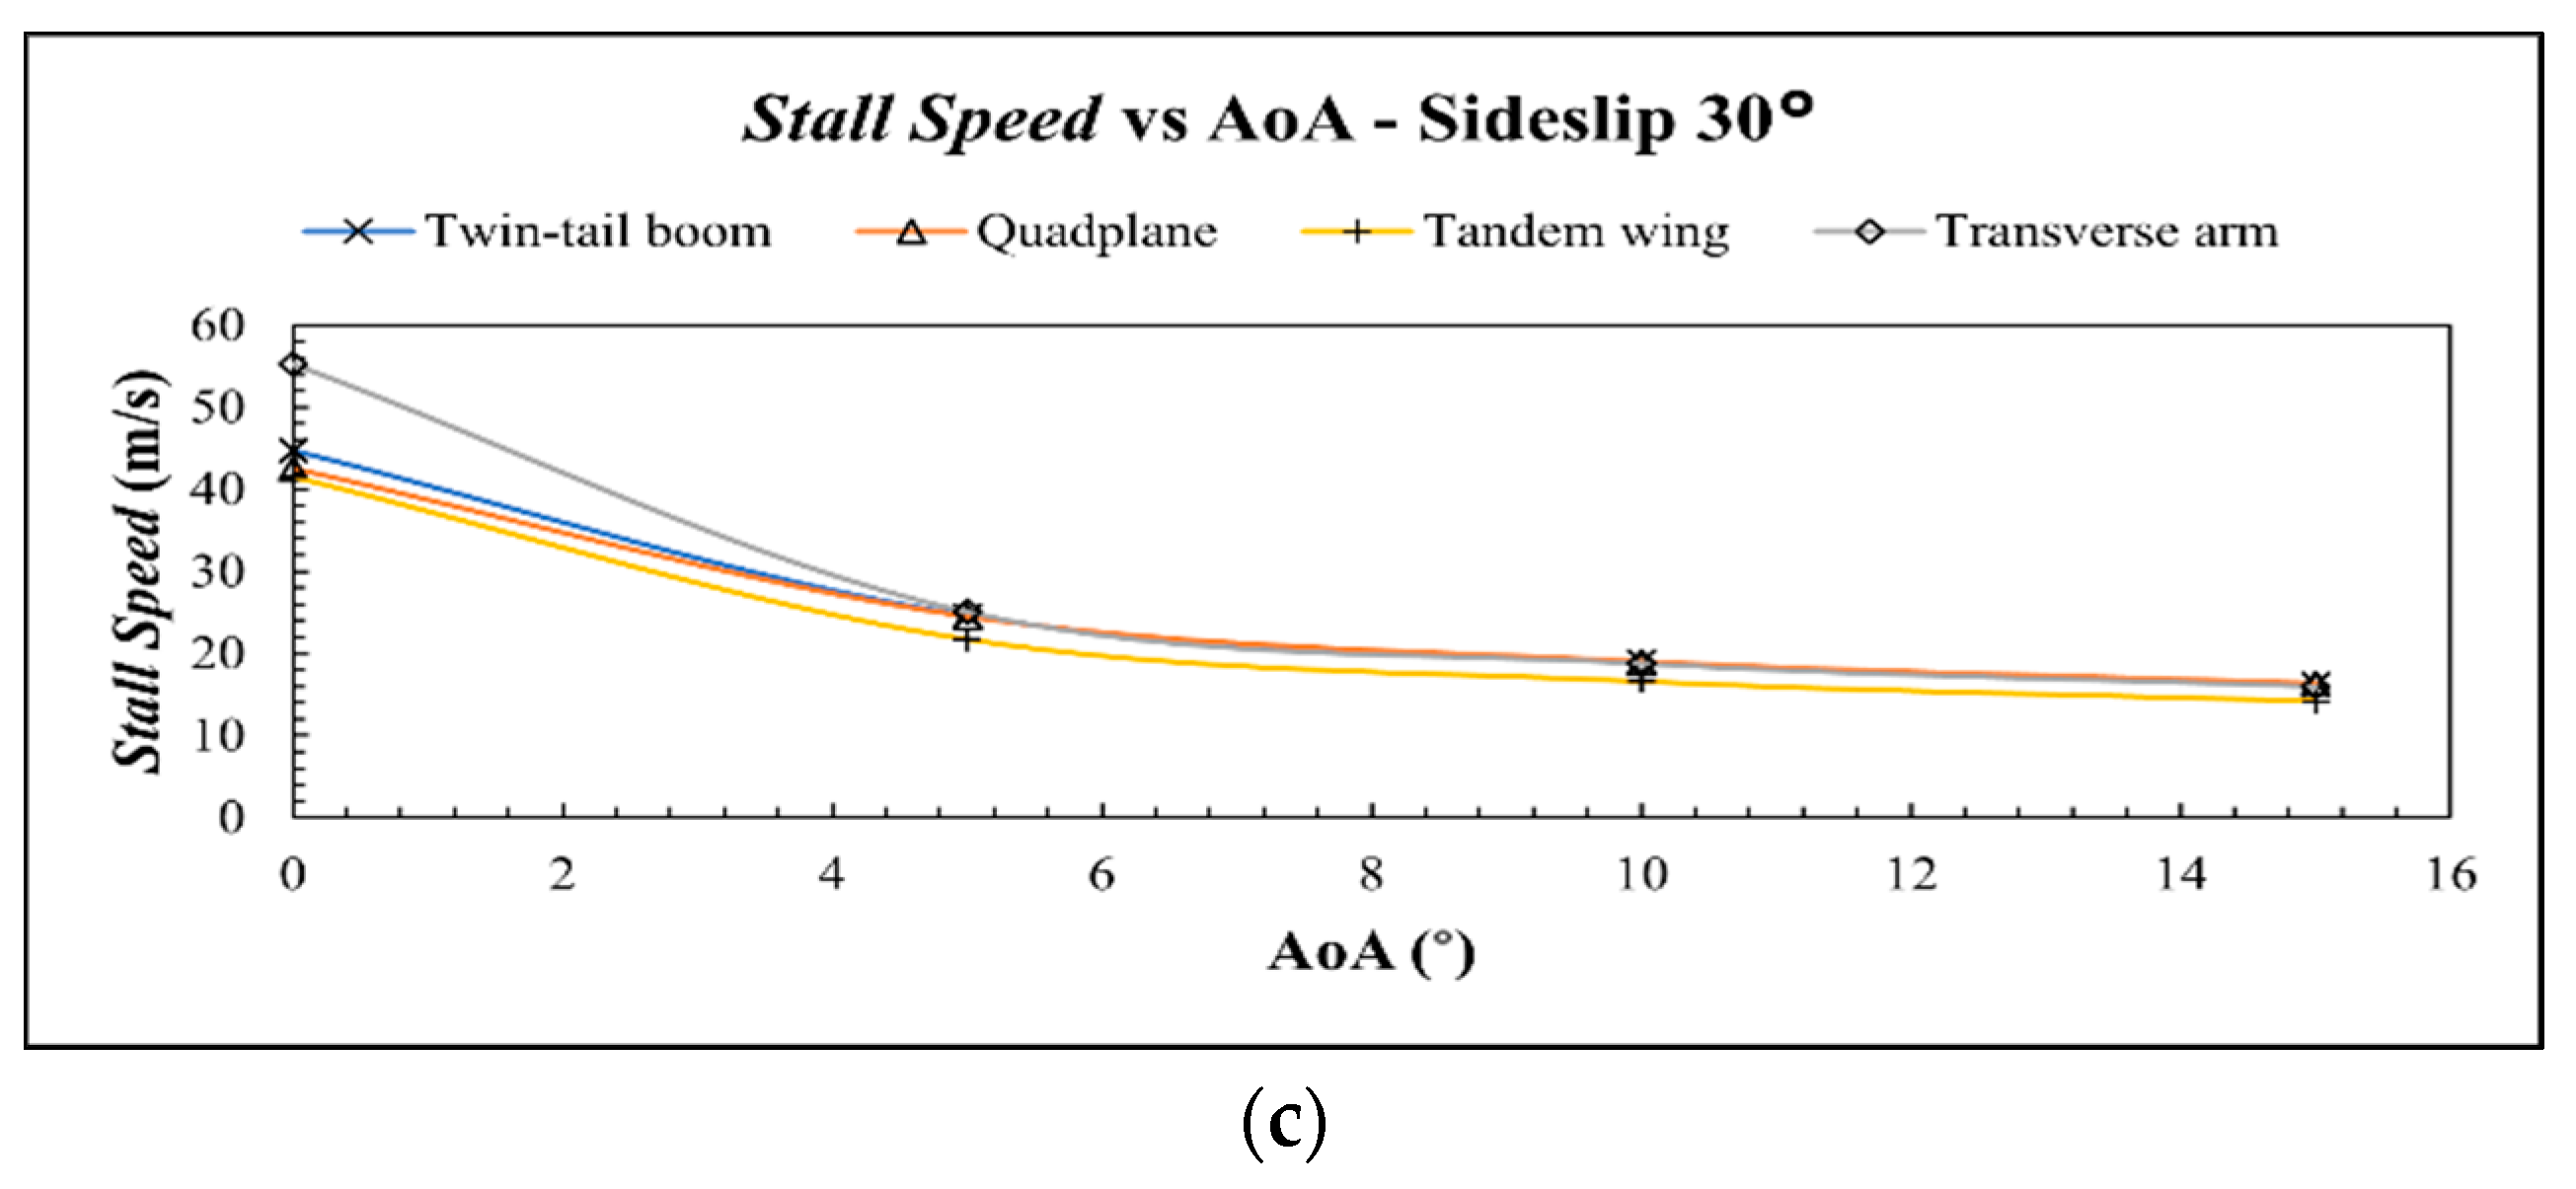
Figure 21 shows the stall speed data in headwind and crosswind conditions.
In the headwind condition depicted by
Figure 21a, it was found that all configurations had fulfilled the stall speed DR&O, which is 15 m/s, at 12° AoA. As the C
L values dropped after the critical angle, the stall speed increased. Besides the tandem wing, all configurations had similar stall speed values at every AoA. The tandem wing performed the best as it had the lowest stall speed, but only at AoA greater than 8°.
Figure 21b shows the stall speed data of the crosswind condition with a 15° sideslip angle. The VTOL plane fulfilled the stall speed DR&O at 15° AoA. The tandem wing outperformed the other configurations, as predicted. Once again, the stall speed value of other configurations did not differ significantly. Although at 0° AoA, the transverse arm differed and had the highest stall speed value overall, meaning this configuration performed the worst.
The tandem wing also performed the best at a 30° sideslip angle as depicted by
Figure 21c and had already fulfilled the DR&O at 15° AoA. Meanwhile, the twin-tail boom and the quad-plane configuration were still similar. The transverse arm performed the worst again at 0° AoA as it had a significantly higher stall speed than other configurations.
3.3. Stability Performance
An aircraft has three types of stability: longitudinal, lateral, and directional stability. In this study, longitudinal stability was represented by the coefficient of pitch moment (Cp). In crosswind conditions, the left and right sides of the aircraft have different pressure because of the airflow direction. These differences cause a tendency for an aircraft to roll or yaw, making lateral and directional stability a necessary parameter to analyze to determine each configuration’s stability performance. The lateral stability can be determined by analyzing the Cr value, while the directional stability can be determined by analyzing the Cy value. The closer those values are to 0, the better the stability performance is. Having 0 coefficient of moment means the aircraft maintains its position, and is stable and level, without any tendency to pitch, roll, or yaw.
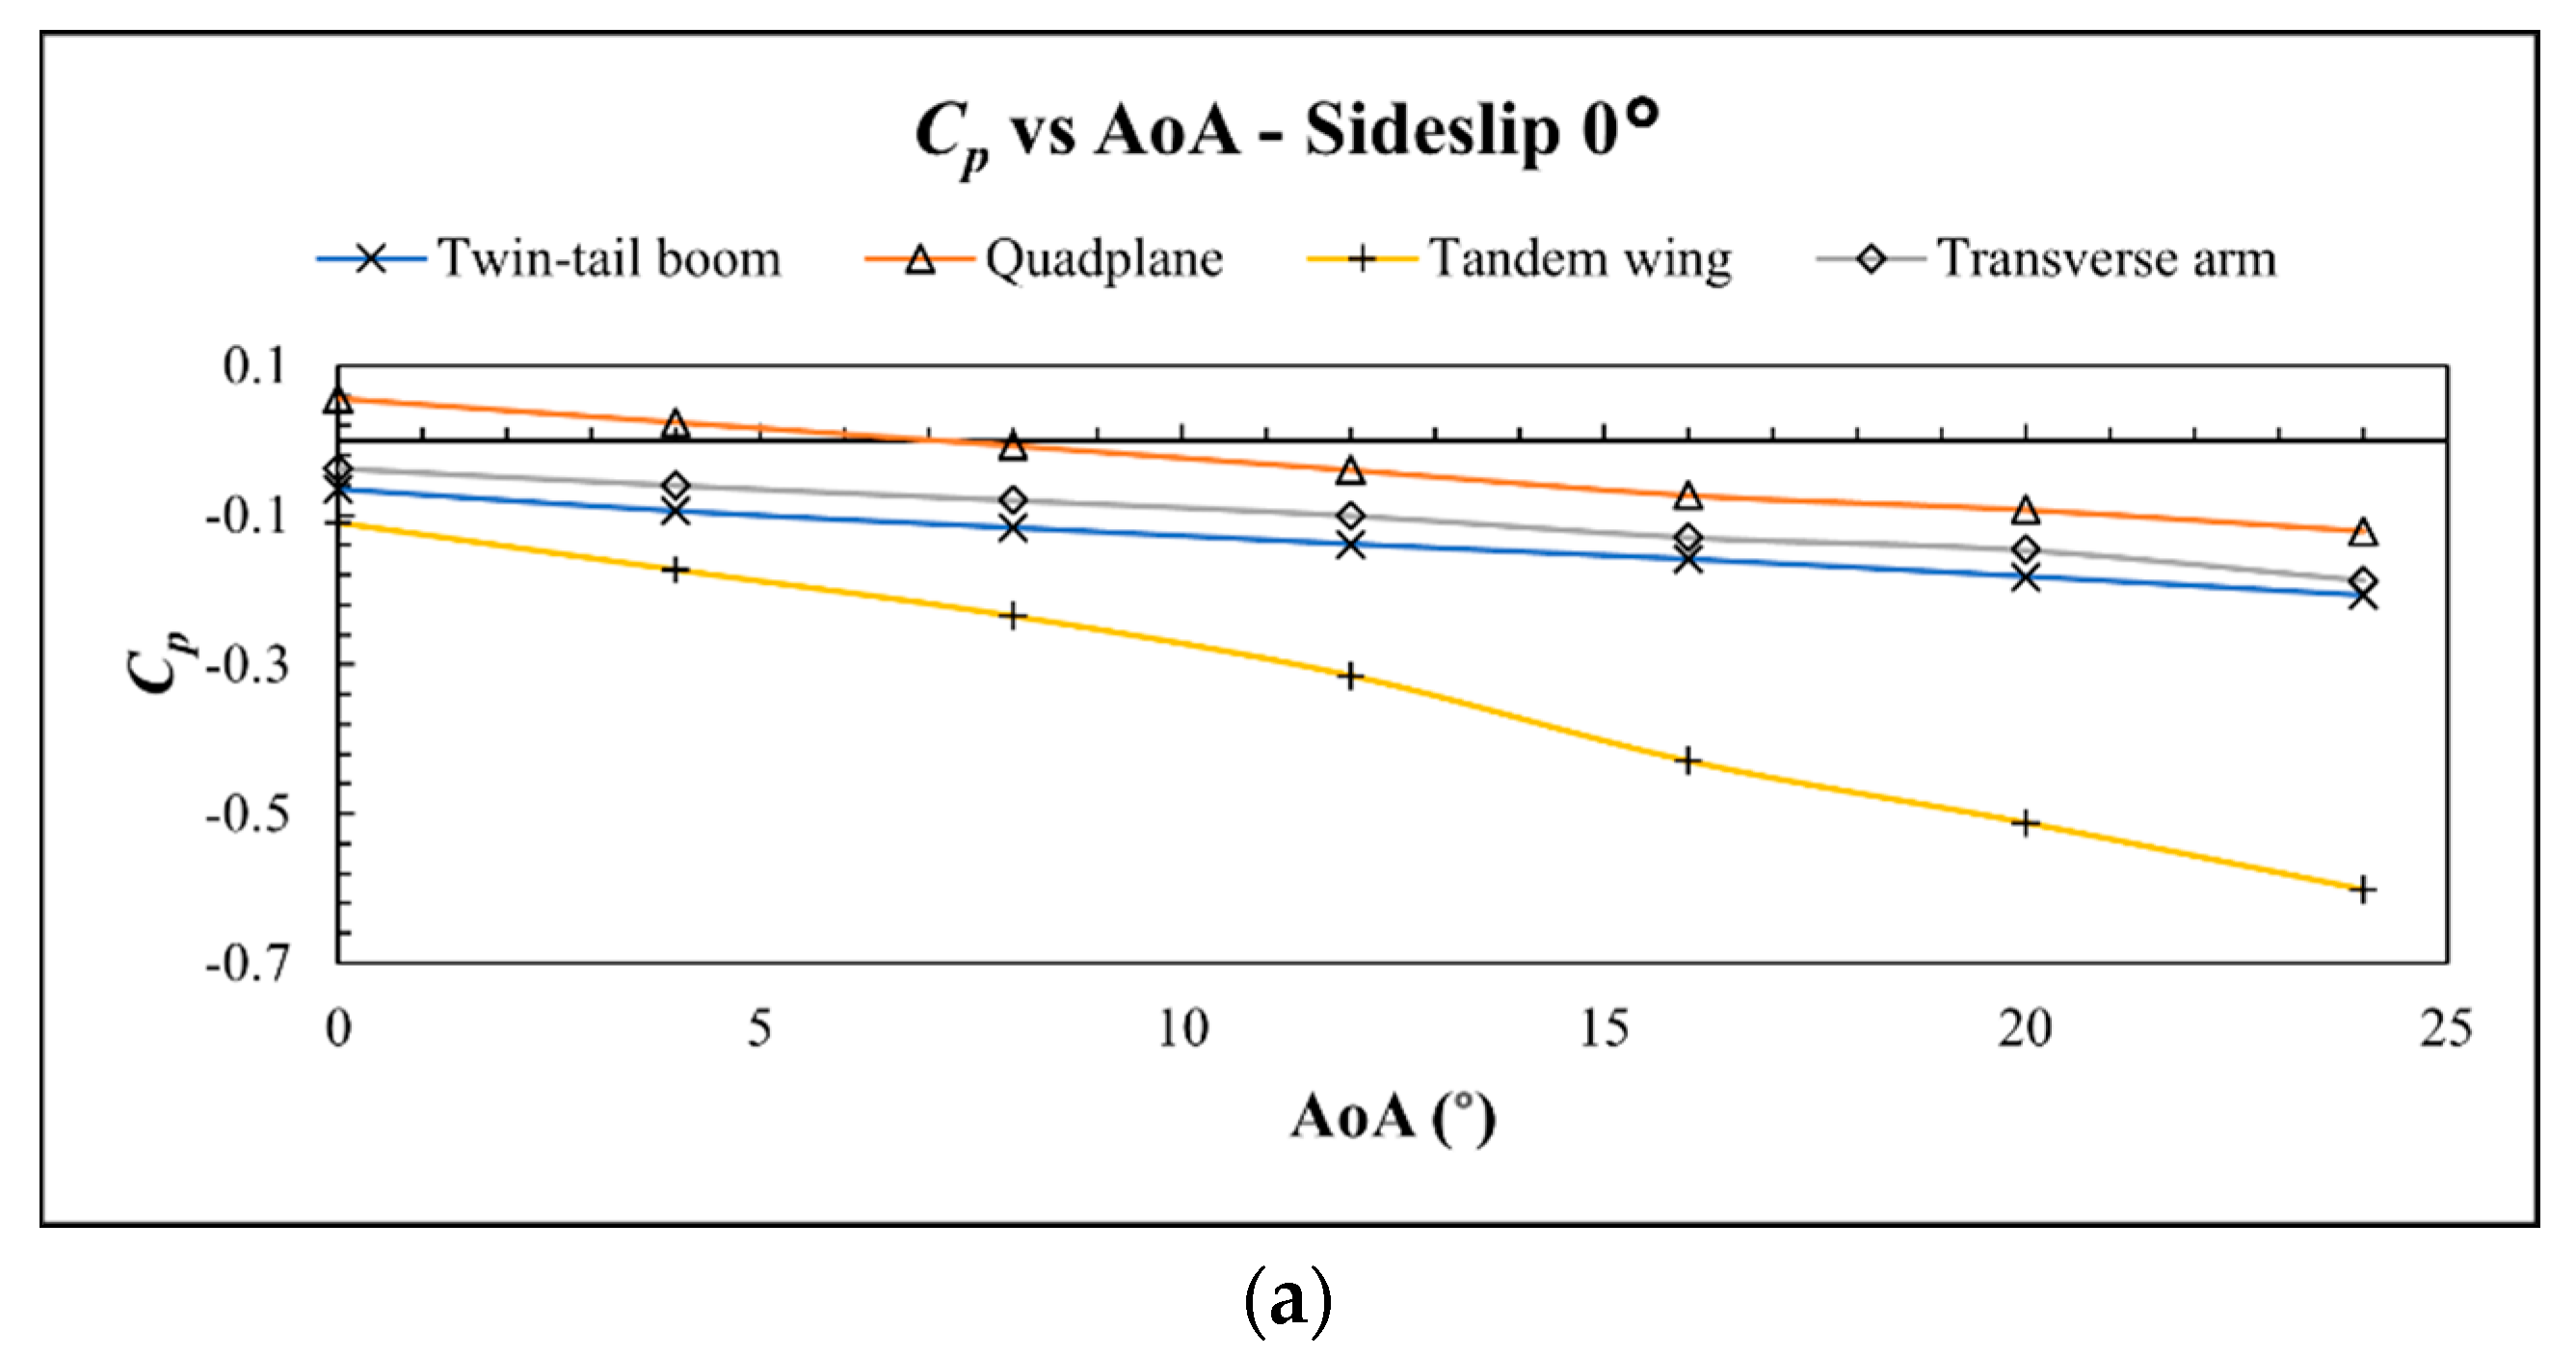
Figure 22 depicts the C
p of all configurations in headwind and crosswind conditions. The quad-plane configuration had a positive C
p value between 0° and 8°, causing the aircraft to pitch up. However, the quad-plane had a zero C
p value, which means the aircraft reached longitudinal stability. The further the C
p value, the worse the stability performance is, requiring the elevator to work harder to counteract the aircraft’s tendency to pitch up or down, only to keep the aircraft level. As can be seen in
Figure 22a, the tandem wing had the worst performance in longitudinal stability, mainly because its two wings were generating lift far away from the CoG.
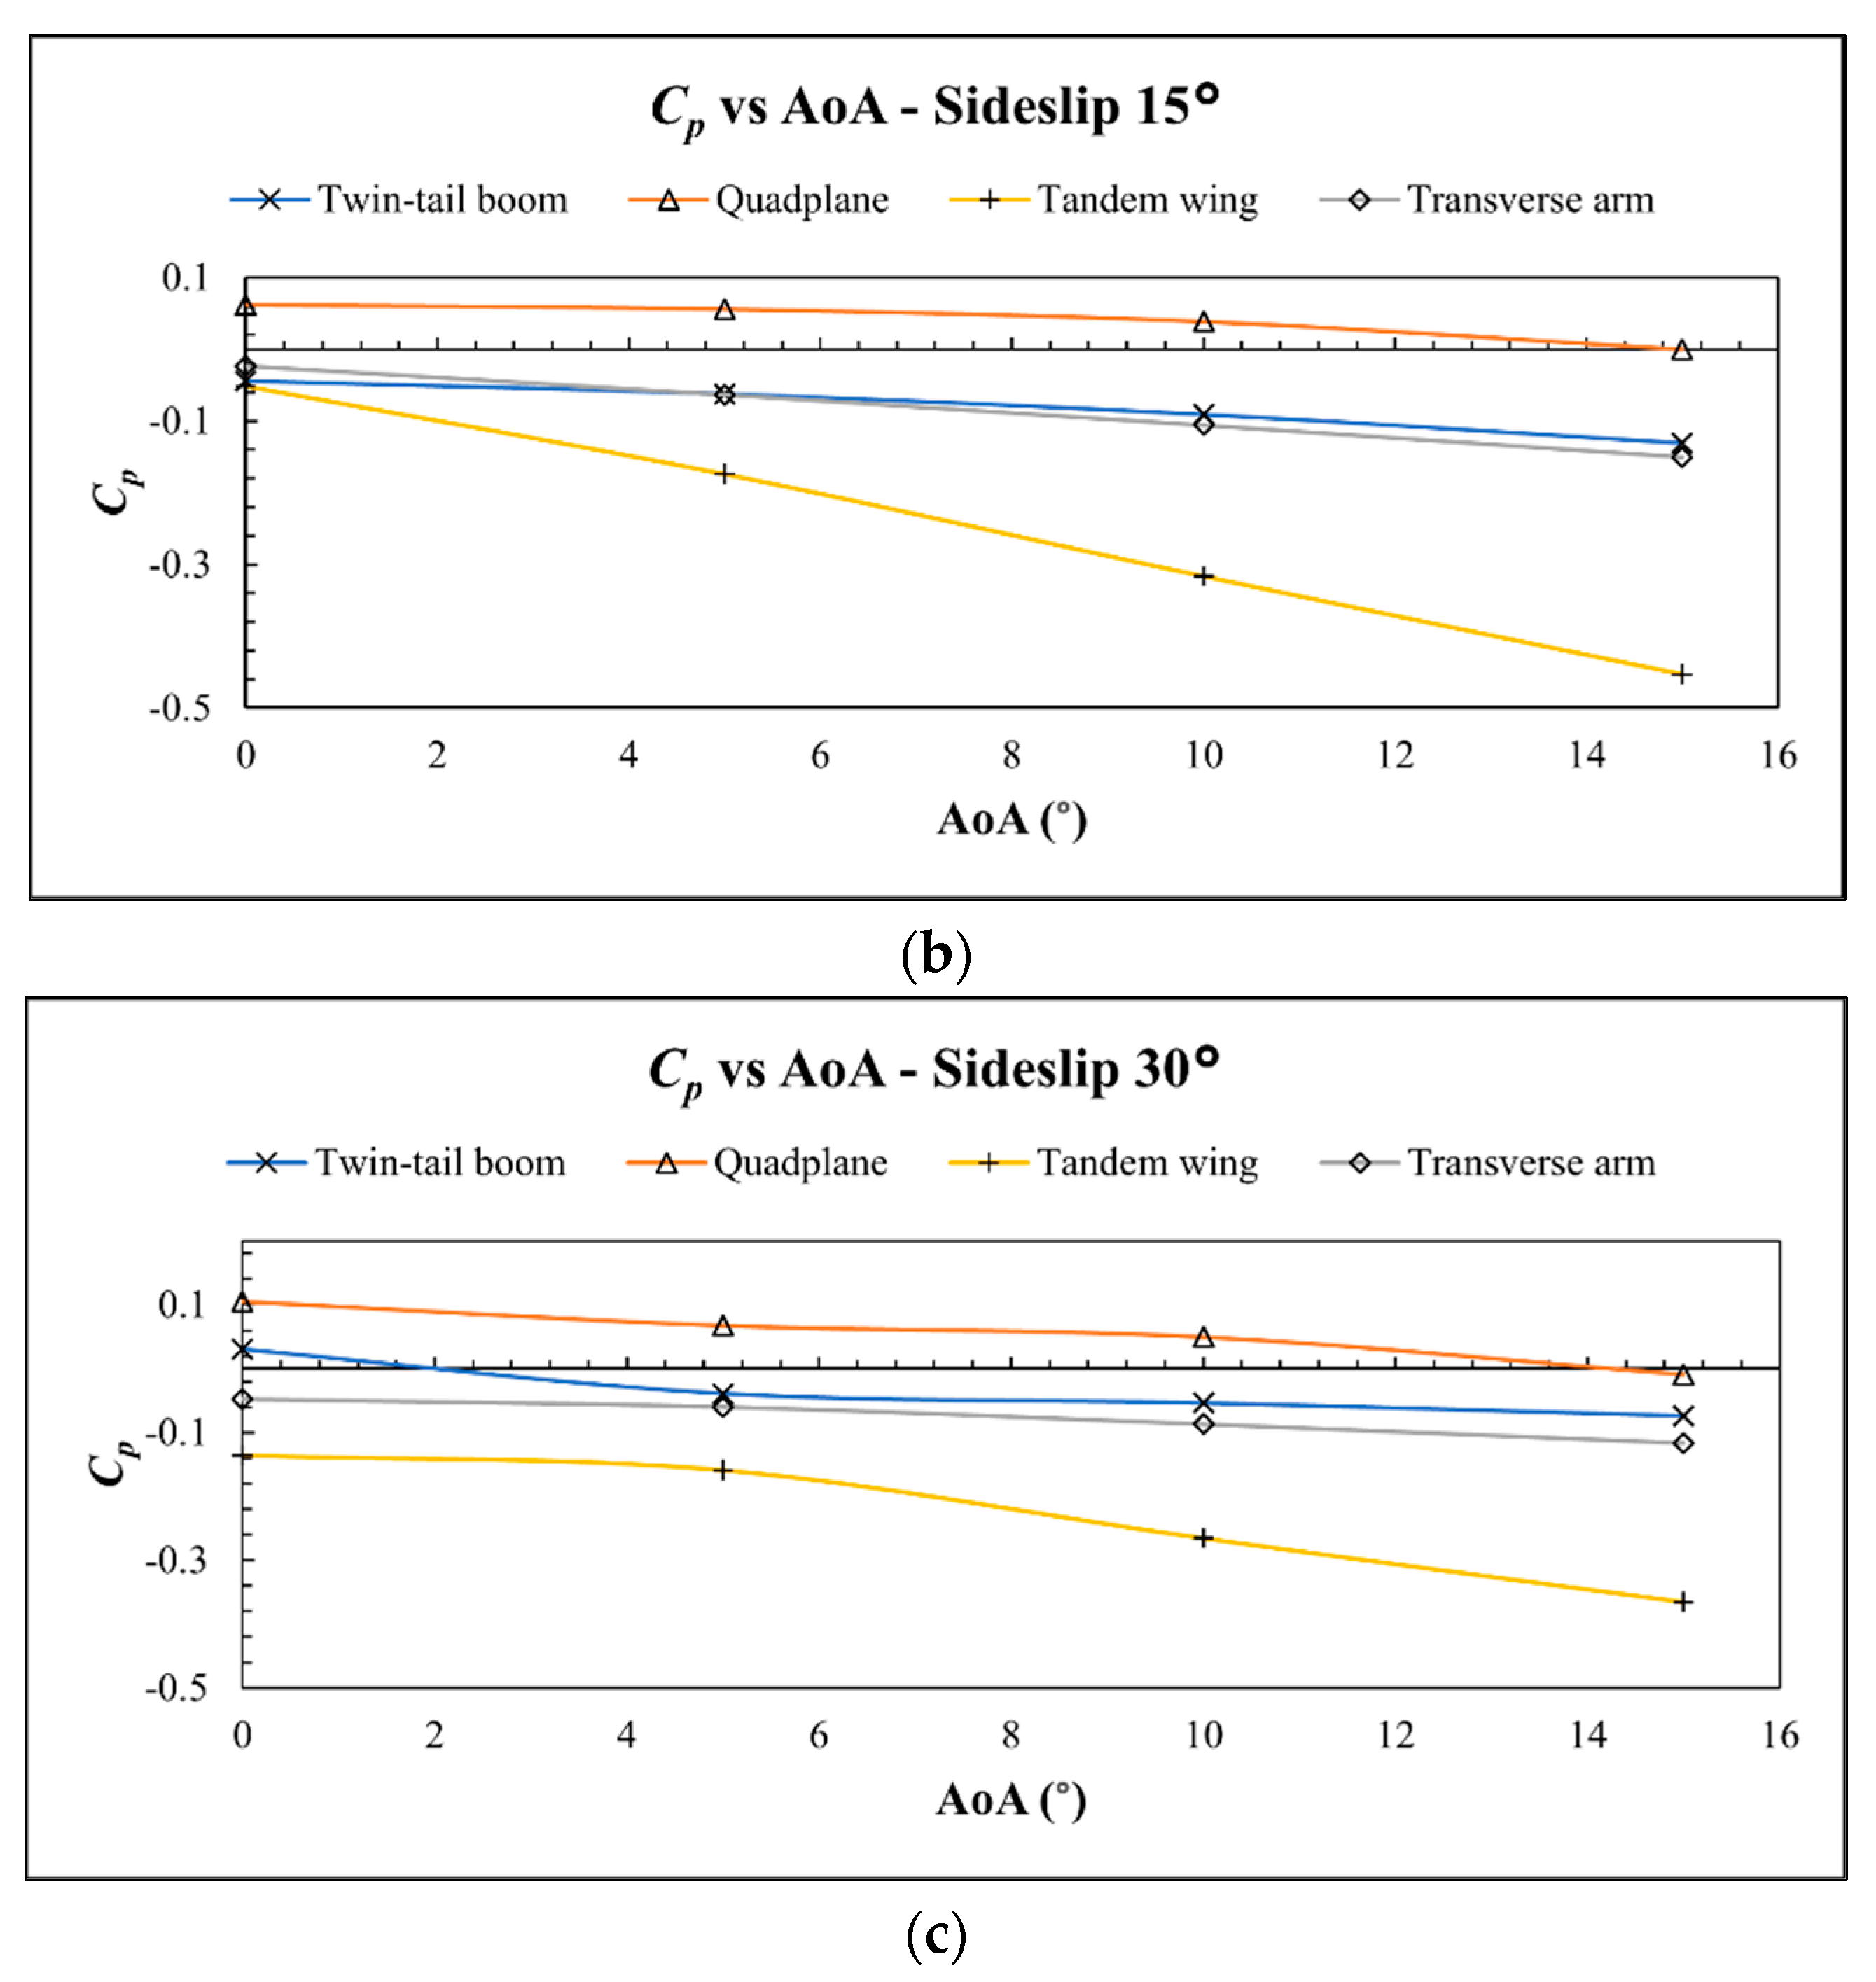
The twin-tail boom and the quad-plane configuration performed well in longitudinal stability in crosswind conditions as depicted by
Figure 22b,c. However, the quad-plane performed better because the C
p approached zero as the angle of attack became greater. Because the aircraft generates less lift in crosswind conditions, there are more instances where the aircraft must pitch up to generate more lift, which makes the quad-plane the most longitudinally stable. In contrast, the tandem wing continued to perform poorly in longitudinal stability in crosswind conditions.
The tendency of an aircraft to roll and yaw in crosswind conditions is mostly because of the difference in the lift force being generated between one side and the other. The fuselage is also a disturbance for the airflow, causing one side of the wing not to receive clean air. To determine the lateral stability, the Cr values were analyzed. The smaller the Cr value, the more an aircraft can maintain its position on the longitudinal axis in crosswind conditions.
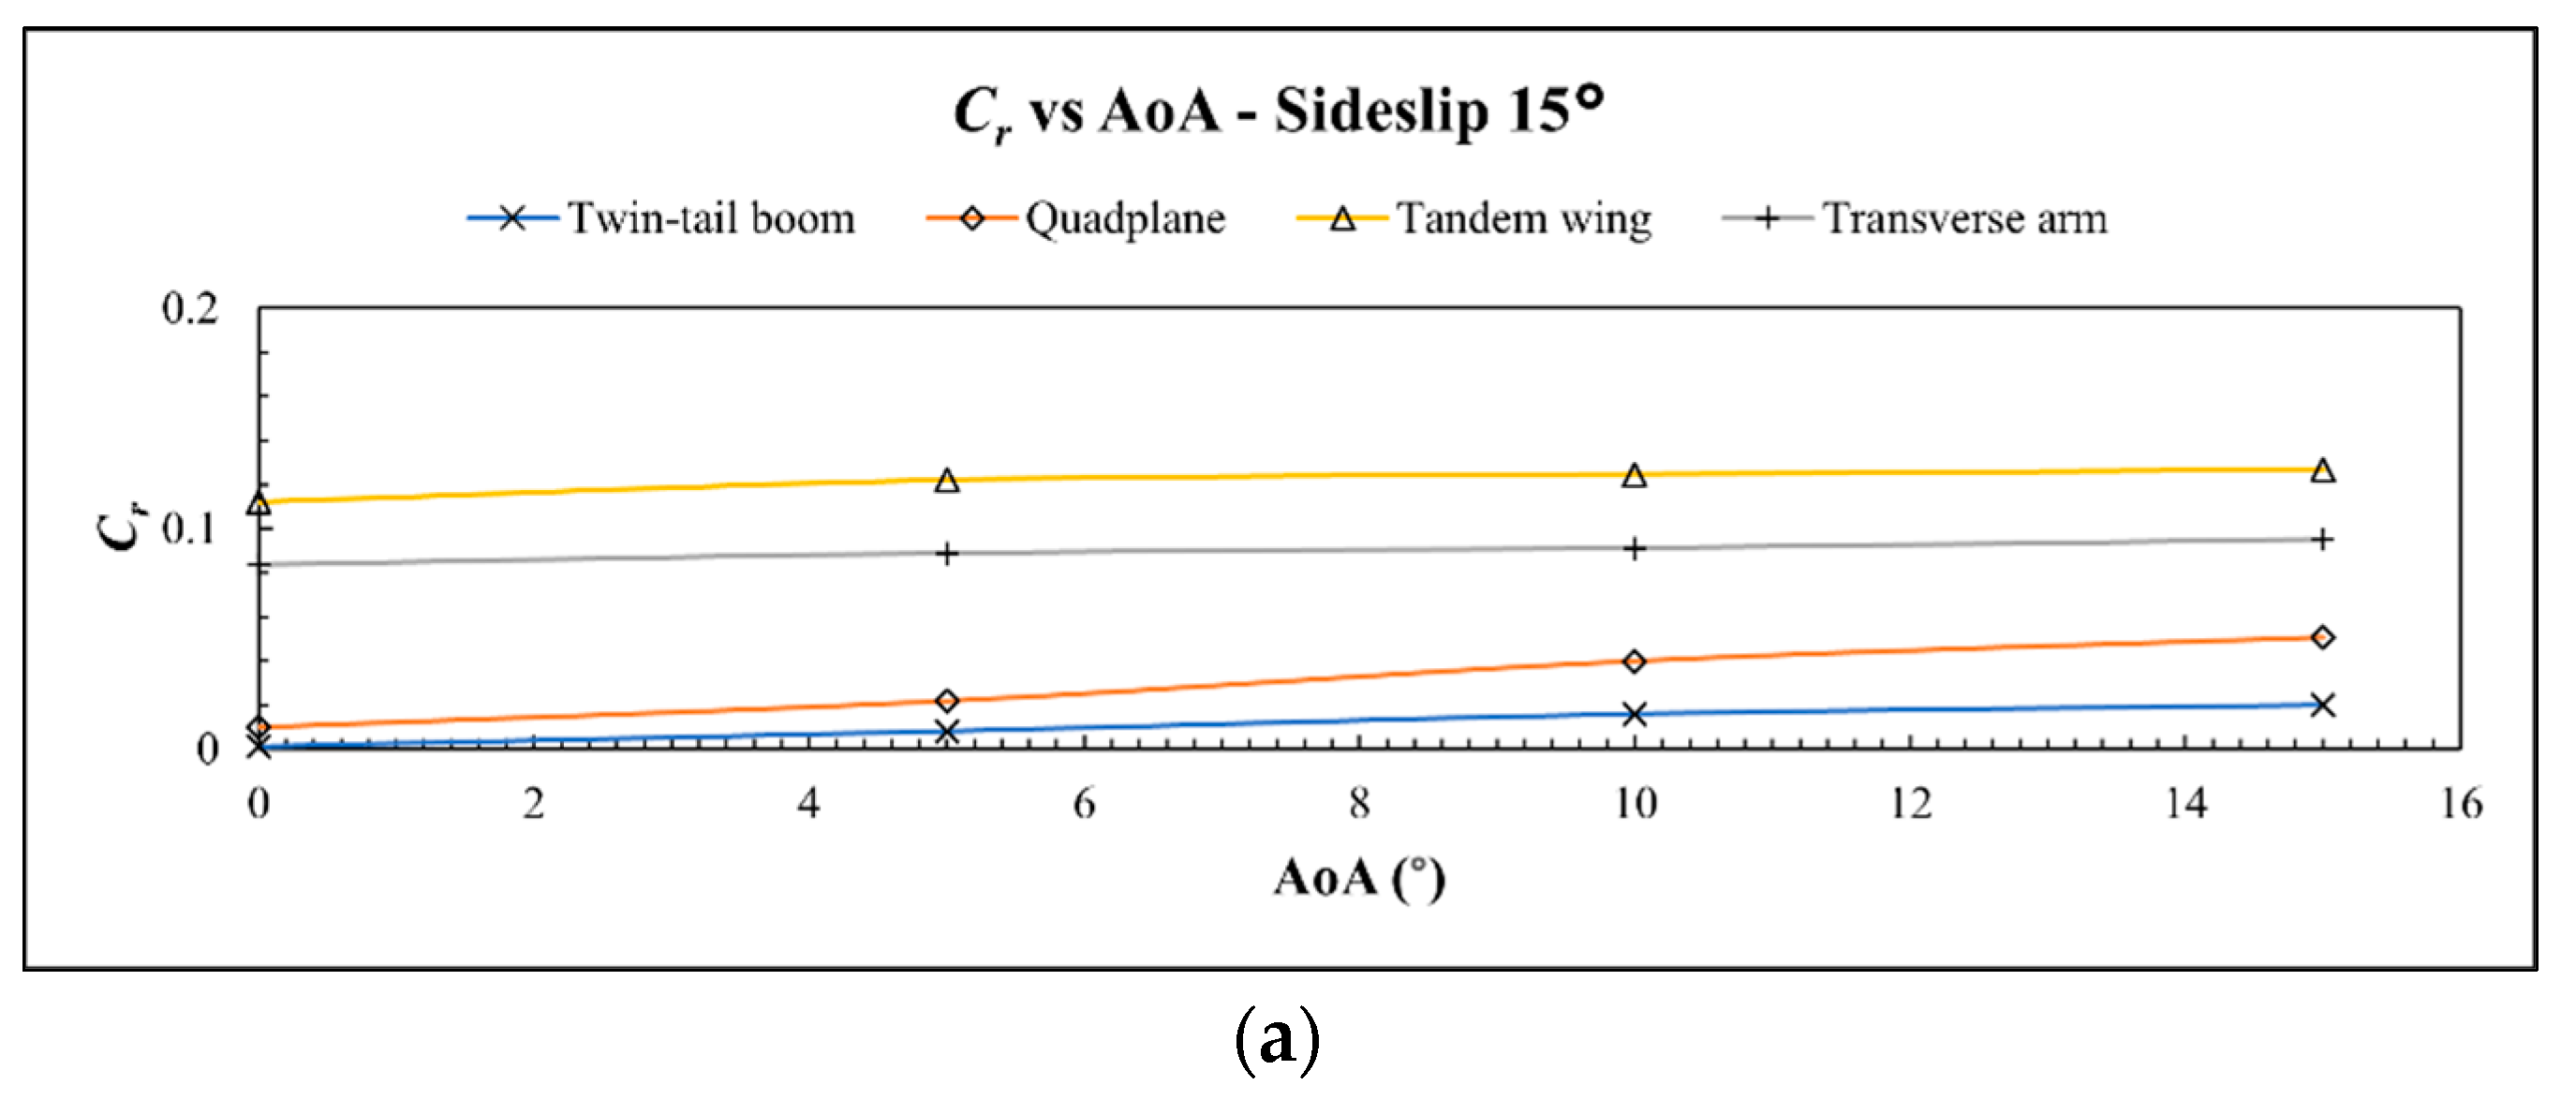
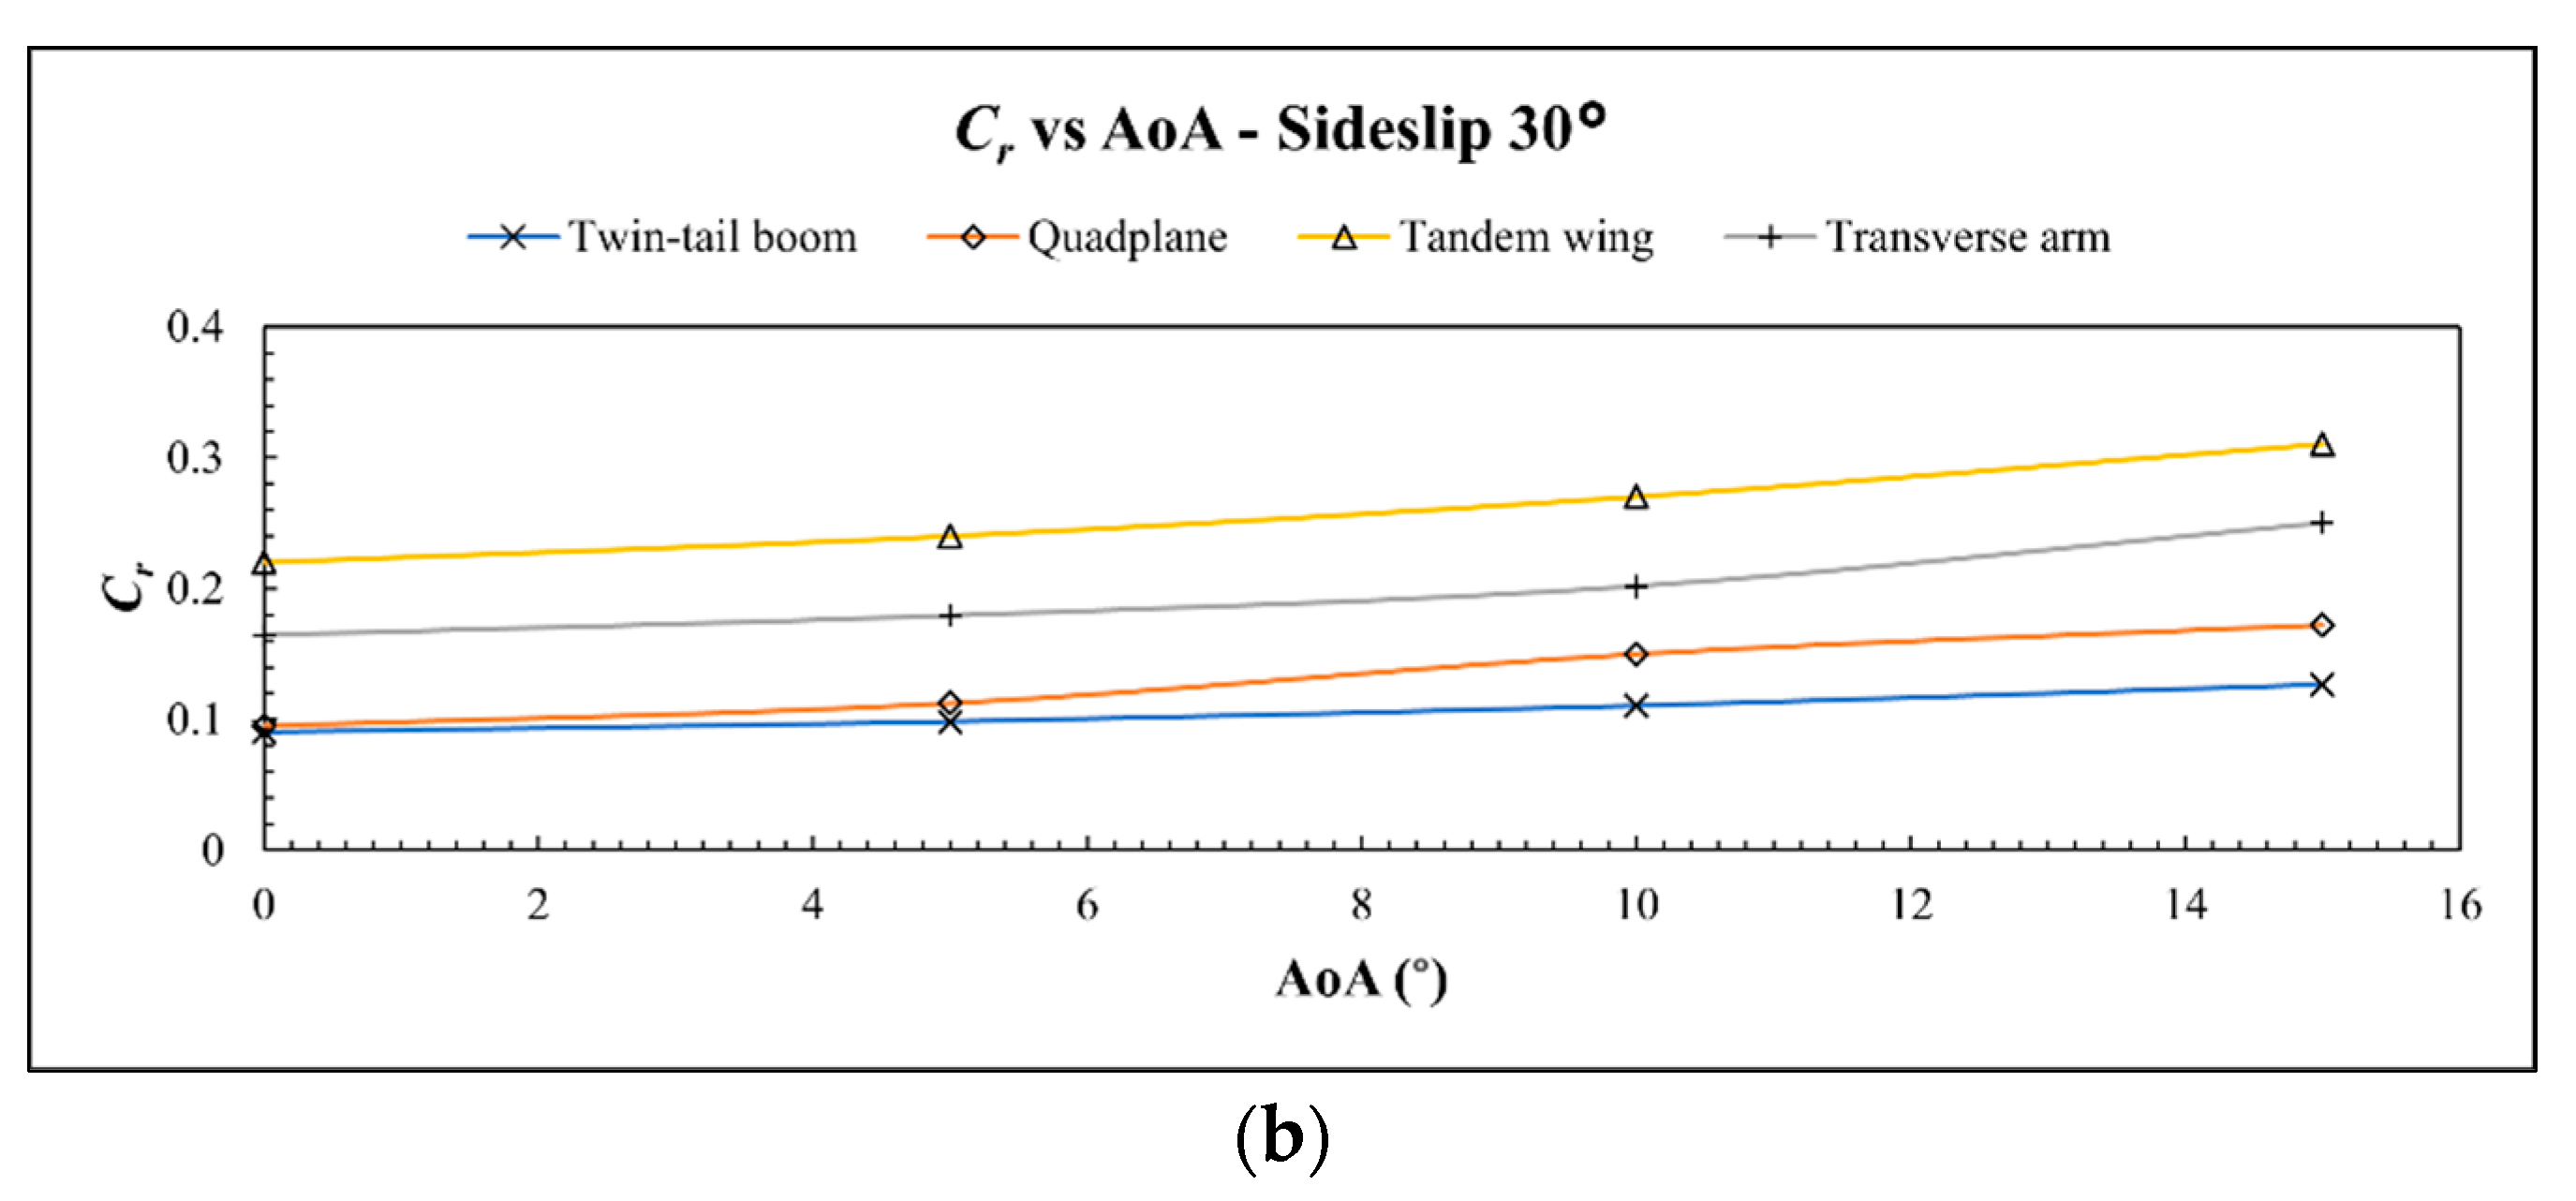
Figure 23 depicts the C
r values of the VTOL plane.
Figure 23a shows the 15° sideslip angle condition. It explains that the twin-tail boom and the quad-plane configuration had similar C
r values, although the twin-tail boom slightly outperformed the quad-plane. While the transverse arm performed poorly, the tandem wing had the worst longitudinal stability; as predicted before, the tandem wing configuration had problems in stability and controllability.
Figure 23b shows the 30° sideslip angle condition, which does not depict any significant difference from the 15° sideslip angle condition. The twin-tail boom still outperformed the rest, while the tandem wing was the most unstable longitudinally.
The ability of an aircraft to retain its position on the vertical (yaw) axis is called lateral directional stability. The configurations’ directional stability performance could be determined by analyzing the coefficient of yaw moment (C
y). The closer the C
y is to zero, the more stable the aircraft is on the vertical axis.
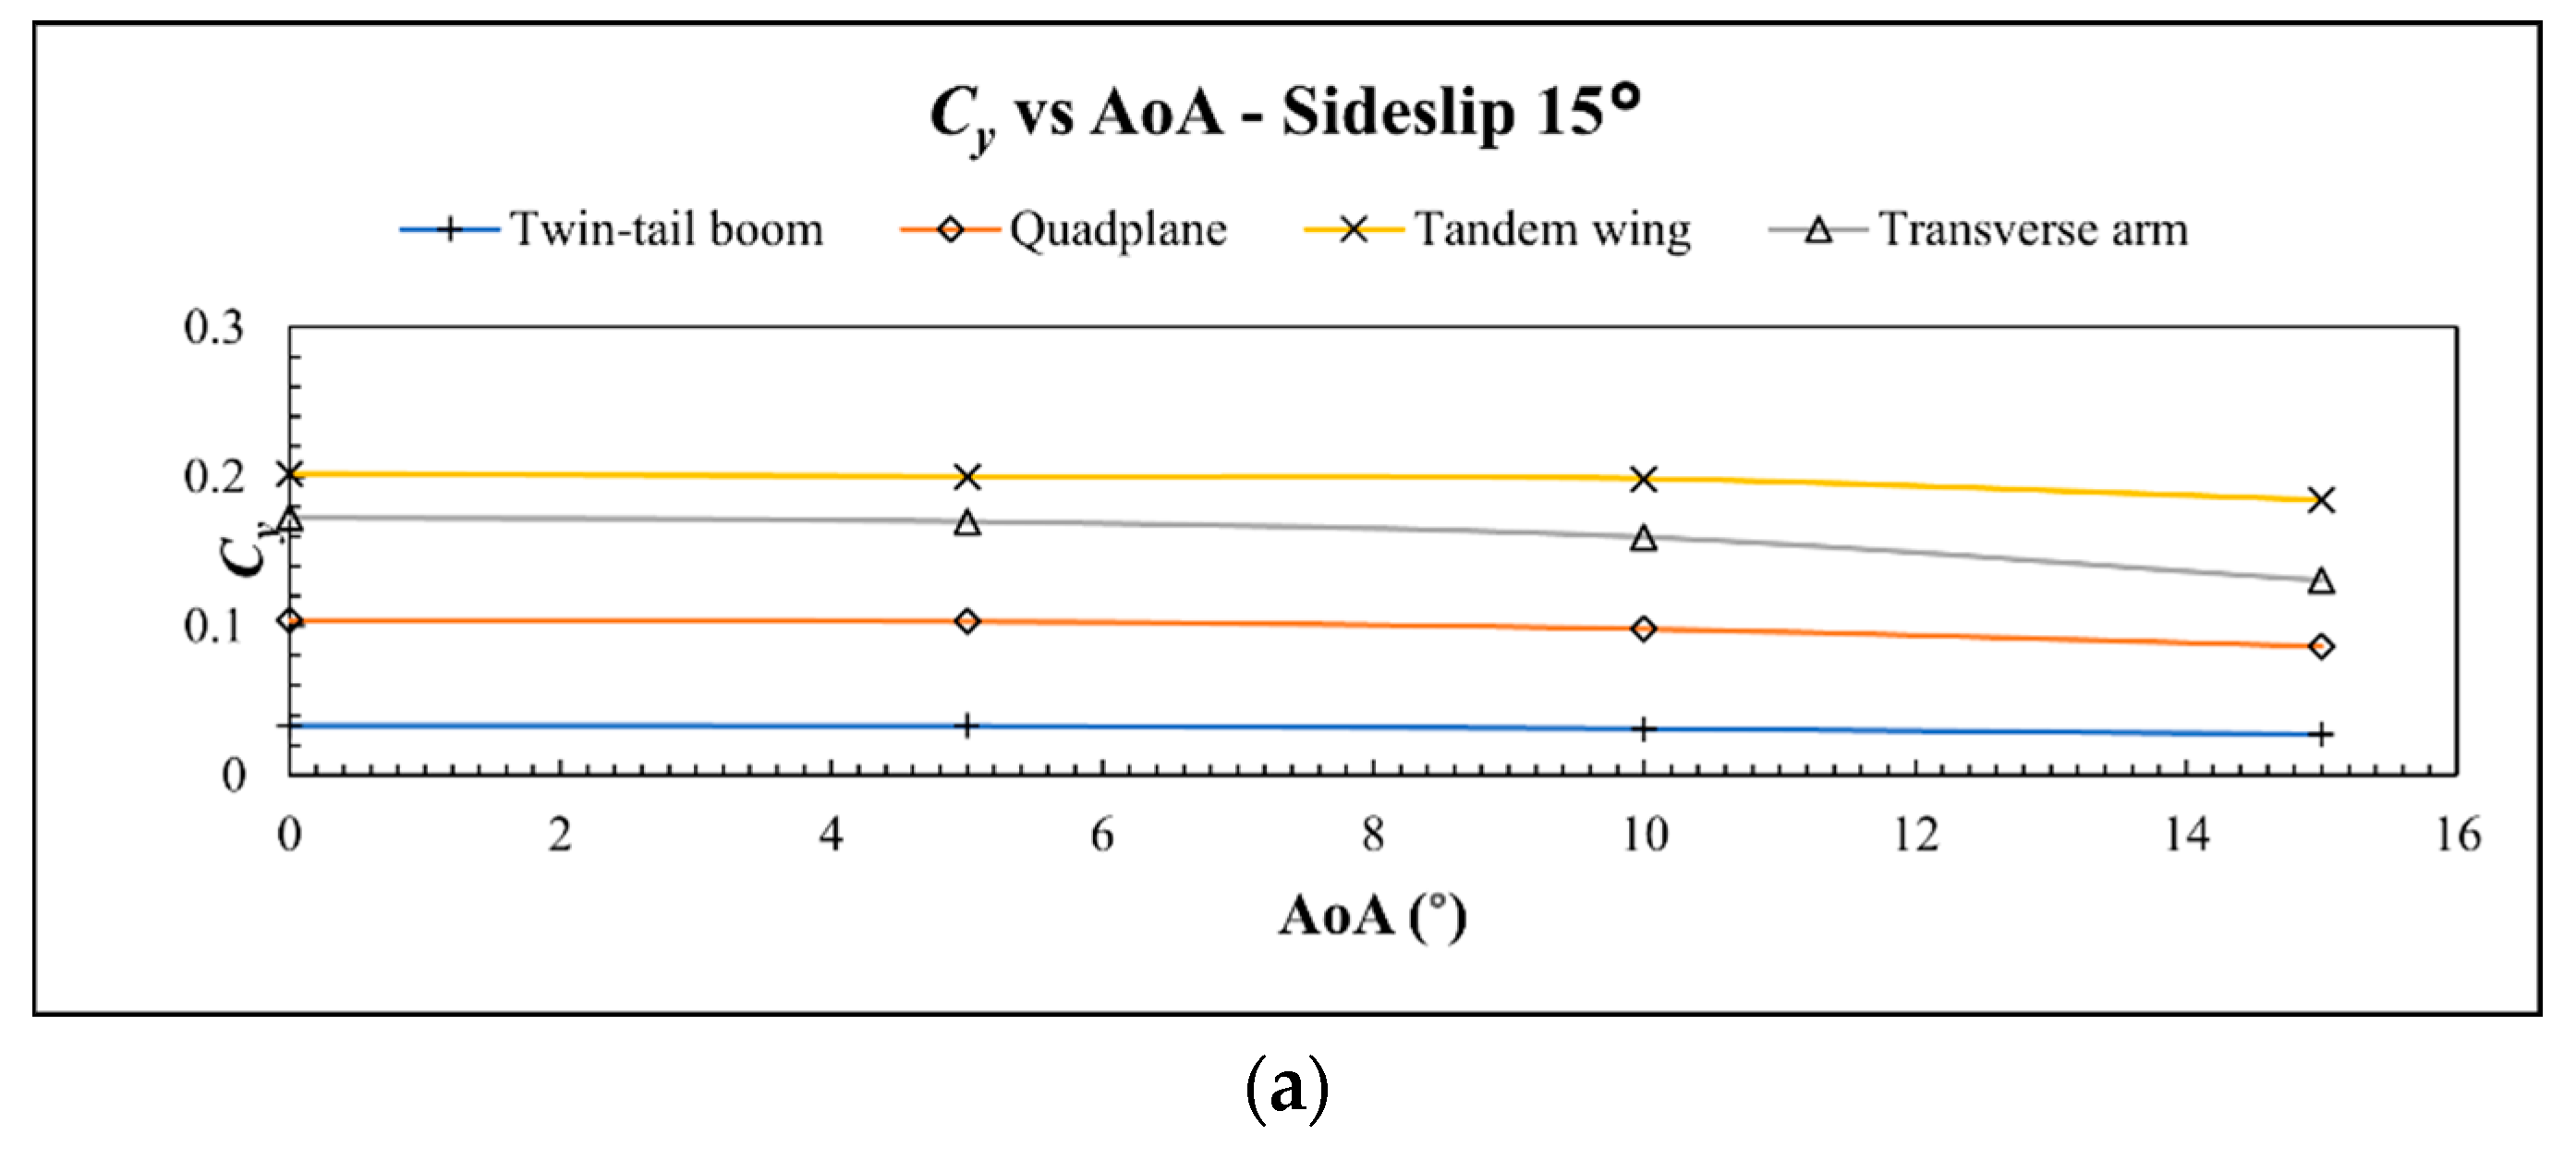
Figure 24 depicts the C
y values of the VTOL plane. It was found that in crosswind conditions, C
y values generally decreased as the AoA increased. This means that a higher AoA leads to better stability of the aircraft on the vertical axis. The sideslip angle also affected this phenomenon, as depicted in
Figure 24; in the 15° sideslip angle, C
y values decreased as the AoA increased, but not significantly. In contrast, C
y values decreased quite significantly as the AoA increased at a 30° sideslip angle.
As depicted by
Figure 24a, the twin-tail boom was the most directionally stable in a crosswind condition with a 15° sideslip angle, followed by the quad-plane configuration, although the difference was quite significant, which means that the twin-tail boom was far superior. The tandem wing was the most unstable configuration, caused by the extra wing. The transverse wing also performed poorly, not far off from the C
y values of the tandem wing. However, at 15° AoA in both 15° and 30° sideslip angles, the transverse arm’s C
y values dropped, which means the aircraft became more stable. Nevertheless, it was still outperformed by the twin-tail boom and quad-plane configurations.
Figure 24b shows the C
y values in a crosswind condition with a 30° sideslip angle. It further validates that the performance ranking from the most stable to the least was the twin-tail boom, the quad-plane, the transverse arm, and the tandem wing configuration.
After analyzing the coefficients of moment acting on the aircraft on the longitudinal, lateral, and vertical axis and comparing the stability performance, it was determined that the twin-tail boom configuration was the most stable overall in headwind and crosswind conditions. The extra surface of the tandem wing and the transverse arm resulted in a less stable aircraft. However, the transverse arm’s extra surface was a stabilizer that granted better control authority and could be used to counteract the aircraft’s tendencies to pitch, roll, and yaw. On the other hand, the extra surface on the tandem wing configuration was a lifting surface, and it became a problem for stability and controllability, as predicted.
3.4. Maneuverability Performance
Maneuverability is an aircraft’s ability to maneuver. An aircraft with better maneuverability can execute more extreme maneuvers without stalling. Determining good maneuverability can be executed by analyzing the turn radius an aircraft makes. An aircraft turns by moving the aileron in opposite directions on the right and the left side of the wing, generating different lifting forces. The difference in lifting forces banks the aircraft depending on which way the aircraft wants to turn. In this study, the VTOL plane was analyzed at 10°, 20°, 30°, and 40° bank angles.
Before the turn radius was calculated, the ability of the aircraft to turn at the predetermined bank angles must be analyzed. Using Equation (17), the maximum bank angle of the VTOL plane was determined. The maximum bank angle was described as the bank angle at which the aircraft’s lifting forces could still fully support the aircraft’s weight. If the aircraft’s maximum bank angle was more than the predetermined bank angles, the turn radius was calculated using Equation (16).
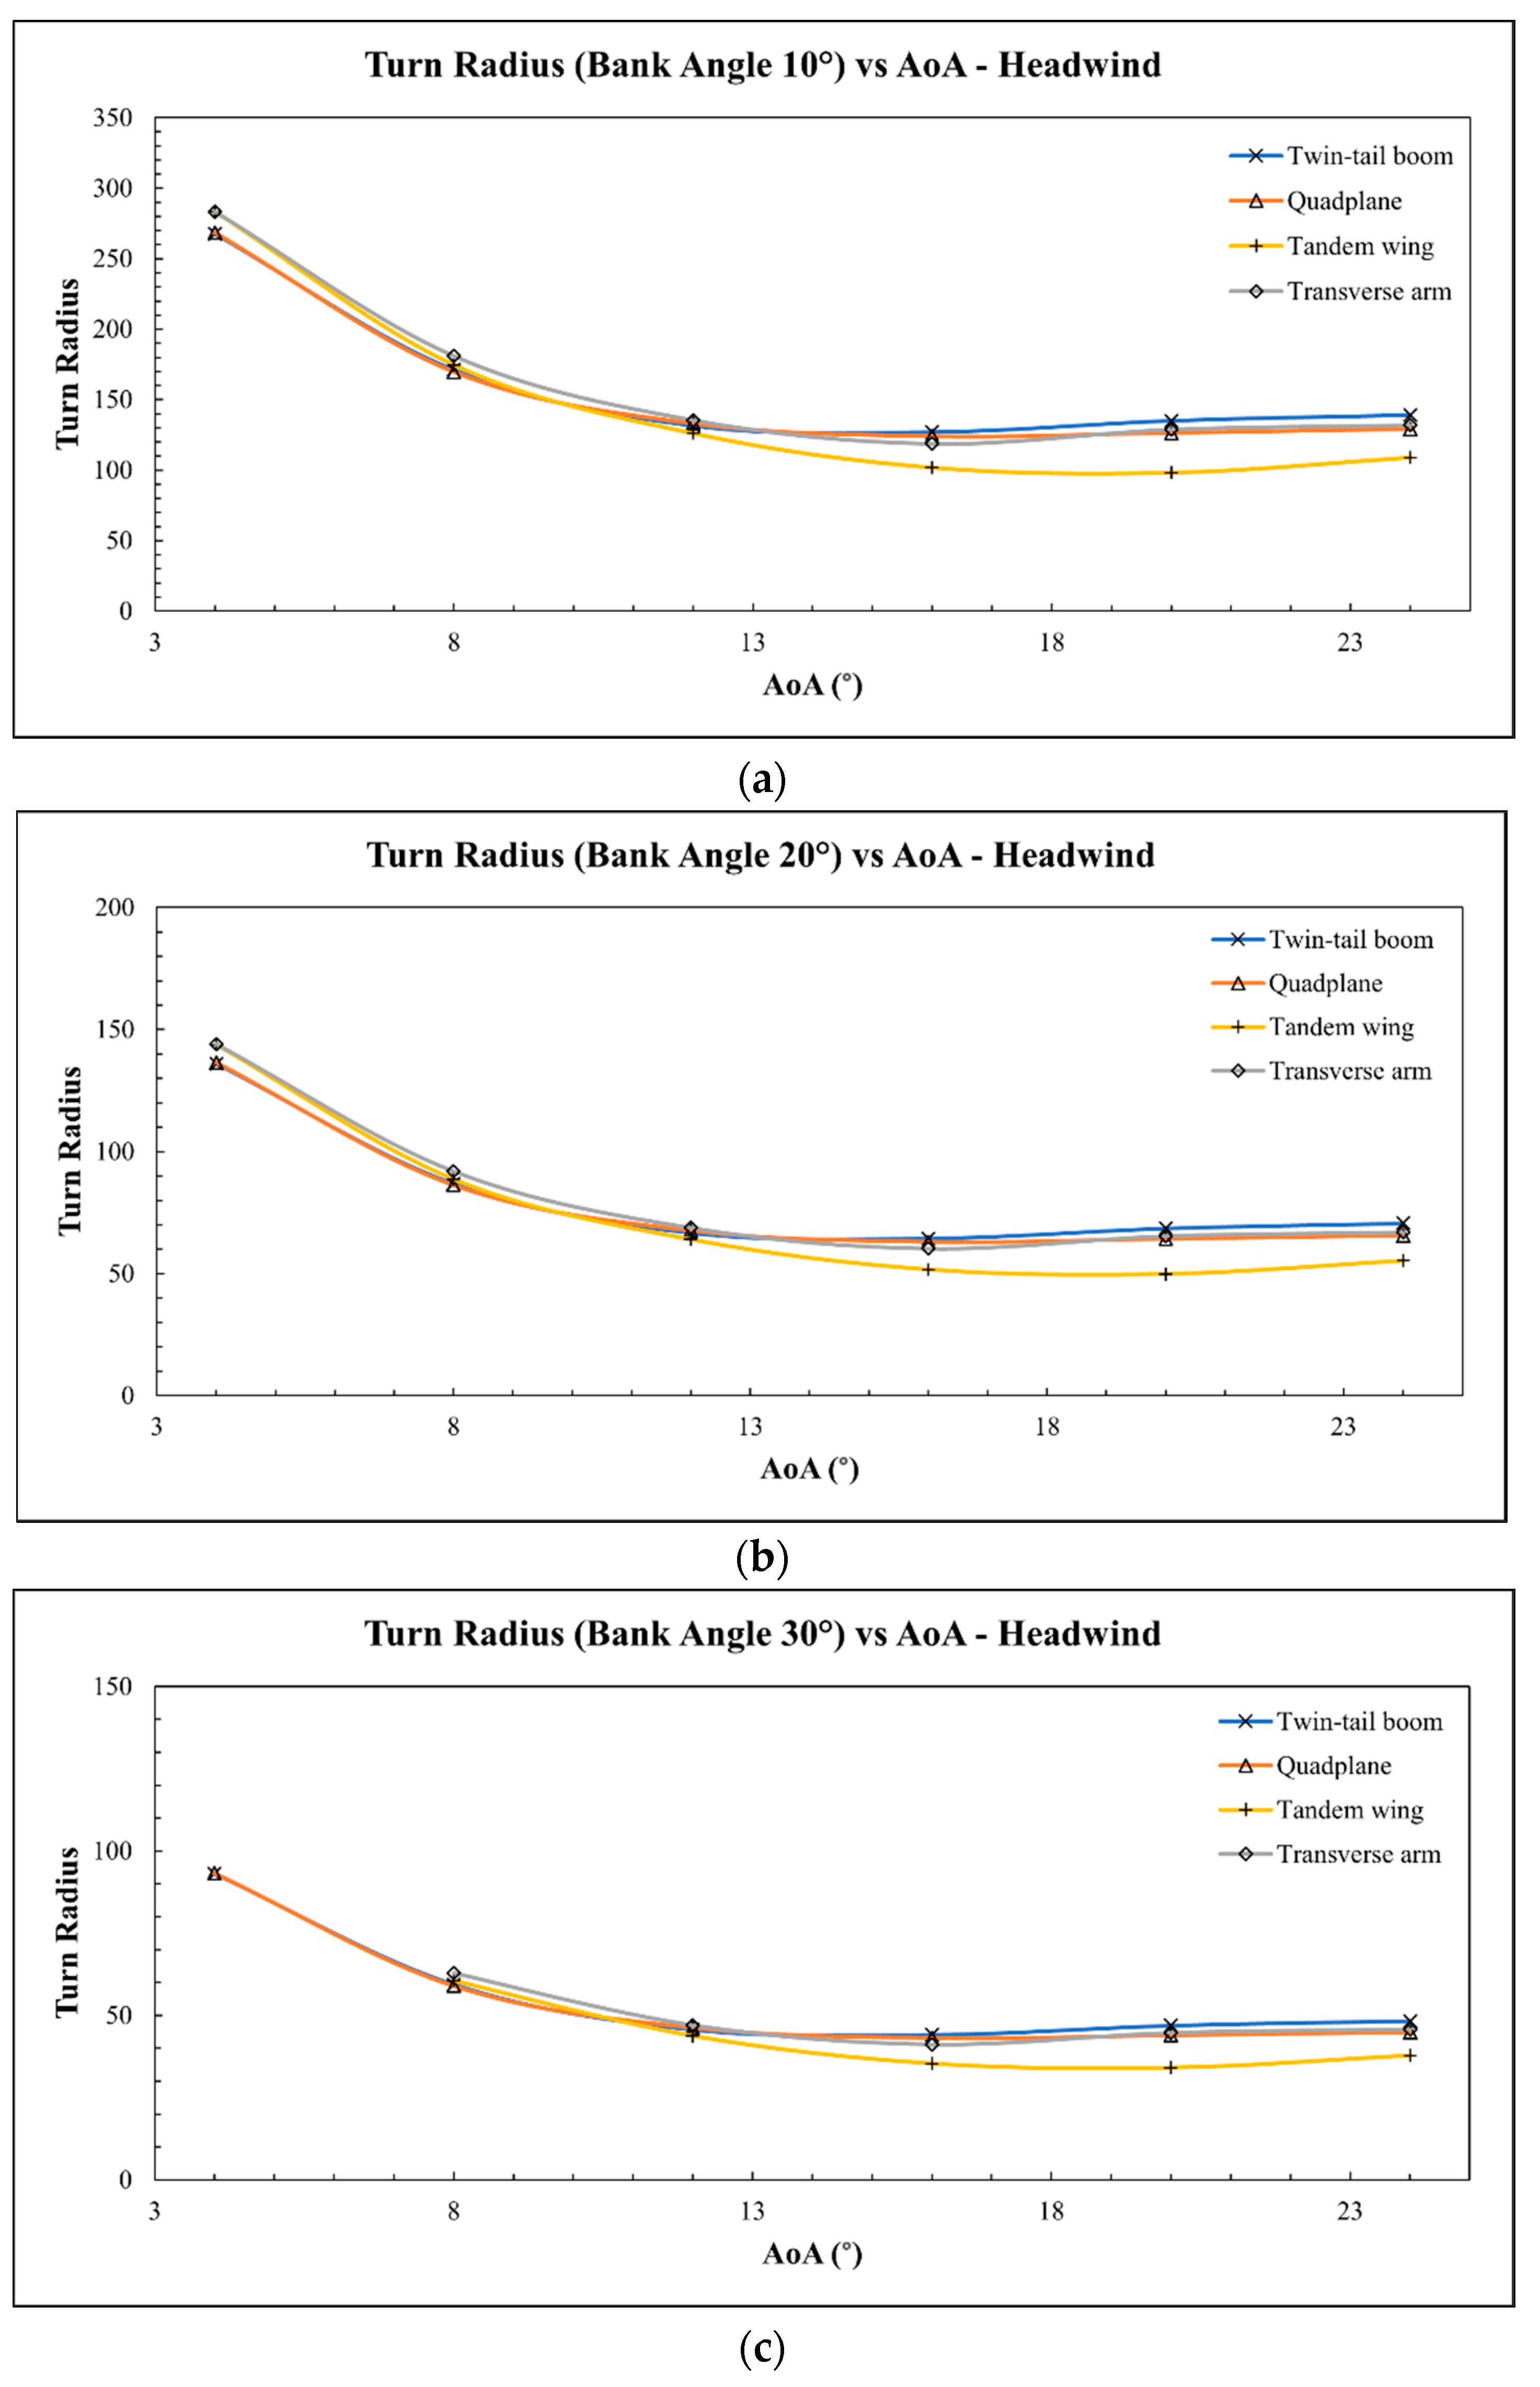
Figure 25 depicts each configuration’s turn radius data in headwind conditions. The twin-tail boom and quad-plane configuration had the tightest turn radius at low AoA. Meanwhile, the tandem wing outperformed both configurations with an AoA greater than 12°. The tandem wing and the transverse arm did not have sufficient lifting force at 4° AoA and 30° bank angle, while the twin-tail boom and the quad-plane already had a sufficient lift in the same condition. The smallest turn radius was 26.5 m, made by the tandem wing configuration at a 40° bank angle and 20° AoA.
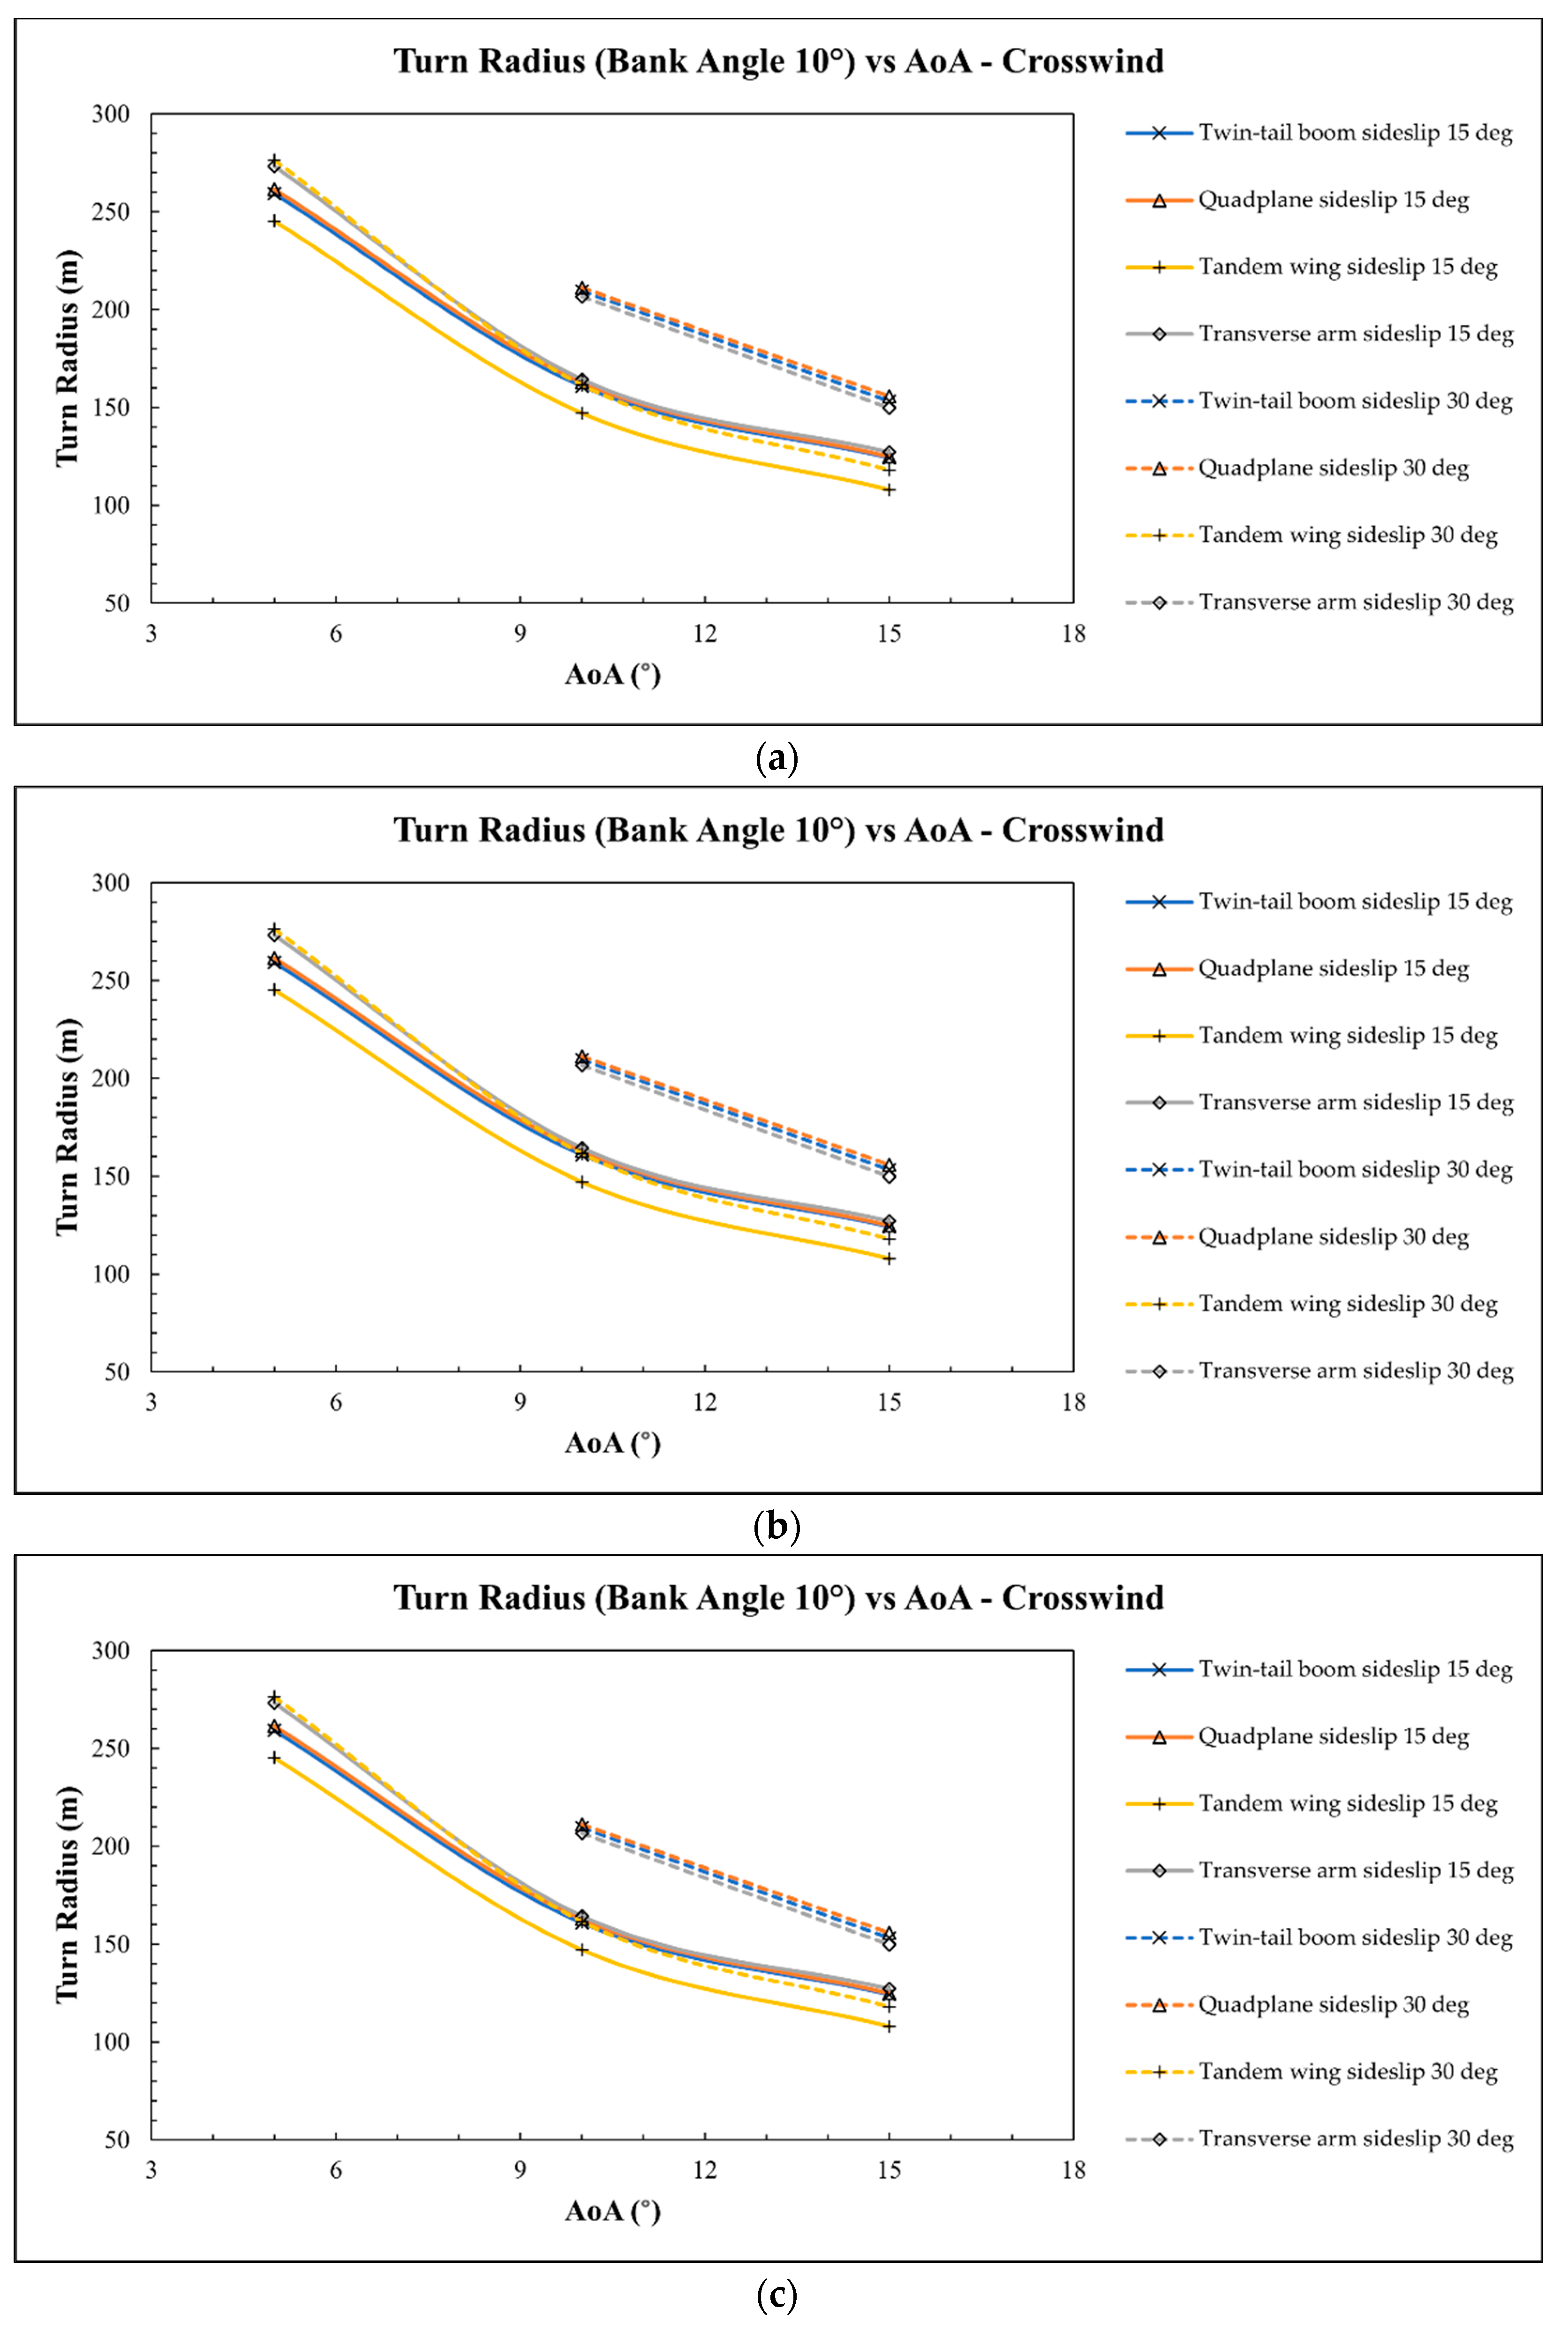
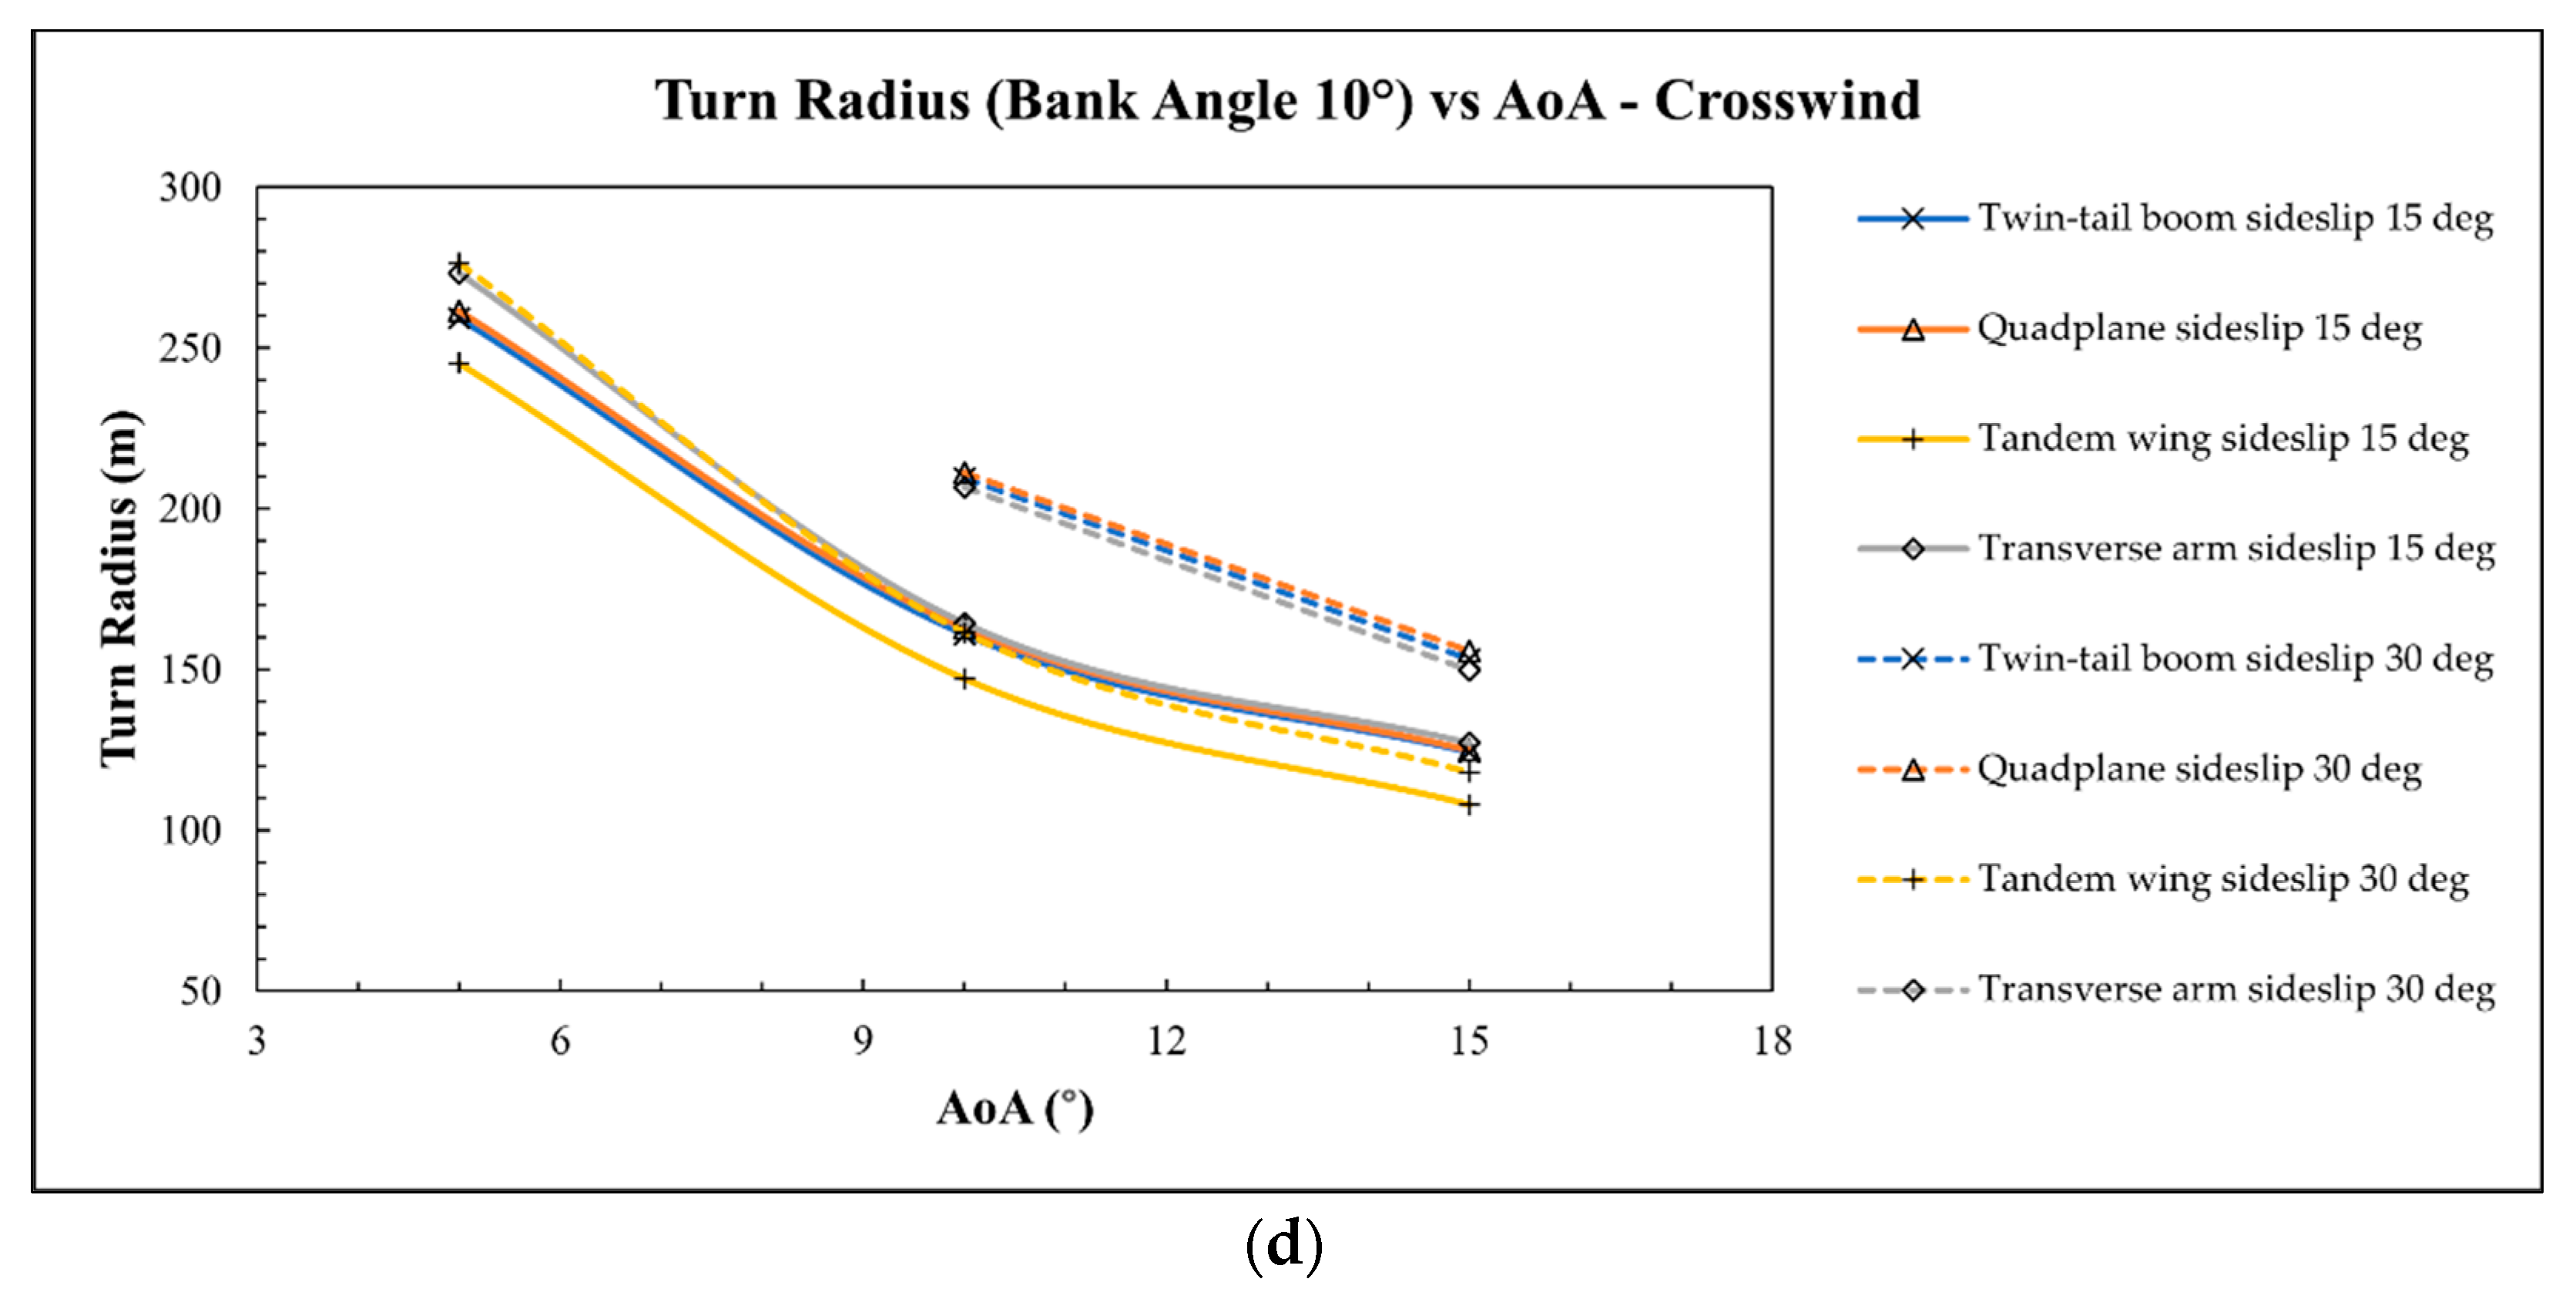
Figure 26 depicts the maneuverability performance of the VTOL plane in crosswind conditions. The results in
Figure 26a show that at a 15° sideslip angle, the VTOL plane needed to pitch up to 5° AoA to execute the turn at 0°–30° bank angles without stalling. Furthermore, the transverse arm needed to pitch up more to 10° AoA to turn at a 30° bank angle. To turn at a 40° bank angle, the VTOL plane needed a 10° AoA to generate enough lift. The smallest turn radius, 29.2 m, was made by the tandem wing and occurred at a 40° bank angle and a 15° AoA. The transverse arm had poor maneuverability performance in this condition, already stalling at a 30° bank angle and 5° AoA, while the other configurations could turn in the same conditions without stalling.
Figure 26b shows the superiority of the tandem wing further as it could execute 10° and 20° bank angle turns at 5° AoA in crosswind conditions with a 30° sideslip angle without stalling. The other configurations could not complete this feat and needed a 10° AoA to execute a turn at the same bank angle and crosswind conditions. The smallest turn radius at a 30° sideslip angle in crosswind conditions was 31.9 m by the tandem wing at a 40° bank angle and a 15° AoA.
Overall, the tandem wing was far superior to the other configurations in terms of maneuverability. As could be seen in
Figure 26b, at a 30° sideslip angle, where all configurations generated less lift, the tandem wing matched the turn radius of other configurations at the same bank angle but at a 15° sideslip angle. The tandem wing and the quad-plane exhibited good maneuverability performance in headwind conditions at lower AoA but struggled in crosswind conditions. The transverse arm performed poorly in headwind conditions but outperformed the twin-tail boom and the quad-plane in crosswind conditions with a 30° sideslip angle.
4. Discussion
This study compared the aerodynamic performance of a VTOL plane with different VTOL arm configurations. The twin-tail boom had the best lifting performance at lower AoA in headwind and crosswind conditions but was outperformed by the tandem wing at high AoA. Overall, the tandem wing had the best lifting performance due to an extra lifting surface, especially at greater AoA where the hind wing gets clean air, unobstructed by the forewing. That superior lifting performance gave the tandem wing good maneuverability. However, the extra surface generated more drag and caused inefficiency in headwind conditions.
In terms of efficiency, the quad-plane performed the best at low AoA in headwind conditions, as could be seen by the L/D values. The twin-tail boom matched the quad-plane’s efficiency starting from 8° AoA. The quad-plane and the twin-tail boom were superior in efficiency because of the streamlined geometry that does not have any extra surfaces as in the transverse arm and the tandem wing. However, in crosswind conditions, the quad-plane, the twin-tail boom, and the transverse arm lost a lot of lift force, so the tandem wing was more efficient due to the extra wing generating high lifting forces capable of overcoming the drag force.
As the stall speed was directly affected by the generated lifting force, the tandem wing had the lowest stall speed. Low stall speed was needed to stabilize the aircraft during the transition from hovering to forward flight and vice versa. The twin-tail boom and the quad-plane matched the tandem wing’s stall speed at low AoA in all conditions. The transverse arm had the highest stall speed at 0° AoA, which made it a poor performance as the VTOL plane’s wing needs level (0° AoA) to make a smooth and stable transition.
Stability is crucial for every aircraft. The simulation results showed that the quad-plane configuration was the most stable longitudinally in headwind and crosswind conditions, although the twin-tail boom and the transverse arm also did not perform poorly. On the other hand, the tandem wing was the most unstable. Due to the center of gravity being in between the fore- and hind wings, any difference in lift generated by the two wings could cause major longitudinal stability problems.
The difference between the transverse arm and the tandem wing is the extra surface in the transverse arm configuration is a stabilizer with symmetrical airfoil. Symmetrical airfoil generates less lift than asymmetrical airfoil. Hence, the extra surface of the tandem wing configuration, which is a wing with an asymmetrical airfoil, generates more lift at a distance from the center of gravity, causing stability problems. Moreover, a control surface, namely the elevator, could be used to counter-moment the aircraft and keep the aircraft stable while cruising. Even so, the pitch moment of the tandem wing was bigger to begin with. An elevator needs to generate sufficient moment only to counter it, reducing the pitching authority of the controller.
In crosswind conditions, the twin-tail boom was the most stable. Contrarily, the tandem wing was the most unstable on the lateral and vertical axes. High Cr and Cy meant that the tandem wing tended to roll and yaw extremely because of the crosswind and was unable to maintain its position. Overall, having an extra lifting surface would cause an unstable flight.
Depending on the mission, maneuverability could be important as well, although the fixed-wing VTOL is an unlikely configuration choice for a UAV with a high maneuverability requirement. Analysis of maneuverability is still crucial, though, to understand the designed aircraft’s capabilities so that risky flight parameters can be avoided. A too extreme bank angle could end in the aircraft stalling. A banking aircraft also generates less lift than a level one, which means an aircraft would need to pitch up more to generate sufficient lift, adding risks of stalling.
The simulation showed that in headwind conditions and low AoA, the twin tail boom and the quad-plane performed the best. At AoA greater than 10°, the tandem wing outperformed both. The transverse arm had the worst maneuverability in headwind conditions and was the most prone to stalling. In crosswind conditions, the tandem wing was far superior and outperformed the other configurations. Moreover, the transverse arm was better at a 30° sideslip angle than the twin-tail boom and the quad-plane. Overall, the tandem wing had the best maneuverability due to its superior lifting capabilities. The twin-tail boom performed well in a headwind condition but quite poorly in a high sideslip angle crosswind condition.
In general, the twin-tail boom configuration had the most favorable aerodynamic performance. The twin-tail boom had good lifting capabilities at low AoA and low drag overall. The twin-tail boom was also efficient according to its L/D data. Furthermore, even though the tandem wing had extra lifting surface, the twin-tail boom matched the tandem wing’s stall speed at low AoA in headwind and crosswind conditions. A VTOL plane rarely needs to pitch up to a big AoA for climbing because the VTOL motors take the aircraft vertically to or nearly to its cruising altitude. As could be seen from the simulation results, the twin-tail boom generally had good aerodynamic performance at low AoA, which made it a suitable arm configuration for a VTOL plane. As such, many VTOL plane UAVs using the twin-tail boom configuration can be found in the public market [
7,
8,
9] because it is suitable for monitoring missions in the agriculture and forestry fields.
The quad-plane performed slightly worse than the twin-tail boom in lateral and directional stability, but had better efficiency in level flight. As such, the quad-plane is suitable for surveillance missions [
6], such as in a military or a search-and-rescue operation, which require longer range but still stable flight. The tandem wing could be chosen for missions that demand extreme maneuverability in exchange for its efficiency and stability. The transverse arm did not perform outstandingly relative to the other configuration. It is not as mature an idea as the others, but it showed promising performance in longitudinal stability. Future revision to and development of the concept is needed to make it feasible for a VTOL-plane design.
5. Conclusions
This study examined four arm configurations for a VTOL plane and compared their aerodynamic performance. A CFD simulation was carried out to obtain the data in headwind and crosswind conditions. The data were used to calculate several parameters, such as the aerodynamic coefficients, moment coefficients, stalling conditions, and maneuverability performance. Upon analyzing the parameters, it was found that the twin-tail boom is the most suitable configuration for a VTOL plane, especially at a low angle of attack. The twin-tail boom has desirable lifting capabilities, efficiency, maneuverability, and stability in crosswind conditions. The quad-plane and the tandem wing are suitable for some specific demanding missions. Meanwhile, the transverse arm still needs further development to be implemented. Each configuration has its own infirmity, which could be increased by proper tuning and control input.
Author Contributions
Conceptualization, G.N.; data curation, Y.D.H.; formal analysis, G.Z.; funding acquisition, G.N.; investigation, G.Z.; methodology, G.N.; project administration, G.Z.; software, Y.D.H.; supervision, G.N. and G.Z.; validation, Y.D.H.; visualization, Y.D.H.; writing—original draft, Y.D.H.; writing—review and editing, G.N. All authors have read and agreed to the published version of the manuscript.
Funding
This research was funded by Penelitan Terapan Unggulan Perguruan Tinggi (PTUPT), grant number: No. 1692/UN1/DITLIT/Dit-Lit/PT.01.03/2022.
Data Availability Statement
Not applicable.
Acknowledgments
The authors would like to thank the Department of Mechanical and Industrial Engineering, Faculty of Engineering, Universitas Gadjah Mada and Penelitian Terapan Unggulan Perguruan Tinggi (PTUPT), Directorate-General of Higher Education, Ministry of Education, Culture, Research, and Technology.
Conflicts of Interest
The authors declare no conflict of interest.
References
- Miller, C.; Chadwick, S. Military Unmanned Aerial Vehicles and Diversification Opportunities; Mississippi Defense Diversification Initiative–Technical Report; United States Department of Defense Office of Economic Adjustment: Arlington, VA, USA, 2018; pp. 4–7. [Google Scholar] [CrossRef]
- Banu, T.P.; Borlea, G.F.; Banu, C. The Use of Drones in Forestry. J. Environ. Sci. Eng. B 2016, 5, 557–562. [Google Scholar] [CrossRef]
- Kotlinski, M.; Calkowska, J.K. U-Space and UTM Deployment as an Opportunity for More Complex UAV Operations Including UAV Medical Transport. Intell. Robot. Syst. 2022, 106, 12. [Google Scholar] [CrossRef]
- Sziroczak, D.; Rohacs, D.; Rohacs, J. Review of Using Small UAV Based Meteorological Measurements for Road Weather Management. Prog. Aerosp. Sci. 2022, 134, 100859. [Google Scholar] [CrossRef]
- Filippone, A. Flight Performance of Fixed and Rotary Wing Aircraft; In Elsevier Aerospace Engineering Series, 1st ed.; Butterworth-Heinemann: Boston, MA, USA, 2006; ISBN 978-0-7506-6817-0. [Google Scholar]
- ViewPro AZH2600V. Available online: https://www.viewproonline.com/products/azh2600v-vtol-drone-vertical-take-off-and-landing-industry-application-uavs-more-than-3-hours-flight-time (accessed on 25 September 2022).
- ALTI Ascend. Available online: https://www.ssass.co.za/alti-ascend (accessed on 25 September 2022).
- ALTI Transition. Available online: https://www.ssass.co.za/alti-transition (accessed on 25 September 2022).
- Foxtech Great Shark 330. Available online: https://www.foxtechfpv.com/foxtech-great-shark-330-vtol.html (accessed on 25 September 2022).
- Okulski, M.; Ławryńczuk, M. A Small UAV Optimized for Efficient Long-Range and VTOL Missions: An Experimental Tandem-Wing Quadplane Drone. Appl. Sci. 2022, 12, 7059. [Google Scholar] [CrossRef]
- Foxtech Altair 370. Available online: https://www.foxtechfpv.com/foxtech-altair-370-tandem-wing-hybrid-vtol.html (accessed on 25 September 2022).
- Czyba, R.; Lemanowicz, M.; Gorol, Z.; Kudala, T. Construction Prototyping, Flight Dynamics Modeling, and Aerodynamic Analysis of Hybrid VTOL Unmanned Aircraft. J. Adv. Transp. 2018, 2018, 7040531. [Google Scholar] [CrossRef]
- Min, K.-M.; Chia, F.-Y.; Kim, B.-H. Design and CFD Analysis of A Low-Altitude VTOL UAV. Int. J. Mech. Prod. Eng. Res. Dev. 2019, 9, 555–562. [Google Scholar] [CrossRef]
- Rosid, N.H.; Lukman, E.I.; Fadlillah, M.A.; Moelyadi, M.A. Aerodynamic Characteristics of Tube-Launched Tandem Wing Unmanned Aerial Vehicle. J. Phys. Conf. Ser. 2018, 1005, 012015. [Google Scholar] [CrossRef]
- Gigacz, R.; Mohamed, A.; Poksawat, P.; Panta, A.; Watkins, S. Exploring Tandem Wing UAS Designs for Operation in Turbulent Urban Environments. Int. J. Micro Air Veh. 2018, 10, 254–261. [Google Scholar] [CrossRef]
- Brinkworth, B.J. On the Aerodynamics of the Miles Libellula Tandem-Wing Aircraft Concept, 1941–1947. J. Aeronaut. Hist. 2016, 2, 10–58. [Google Scholar]
- Austin, R. Unmanned Aircraft Systems: UAVs Design, Development and Deployment; In AIAA Education Series, 1st ed.; American Institute of Aeronautics and Astronautics; Wiley: Reston, VA, USA; Chichester, UK, 2010; ISBN 978-1-60086-759-0. [Google Scholar]
- Roskam, J. Airplane Design Part I: Preliminary Sizing of Airplanes, 1st ed.; DARcorporation: Lawrence, KS, USA, 1986; ISBN 978-1-884885-42-6. [Google Scholar]
- Roskam, J.; Lan, C.-T.E. Airplane Aerodynamics and Performance, 1st ed.; DARcorporation: Lawrence, KS, USA, 1997; ISBN 978-1-884885-44-0. [Google Scholar]
- Raymer, D.P. Aircraft Design: A Conceptual Approach; In AIAA Education Series, 6th ed.; American Institute of Aeronautics and Astronautics, Inc.: Reston, VA, USA, 2018; ISBN 978-1-62410-490-9. [Google Scholar]
- Sadraey, M.H. Aircraft Design: A Systems Engineering Approach; In Aerospace Series, 1st ed.; Wiley: Chichester, West Sussex, UK, 2013; ISBN 978-1-119-95340-1. [Google Scholar]
- Anderson, J.D. Aircraft Performance and Design, 1st ed.; WCB/McGraw-Hill: Boston, MA, USA, 1999; ISBN 978-0-07-001971-3. [Google Scholar]
- Van Nguyen, N.; Tyan, M.; Lee, J.W.; Kim, S. Investigations on Stability and Control Characteristics of a CS-VLA Certified Aircraft Using Wind Tunnel Test Data. Proc. Inst. Mech. Eng. Part G J. Aerosp. Eng. 2016, 230, 2728–2743. [Google Scholar] [CrossRef]
- Popowski, S.; Dąbrowski, W. Measurement and Estimation of the Angle of Attack and the Angle of Sideslip. Aviation 2015, 19, 19–24. [Google Scholar] [CrossRef]
- Yu, S.; Kwon, Y. Development of VTOL Drone for Stable Transit Flight. J. Comput. Commun. 2017, 05, 36–43. [Google Scholar] [CrossRef][Green Version]
- Civil Aviation Safety Regulation (CASR) Part 107. Available online: https://terra-drone.co.id/wp-content/uploads/2020/04/CASR-Part-107.pdf (accessed on 13 September 2022).
- Heitmeyer, J.C. Effect of Vertical Position of the Wing on the Aerodynamic Characteristics of Three Wing-Body Combinations; Research Memorandum, National Advisory Committee for Aeronautics: Washington, DC, USA, 1953. [Google Scholar]
- Musa, N.A.; Mansor, S.; Ali, A.; Omar, W.Z.W.; Latif, A.A.; Perumal, K. Effects of Aircraft Tail Configurations on Sensitivity to Yaw Disturbances. Appl. Mech. Mater. 2014, 629, 197–201. [Google Scholar] [CrossRef]
- Minardo, A. The Tandem Wing: Theory, Experiments and Practical Realisations. Master’s Thesis, Politecnico DI Milano, Milan, Italy, 2014. [Google Scholar]
- Cheng, H.; Wang, H. Prediction of Lift Coefficient for Tandem Wing Configuration or Multiple-Lifting-Surface System Using Prandtl’s Lifting-Line Theory. Int. J. Aerosp. Eng. 2018, 2018, 3104902. [Google Scholar] [CrossRef]
- Clancy, L.J. Aerodynamics, 1st ed.; Wiley: New York, NY, USA, 1975; ISBN 978-0-470-15837-1. [Google Scholar]
- Mesh Quality & Advance Topics 2022. Available online: https://featips.com/wp-content/uploads/2021/05/Mesh-Intro_16.0_L07_Mesh_Quality_and_Advanced_Topics.pdf (accessed on 18 October 2022).
- ANSYS Inc. ANSYS Fluent User’s Guide; Release 19.2; ANSYS Inc.: Canonsburg, PA, USA, 2018. [Google Scholar]
Figure 1.
Definition of angle of attack and angle of sideslip.
Figure 1.
Definition of angle of attack and angle of sideslip.
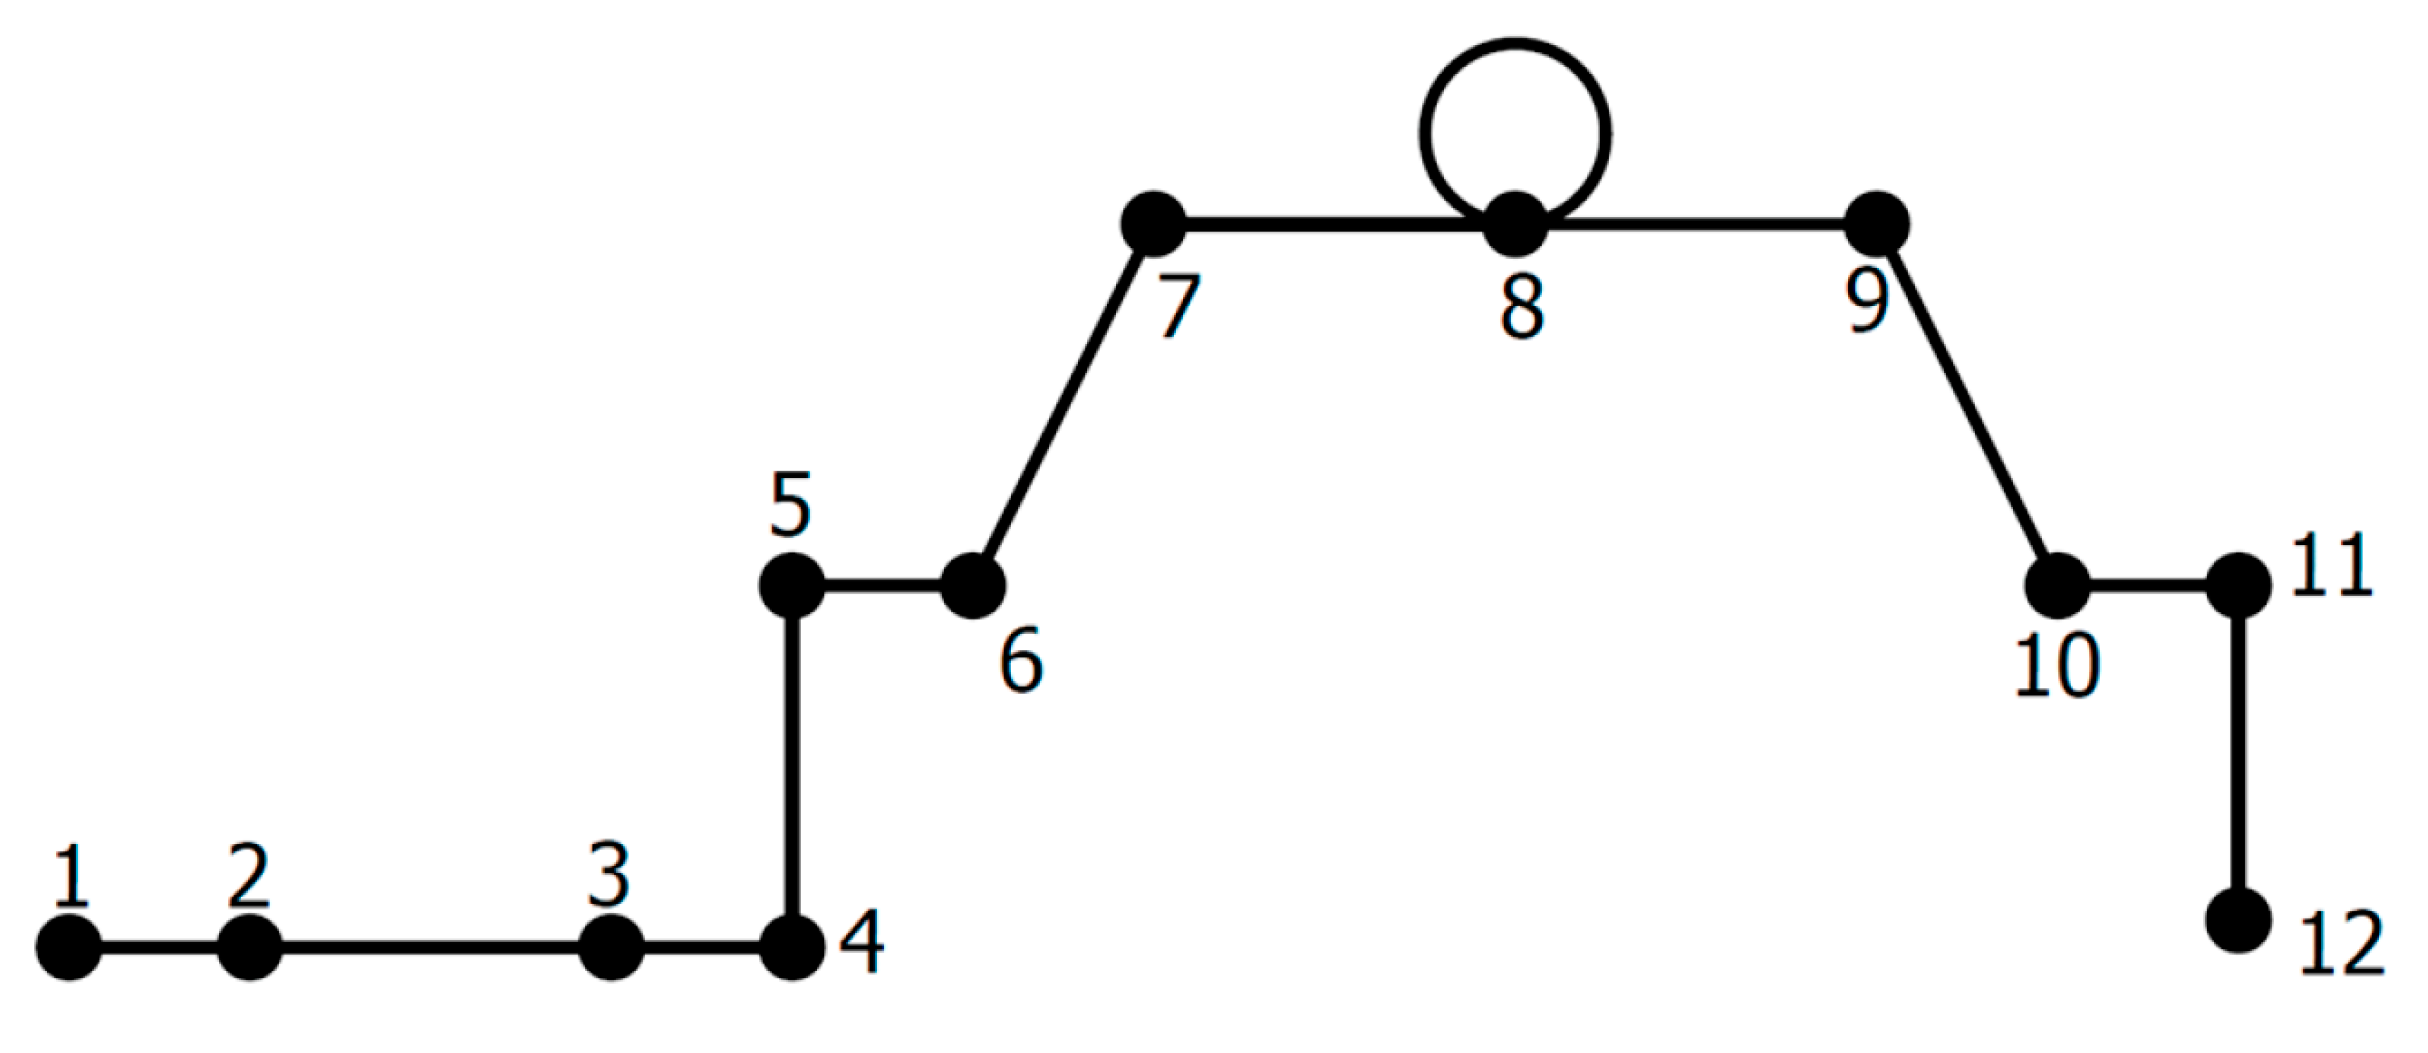
Figure 2.
VTOL plane mission profile. Note: 1—ground test; 2—engine start and warm up; 3—VTOL take-off preparation; 4—VTOL take-off; 5—VTOL transition to forward flight; 6—Climb; 7—cruise; 8—loiter and cruise back; 9—descent; 10—forward flight transition to VTOL; 11—VTOL landing; 12—engine shutdown and ground test.
Figure 3.
Performance sizing graph.
Figure 3.
Performance sizing graph.
Figure 4.
Wing planform design in mm.
Figure 4.
Wing planform design in mm.
Figure 5.
Schematic drawing of the VTOL motors’ position.
Figure 5.
Schematic drawing of the VTOL motors’ position.
Figure 6.
Three-dimensional model of the VTOL plane with a twin-tail boom configuration.
Figure 6.
Three-dimensional model of the VTOL plane with a twin-tail boom configuration.
Figure 7.
Three-dimensional model of the VTOL plane with a quad-plane configuration.
Figure 7.
Three-dimensional model of the VTOL plane with a quad-plane configuration.
Figure 8.
Schematic drawing of the tandem wing configuration.
Figure 8.
Schematic drawing of the tandem wing configuration.
Figure 9.
Three-dimensional model of the VTOL plane with the tandem wing configuration.
Figure 9.
Three-dimensional model of the VTOL plane with the tandem wing configuration.
Figure 10.
Schematic drawing of the transverse arm configuration.
Figure 10.
Schematic drawing of the transverse arm configuration.
Figure 11.
Three-dimensional model of the VTOL lane with a transverse arm configuration.
Figure 11.
Three-dimensional model of the VTOL lane with a transverse arm configuration.
Figure 12.
Free-body diagram of the aircraft.
Figure 12.
Free-body diagram of the aircraft.
Figure 13.
Mesh results visualization.
Figure 13.
Mesh results visualization.
Figure 14.
Orthogonal quality distribution.
Figure 14.
Orthogonal quality distribution.
Figure 15.
Skewness quality distribution.
Figure 15.
Skewness quality distribution.
Figure 16.
Pressure contours; (a) bottom view at 0° AoA, (b) top view at 0°AoA, (c) bottom view at 16° AoA, and (d) top view at 16° AoA.
Figure 16.
Pressure contours; (a) bottom view at 0° AoA, (b) top view at 0°AoA, (c) bottom view at 16° AoA, and (d) top view at 16° AoA.
Figure 17.
CL and CD in headwind conditions; (a) CL vs. AoA, and (b) CD vs. AoA.
Figure 17.
CL and CD in headwind conditions; (a) CL vs. AoA, and (b) CD vs. AoA.
Figure 18.
CL vs. AoA; sideslip angle: (a) 15°, and (b) 30°.
Figure 18.
CL vs. AoA; sideslip angle: (a) 15°, and (b) 30°.
Figure 19.
L/D vs. AoA; sideslip angle: (a) 0°, (b) 15°, and (c) 30°.
Figure 19.
L/D vs. AoA; sideslip angle: (a) 0°, (b) 15°, and (c) 30°.
Figure 20.
The stall phenomenon visualized by the airflow over the wing at (a) 0° AoA and (b) 24° AoA.
Figure 20.
The stall phenomenon visualized by the airflow over the wing at (a) 0° AoA and (b) 24° AoA.
Figure 21.
Stall speed vs. AoA; sideslip angle: (a) 0°, (b) 15°, (c) 30°.
Figure 21.
Stall speed vs. AoA; sideslip angle: (a) 0°, (b) 15°, (c) 30°.
Figure 22.
Cp vs. AoA; sideslip angle: (a) 0°, (b) 15°, and (c) 30°.
Figure 22.
Cp vs. AoA; sideslip angle: (a) 0°, (b) 15°, and (c) 30°.
Figure 23.
Cr vs. AoA; sideslip angle: (a) 15°, and (b) 30°.
Figure 23.
Cr vs. AoA; sideslip angle: (a) 15°, and (b) 30°.
Figure 24.
Cy vs. AoA; sideslip angle: (a) 15°, and (b) 30°.
Figure 24.
Cy vs. AoA; sideslip angle: (a) 15°, and (b) 30°.
Figure 25.
Maneuverability in headwind conditions; bank angles: (a) 10°, (b) 20°, (c) 30°, and (d) 40°.
Figure 25.
Maneuverability in headwind conditions; bank angles: (a) 10°, (b) 20°, (c) 30°, and (d) 40°.
Figure 26.
Maneuverability in crosswind conditions; bank angle: (a) 10°, (b) 20°, (c) 30°, and (d) 40°.
Figure 26.
Maneuverability in crosswind conditions; bank angle: (a) 10°, (b) 20°, (c) 30°, and (d) 40°.
Table 1.
Design requirements and objectives (DR&O).
Table 1.
Design requirements and objectives (DR&O).
| No | Requirement | Value |
|---|
| 1 | Take-off transition distance | 80 m |
| 2 | Landing transition distance | 150 m |
| 3 | Cruising altitude | 300 m |
| 4 | Cruising velocity | 23 m/s |
| 5 | Stall speed | 14 m/s |
| 6 | Load Weight | 1 kg |
| 7 | Flight time | 6 h |
| 8 | Rate of climb | 5.5 m/s |
| 9 | Maximum take-off weight | 10 kg |
| 10 | Wingspan | 2 m |
Table 2.
Fuel fraction [
17].
Table 2.
Fuel fraction [
17].
| Phase | Value |
|---|
| Engine start and warm-up | 0.998 |
| VTOL take-off preparation | 0.998 |
| VTOL transition to forward flight | 0.998 |
| Climb | 0.995 |
| Cruise | 0.998 |
| Loiter | 0.938 |
| Cruise back | 0.998 |
| Descent | 0.995 |
| Landing, taxi, and shutdown | 0.995 |
Table 3.
Weight sizing.
| VTOL Plane Weight Sizing |
|---|
| Maximum take-ff weight (MTOW) | 10.04 kg |
| Empty airframe weight | 3.5 kg |
| Ready to fly (RTF) dry weight | 6.15 kg |
| Ready to fly (RTF) including fuel and batteries | 9 kg |
| Maximum payload | 1 kg |
| Fuel weight | 1.1 kg |
Table 4.
Performance sizing.
Table 4.
Performance sizing.
| VTOL Plane Performance Sizing |
|---|
| Wing loading (W/S) | 3.6 lb/ft2 = 17.6 kg/m2 |
| Power loading (W/P) | 11.8 lb/hp = 5.4 kg/hp |
| 1.4 |
| 1.3 |
| 1.3 |
Table 5.
Wing design.
| Wing Design |
|---|
| s | 0.57 m2 |
| AR | 7.01 |
| b | 2 m |
| Cr | 0.315 m |
| Ct | 0.215 m |
Table 6.
Empennage design.
Table 6.
Empennage design.
| Empennage Design |
|---|
| Vv | 0.025 |
| Vh | 0.6 |
| Lv | 0.9 m |
| Lh | 1 m |
| Vertical stabilizer root chord (Crvertical) | 0.23 m |
| Vertical stabilizer tip chord (Ctvertical) | 0.157 m |
| Vertical stabilizer span (bvertical) | 0.17 m |
| Horizontal stabilizer root chord (Crhorizontal) | 0.157 m |
| Horizontal stabilizer tip chord (Cthorizontal) | 0.157 m |
| Horizontal stabilizer span (bhorizontal) | 0.662 m |
Table 7.
V-tail design for the quad-plane configuration.
Table 7.
V-tail design for the quad-plane configuration.
| V-Tail Design. |
|---|
| Γ | 36.54° |
| V-tail root chord (CrV-tail) | 0.2 m |
| V-tail tip chord (CtV-tail) | 0.14 m |
| V-tail span (bV-tail) | 0.53 m |
Table 8.
Tandem wing sizing.
Table 8.
Tandem wing sizing.
| Tandem Wing Sizing |
|---|
| Stagger (St) | 0.86 m |
| Γ | 35° |
| V-tail root chord (CrV-tail) | 0.1 m |
| V-tail tip chord (CtV-tail) | 0.07 m |
| V-tail span (bV-tail) | 0.256 m |
Table 9.
Transverse arm sizing.
Table 9.
Transverse arm sizing.
| Transverse Arm Sizing |
|---|
| Canard area (Sc) | 0.077 m2 |
| Canard chord (Cc) | 0.13 m |
| Canard span (bc) | 0.59 m |
| Horizontal tailplane area (Sh) | 0.107 m2 |
| Horizontal tailplane chord (Ch) | 0.18 m |
| Horizontal tailplane span (bh) | 0.59 m |
| Vertical tailplane area (Sv) | 0.021 m2 |
| Vertical tailplane root chord (Crv) | 0.13 m |
| Vertical tailplane tip chord (Ctv) | 0.1 m |
| Vertical tailplane span (bv) | 0.21 m |
| Publisher’s Note: MDPI stays neutral with regard to jurisdictional claims in published maps and institutional affiliations. |
© 2022 by the authors. Licensee MDPI, Basel, Switzerland. This article is an open access article distributed under the terms and conditions of the Creative Commons Attribution (CC BY) license (https://creativecommons.org/licenses/by/4.0/).


