Article

Comparison between Field Measured and UAV-Derived Pistachio Tree Crown Characteristics throughout a Growing Season

1
Genome Center, University of California, Davis, CA 95616, USA
2
Department of Environmental Sciences, Policy and Management, University of California, Berkeley, CA 94720, USA
3
Informatics and GIS Statewide Program, Division of Agriculture and Natural Resources, University of California, Davis, CA 95618, USA
4
National Clonal Germplasm Repository, University of California, Davis, CA 95616, USA
5
Foundation Plant Services, University of California, Davis, CA 95616, USA
6
Departments of Plant Sciences, Molecular & Cellular Biology, and Medical Microbiology & Immunology, University of California, Davis, CA 95616, USA
*
Author to whom correspondence should be addressed.
Drones 2022, 6(11), 343; https://doi.org/10.3390/drones6110343
Submission received: 4 October 2022 / Revised: 31 October 2022 / Accepted: 1 November 2022 / Published: 4 November 2022
(This article belongs to the Special Issue UAS in Smart Agriculture)

Abstract

:
Monitoring individual tree crown characteristics is an important component of smart agriculture and is crucial for orchard management. We focused on understanding how UAV imagery taken across one growing season can help understand and predict the growth and development of pistachio trees grown from rootstock seedlings. Tree crown characteristics (i.e., height, size, shape, and mean normalized difference vegetation index (NDVI)) were derived using an object-based image analysis method with multispectral Uncrewed Aerial Vehicles (UAV) imagery flown seven times over 472 five-year-old pistachio trees in 2018. These imagery-derived metrics were compared with field-collected tree characteristics (tree height, trunk caliper, crown height, width and volume, and leaf development status) collected over two months in 2018. The UAV method captured seasonal development of tree crowns well. UAV-derived tree characteristics were better correlated with the field tree characteristics when recorded between May and November, with high overall correlations in November. The highest correlation (R2 = 0.774) was found between trunk caliper and June UAV crown size. The weakest correlations between UAV and field traits were found in March and December. Spring leaf development stage was most variable, and mean NDVI values were lowest in March, when leaf development starts. Mean NDVI increased orchard-wide by May, and was consistently high through November. This study showcased the benefits of timely, detailed drone imagery for orchard managers.

1. Introduction

Smart agriculture approaches that combine agronomy with technological innovation can improve yield quality and quantity by helping farmers to more efficiently manage orchards. One of the most important factors in smart agriculture is monitoring individual tree crown characteristics (e.g., size, shape, and condition), which are crucial for orchard management decision-making [1,2]. Tree crown characteristics can be captured in the field and via remote sensing. Recently, with their commercialization and increasing availability, a key component to smart agriculture is the use of Uncrewed Aerial Vehicles (UAVs; also known as drones), given their ability to provide clear, high resolution images in which individual trees can be discerned. UAVs can be quickly and repeatedly deployed for on-demand remote-controlled or autonomous flights, while being less expensive than piloted aircraft operations. Additionally, UAVs are able to carry multiple sensor configurations (e.g., red-green-blue/RGB, multispectral, hyperspectral, thermal and LiDAR), which can obtain imagery and elevation data that can be processed into a host of geo-referenced products, such as high resolution orthomosaic images, point clouds, digital terrain models (DTMs), digital surface models (DSMs), and canopy height models (CHMs) [3,4,5,6]. These products can be used to map individual tree crown characteristics throughout a growing season. Specifically, imagery and related products (e.g., CHMs) can be used to map the outline of individual trees, and multispectral imagery can be used to create spectral indices like normalized difference vegetation index (NDVI), which can be used to assess tree crown condition. All of these tree crown characteristics have been linked to orchard management activities such as irrigation, fertilization, pesticide and fungicide application, pruning, as well as yield estimation [1,2]. One protocol of mapping individual tree crowns is that of object-based image analysis (OBIA), wherein pixels in high resolution imagery are grouped (or “segmented”) into discrete units (or “image-objects”) of meaningful non-overlapping clusters of neighboring pixels based upon common color, texture, shape and/or elevation characteristics, using a range of algorithms [7,8,9,10,11,12,13]. We used a modified OBIA approach to map individual tree crowns in a pistachio orchard in California throughout the 2018 growing season (see Section 2).
The pistachio nut has been cultivated for human consumption in the Middle East for thousands of years. Production in the US is relatively recent; the first commercial harvest in California was in 1976 [14]. Pistachios are now a major domestic and export crop worth over $1.6 billion annually in the US, as well as a significant contributor to the California economy and contribute to the diversity of the American diet. California recently became the number one producer of pistachio nuts worldwide and accounts for >99% of US production, with the remainder being produced in Arizona and New Mexico (https://americanpistachios.org/growing-and-harvesting/history, accessed on 8 January 2022).
The UCB-1 hybrid is the main pistachio rootstock used in the US, developed by Dr. Lee Ashworth at the University of California, Berkeley [15]. It was originally selected for commercial use because of its resistance to Verticillium wilt and frost tolerance [16] and seeds are produced annually from controlled crosses between specific clones of Pistacia atlantica (female) x P. integerrima (male). The majority of pistachio rootstocks are currently produced from seed and are genetically variable because of segregation in the gametes of each parent. This results in differences in morphology among individual rootstocks and in performance in the field [17,18,19]. In commercial orchards, P. vera cultivars grafted onto UCB-1 rootstocks grow unevenly. Reduced vigor and stunting of some trees are of particular concern to growers because it results in decreased nut yield and/or quality [17,18,19]. Stunted trees usually have smaller trunk calipers and exhibit different branching and growth characteristics. Nurseries commonly rogue as many as 10 to 15% of their UCB-1 seedlings based on early growth parameters, such as tree height and other visual clues. This selection is being made on seedlings that are only a few weeks to months old and before planting in commercial orchards. Our previous data show that such traits in very young trees are poor predictors of size and vigor in older trees and therefore seedling selection based on phenotypic characteristics is unlikely to be effective [18].
In 2013, 960 UCB-1 seedlings were planted in the UC Davis experimental orchard at Russell Ranch. This planting was specifically made to study the degree of phenotypic variation in UCB-1 and to look for superior UCB-1 individuals that might be used as clonal rootstock. In a collaboration between the UC Davis Foundation Plant Services (FPS) and the USDA Agricultural Research Service (ARS)’s National Clonal Germplasm Repository at Davis, field measurements of variability among these F1 individual trees began immediately. During summer 2016, every second tree was removed to provide the remaining 480 trees enough space for further growth. Repeated phenotypic measurements have been made annually since January 2014, including measurements of variation in growth, branching, and active growth period.
This project is focused on understanding how UAV imagery taken multiple times during a growing season can meaningfully help to understand and predict the growth and development of pistachio trees in the experimental Russell Ranch orchard in north central California, USA. Physical field data (gathered February through March of 2018) of various phenotypic traits and UAV imagery (seven missions from March through December) were collected for the 472 pistachio trees at the experimental orchard. Specifically, our objectives were to:
(1)
use UAV-captured data to create a database of all 472 UCB-1 tree crowns in the orchard over the growing season using OBIA methods;
(2)
populate the tree database with tree characteristics measured in the field early in the growing season (i.e., tree height, trunk caliper, crown height, crown width, crown volume, and leaf development) and via UAV imagery analysis captured seven times over the growing season (i.e., crown height, crown area, crown perimeter, crown shape, and mean NDVI);
(3)
investigate the field-based and UAV-based datasets, and explore any predictive relationships between the UAV data across the growing season and the physical field data;
(4)
contribute to the growing body of knowledge about the use of UAV imagery in the monitoring and management of agricultural crops.

2. Materials and Methods

2.1. Study Area

UC Davis Russell Ranch Sustainable Agricultural Facility (38.54, −121.85) west of Davis, California (Figure 1), is located 18 m above sea level. The entire facility is 120 ha in size and includes a wide variety of row and tree crops dedicated to long-term research on irrigated and dry-land agriculture in a Mediterranean climate. The facility has an average rainfall of 497.84 mm and a range of temperature of 3.33–33.89 °C. Prior to planting, a micro-emitter Netafim (Fresno, CA, USA) irrigation system (1.905 cm drip tube with 7.57 L emitter) was installed in the field to apply groundwater from a local well approximately every 10 days during each growing season. In 2013, 960 UCB-1 (P. atlantica x P. integerrima) pistachio seedlings were planted in a 2.54 ha experimental orchard. By the end of the 3rd year in 2016, the tree crowns started to overlap and therefore the orchard was thinned by removing every alternate tree, leaving a total of 480 trees. We conducted this study on 472 trees in total. Management goals for this pistachio orchard include understanding the relationship between rootstock and subsequent tree growth and productivity, in order to guide activities such as early roguing of plants [18]. Establishment and measurements pistachio trees were described in [18].

2.2. Physical Field Data Collection

Physical field data of various phenotypic traits of ungrafted UCB-1 trees were manually collected in the field during February and March 2018 as previously described in [18]. Tree structure data collected included tree height from the ground based on tallest branch (cm), crown height from the lowest branch to the top of the tree (cm), crown diameter (cm), and trunk caliper 30 cm from the ground (cm). Crown height was measured from the base of the lowest branch to the top of the tree, and crown diameter is the average of the diameter measured in two perpendicular directions with the widest diameter measured first, thus it represents the average equatorial diameter of that crown. Crown volume (m3) was calculated using the formula for the volume of a sphere:
volume = 4/3πa2b,
where a is crown diameter and b is crown height. Square meters of crown diameter was calculated in order to determine crown size.
The bud break process followed by leaf development among UCB-1 pistachio seedlings population were recorded per tree in April 2018 on a 0–5 scale: 0—buds only; 1—bud breaking, leaves developing; 2—red leaves, some fully developed; 3—all fully developed red leaves; 4—fully developed red and green leaves; 5—all fully developed green leaves (Figure 2).

2.3. Imagery Collection and Processing

UAV imagery was collected for the orchard over the 2018 growing season (on 28 March, 18 May, 13 June, 22 August, 27 September, 9 November, and 18 December) using a DJI Matrice 100, mounted with both X3 (RGB) and MicaSense RedEdge multispectral cameras. The flights were conducted at 30 m above ground level (AGL), repeating an autonomous grid-pattern mission with 90% forward and side overlaps. To optimize 3D photogrammetric processing of the imagery, the RGB camera was set at a 70° angle (slightly off nadir). These flights were conducted at solar noon with no cloud cover, and standard radiometric correction methods were applied to calibrate the multispectral imagery to reflectance using a MicaSense calibration panel. It is noteworthy that the sky was slightly hazy during the December 18th flight, at which time the seasonal solar noon sun angle was near its lowest point in the horizon. GPS coordinates for six ground control point (GCP) targets, optimally positioned around the perimeter of the orchard, were recorded with a Trimble Geo 7X and later differentially calibrated to less than 5 cm of absolute horizontal error. A customized version of Pix4D Mapper Pro’s ‘3D Models’ template incorporated the GCP coordinates into the processing workflow to render a multispectral orthomosaic (2.01 cm resolution) and a RGB orthomosaic (1.64 cm resolution). DSM and a DTM were simultaneously derived with the RGB orthomosaic. Digital canopy height models (CHMs) were created for each flight date by subtracting the pixel values of the ground level DTM from their corresponding top of canopy level DSM layers. NDVI layers were created from the multispectral orthomosaic using the standard formula, which is defined as the difference between the red and near-infrared (NIR) reflectance divided by their sum [20].

2.4. Crown Segmentation and Database Creation

The CHM images for each date were imported into the open source System for Automated Geoscientific Analyses (SAGA GIS) software application for a watershed segmentation process [21]. A Gaussian filter was applied with minimum height (1.5 m) and width (50 cm) thresholding to segment all tree crowns. The resulting vectorized tree crown segments were imported into ArcGIS Pro 2.3 (Esri, Redlands, CA, USA), where they were checked for errors and manually corrected when necessary, using standard heads-up digitization. Continuing this OBIA approach, tree crown height (cm), crown area (m2), and crown perimeter (cm) were calculated in ArcGIS Pro for each individual tree crown (ITC) polygon, for each of the seven flight dates. From these results, a compactness index [22] was calculated using crown area and perimeter according to the formula:
compactness = p2/(4πa),
where p is the crown perimeter and a is the crown area. Using this metric, a circle will have a compactness = 1, and more complex, less compact polygons are >1. Zonal statistics were performed using each tree crown polygon at each date with each NDVI product at each date to calculate mean NDVI values for each tree crown. Once the crowns had been created, they were appended with unique IDs, orchard column and row numbers, and the UAV-derived measures were joined with the physical field tree measurements. Figure 3 shows examples of the process used to create the tree crown database.

2.5. Analysis of Field-Based and UAV-Based Crown Characteristics

We explored both the field-based and UAV-based databases. We derived summary statistics for the field-based data and then explored how the field-based leaf development data (taken in early April 2018) varied across the orchard by plotting a frequency diagram of trees and leaf development stage (i.e., 1–5). Next, we ascertained the relationship between leaf development stage and UAV-based mean crown NDVI taken in late March. NDVI is an indicator of vegetation abundance and health, and is based on differing reflectance in the red and NIR portions of the electromagnetic spectrum. We also examined the UAV-based measures of individual tree size, height, shape, and mean NDVI in the growing season via box plots. Key correlations among UAV-based measures over time were investigated via regression analysis.

2.6. Analysis between Field-Based and UAV-Based Crown Characteristics

First, we explored the frequency of trees at various crown sizes and heights using field-based data as well as UAV-based data in the growing season. Next, we calculated R2 and p-values for linear regression equations between each field-based crown characteristic (i.e., tree height, trunk caliper, crown height, crown width, and crown volume) and each UAV-derived crown characteristic (i.e., crown height, crown area, crown perimeter, and crown shape).

3. Results

3.1. Analysis of Field-Based and UAV-Based Crown Characteristics

3.1.1. Field-Based Results

A summary of the tree crown characteristics measured in the field is provided in Table 1. Measuring crown size in the field was a lengthy task, requiring several days to record all the crown heights and widths. We used minimum and maximum values to calculate the range, which is a commonly used measure of variability. The range was calculated by subtracting the lowest value from the highest value. A large range in tree growth characteristics suggested high variability in the sizes of trees.
In April 2018 when leaf development scores were recorded, most of the trees (71%) were at stage 2, with 6% at stage 3 and 15% at stage 4 (Figure 4a). Only 4% of the trees had fully developed red and green leaves. In March, when pistachio leaves had just started to develop, we found the largest variation in leaf development (Figure 4a). Leaves are usually fully developed by the end of April, and NDVI increased as a result. Therefore, the variation in leaf development was confirmed by NDVI, which ranged between 0.3 and 0.9. The highest NDVI value was recorded in June when most of the trees ranged between 0.9 and 1. Canopy NDVI showed seasonal patterns that indicated spring green up and leaf development, followed by fall senescence, processes typical for deciduous trees which marks the duration of photosynthetic activities.

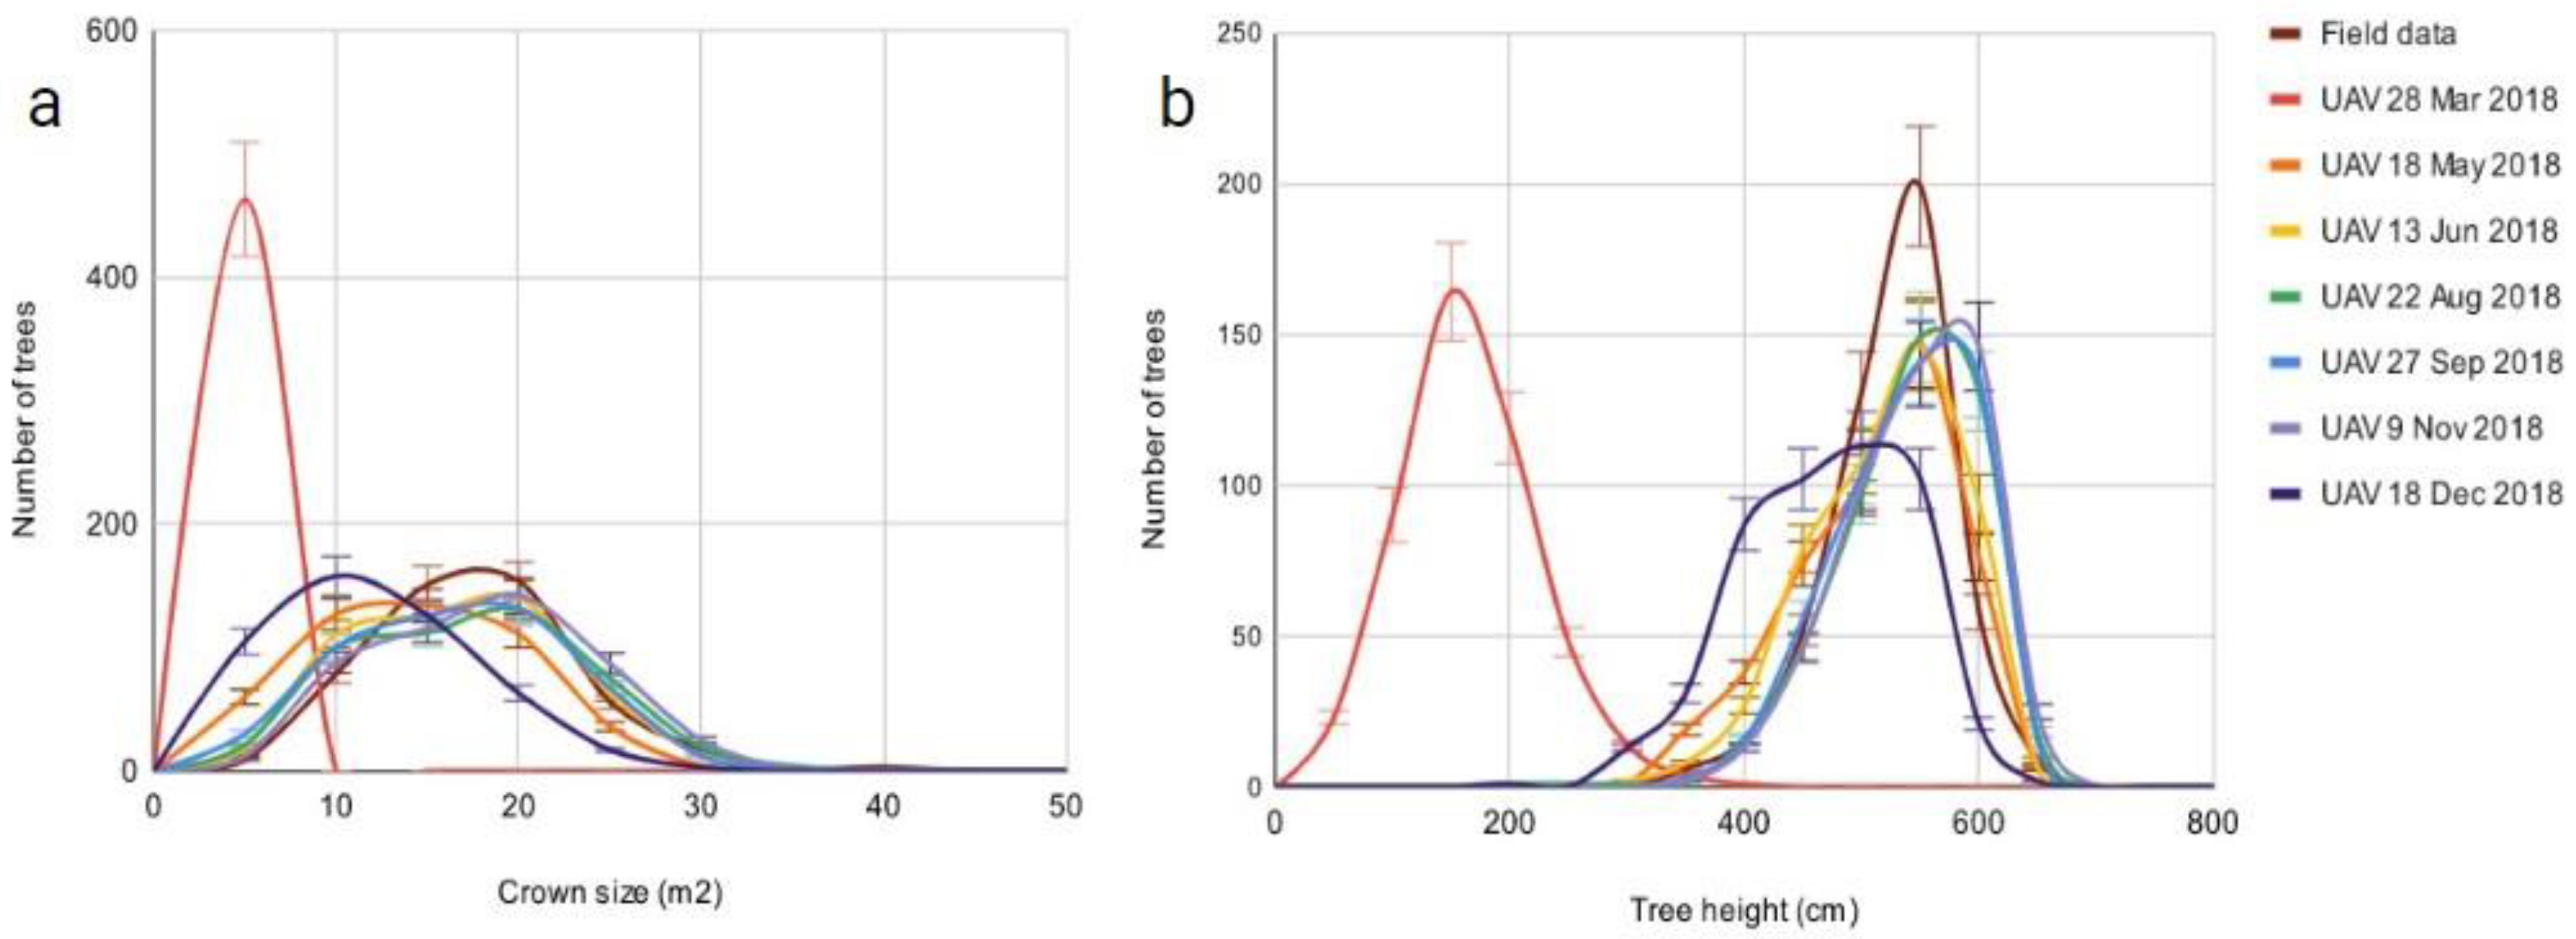
3.1.2. UAV-Based Results

UAV-based measures of individual tree size, height, shape, and mean NDVI throughout the growing season are shown in Figure 5. Early and late season (i.e., March and December) leaf-off or near leaf-off conditions (senescence) make capturing accurate tree height from the CHM difficult (Figure 5a). Tree crown size early in the season was similarly challenging to accurately capture; however, tree crowns continued to grow from May through June and stabilized by mid-season (Figure 5b). Crown shape early in the season is the most compact (i.e., closer to 1) but this is largely due to the smaller leaf-off polygons captured from the CHM (see Figure 3). Tree crowns become less compact throughout the season (Figure 5c). December has the most variability in its crown characteristics, as leaf-off takes place unevenly. Mean crown NDVI varied between 0.2 and 1.0 during 2018 (Figure 5d). The distribution of NDVI showed the greatest range in March, when pistachio leaves have just started to develop. Leaves are usually fully developed by the end of April, and NDVI increased as a result. The NDVI of an area containing a dense vegetation canopy will tend to have positive values, which explains the rapid increase of NDVI values in May through June, with a peak mean NDVI in June, fairly stable measures until November, and slight declines in December (Figure 5d).
Correlation between UAV-measured tree crown characteristics at each flight time is provided in Table 2. UAV-derived crown size was strongly associated with UAV-derived tree height in May through November (highest R2 in June and September: significant R2 = 0.549 and 0.548, respectively). There was also a relationship between UAV-derived crown size and NDVI, with R2 near or over 0.3 in the May to November timeframe. This relationship was strongest in June, with a significant R2 = 0.43. Tree height and NDVI were slightly related in May through June (highest R2 in June of 0.24). Crown shape (i.e., compactness) was not strongly correlated with other crown traits.

3.2. Agreement between UAV- and Field-Based Data

We plotted the frequency of field-based crown size and UAV-based crown size and height for all flights (Figure 6). March and December UAV-based data were the most anomalous: in March, most of the tree crowns derived from the CHM were smaller and shorter than the field data and all other time points. This again is due to the leaf-off conditions in the field. Crown sizes from May through November were consistent and similar to field-based crown size (Figure 6a).
Next, we explored correlations between field-based and UAV-derived crown measures with a linear regression analysis. UAV-derived crown measures from May to November best predicted (i.e., overall stronger R2) field-based crown measures (Table 3). The majority of the strongest predictions were reported for the November flight period. UAV-derived crown size provided the strongest predictor of field-measured trunk dimensions (strongest R2 of 0.774 and R2 consistently above 0.7 for May to November). UAV-derived tree height was a good predictor of several field-based crown measures, including tree height, trunk dimension, crown volume, and crown height (strongest R2 of 0.707, 0.603, 0.617, 0.638, respectively) for May to November. UAV-derived crown size was also a good predictor of field-based crown width, crown volume, and crown size (strongest R2 of 0.657, 0.657, 0.644, respectively) for May to November. There was a weaker predictive fit between UAV-based tree height or tree size and field-based crown width, volume, and size (R2 approximately 0.3) for May to November. There was a weak correlation between UAV-derived crown shape and field-based crown volume or size. No strong predictive relationships were found for March or December data.

4. Discussion

In this study, we used UAV-captured data to create a database of 472 simultaneously planted UCB-1 pistachio tree crowns in an orchard over one growing season from 28 March 2018 to 18 December 2018 using object-based image analysis methods. Our main objectives included creating a tree database with tree crown characteristics measured in the field early in the growing season (i.e., tree height, trunk caliper, crown height, crown, width, crown volume, and leaf development) and via UAV imagery analysis captured seven times over the growing season (i.e., crown height, crown area, crown perimeter, crown shape, and mean NDVI) in order to explore any predictive relationships between the UAV data across the growing season and the physical field data. Our results agree with the growing body of knowledge supporting the use of UAV imagery in monitoring and management of agricultural crops in line with other recent papers [23,24,25]. Several papers have been published focusing on remote sensing and application in nut crops [26,27,28]. However, the morphology of each plant species and variety differs. UCB-1 is the most common rootstock in the US, but there is still little known about this interspecific cross that segregates when seedlings are used as a rootstock and phenotype manifests in the later years when rootstocks are already grafted and planted in the orchard, causing losses in nut production. To our knowledge, this is the first research describing UAV data on an F1 UCB-1 population across one growing season.

4.1. General Lessons

Our work showed that UAV-derived tree crown characteristics predicted field-based tree crown data for trunk caliper, tree height, crown volume, crown height, crown width, and crown size of the measures with R2 near or over 0.6 (max R2 of 0.774) using UAV data captured in May, June, August, September, and November. Early (March) and late (December) season flights, when the trees were mostly or partially without leaves, were less accurate. The strongest correlation was found between trunk caliper and UAV derived crown size (R2 = 0.774) in June. Trunk caliper is a better measurement of overall tree vigor than tree height because some weak trees with narrow calipers tend to bend over and require support. Trees with greater trunk calipers are stronger and much sturdier, which is suitable for handling the shaking required for harvesting [18]. The high correlation found between field-based trunk caliper measures and UAV-derived crown size is important because crown size reflects yield [17]. Pistachio orchards require numerous economic decisions such as yield prediction. More precise measurements of crown size will result in more precise prediction of yield and effective production management.
For pistachios, it is known that tree crown size is correlated with yield [17]. UAV-based crown sizes recorded between May through November strongly predicted field-based crown volume (R2 ranged from 0.559 to 0.657, with the highest in November R2 = 0.657). Early and late season data were the least accurate, likely due to leaf-off conditions, which make the capture of a crown from a UAV unreliable. From May through November, UAV-derived crown size was a strong predictor of several field-based measurements including crown width, crown volume, and crown size with R2 near or over 0.6. Tree crown shape is very important and can affect production quantity and quality as well as harvesting or other farming activities. Pistachio trees exhibit an excurrent branching habit, resulting in conoid shapes and decurrent branching habit; thus, trees have generally rounded shapes [29,30]. When measured using a compactness index, rounded shapes then approached 1. As with crown size, UCB-1 pistachio crown shape in March differed strongly from crown shape in the other months. Crown shapes remained generally the same between May and December, when leaves were fully developed and stayed on the trees. Crown shape was not strongly related to any other crown trait. This is expected because tree crown shape is strongly affected by multiple factors, including genetics, physiology, method of pruning, competition for light, and wind/insect/disease/human damage [31].
We recorded NDVI values at several points during the 2018 growing season and compared mean crown NDVI to field data recorded once in April. We recorded a clear signal of growing season tree dynamics showing early season green-up, peak greenness, and end-of-season decline in photosynthetic activity similar to others [32], as well as capturing the natural phenological variations in leaf development that occur every year between March and April. UCB-1 pistachio leaves are green and reddish in color; young leaves are more red, while fully developed leaves are green. NDVI describes the difference between visible red and near-infrared reflectances of vegetation [33,34] but is not as sensitive to the density of red leaves due to differences in the way leaves reflect, transmit, and absorb NIR and red light. Not surprisingly, we found that the best correlation between NDVI and crown size was recorded in June once all the leaves were fully developed and mature. UCB-1 trees actively grow, producing new vegetative shoot tips a few times per year. Bud break and leaf development in UCB-1 pistachio seedlings depend mostly on weather conditions and can differ from year to year; however, leaf development usually occurs during March and April. Leaves are fully developed in May; therefore, NDVI data can be readily captured until the fall because of changes in the length of daylight and temperature, which causes the chlorophyll to break down. Usually, in November and/or December, leaves start to lose their green color and their photosynthetic activity slows down. In December, a decrease in chlorophyll pigments coincided with lower NDVI values, similar to previous findings [35,36]. Once chlorophyll is reabsorbed and the yellow to orange colors become visible, the leaves cannot be detected by NDVI camera. Therefore, we were not able to record NDVI data in December. As a plant canopy transforms from the winter season dormancy to late-summer maturity, its reflectance properties also change. NDVI data can be used to monitor this seasonal variation [37].

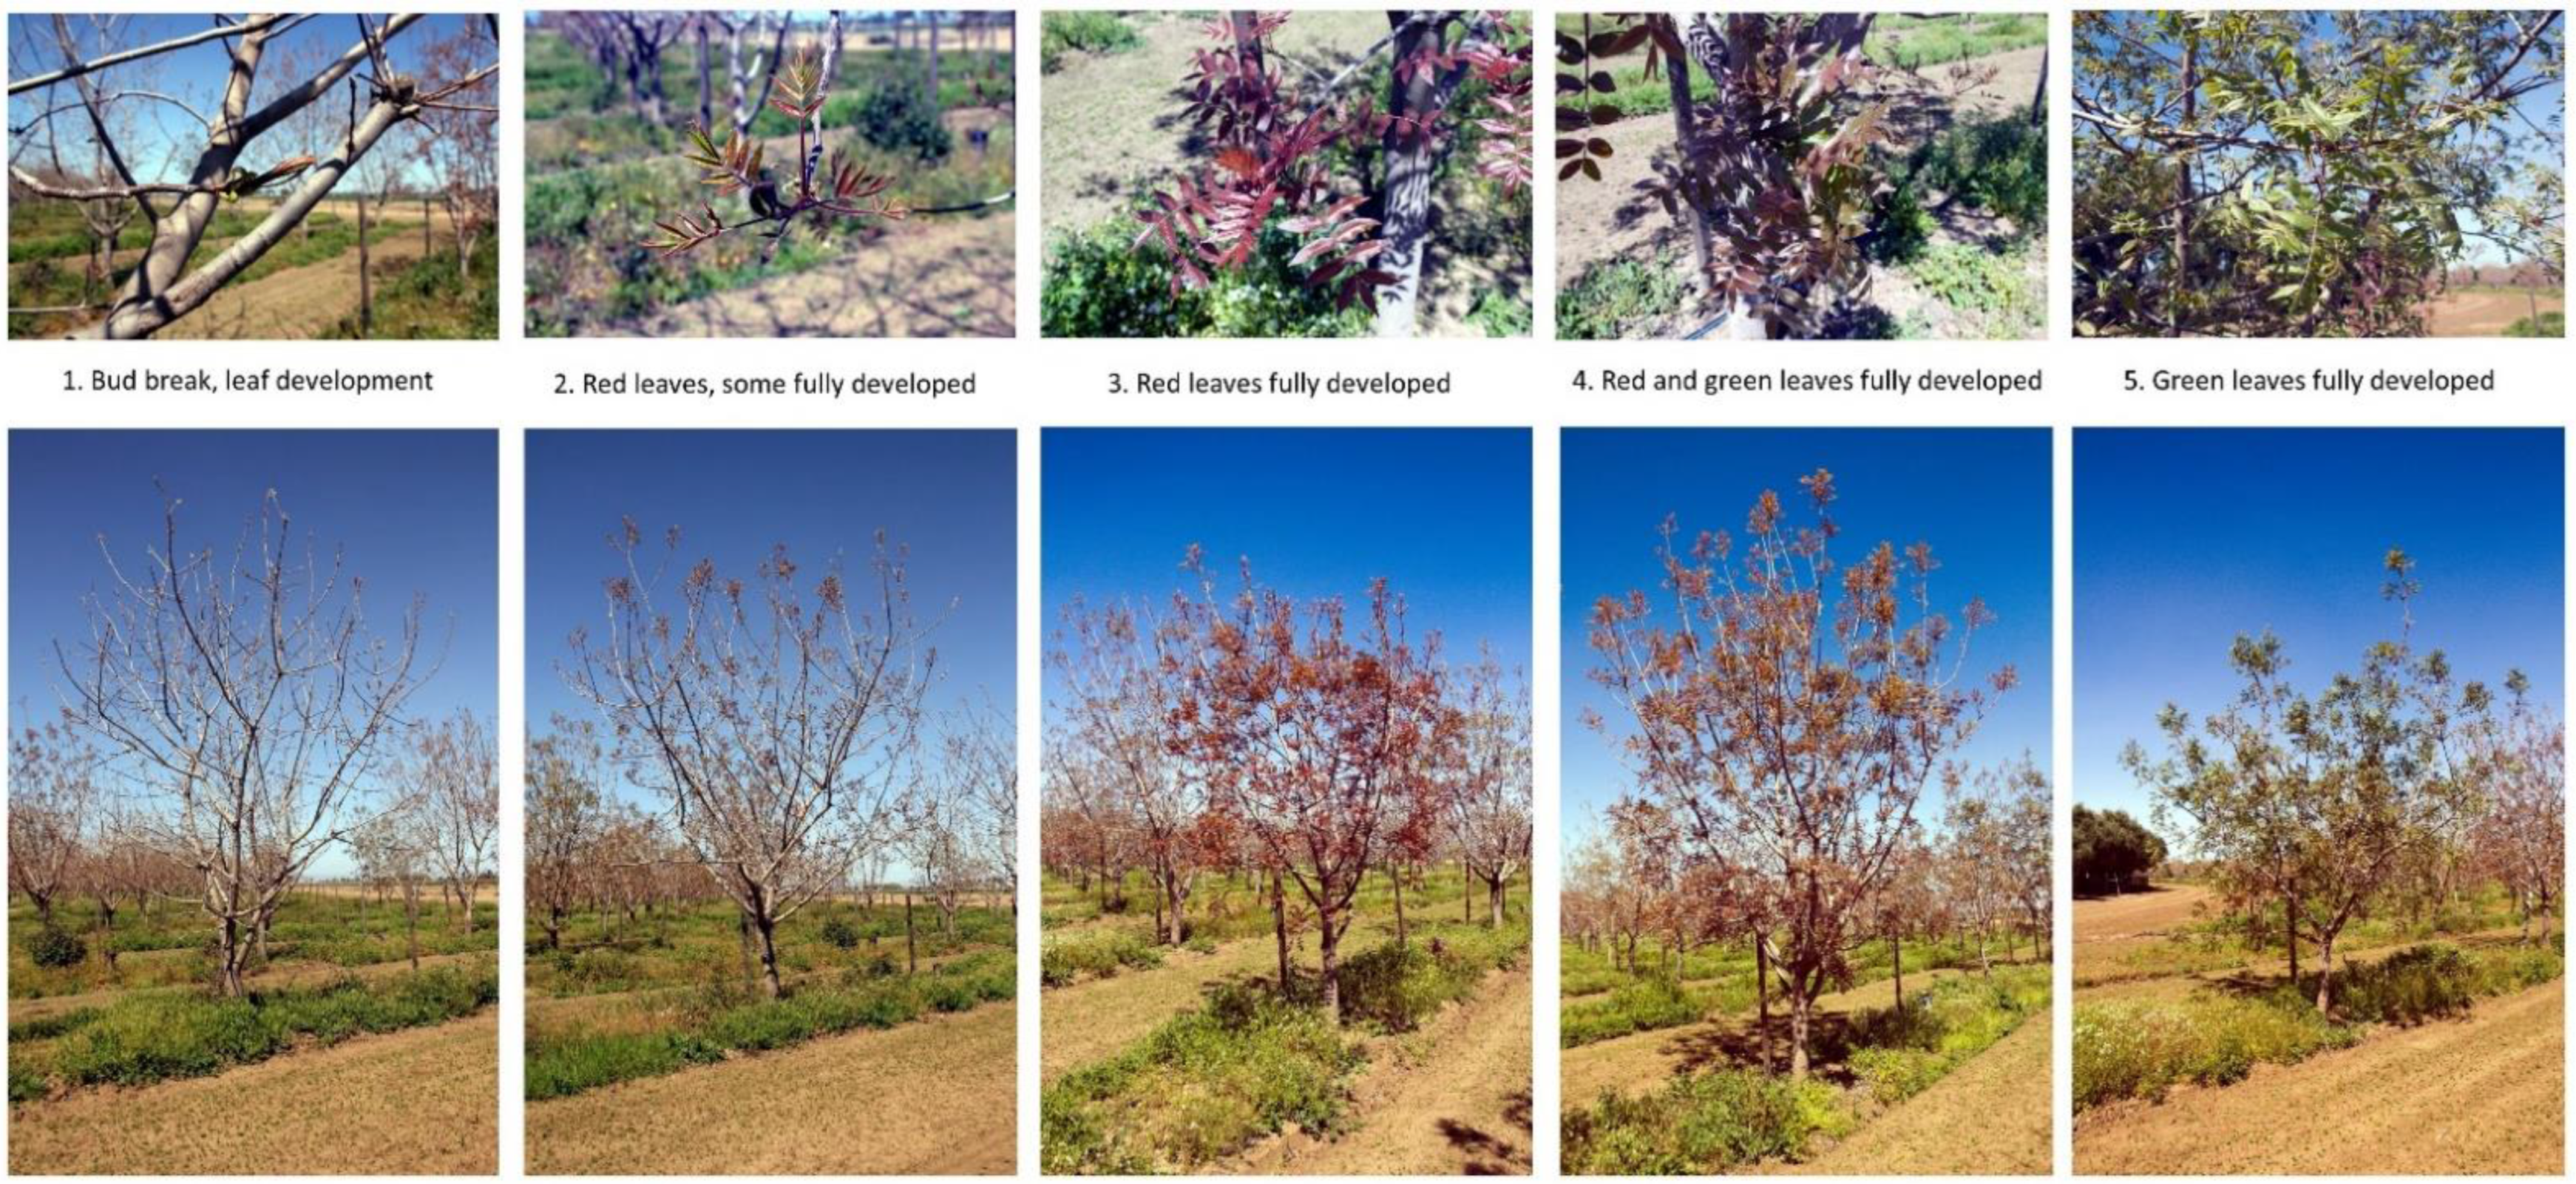
4.2. Leaf Development

Leafing-out of woody plants begins the growing season and is affected by several factors such as genotype and climate [38,39,40,41,42,43,44]. There is a significant variation in the timing of leaf-out, both within and among species, but leaf development of almost all temperate tree and shrub species is highly sensitive to temperature [38]. Bud-break is an economically and environmentally important process in woody plants that can vary among populations because of interactions between climate and genotype [39,40]. Leaves are usually fully developed by the end of April. It has been reported that there can be large interspecific differences in leaf-out timing, even when individuals are exposed to the same conditions [38,41]. The development of leaves typically follows a basic process that is flexible and varies according to species, developmental stage, and environmental circumstances. Typically, there is the largest variation in leaf development stage near the end of March and beginning of April in UCB-1 trees every year, during which time leaf development was scored. Because of the opportunity for carbon fixation, it should benefit a tree to leaf-out as early as possible in the spring season. Early leaf unfolding allows a tree or shrub to extend its growing period, produce more assimilates, and increase biomass production. However, Bennie et al. [42] reported that early leafing in trees was correlated with a late frost that could damage its leaves and conducting tissues. Trade-offs between greater productivity and higher risk of frost damage may play a role in the variation in leafing strategies of different species. Establishing the timing of leaf senescence in plants is also crucial but not fully understood because the genetic and physiological basis of the leaf senescence process is complex [43,44,45,46].

4.3. Pistachio as a Model System

Pistachio offers a unique system to study links between crown structure and tree development because in mature trees most of the lateral buds become floral, leaving only the terminal and one or two distal lateral buds, which frequently remain dormant, to produce vegetative growth [47]. Therefore, most shoots are born from terminal buds, resulting in a tree with a relatively open crown. Furthermore, the California pistachio industry has been almost entirely based on a single clonal female cultivar, ‘Kerman,’ that is budded onto seedling rootstocks that are produced through controlled pollination [19]. These rootstocks greatly influence the size and yield of mature trees [48]. Additionally, the more vigorous rootstocks (PGI and UCB-1) result in trees with numerous long, leafy shoots in the uppermost portion of the crown [49], resulting in a crown structure unfavorable for horticultural production. Given that the scion population is genetically uniform, the opportunity exists to study rootstock effects on bud preformation. Furthermore, the horticultural training of pistachio results in trees with uniform populations of shoots because trees are pruned annually to develop the desired crown structure and, once mature, to maintain their size and renew the fruiting wood. Thus, regardless of the tree axis, the shoot population on a mature tree is highly uniform in both chronological and physiological age. This uniformity allows for the study of crown position effects on preformation without other confounding factors (e.g., axis, physiological age, etc.).

4.4. The Benefits of Using UAV Data for Orchard Management

This study presents several insights for orchard managers wishing to integrate UAV data collection into their management strategy. First, there are efficiencies to be gained from the incorporation of drone data collection into management. The calculation of tree height, crown size, and crown volume from drone data was much more time efficient than manual collection. Second, the data recorded with remote sensing technology were more precise than the data collected manually. Height is one of the hardest measurements to make accurately from the ground, especially for larger trees. For example, Wang et al. [50] showed that certain conditions (e.g., forest and tree structure, tree species, tree height, topography, measuring distance, instrument and human errors, etc.) can challenge field inventory of tree height measurements [51]. Third, as the correlation values between UAV and field data are very similar between May and November, these results suggest some flexibility in flight timing. Since pistachio nuts are harvested between late August to early October in California (https://americanpistachios.org/growing-and-harvesting, accessed on 8 January 2022), these results suggest that there is flexibility for managers to collect UAV data before and after the harvesting until November. Finally, there were some lessons learned through this study relating to the mechanics of mission planning and flight. For example, UAV data collected in March, when the trees were beginning to leaf-out, was not useful for capturing tree crowns because of a lack of contrast between branches and underlying surfaces. However, those data were crucial to calculating tree heights later in the season when canopy closure prevented photogrammetry of the ground surface. Furthermore, wind is a consideration during drone flights because moving leaves can cause blurring, which hampers photogrammetric processing. During the May flights, there was higher than normal wind, resulting in blurring, making photogrammetry of eight trees impossible.

5. Conclusions

We compared drone-captured tree crown data derived from OBIA with ground-based field data from 472 simultaneously planted UCB-1 pistachio tree crowns in an experimental pistachio orchard over one growing season from 28 March 2018 to 18 December 2018. High resolution imagery from drones, when processed using OBIA methods, allowed for the capture of individual tree crowns multiple times during the growing season. Tree crown data recorded with a drone between May and November 2018 were highly correlated with field-collected data from March 2018; the strongest fit was between drone-captured tree crown size and field-collected trunk caliper measurements (R2 = 0.774). Since yield in pistachio is related to trunk caliper measures, the high correlation found here between trunk caliper and UAV-derived crown size can be useful for managers to help estimate yield size prior to harvest. Application of remote sensing in agriculture can expand the ability to monitor orchard tree dynamics by providing measures throughout the growing season, rather than at one time (i.e., early in the growing season). Variation in leaf development in March and April affects the accuracy of NDVI data, which show a broader distribution curve that refers to the variability of data.
This study showcased the benefits of timely and detailed drone imagery for orchard managers. The tree database created permitted analysis of tree height, crown size, crown shape, and crown condition. The drone-based crown data strongly predicted field-based crown data. The calculation of tree height and crown size from drone data was more time efficient than manual collection. Several studies are possible in the future. The use of UAV data to determine the best time to harvest crops should be evaluated. In addition, studies should be conducted on the use of terrestrial lidar data to estimate the trunk caliper. Terrestrial lidar is showing great promise in the acquisition of plant structure at extremely fine scales [52,53]. Additionally, the timing of leaf senescence could be potentially studied using hypertemporal multispectral and RGB imagery.

Author Contributions

Conceptualization, E.J., S.H. and M.K.; methodology, E.J., S.H. and M.K.; software, E.J., S.H. and M.K.; validation, E.J., S.H. and M.K.; formal analysis, E.J., S.H. and M.K.; investigation, E.J., S.H. and M.K.; data curation, E.J., S.H. and M.K.; writing—review and editing, E.J., S.H., M.K. and R.M.; visualization, E.J., S.H. and M.K.; supervision, E.J., S.H., M.K., J.E.P., D.G. and R.M.; project administration, E.J., S.H., M.K., J.E.P., D.G. and R.M.; funding acquisition, E.J. and R.M. All authors have read and agreed to the published version of the manuscript.

Funding

This research was funded by the California Pistachio Research Board.

Data Availability Statement

Data and code are available by request.

Acknowledgments

We thank the UC Davis Foundation Plant Services for help with field data collection.

Conflicts of Interest

The authors declare no conflict of interest.

References

  1. Moussaid, A.; Fkihi, S.E.; Zennayi, Y. Tree Crowns Segmentation and Classification in Overlapping Orchards Based on Satellite Images and Unsupervised Learning Algorithms. J. Imaging Sci. Technol. 2021, 7, 241. [Google Scholar] [CrossRef]
  2. Goodman, R.C.; Phillips, O.L.; Baker, T.R. The Importance of Crown Dimensions to Improve Tropical Tree Biomass Estimates. Ecol. Appl. 2014, 24, 680–698. [Google Scholar] [CrossRef] [PubMed] [Green Version]
  3. Anderson, K. Gaston Lightweight Unmanned Aerial Vehicles Will Revolutionize Spatial Ecology. Front. Ecol. Environ. 2013, 11, 138–146. [Google Scholar] [CrossRef] [Green Version]
  4. Cruzan, M.B.; Weinstein, B.G.; Grasty, M.R.; Kohrn, B.F.; Hendrickson, E.C.; Arredondo, T.M.; Thompson, P.G. Small Unmanned Aerial Vehicles (micro-UAVs, Drones) in Plant Ecology. Appl. Plant Sci. 2016, 4, 1600041. [Google Scholar] [CrossRef] [PubMed]
  5. Hardin, P.J.; Lulla, V.; Jensen, R.R.; Jensen, J.R. Small Unmanned Aerial Systems (sUAS) for Environmental Remote Sensing: Challenges and Opportunities Revisited. GISci. Remote Sens. 2019, 56, 309–322. [Google Scholar] [CrossRef]
  6. Hogan, S.D.; Kelly, M.; Stark, B.; Chen, Y. Unmanned Aerial Systems for Agriculture and Natural Resources. Calif. Agric. 2017, 71, 5–14. [Google Scholar] [CrossRef] [Green Version]
  7. Guirado, E.; Tabik, S.; Alcaraz-Segura, D.; Cabello, J.; Herrera, F. Deep-Learning Versus OBIA for Scattered Shrub Detection with Google Earth Imagery: Ziziphus Lotus as Case Study. Remote Sens. 2017, 9, 1220. [Google Scholar] [CrossRef] [Green Version]
  8. Peña, J.M.; Torres-Sánchez, J.; de Castro, A.I.; Kelly, M.; López-Granados, F. Weed Mapping in Early-Season Maize Fields Using Object-Based Analysis of Unmanned Aerial Vehicle (UAV) Images. PLoS ONE 2013, 8, e77151. [Google Scholar] [CrossRef] [Green Version]
  9. Huang, H.; Lan, Y.; Yang, A.; Zhang, Y.; Wen, S.; Deng, J. Deep Learning versus Object-Based Image Analysis (OBIA) in Weed Mapping of UAV Imagery. Int. J. Remote Sens. 2020, 41, 3446–3479. [Google Scholar] [CrossRef]
  10. Guo, Q.; Kelly, M.; Gong, P.; Liu, D. An Object-Based Classification Approach in Mapping Tree Mortality Using High Spatial Resolution Imagery. GISci. Remote Sens. 2007, 44, 24–47. [Google Scholar] [CrossRef]
  11. Cleve, C.; Kelly, M.; Kearns, F.R.; Moritz, M. Classification of the Wildland–urban Interface: A Comparison of Pixel-and Object-Based Classifications Using High-Resolution Aerial Photography. Comput. Environ. Urban Syst. 2008, 32, 317–326. [Google Scholar] [CrossRef]
  12. Yu, Q.; Gong, P.; Clinton, N.; Biging, G. Object-Based Detailed Vegetation Classification with Airborne High Spatial Resolution Remote Sensing Imagery. Remote Sens. 2006, 72, 799–811. [Google Scholar] [CrossRef] [Green Version]
  13. Jakubowski, M.K.; Li, W.; Guo, Q.; Kelly, M. Delineating Individual Trees from LiDAR Data: A Comparison of Vector-and Raster-Based Segmentation Approaches. Remote Sens. 2013, 5, 4163–4186. [Google Scholar] [CrossRef] [Green Version]
  14. American Pistachio Growers. Available online: https://americanpistachios.org/growing-and-harvesting/history (accessed on 23 March 2022).
  15. Morgan, D.; Epstein, P.L.; Ferguson, L. Verticillium Wilt Resistance in Pistachio Rootstock Cultivars: Assays and an Assessment of Two Interspecific Hybrids. Plant Dis. 1992, 76, 310–313. [Google Scholar] [CrossRef]
  16. Epstein, L.; Beede, R.; Kaur, S.; Ferguson, L. Rootstock Effects on Pistachio Trees Grown in Verticillium dahliae-Infested Soil. Phytopathology 2004, 94, 388–395. [Google Scholar] [CrossRef] [Green Version]
  17. Beede, R.H. Pistachio Canopy Management and Its Effect on Yield Components. In 8th Advanced in Pistachio Production; University of California: Davis, CA, USA, 2017. [Google Scholar]
  18. Jacygrad, E.; Preece, J.E.; Palmer, W.J.; Michelmore, R.; Golino, D. Phenotypic Segregation of Seedling UCB-1 Hybrid Pistachio Rootstock. Trees 2020, 34, 531–541. [Google Scholar] [CrossRef] [Green Version]
  19. Ferguson, L.; Reyes, H.; Sanden, B.; Grattan, S.; Epstein, L.; Krueger, B. Pistachio Rootstocks. In Pistachio Production Manual; UCANR Publications: Richmond, CA, USA, 2005; pp. 67–73. [Google Scholar]
  20. Tucker, C.J. Red and photographic infrared linear combinations for monitoring vegetation. Remote Sens. Environ. 1979, 8, 127–150. [Google Scholar] [CrossRef] [Green Version]
  21. Serra, J. Image Analysis and Mathematical Morphology; Academic Press: New York, NY, USA, 1982. [Google Scholar]
  22. Montero, R.S.; Bribiesca, E. State of the Art of Compactness and Circularity Measures. Int. Math. Forum 2009, 4, 1305–1335. [Google Scholar]
  23. Kameyama, S.; Sugiura, K. Estimating Tree Height and Volume Using Unmanned Aerial Vehicle Photography and SfM Technology, with Verification of Result Accuracy. Drones 2020, 4, 19. [Google Scholar] [CrossRef]
  24. Niu, H.; Wang, D.; Chen, Y. Estimating Actual Crop Evapotranspiration Using Deep Stochastic Configuration Networks Model and UAV-Based Crop Coefficients in a Pomegranate Orchard. In Proceedings of the Autonomous Air and Ground Sensing Systems for Agricultural Optimization and Phenotyping V., SPIE, California, CA, USA, 21 April 2020; Volume 11414, pp. 76–82. [Google Scholar]
  25. Maes, W.H.; Steppe, K. Perspectives for Remote Sensing with Unmanned Aerial Vehicles in Precision Agriculture. Trends Plant Sci. 2019, 24, 152–164. [Google Scholar] [CrossRef]
  26. Jafarbiglu, H.; Pourreza, A. A Comprehensive Review of Remote Sensing Platforms, Sensors, and Applications in Nut Crops. Comput. Electron. Agric. 2022, 197, 106844. [Google Scholar] [CrossRef]
  27. Barajas, E.; Álvarez, S.; Fernández, E.; Vélez, S.; Rubio, J.A.; Martín, H. Sentinel-2 Satellite Imagery for Agronomic and Quality Variability Assessment of Pistachio (Pistacia vera L.). Sustain. Sci. Pract. Policy 2020, 12, 8437. [Google Scholar] [CrossRef]
  28. Zhao, T.; Stark, B.; Chen, Y.; Ray, A.L.; Doll, D. Challenges in Water Stress Quantification Using Small Unmanned Aerial System (sUAS): Lessons from a Growing Season of Almond. J. Intell. Rob. Syst. 2017, 88, 721–735. [Google Scholar] [CrossRef]
  29. Ferguson, L.; Polito, V.; Kallsen, C. The Pistachio Tree; Botany and Physiology and Factors That Affect Yield. In Pistachio Production Manual, 4th ed.; University of California Fruit & Nut Research Information Center: Davis, CA, USA, 2005. [Google Scholar]
  30. Pirmoradian, M. Morphological Study of Local Pistachio Genotypes in the Isfahan Province. In Proceedings of the IV International Symposium on Pistachios and Almonds, Tehran, Iran, 22–25 May 2005; International Society for Horticultural Science: Leuven, Belgium, 2006. [Google Scholar]
  31. Schomaker, M. Crown-Condition Classification: A Guide to Data Collection and Analysis; Gen. Tech. Rep. SRS-102; U.S. Department of Agriculture, Forest Service, Southern Research Station: Asheville, NC, USA, 2007; 78p. Available online: https://www.fs.usda.gov/research/treesearch/27730 (accessed on 23 March 2022).
  32. Fawcett, D.; Bennie, J.; Anderson, K. Monitoring Spring Phenology of Individual Tree Crowns Using Drone-acquired NDVI Data. Remote Sens. Ecol. Conserv. 2021, 7, 227–244. [Google Scholar] [CrossRef]
  33. Pettorelli, N.; Vik, J.O.; Mysterud, A.; Gaillard, J.-M.; Tucker, C.J.; Stenseth, N.C. Using the Satellite-Derived NDVI to Assess Ecological Responses to Environmental Change. Trends Ecol. Evol. 2005, 20, 503–510. [Google Scholar] [CrossRef]
  34. Zeng, Y.; Hao, D.; Huete, A.; Dechant, B.; Berry, J.; Chen, J.M.; Joiner, J.; Frankenberg, C.; Bond-Lamberty, B.; Ryu, Y.; et al. Optical Vegetation Indices for Monitoring Terrestrial Ecosystems Globally. Nat. Rev. Earth Environ. 2022, 3, 477–493. [Google Scholar] [CrossRef]
  35. Gamon, J.A.; Field, C.B.; Goulden, M.L.; Griffin, K.L.; Hartley, A.E.; Joel, G.; Penuelas, J.; Valentini, R. Relationships Between NDVI, Canopy Structure, and Photosynthesis in Three Californian Vegetation Types. Ecol. Appl. 1995, 5, 28–41. [Google Scholar] [CrossRef] [Green Version]
  36. Kizilgeci, F.; Yildirim, M.; Islam, M.S.; Ratnasekera, D.; Iqbal, M.A.; Sabagh, A.E.L. Normalized Difference Vegetation Index and Chlorophyll Content for Precision Nitrogen Management in Durum Wheat Cultivars under Semi-Arid Conditions. Sustain. Sci. Pract. Policy 2021, 13, 3725. [Google Scholar] [CrossRef]
  37. Yang, H.; Yang, X.; Heskel, M.; Sun, S.; Tang, J. Seasonal Variations of Leaf and Canopy Properties Tracked by Ground-Based NDVI Imagery in a Temperate Forest. Sci. Rep. 2017, 7, 1267. [Google Scholar] [CrossRef] [Green Version]
  38. Polgar, C.A.; Primack, R.B. Leaf-out Phenology of Temperate Woody Plants: From Trees to Ecosystems. New Phytol. 2011, 191, 926–941. [Google Scholar]
  39. Azeez, A.; Zhao, Y.C.; Singh, R.K.; Yordanov, Y.S.; Dash, M.; Miskolczi, P.; Stojkovič, K.; Strauss, S.H.; Bhalerao, R.P.; Busov, V.B. EARLY BUD-BREAK 1 and EARLY BUD-BREAK 3 Control Resumption of Poplar Growth after Winter Dormancy. Nat. Commun. 2021, 12, 1123. [Google Scholar] [CrossRef]
  40. Rossi, S.; Bousquet, J. The Bud Break Process and Its Variation among Local Populations of Boreal Black Spruce. Front. Plant Sci. 2014, 5, 574. [Google Scholar] [CrossRef]
  41. Lechowicz, M.J. Why Do Temperate Deciduous Trees Leaf Out at Different Times? Adaptation and Ecology of Forest Communities. Am. Nat. 1984, 124, 821–842. [Google Scholar] [CrossRef]
  42. Bennie, J.; Kubin, E.; Wiltshire, A.; Huntley, B.; Baxter, R. Predicting Spatial and Temporal Patterns of Bud-Burst and Spring Frost Risk in North-West Europe: The Implications of Local Adaptation to Climate. Glob. Chang. Biol. 2010, 16, 1503–1514. [Google Scholar] [CrossRef]
  43. Liu, Q.; Piao, S.; Campioli, M.; Gao, M.; Fu, Y.H.; Wang, K.; He, Y.; Li, X.; Janssens, I.A. Modeling Leaf Senescence of Deciduous Tree Species in Europe. Glob. Chang. Biol. 2020, 26, 4104–4118. [Google Scholar] [CrossRef]
  44. Gan, S.; Amasino, R.M. Making Sense of Senescence (Molecular Genetic Regulation and Manipulation of Leaf Senescence). Plant Physiol. 1997, 113, 313–319. [Google Scholar] [CrossRef] [Green Version]
  45. Keskitalo, J.; Bergquist, G.; Gardeström, P.; Jansson, S. A Cellular Timetable of Autumn Senescence. Plant Physiol. 2005, 139, 1635–1648. [Google Scholar] [CrossRef] [Green Version]
  46. Richardson, A.D.; Anderson, R.S.; Arain, M.A.; Barr, A.G.; Bohrer, G.; Chen, G.; Chen, J.M.; Ciais, P.; Davis, K.J.; Desai, A.R.; et al. Terrestrial Biosphere Models Need Better Representation of Vegetation Phenology: Results from the North American Carbon Program Site Synthesis. Glob. Chang. Biol. 2012, 18, 566–584. [Google Scholar] [CrossRef] [Green Version]
  47. CRANE; Julian, C. Morphology and Reproduction of Pistachio. Hortic Rev. 1981, 3, 376–393. [Google Scholar]
  48. Ferguson, L.; Beede, R.; Buchner, R.; Kallsen, C.; Freeman, M.; Reyes, H.C.; Metheney, P.; Kafkas, S. California Pistachio Rootstock Trials: Final Report, 1989–1997. Cal. Pist. Ind. Annu. Rep. Crop Year 1997, 98, 60–63. [Google Scholar]
  49. Spann, T.M.; Beede, R.H.; Dejong, T.M. Preformation in Vegetative Buds of Pistachio (Pistacia vera): Relationship to Shoot Morphology, Crown Structure and Rootstock Vigor. Tree Physiol. 2007, 27, 1189–1196. [Google Scholar] [CrossRef] [Green Version]
  50. Wang, Y.; Lehtomäki, M.; Liang, X.; Pyörälä, J.; Kukko, A.; Jaakkola, A.; Liu, J.; Feng, Z.; Chen, R.; Hyyppä, J. Is Field-Measured Tree Height as Reliable as Believed—A Comparison Study of Tree Height Estimates from Field Measurement, Airborne Laser Scanning and Terrestrial Laser Scanning in a Boreal Forest. ISPRS J. Photogramm. Remote Sens. 2019, 147, 132–145. [Google Scholar] [CrossRef]
  51. Sterenczak, K.; Mielcarek, M.; Wertz, B.; Bronisz, K.; Zajączkowski, G.; Jagodzinski, A.M.; Ochał, W.; Skorupski, M. Factors influencing the accuracy of ground-based tree-height measurements for major European tree species. J. Environ. Manag. 2019, 231, 1284–1292. [Google Scholar] [CrossRef]
  52. Guo, Q.; Su, Y.; Hu, T.; Guan, H.; Jin, S.; Zhang, J. Lidar Boosts 3D Ecological Observations and Modeling: A Review and Perspective. IEEE Geosci. 2020, 9, 232–257. [Google Scholar] [CrossRef]
  53. Ao, Z.; Wu, F.; Hu, S.; Sun, Y.; Su, Y.; Guo, Q.; Xin, Q. Automatic Segmentation of Stem and Leaf Components and Individual Maize Plants in Field Terrestrial LiDAR Data Using Convolutional Neural Networks. Crop. J. 2021, 10, 1239–1250. [Google Scholar] [CrossRef]
Figure 1. Russell Ranch experimental orchard in Yolo County, CA, USA.
Drones 06 00343 g001
Figure 2. Examples of leaf development on a 1–5 scale in UCB-1 rootstock recorded on 2 April 2018.
Drones 06 00343 g002
Figure 3. The same non-grafted UCB-1 trees in the experimental orchard. Top row: UAV-derived True Color; middle row: Canopy Height Model (CHM) (higher values are in lighter tones); bottom row: NDVI for March, June, September, and November 2018. Boxes (ac) show the tree crown object perimeters of three individual trees throughout the growing season.
Drones 06 00343 g003
Figure 4. (a) Frequency of trees at leaf development stages 1–5 recorded on 2 April 2018. (b) Monthly frequency density distributions for non-grafted UCB-1 UAV NDVI vegetation data from February to December 2018. Error bars show standard deviation.
Drones 06 00343 g004
Figure 5. Box plots of values for tree crown: (a) height, (b) area, (c) compactness, and (d) mean NDVI from March to December 2018. Boxes indicate 1st and 3rd quantile, whiskers indicate minimum and maximum.
Drones 06 00343 g005
Figure 6. Frequency of number of trees at various: (a) crown sizes and (b) tree heights from March to December 2018. Error bars show standard deviation.
Drones 06 00343 g006
Table 1. Summary statistics of field-based tree growth characteristics.
Value Tree Height (cm)Trunk Caliper (cm)Crown Width (cm)Crown Height (cm)Crown Volume (cm3)Crown Size (m2)
Min2504.51271903.71.6
Max62718.562357096.938.8
Range 377 14 496 380 93.2 37.2
Mean50313.838143338.815.1
Median51014.038644039.314.9
Table 2. Correlation analysis (R2) among selected UAV-based measures over time; ** represents significant linear correlations with a p-value less than 0.001. Rows are ordered by the strongest average R2.
UAV-Measured 28 March 18 May 13 June 22 August 27 September 9 November18 December UAV-Measured
Tree height (m) 0.057 ** 0.532 ** 0.549 ** 0.468 ** 0.548 ** 0.533 ** 0.001 ** Crown size (m2)
Vegetation (NDVI) 0.214 ** 0.3 ** 0.43 ** 0.257 ** 0.272 ** 0.291 ** 0.024 ** Crown size (m2)
Vegetation (NDVI) 0.116 ** 0.178 ** 0.238 ** 0.198 ** 0.153 ** 0.217 ** 0 ** Tree height (m)
Tree height (m) 0.124 ** 0.006 ** 0 ** 0.028 ** 0.006 ** 0.001 ** 0.015 ** Compactness
Vegetation (NDVI) 0.009 ** 0.011 ** 0.039 ** 0 ** 0.022 ** 0.096 ** 0.011 ** Compactness
Crown size (m2) 0.063 ** 0.028 ** 0.001 ** 0.011 ** 0.009 ** 0 ** 0.022 ** Compactness
Table 3. Correlation analysis (R2) of field-based tree crown measures and UAV-based tree crown measures for March to December 2018; * and ** represent significant linear correlations with a p-value smaller than 0.01 and 0.001, respectively. Rows are ordered by the strongest average R2.
Field-Measured28 March18 May13 June22 August27 September9 November18 DecemberUAV-Measured
Trunk caliper (cm)0 **0.746 **0.7740.729 **0.750.765 **0.005 **Crown size (m2)
Tree height (cm)0.15 **0.631 **0.6740.685 *0.701 *0.707 **0.157 *Tree height (cm)
Trunk caliper (cm)0.285 **0.6 **0.603 **0.572 **0.594 **0.587 **0.204 **Tree height (cm)
Crown volume (m3)0.221 **0.58 **0.6 **0.592 **0.617 **0.616 **0.161 **Tree height (cm)
Crown height (cm)0.134 **0.563 **0.608 **0.629 **0.63 **0.638 **0.154 *Tree height (cm)
Crown width (cm)0 **0.577 **0.639 **0.613 **0.598 **0.657 **0.004 **Crown size (m2)
Crown volume (m3)0 **0.559 **0.65 **0.591 **0.621 **0.657 **0 **Crown size (m2)
Crown size (m2)0.001 **0.566 **0.624 *0.6050.588 *0.6440.002 **Crown size (m2)
Crown width (cm)0.189 **0.316 **0.304 **0.274 **0.308 **0.297 **0.095 **Tree height (cm)
Tree height (cm)0.001 **0.292 **0.363 **0.308 **0.361 **0.371 **0.004 **Crown size (m2)
Crown height (cm)0.001 **0.285 **0.346 **0.289 **0.34 **0.348 **0.001 **Crown size (m2)
Crown size (m2)0.176 **0.28 **0.267 **0.241 **0.273 **0.264 **0.09 **Tree height (cm)
Crown volume (m3)0.056 **0.016 **0.013 **0.013 **0.032 **0 **0.004 **Crown shape
Crown size (m2)0.055 **0.056 **0.019 **0.019 **0.036 **0.001 **0.015 **Crown shape
Publisher’s Note: MDPI stays neutral with regard to jurisdictional claims in published maps and institutional affiliations.

