Article

Development of UAV-Based PM2.5 Monitoring System

1
Department of Environment and Pollution Engineering, Technical Engineering College-Kirkuk, Northern Technical University, Kirkuk 36001, Iraq
2
RIKEN Center of Advanced Intelligence Project, The Goal-Oriented Technology Research Group, Disaster Resilience Science Team, Tokyo 103-0027, Japan
3
Department of Multimedia, Faculty of Computer Science & Information Technology, Universiti Putra Malaysia, Serdang 43400, Malaysia
4
Department of Civil Engineering, Geospatial Information Science Research Centre (GISRC), Faculty of Engineering, Universiti Putra Malaysia, Serdang 43400, Malaysia
5
Department of Physics, College of Education for Pure Sciences, University of Kirkuk, Kirkuk 36001, Iraq
*
Author to whom correspondence should be addressed.
Drones 2021, 5(3), 60; https://doi.org/10.3390/drones5030060
Submission received: 22 June 2021 / Revised: 6 July 2021 / Accepted: 7 July 2021 / Published: 13 July 2021
(This article belongs to the Special Issue Advances in Civil Applications of Unmanned Aircraft Systems)

Abstract

:
This paper proposes a UAV-based PM2.5 air quality and temperature-humidity monitoring system. The system includes an air quality detector comprising four Arduino sensor modules. Specifically, it includes a dust (DSM501A) sensor and a temperature and humidity (DHT11) sensor. The NEO-6M GPS module and DS3231 real-time module are also included for input visualization. A DIY SD card logging shield and memory module is also available for data recording purposes. The Arduino-based board houses multiple sensors and all are programmable using the Arduino integrated development environment (IDE) coding tool. Measurements conducted in a vertical flight path show promise where comparisons with ground truth references data showed good similarity. Overall, the results point to the idea that a light-weight and portable system can be used for accurate and reliable remote sensing data collection (in this case, PM2.5 concentration data and environmental data).

1. Introduction

Fast economic growth over the latest decade in some Asian regions has resulted in rapid urbanization and industrial development. Green landscapes have been replaced by housing estates and high-rise buildings and, when combined with increased vehicular utilization, have led to acute atmospheric contamination (dust and haze). As a result, concentrations of particulate matter in the air have also increased to undesirable levels [1]. Therefore, it is necessary to identify the main sources of atmospheric aerosols to limit their expanding level, thus requiring sufficient monitoring [2].
Measuring particulate matter (PM) pollution in the air is acknowledged as an imperative task to control air pollution [3]. Since air pollution is seemingly inescapable in most urban settings, the ability to gauge current air quality is necessary [4]. Classic methods afford daily measurements but are stationary, costly and have a low spatial resolution [5]. This is because air quality monitoring and observation are conducted by static monitoring stations where these stations are limited within a given suburb or city [4,5,6]. Their locations are also fairly sparse, situated at irregular spatial intervals causing air samples collection and assessment to be less consistent [6]. This problem is further asserted in [7,8], where the authors argue that sufficient sample data cannot be reliably obtained with fixed monitoring stations being one kilometer from the sampling position. Fixed stations are also inflexible since data can only be observed on the ground surface [8], which might not be a good overall indication of air contamination. Another serious and worth reiterating issue is cost due to the necessity of erecting multiple stations at different locations [9].
Due to these issues, a mobile solution will be more effective and practical. We bring attention to Unmanned Aerial Vehicles (UAVs), which have been used to obtain data in various types of situations and environments [10,11,12]. When equipped with the necessary sensors, in the context or air pollution monitoring, UAVs can act as independent air monitoring stations [11] as well as air emission trackers [12].
Besides that, UAVs make the incorporation of flexible and innovative technologies convenient. For example, the various sensors can communicate wirelessly via Bluetooth to interface with low-powered and low-cost devices (e.g., smartphones) during the sampling of air contaminants or even when measuring temperature, humidity, and/or air pressure [7]. UAV-based systems have been used in both civil and military applications [13,14,15] and have been increasingly used in the field of remote sensing [16,17,18]. UAVs can also be remotely controlled when needed, since they hover/fly at a visible 100-200m altitude [19].
The widespread use of mobile sensors attached to UAVs have been performed in various previous studies. In [20], the authors used a set of mobile sensors to collect three-dimensional PM2.5 concentrations and a vertical profile of particle concentrations (at 300–1000 m) over a four-day period, which allowed them to model the relationship between meteorological factors and PM2.5 mass [20]. UAV-based PM2.5 measurements were also being collected at lower altitudes (10–50 m), as proposed by the study in [21]. Sensor optimization was also shown to be possible where UAV-mounted mobile sensor coverage was shown to be possible and effective in [22]. The work in [23] used eight eight-sensor modules connected to a DJI Matrice 600 UAV, where air quality assessment was performed at 10 and 20 m altitudes.
In urban areas, monitoring PM2.5 particulate matter pollution is of great interest due to its adverse impact on health. Moreover, PM2.5 monitoring at ground levels (1–3 m) is not sufficient. Hence, monitoring on a vertical track and evaluation at different elevations allows more information to be collected for air quality assessment. Therefore, the aim of this study is to investigate a UAV-based PM2.5 monitoring system for air quality monitoring. In this work, sensors are mounted onto a small UAV to collect information at specified altitudes over a designated study area. We look at overcoming obstacles and difficulties when obtaining sensed data by sensor selection. We evaluate the system setup at different elevations to assess the measurement accuracy for overall air quality monitoring. The system, which is effectively an air quality detector, comprises sensors based on the Arduino platform.

2. Materials and Methods
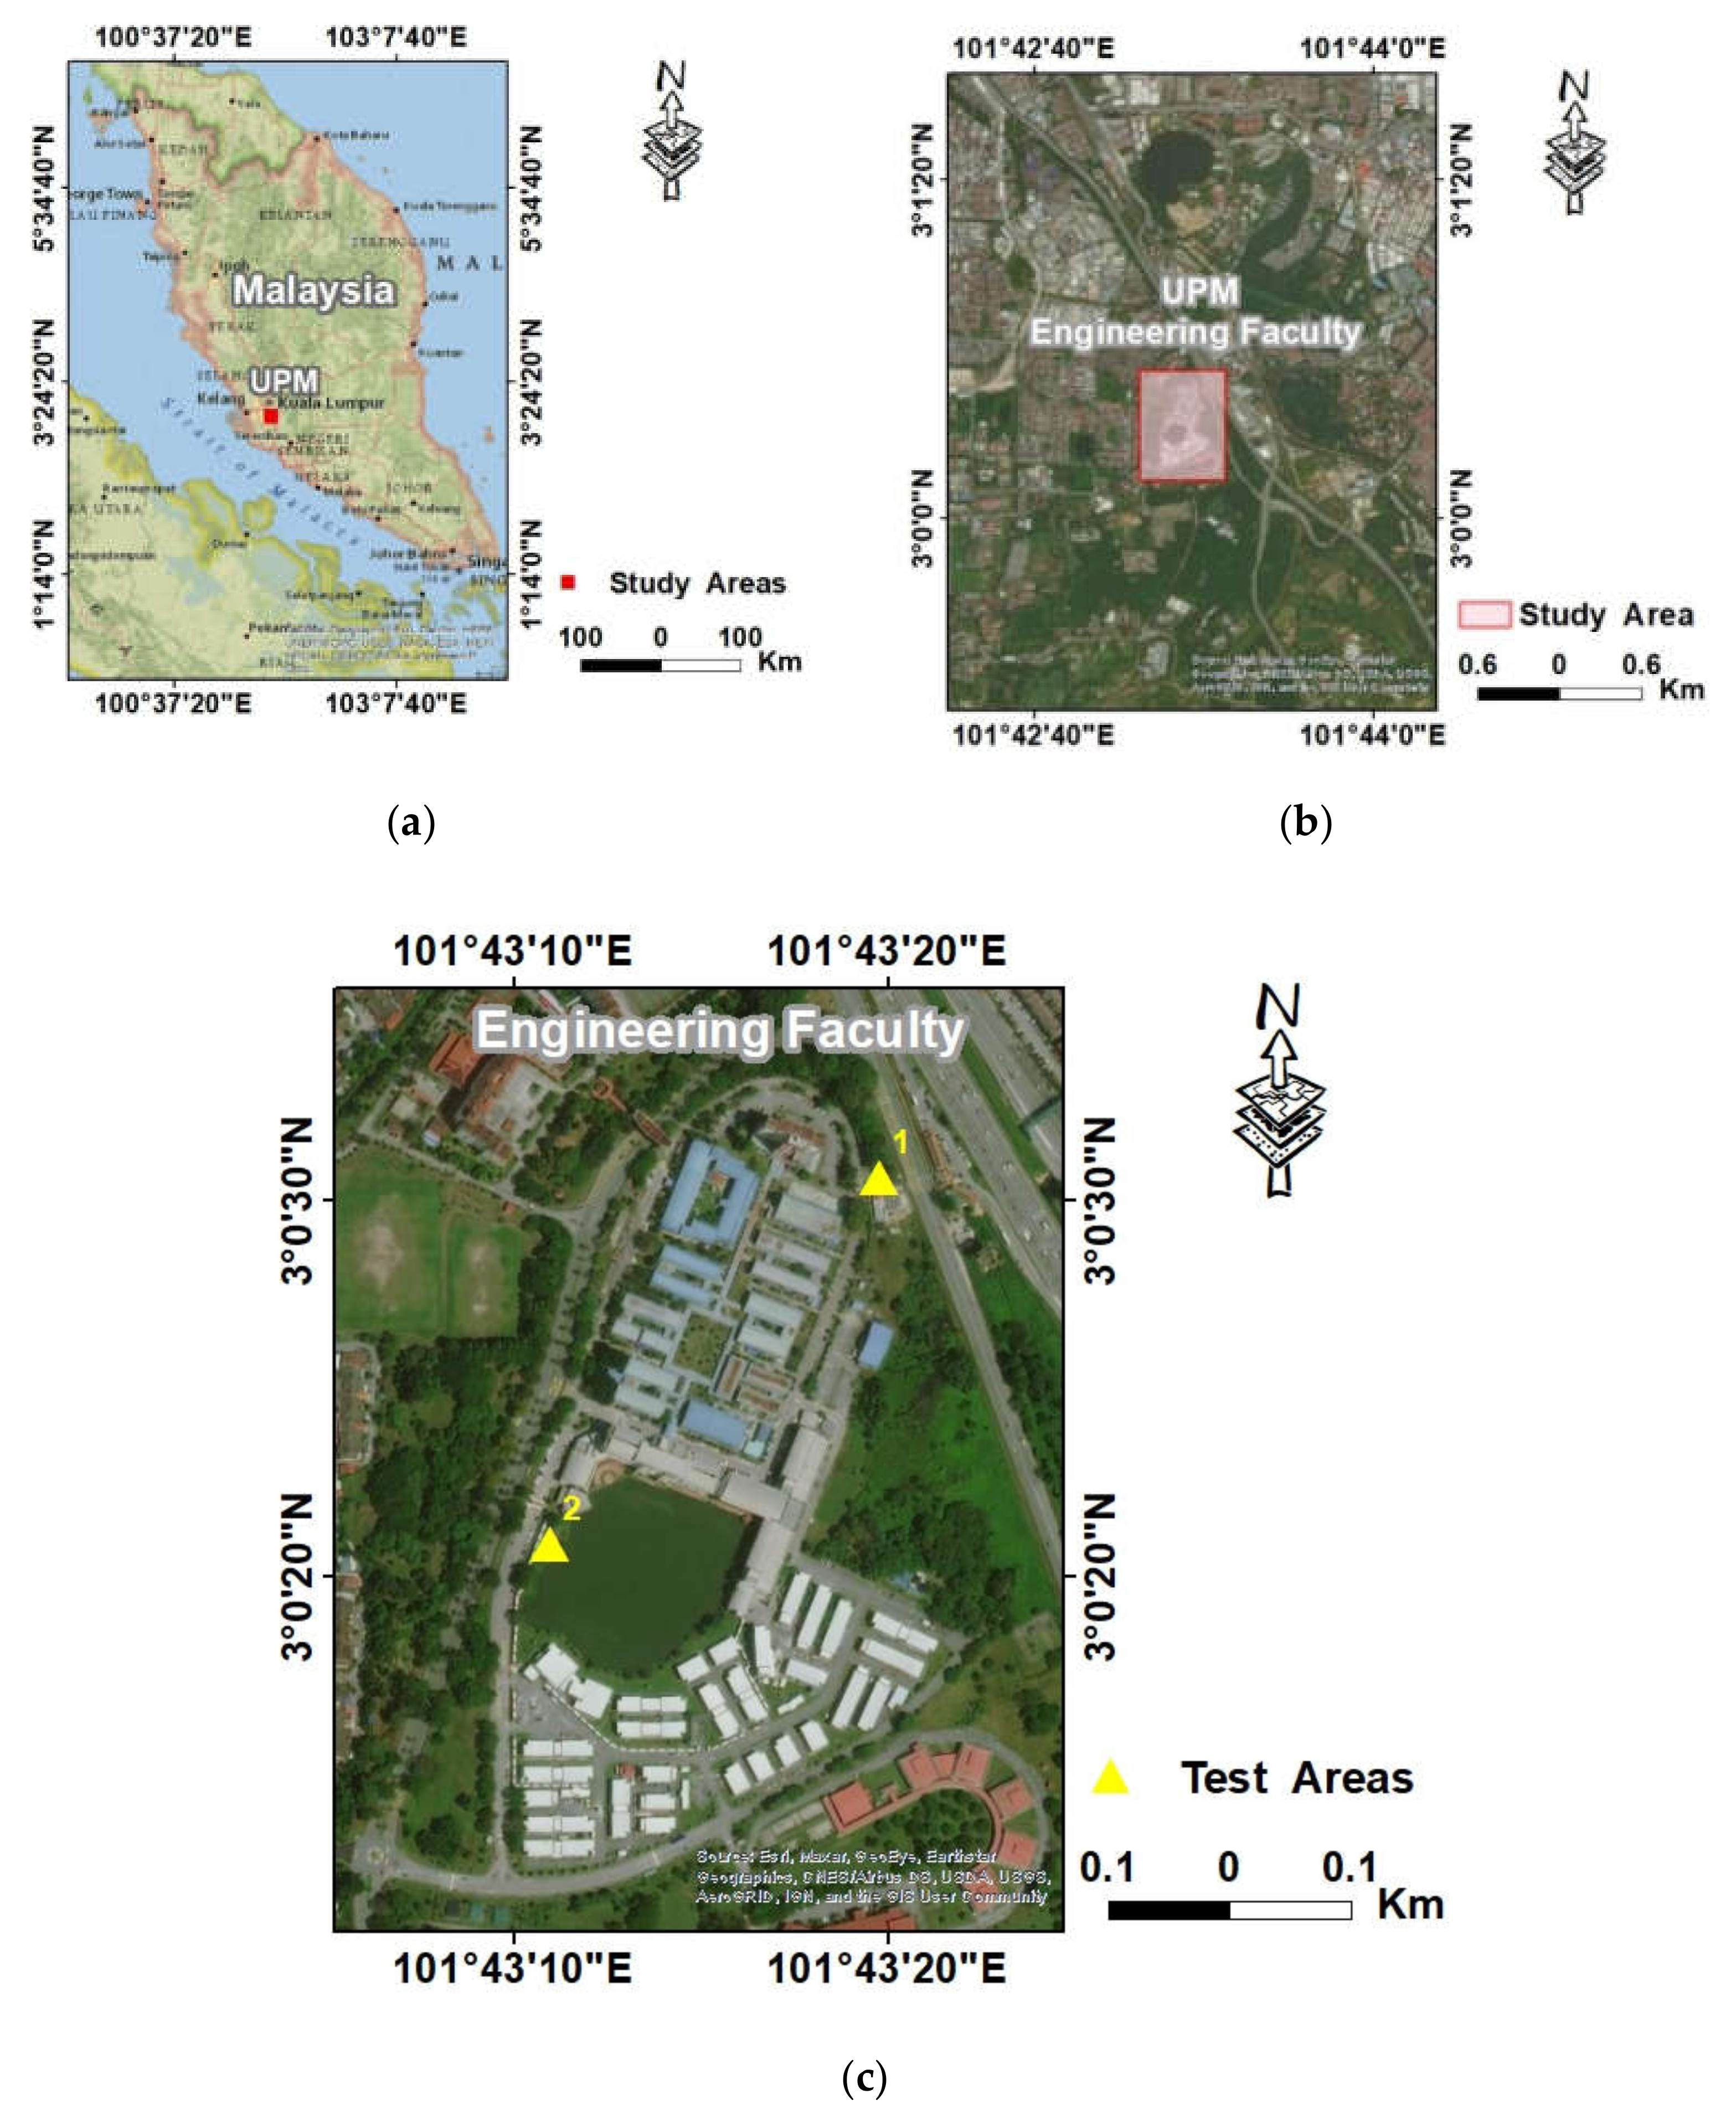
2.1. Study Area

The study area is the Faculty of Engineering, Universiti Putra Malaysia. It lies between longitudes (101°43′05″ to 101°43′23″) East and latitudes (3°00′11″ to 3°00′35″), which is within the northern part of the university itself (Figure 1). Measurements were taken during July 2017.
The climate in Malaysia is naturally tropical, with an annual monsoon southwest from April to October, and northeast monsoons from October to February. During July, daytime temperatures can reach highs of 32 °C, while averaging a minimum of 23 °C at night. In July 2017, the maximum recorded temperature was 36 °C, whereas the minimum was 21 °C. The average daily relative humidity was approximately 78%. Average daily wind speed was approximately 7 km/h [21,24,25]. The study area was selected due to the convenience of using the instruments facilitating ease for data acquisition.

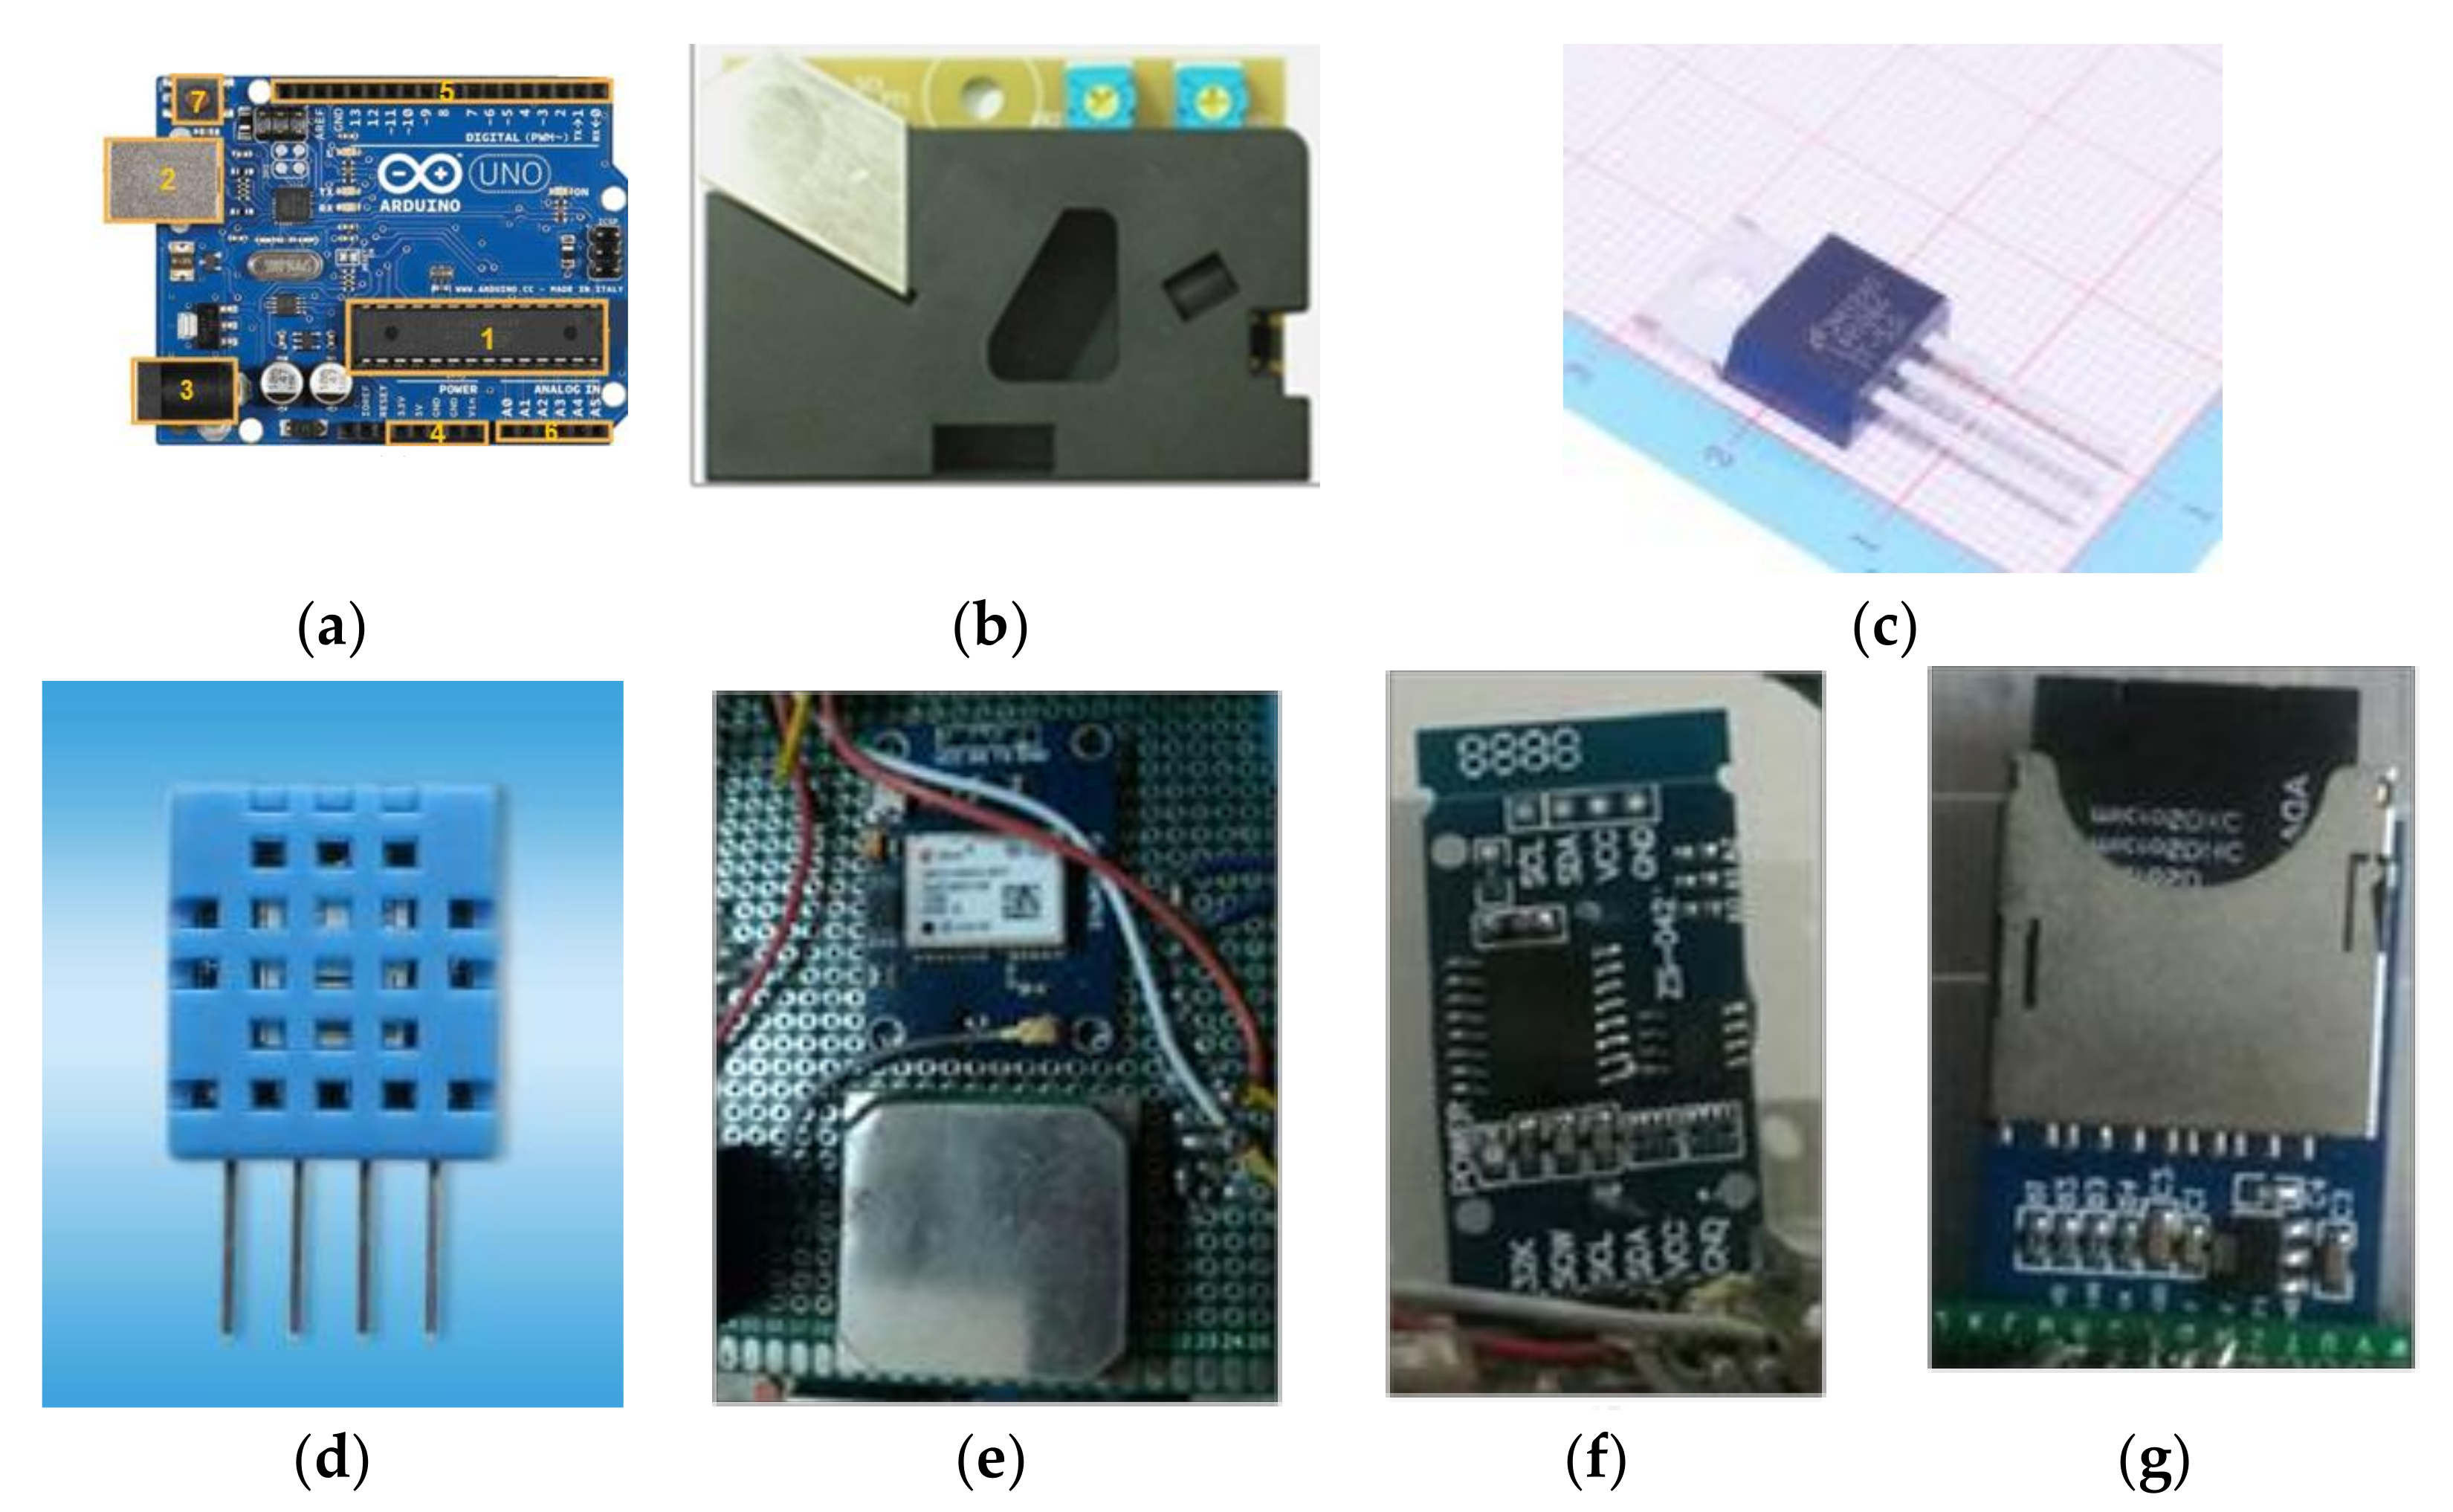
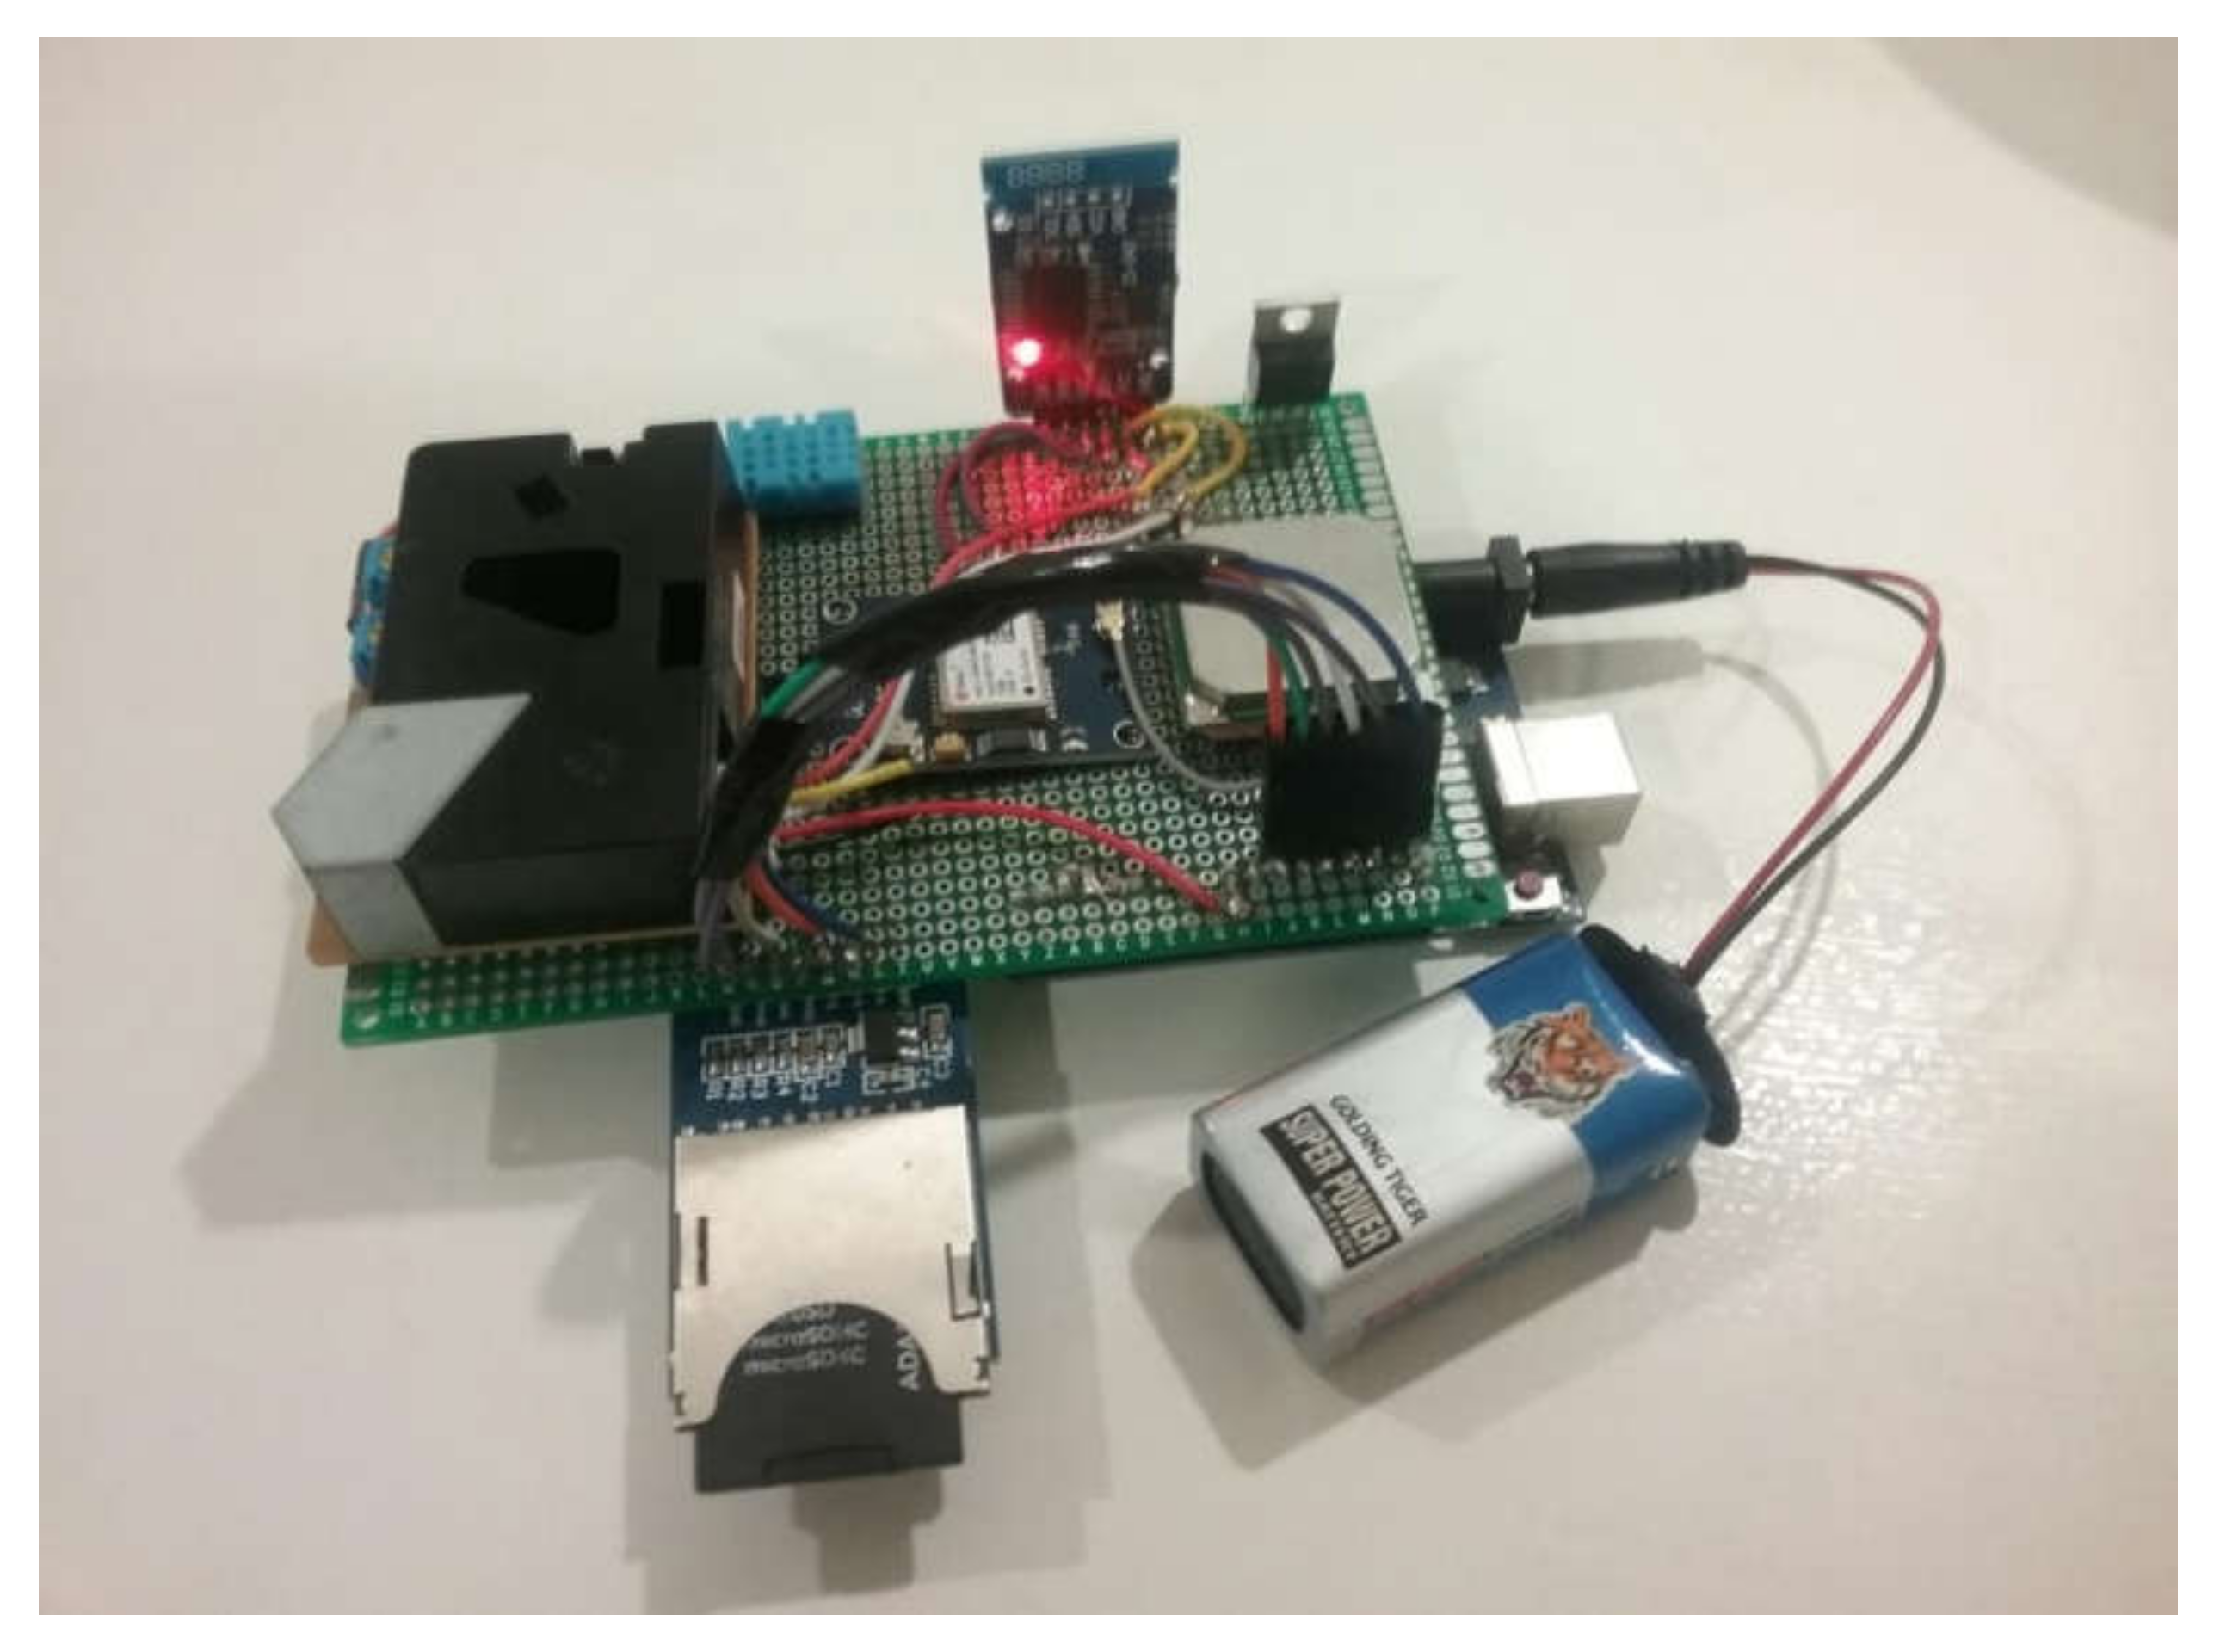
2.2. System Components

The monitoring components and setup of the UAV system are, respectively, shown in Figure 2 and Figure 3. The monitoring components in Figure 2 consist of:
  • 1-Arduino UNO R3 board;
  • 1-Dust sensor module (DSM501A);
  • 1-Regulator (LM1084);
  • 1-Temperature and humidity sensor;
  • 1-GPS module (model #: NEO-6M);
  • 1-Real-Time Module DS3231;
  • 1-SD card Logging Shield and memory for data storage.
Figure 3 shows the laptop and the UAV-based system itself, which is the PM2.5 monitoring system.

2.2.1. Arduino Uno R3 Board

In this research, we opted to use Arduino as it is open source. The platform is also user friendly, consisting of hardware and software with the ability to include sensors for easy input acquisition. We used the Arduino Uno R3 board consisting of the following parts:
  • Microcontroller;
  • USB port;
  • DC power jack;
  • Power pins;
  • Digital Inputs/Output pins;
  • Analog Pins;
  • Reset Bottom.
With the board operating at 5 volts, it can easily be powered using a USB computer connection as well as an AC-to-DC adapter or a 9-volt battery as an external supply. The PM2.5 dust sensor and temperature and humidity sensors (DHT11) are connected to the board along with the other components (i.e., NEO-6M GPS module, real-time module DS3231, and Arduino DIY SD card Logging Shield). The Arduino Uno board is programmed using the Arduino Software integrated development environment (IDE).
For the initial setup, we separately linked each sensor with the Arduino board followed by uploading necessary codes to each sensor. After several experimentations, we calibrated all sensors with the other components on the board. All codes were then integrated, including code for memory and storage processing tasks. These steps culminated in the obtainment of data belonging to each sensor in addition to position and date/time information. In our system, the built-in SD card Logging Shield enables data to be saved. The existing Arduino has an original regulator to switch the voltage to 5V and provide 800 mA.

2.2.2. Dust Sensor Module (DSM501A)

As we intend to keep cost down, we opted with a relatively cheap commercial dust sensor, i.e., the DSM501A model shown in Figure 2b. Since our setup of air pollution instruments is meant to be portable, we have had to limit the volume of contaminants being measured, consistent with the work in [26].Essentially, the sensor consists of:
  • Light Emitting Diode (LED) lamp;
  • The detector;
  • The signal amplifier circuit;
  • The output drive circuit1;
  • The output drive circuit2;
  • The heater induced air flow.
Summarizing from [27], dust is detected when matter passes upstream (due to the self-heating heater) through the measuring scope. The lights from the LED are activated by the dust and is realized as a signal by the detector, where the signal is Pulse Width Modulated (PWM) through amplification and filtering. This dust sensor indicates the air quality by computing the dust (i.e., PM2.5) concentrations. The PM2.5 particulate matter measurements give us the full extent about the environmental air conditions that could adversely affect health. We reiterate that the dust sensor setup is small, light-weight, and easy to install, requiring only 5 V input for signal processing.

2.2.3. Regulator (LM1084)

An external regulator was used for supporting the device operation. We linked the LM1084 regulator to the Arduino board, which switches the voltage to 5 volts while providing 5 amperes of current. Figure 2c shows the LM1084 regulator used in this research.

2.2.4. Temperature and Humidity Sensor Module (DHT11)

We opt for a wireless sensor system for practical purposes, while ensuring accurate measurement of outdoor environmental temperature and humidity. The sensor consists of a resistive humidity measure section and a temperature sensor section. The 8-bit high-performance single-chip microcontroller furthermore affords high-quality, rapid reply, cost-effective and anti-jamming capabilities. DHT11′s power intake is relatively low at 5 volts, and the extreme typical current is approximately 0.5 mA [28].
The value was measured and used to calibrate the DHT11 sensor produced by an Emko thermal controller, which is an industry thermometer. Figure 2d shows the DHT11 sensor that outputs a single digital signal.

2.2.5. NEO-6M GPS Module Compatible with Arduino UNO R3

In order to fix and determine the position of the collected data, we employ a Global Positioning System (GPS) module compatible with the Arduino UNO R3. The GPS in this work affords a satellite-based navigation system from 24 satellites. The GPS module consists of an integrated audio frequency chip, a baseband chip, and an independent core central processing unit (CPU). The main controller can link GPS devices to 𝑍-axis gravity accelerometers [29].The location precision of the GPS is ~1-m, which is acceptable for field tests and road experiments [29,30].
The NEO-6M GPS used in this work is a highly sensitive receiver that provides positions with data that are received from the satellites’ signals. In addition, correction records are also received from the satellites, which is the reason why location precision can be improved by up to 1 m [30]. In terms of power consumption, the NEO-6M GPS serial communication operates at 3.3 V, which is lower than the Arduino board itself at ~5-V. Linking the GPS module to Arduino is also easy via direct serial pins. Figure 2e shows the NEO-6M GPS module used in this study.

2.2.6. Real-Time Module (DS3231)

The Real-Time Module DS3231 is included for precise date and time display at each data collection point (precise down to approximately a few minutes per year). The main advantage of this module is its in-volatility, where data and time information are retained even after electrical current is turned off (due to the internal battery). The DS3231 module is shown in Figure 2f. It consists of an internal oscillator that is impervious to external environmental factors.

2.2.7. Arduino DIY SD Card Logging Shield

The data collected in this research are stored on the SD card in the form of a text file. Specifically, the SD card logging shield is connected to the Arduino board in order to achieve this. Figure 2g represents Arduino DIY SD card logging shield.

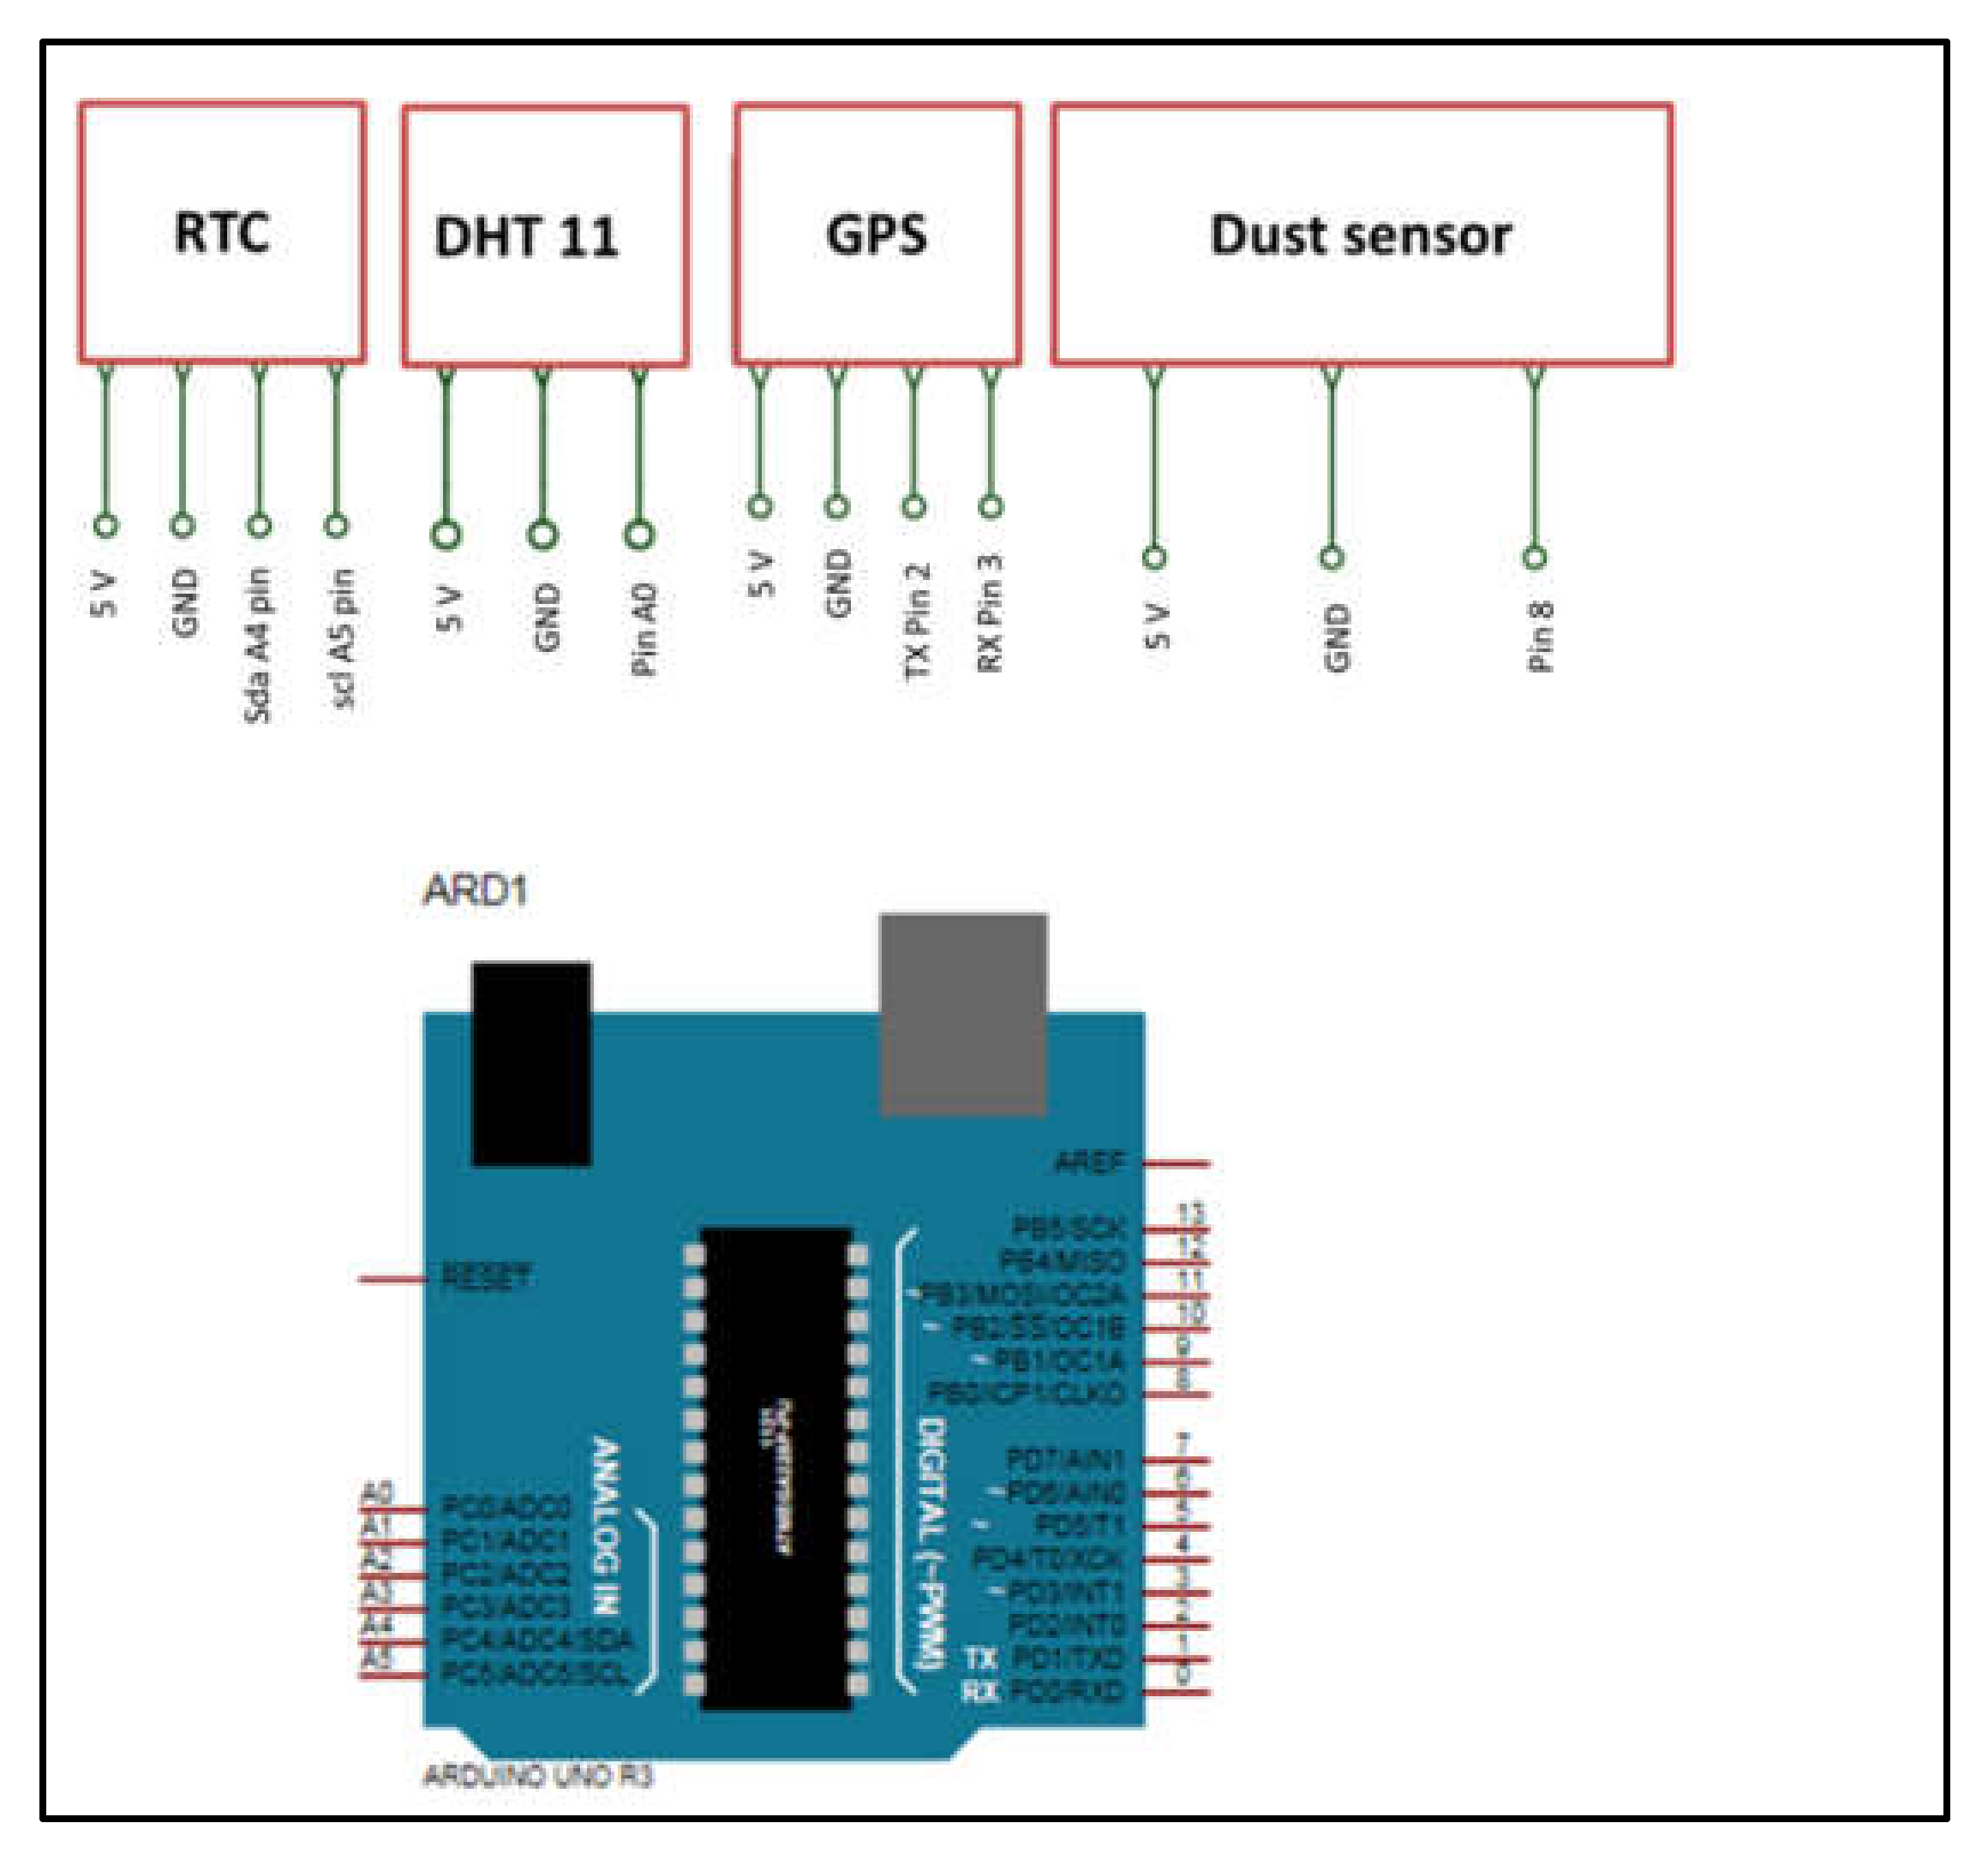
2.3. Project Circuit

The UAV-based PM2.5 and metrological data monitoring system’s project circuit is shown in Figure 4.

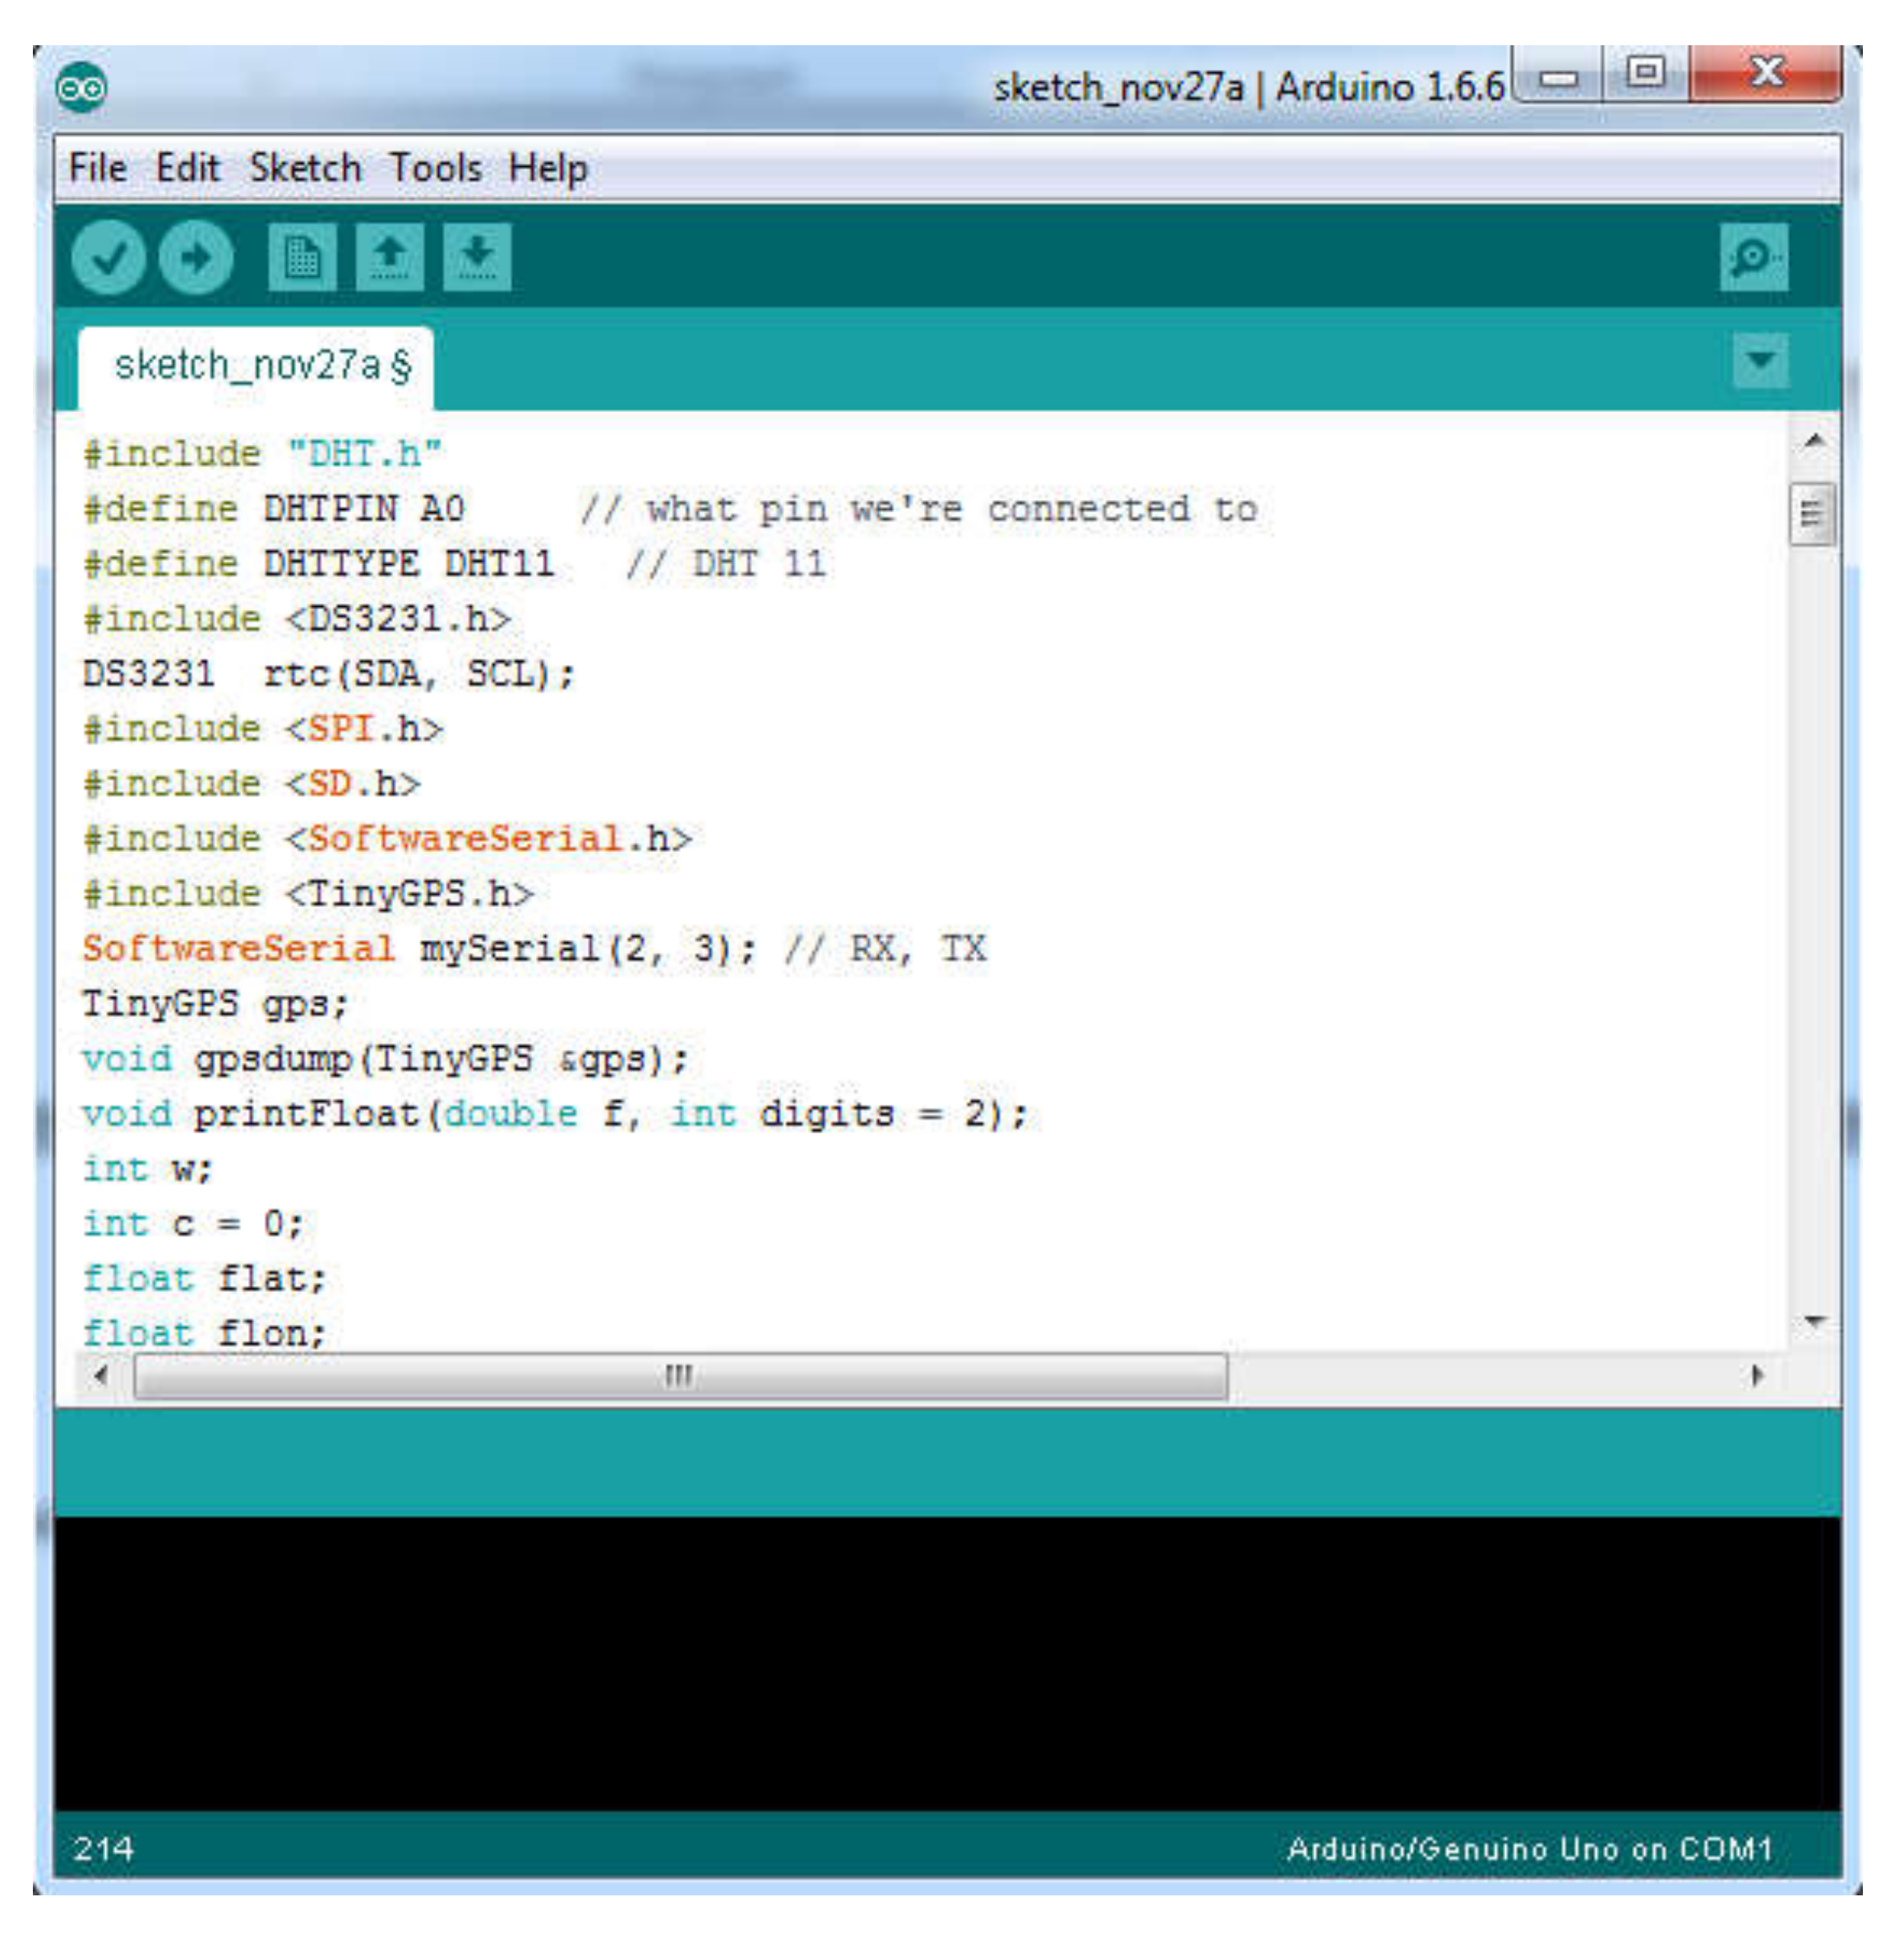
2.4. Software and Code

We programmed the Arduino using its open-source IDE to interface with the board [31]. Figure 5 shows a sample of the uploaded code based on Arduino program version 1.6.6.

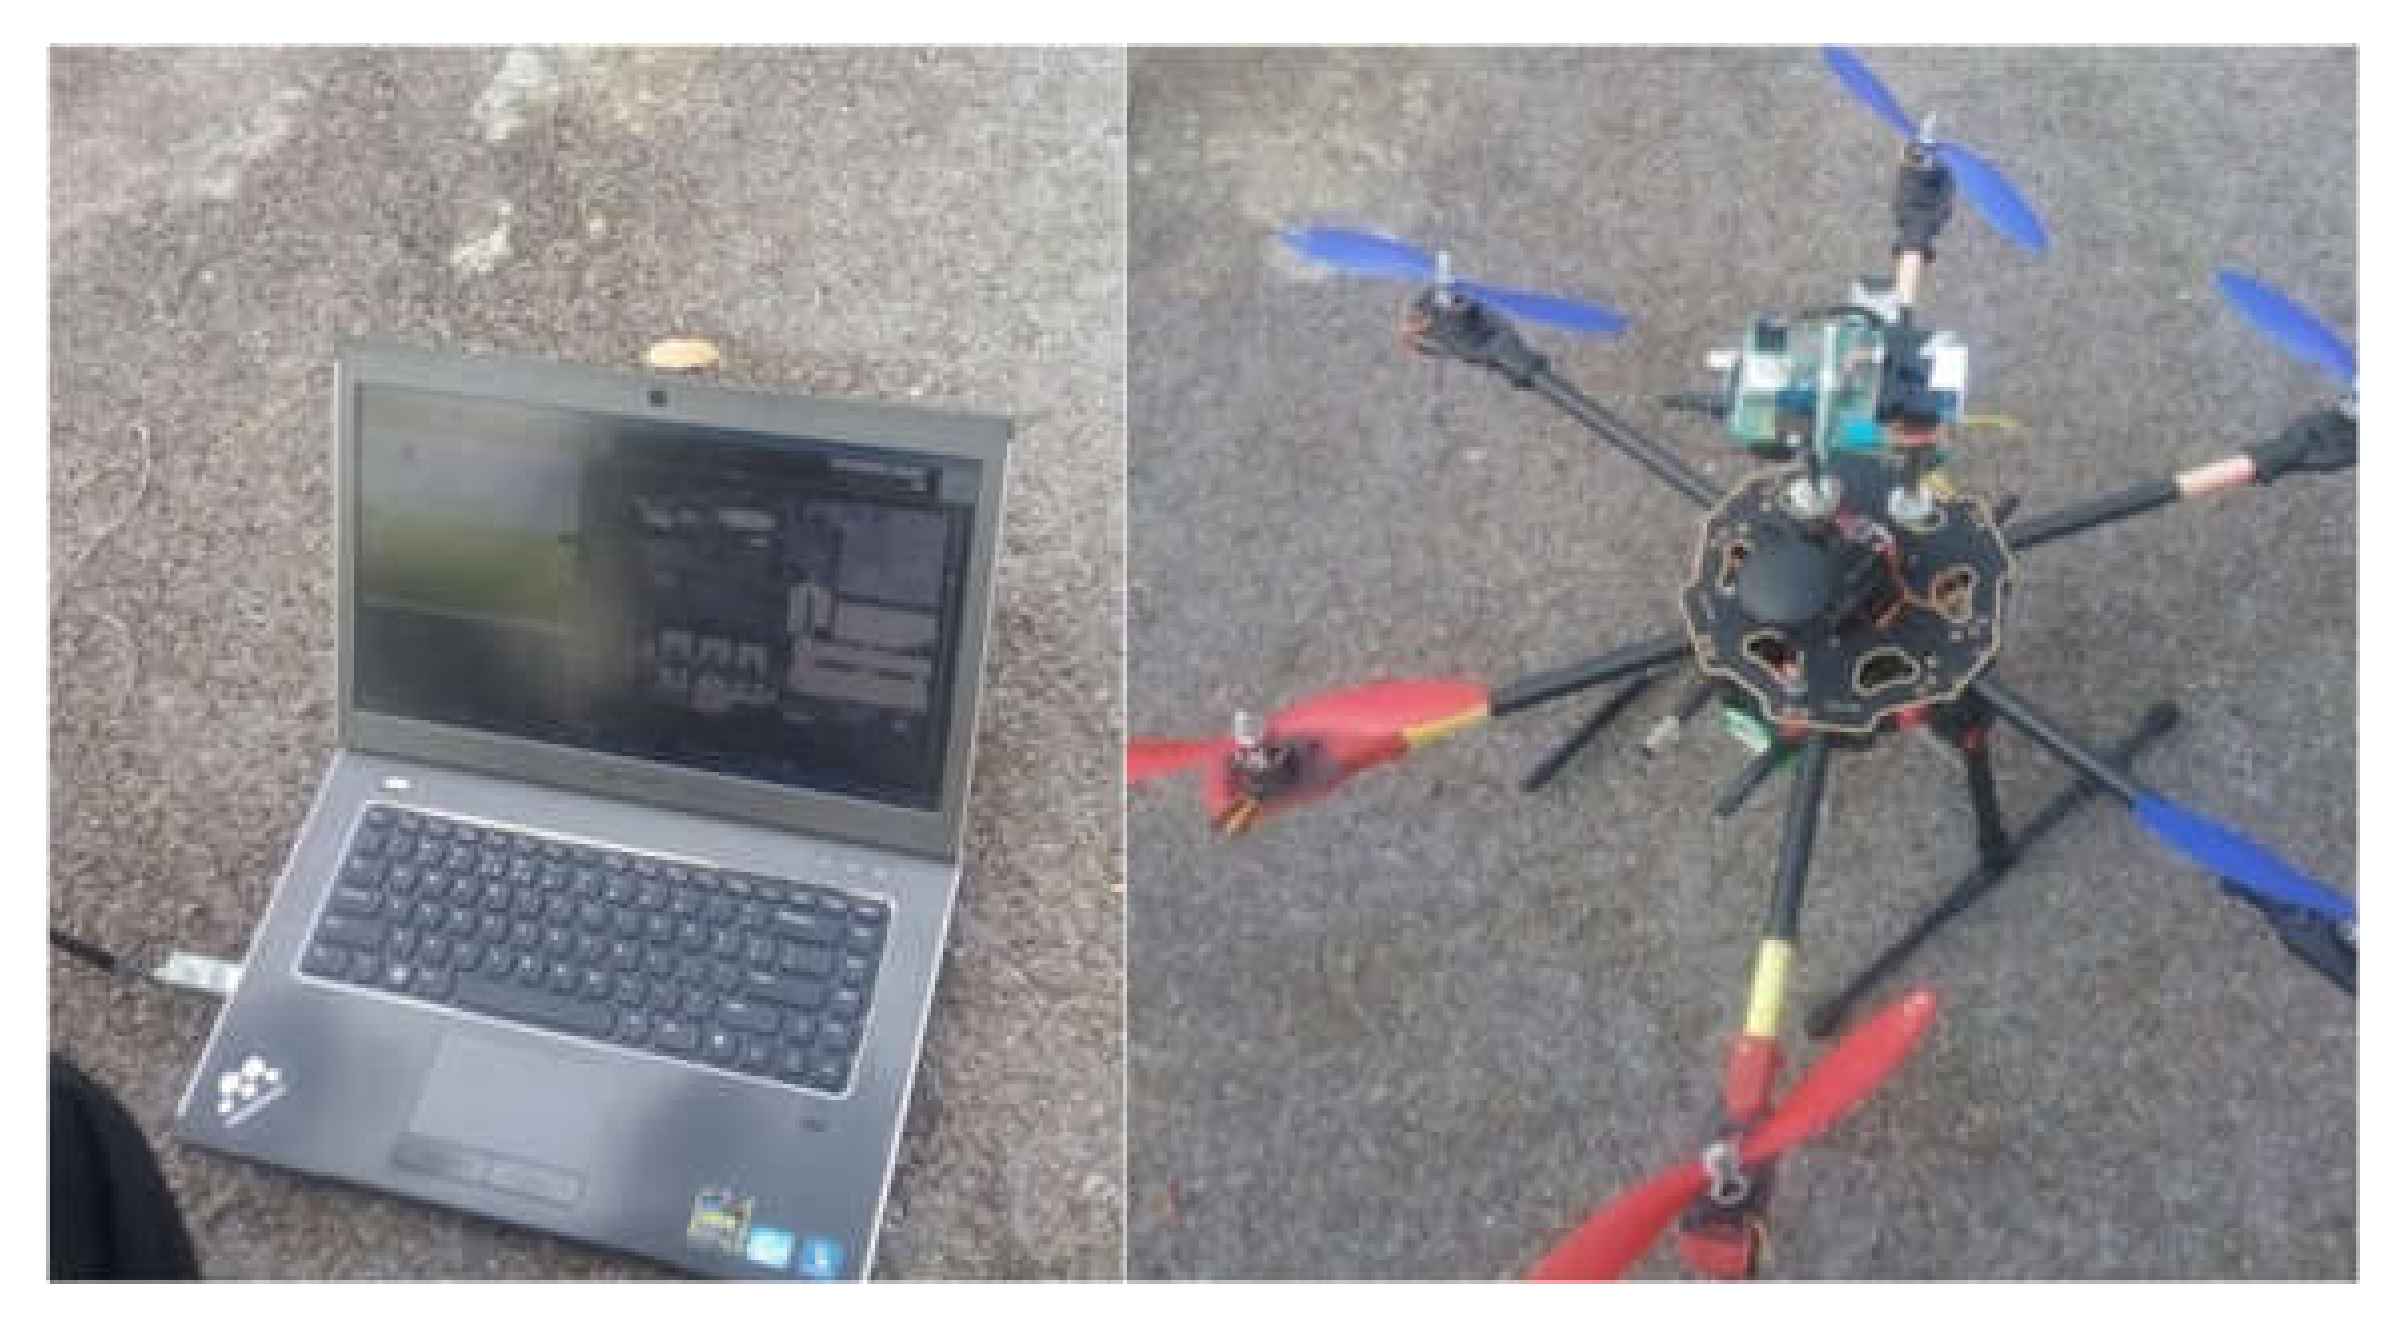
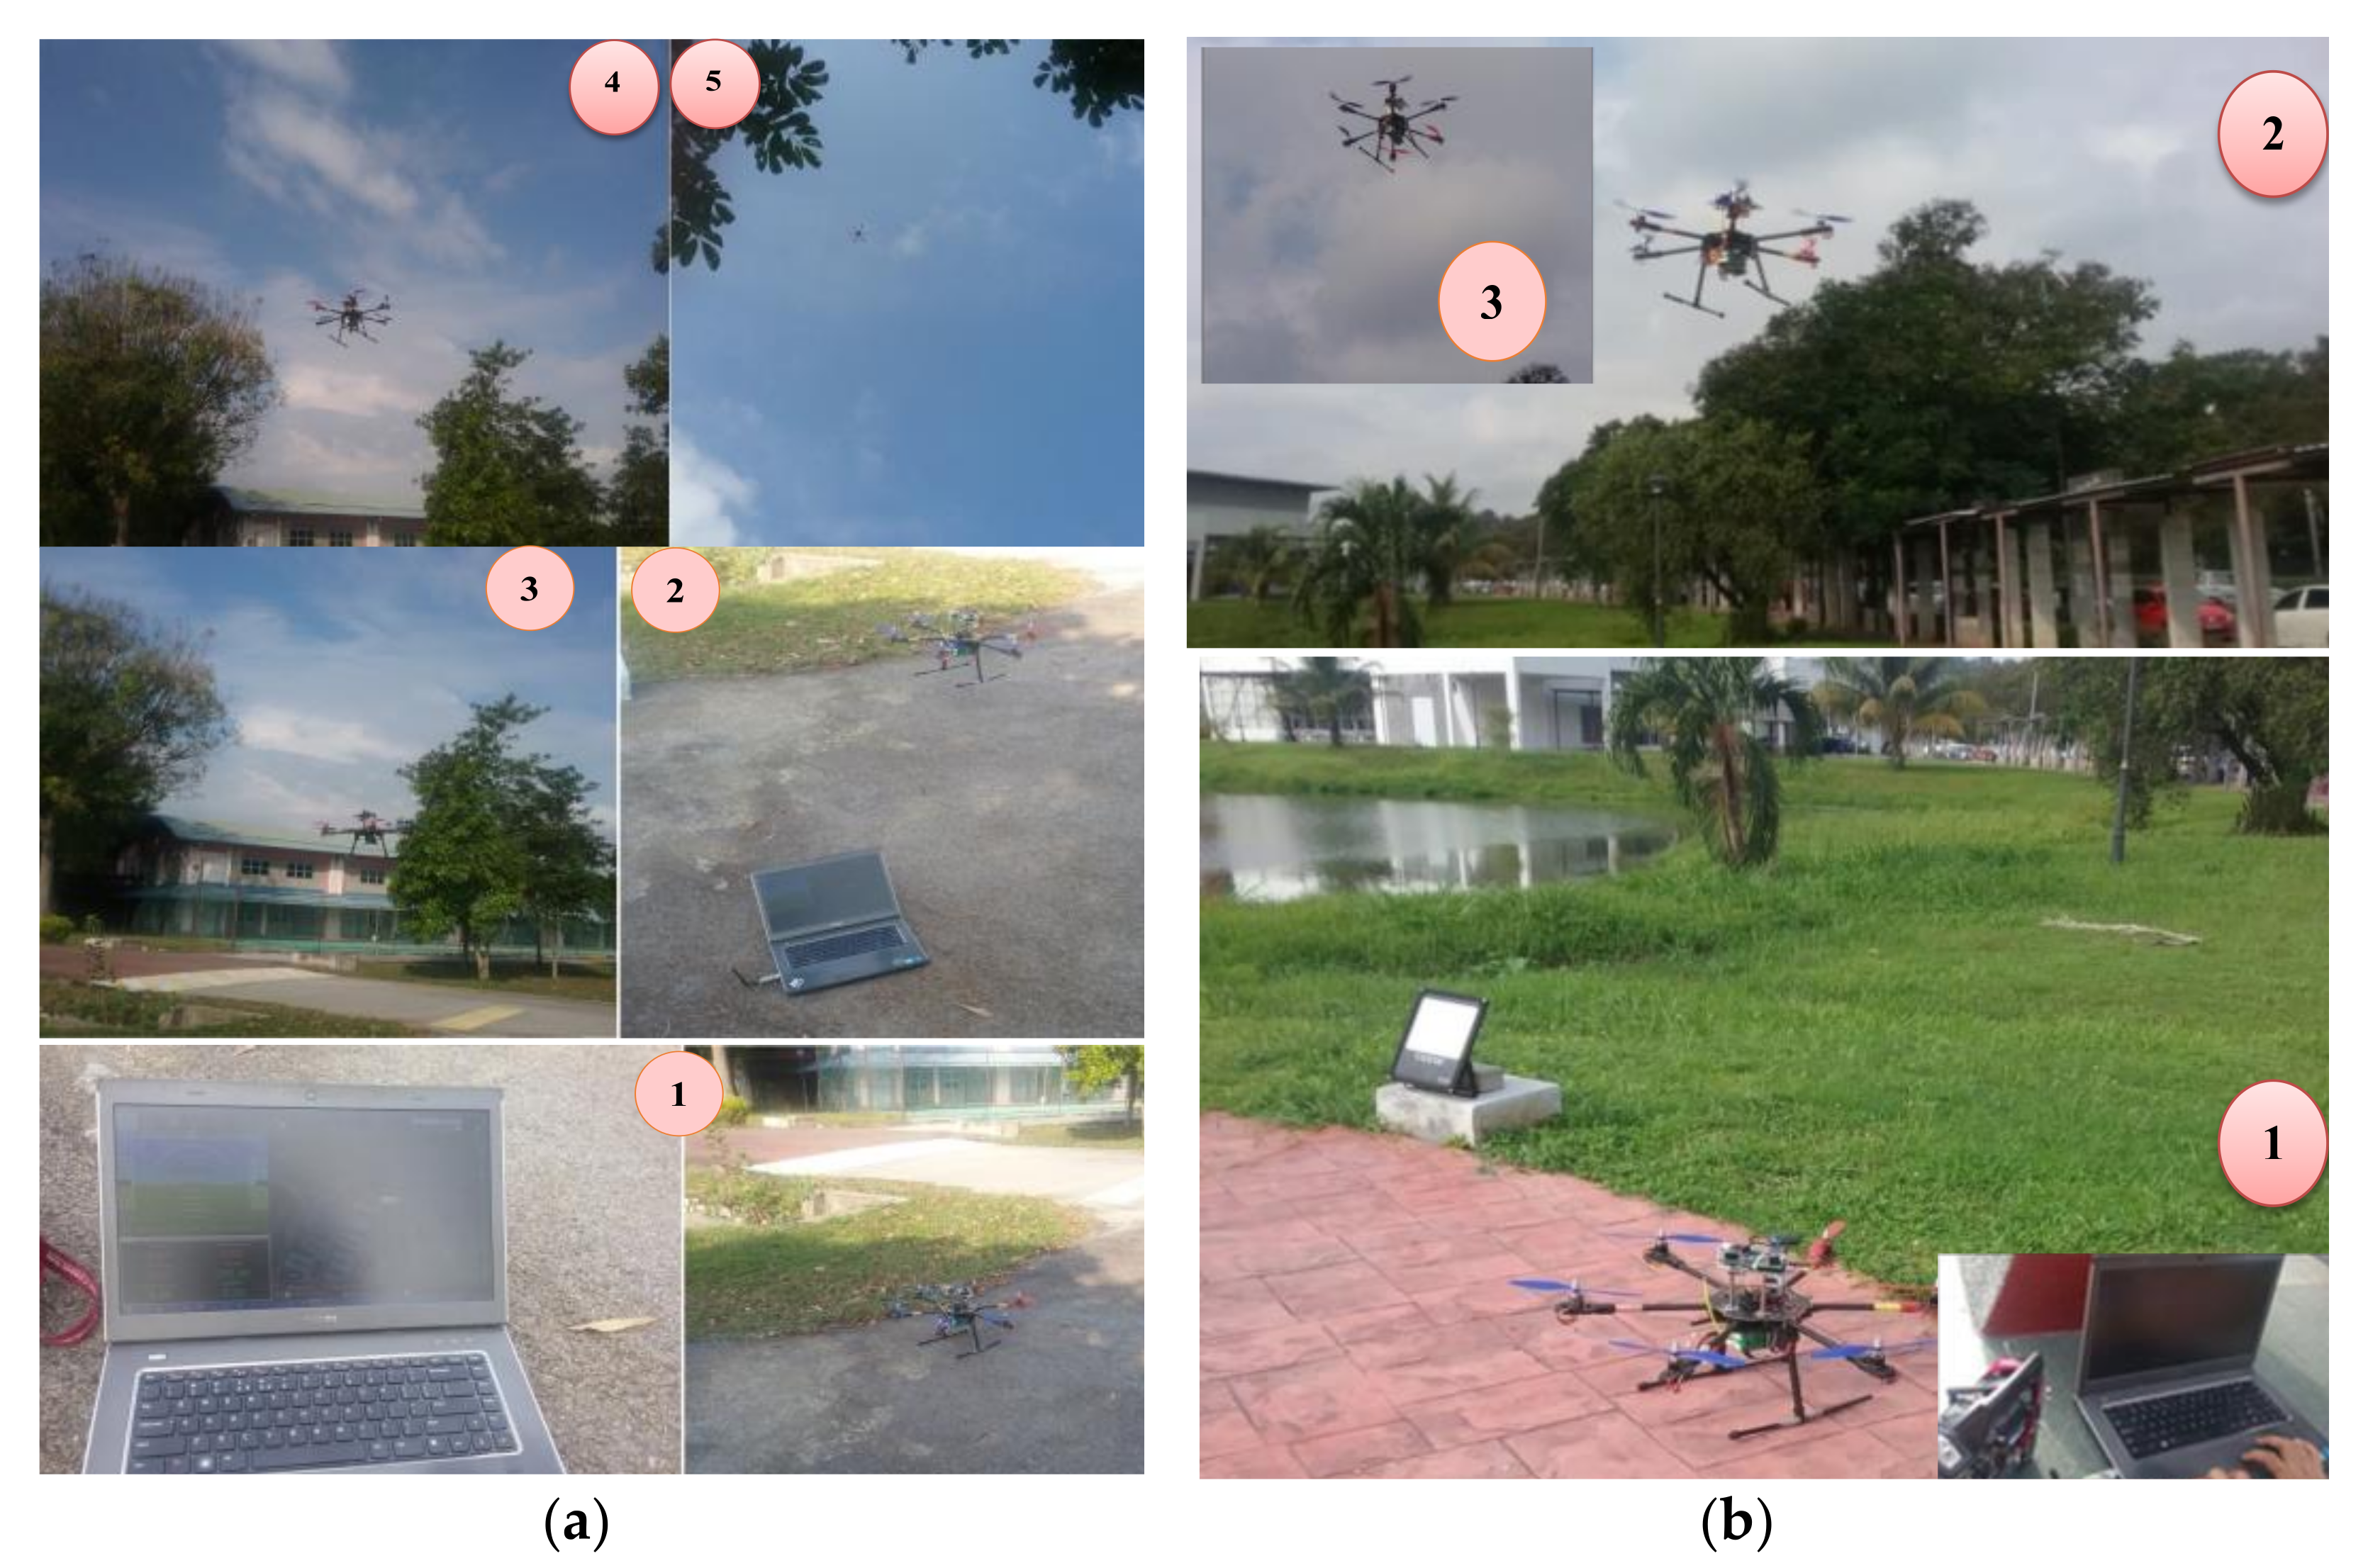
2.5. In Situ Data Collection and UAV

The UAV used in this research was the 6-axis folding hexacopter (TAROT 680PRO) with the TL68P00 aircraft frame kit provided by the Geospatial Information Science Research Center (GISRC) Lab, Engineering Faculty, Universiti Putra Malaysia. Snapshot images of the hexacopter are shown in Figure 6.
Two data collection mechanisms were employed, namely, (i) the vertical flight path data collection (exceeding 50-m) and (ii) ground measurements. The UAV was autonomously flown using an autopilot system following the pre-determined flight track in [20]. PM2.5 concentrations, temperature and humidity data were collected and compared with previous records. We discuss the comparison between recorded and current data in the Results section.

2.5.1. Test Area I

Vertical profile data were collected in Test Area I. This was conducted on Tuesday (4 July 2017 at 09:38:07 AM) at the UPM Engineering Faculty situated near the GISRC, with starting coordinates (3.0085036, 101.7221507). Overall, the UAV flight time for this test was approximately 10 min.

2.5.2. Test Area II

After attaching the necessary measuring devices to the UAV and the actual track of the UAV flight was on a vertical profile, data were collected for Test Area II. This was done on the same day but at 09:59:03 AM and at a different location (UPM Engineering Faculty next to the Engineering library’s lake). The starting coordinates were (3.0057969, 101.7197162). The UAV was programmed to fly for approximately 5 min.
Figure 6 shows snapshots of the UAV in several stages of the field work. Figure 6a, furthermore, depicts Test Area I, and Figure 6b shows Test Area II.

3. Experimental Setup and Results

3.1. System Design

Figure 7 shows the combined components of the overall PM2.5 monitoring system. The main advantages of this monitoring system can be detailed as follows:
  • Consist of readymade sensors;
  • Calibration can be done by programmable digital microcontroller;
  • Simple design and available materials;
  • Measure PM2.5, humidity and temperature besides position information with the date and time;
  • The system can be easily extended (adding other sensors and identifying board model);
  • Multi-purpose, multi-fields;
  • The overall assembly time is short;
  • Can be powered by an external supply using a battery;
  • Portable, small size and lightweight;
  • Low cost in comparison with other devices.

3.2. UAV-Based PM2.5 Monitoring System Evaluation Results

3.2.1. Field Test Area I Results

PM2.5 and temperature and humidity data for Test Area I, along the 50-m track flown by the UAV, are as shown in Figure 8a. PM2.5 concentration values range from 36.39 to 59.22 µg/m3, whereas temperature and humidity were within the respective ranges of 28 to 30 °C and 58 to 80%.

3.2.2. Field Test Area II Results

PM2.5 temperature and humidity data for Test Area II, along the 50-m track flown by the UAV, are as shown in Figure 8b. PM2.5 concentration values ranged from 35.40 to 55.04 µg/m3, whereas temperature and humidity were within the respective ranges of 28 to 30 °C and 59 to 80%.

3.3. Ground Monitoring Evaluation Results

Readings obtained from the sensors were compared with reference data from:
  • Malaysian weather data downloaded from NASA data via RETScreen program—Unit Golf Universiti Putra Malaysia Climate History weather data [24].
  • Study area weather information from the Selangor state [25].
Field results were consistent with the above two data sources and comparable with detailed reference data provided by the NASA satellite (i.e., meteorological parameters downloaded via RETScreen Plus program). For PM2.5, all records compared with Air Quality Multimeter were recorded in the same location of each point. Figure 9 shows the testing by Air Quality Multimeter. An EET 100 integrated high-sensitivity dust sensor, Volatile Organic Compound (VOC) sensor, and temperature and humidity sensors made it possible for us to, respectively, measure PM2.5, VOC, and temperature and humidity, in one multimeter-sensor setup for air quality assessment.
For the purpose of evaluating the measurements, we need an alternative device. The Air Quality Multimeter is used to continuously measure the particulate matter content of the environment. It also shows PM2.5 particulate matter levels and temperature/humidity on the monitor display. In order to verify the obtained measurements, we compare the measurements from our system with the Air Quality Multimeter. The reason for choosing the multimeter is due to its high accuracy and fast response.

4. Discussion

Acquiring air quality and weather data by means of UAV has been gaining popularity in recent years. It affords flexibility and portability and also the easy option of connecting any necessary remote sensors. Field experimentations and test flights of UAVs for different sensor gatherings demonstrate the feasibility and promising potential for various remote sensing and monitoring purposes.
In this study, a small, light-weight, and low-cost air quality monitoring system is presented using a mini UAV that is combined with air quality and temperate-humidity sensors. It has been shown to be an effective and efficient system for air quality monitoring in urban areas. The system can be easily programmed using Arduino’s IDE software allowing convenient input and output manipulation. Our system also makes use of SD memory storage technology (card Logging Shield). We have also demonstrated the use and combination of sensors on a simple board setup, which is encouraging for the potential of economical and scalable production/manufacturing of such small and light-weight systems in the future.
As shown in Figure 3, we used a stand to bond the device somewhat further away from the UAV propellers, thus reducing the influence of air and rotor air stream upon the measurements.
We, however, still discovered that some sensor measurements and the test flights were still far from ideal. External factors may have affected measurements, data availability, influence of the rotor air stream upon the measurements, and flight conditions. Otherwise, there was excellent agreement between the sensor measurements with measurements from the Air Quality Multimeter at the same point positions. Besides that, the UAV-based PM2.5 monitoring system allowed for the rapid, precise, and repeatable investigation of large spaces at different heights relative to the ground. The results allow for a representation of changes in data values with altitude change.
The developed device is expected to offer relatively accurate measurements and is appropriate to be used for detecting and monitoring PM2.5 concentrations and metrological parameters.

5. Conclusions

Air pollution is currently one of the main problems facing modern societies, and PM2.5 monitoring is required in order to scan air quality due to its tiny diameter, which has clear effects on health. Using small UAV-based sensors provide information at specified altitudes, helping to overcome obstacles and the difficulties associated with obtaining the required data. Such data can be limited by sensor selection. The recent monitoring stations are fixed stations and are not designed to adequately denote exposure on a small scale. So, the consequence may not sufficiently refer to small-scale conditions or continuous sampling and consider a poor indicator for PM2.5 concentrations away from the sampling position. In addition to the absence of PM2.5, monitoring sites in some cities require an alternative method for information availability for PM2.5 estimation. Besides, in small-scale areas where there are tall buildings, PM2.5 monitoring at ground levels is not sufficient. Therefore, evaluation at different elevations can offer additional information to assess air quality. In this study, a small, light-weight, and low-cost air quality monitoring device was developed, which in combination with mini UAVs can be an effective tool for monitoring air quality. Overall, the acquired measurements by the system were accurate. It is, however, important that the dust sensor module be installed vertically and kept away from any form of air current or fans, which can add noise to measurements. For future improvement, we plan to deploy a connected system where data transfer can be handled using cellular technology such as 4G/5G or even satellite.

Author Contributions

H.J.J. and S.M. acquired the data; H.J.J. and S.M. conceptualized and performed the analysis; H.J.J., B.K. and S.J.J. wrote the manuscript and discussed and analyzed the data; S.M. supervised; B.K., A.A.H. and N.U. provided technical sights, as well as edited, restructured, and professionally optimized the manuscript. All authors have read and agreed to the published version of the manuscript.

Funding

This research received no external funding.

Institutional Review Board Statement

Not applicable.

Informed Consent Statement

Not applicable.

Data Availability Statement

All information used in system development, software, and codes have been obtained from an open-source microcontroller development platform using Arduino.

Acknowledgments

We would like to thank the Department of Civil Engineering, Geospatial Information Science Research Centre (GISRC), for providing the drone for data collection. We also would like to thank Azman A. Ghany for his efforts in the data collection using the monitoring system with the drone.

Conflicts of Interest

The authors declare no conflict of interest.

References

  1. Tahir, N.M.; Suratman, S.; Fong, F.T.; Hamzah, M.S.; Latif, M.T. Temporal distribution and chemical characterization of atmospheric particulate matter in the eastern coast of Peninsular Malaysia. Aerosol Air Qual. Res. 2013, 13, 584–595. [Google Scholar] [CrossRef] [Green Version]
  2. Lekinwala, N.L.; Bhardwaj, A.; Raman, R.S.; Bhushan, M.; Bali, K.; Dey, S. A framework for setting up a country-wide network of regional surface PM2. 5 sampling sites utilising a satellite-derived Proxy–The COALESCE project, India. Atmos. Environ. 2020, 234, 117544. [Google Scholar] [CrossRef]
  3. Jumaah, H.J.; Ameen, M.H.; Kalantar, B.; Rizeei, H.M.; Jumaah, S.J. Air quality index prediction using IDW geostatistical technique and OLS-based GIS technique in Kuala Lumpur, Malaysia. Geomat. Nat. Hazards Risk 2019, 10, 2185–2199. [Google Scholar] [CrossRef]
  4. Amir, A. Air Pollution Trends in Petaling Jaya. Ph.D. Dissertation, Universiti Putra Malaysia, Selangor, Malaysia, 2007. [Google Scholar]
  5. Budde, M.; Zhang, L.; Beigl, M. Distributed, low-cost particulate matter sensing: Scenarios, challenges, approaches. In Proceedings of the 1st International Conference on Atmospheric Dust, Castellaneta Marina, Italy, 1–6 June 2014; pp. 230–236. [Google Scholar]
  6. Tian, J. Integration of Satellite Remote Sensing and Ground-based Measurement for Modelling the Spatiotemporal Distribution of Fine Particulate Matter at a Regional Scale. Ph.D. Thesis, Queen’s University Kingston, Kingston, ON, Canada, 2008. [Google Scholar]
  7. Sevusu, P. Real-Time Air Quality Measurements Using Mobile Platforms. Ph.D. Dissertation, New Brunswick Rutgers, New Brunswick, NJ, USA, 2015. [Google Scholar]
  8. Xiong, X.; Shah, S.; Pallis, J.M. Balloon/Drone-based Aerial Platforms for Remote Particulate Matter Pollutant Monitoring. 2018. Available online: https://scholarworks.bridgeport.edu/xmlui/handle/123456789/2236 (accessed on 12 July 2021).
  9. Yang, Y.; Zheng, Z.; Bian, K.; Song, L.; Han, Z. Real-time profiling of fine-grained air quality index distribution using UAV sensing. IEEE Internet Things J. 2017, 5, 186–198. [Google Scholar] [CrossRef]
  10. Hemmelder, S.D. The Application and Suitability of Unmanned Airborne Vehicle Based Imagery to Determine River Dynamics: A Case Study of the Buëch in France. Master’s Thesis, Utrecht Univesity, Utrecht, The Netherlands, 2016. [Google Scholar]
  11. Alvear, O.; Calafate, C.T.; Hernández, E.; Cano, J.-C.; Manzoni, P. Mobile pollution data sensing using UAVs. In Proceedings of the 13th International Conference on Advances in Mobile Computing and Multimedia, Brussels, Belgium, 11–13 December 2015; pp. 393–397. [Google Scholar]
  12. Lambey, V.; Prasad, A.D. A review on air quality measurement using an unmanned aerial vehicle. Water Air Soil Pollut. 2021, 232, 1–32. [Google Scholar] [CrossRef]
  13. Al-Najjar, H.A.H.; Kalantar, B.; Pradhan, B.; Saeidi, V.; Halin, A.A.; Ueda, N.; Mansor, S. Land cover classification from fused DSM and UAV images using convolutional neural networks. Remote Sens. 2019, 11, 1461. [Google Scholar] [CrossRef] [Green Version]
  14. Ahmed, A.; Nagai, M.; Tianen, C.; Shibasaki, R. UAV based monitoring system and object detection technique development for a disaster area. Int. Arch. Photogramm. Remote Sens. Spat. Inf. Sci. 2008, 37, 373–377. [Google Scholar]
  15. Kalantar, B.; Mansor, S.B.; Abdul Halin, A.; Shafri, H.Z.M.; Zand, M. Multiple moving object detection from UAV videos using trajectories of matched regional adjacency graphs. IEEE Trans. Geosci. Remote Sens. 2017, 55. [Google Scholar] [CrossRef]
  16. Kalantar, B.; Ueda, N.; Al-Najjar, H.A.H.; Moayedi, H.; Halin, A.A.; Mansor, S. UAV and LiDAR image registration: A surf-based approach for ground control points selection. In Proceedings of the International Archives of the Photogrammetry, Remote Sensing and Spatial Information Sciences—ISPRS Archives, Enschede, The Netherlands, 10–14 June 2019; Volume 42. [Google Scholar]
  17. Kalantar, B.; Mansor, S.B.; Shafri, H.Z.M.; Halin, A.A. Integration of template matching and object-based image analysis for semi-Automatic oil palm tree counting in UAV images. In Proceedings of the 37th Asian Conference on Remote Sensing, ACRS, Colombo, Sri Lanka, 17–21 October 2016; Volume 3. [Google Scholar]
  18. Colomina, I.; Blázquez, M.; Molina, P.; Parés, M.E.; Wis, M. Towards a new paradigm for high-resolution low-cost photogrammetryand remote sensing. In Proceedings of the International Archives of the Photogrammetry, Remote Sensing and Spatial Information Sciences, ISPRS Congress, Beijing, China, 3–11 July 2008; Volume 1, pp. 1201–1206. [Google Scholar]
  19. Nex, F.; Remondino, F. UAV for 3D mapping applications: A review. Appl. Geomat. 2014, 6, 1–15. [Google Scholar] [CrossRef]
  20. Peng, Z.-R.; Wang, D.; Wang, Z.; Gao, Y.; Lu, S. A study of vertical distribution patterns of PM2. 5 concentrations based on ambient monitoring with unmanned aerial vehicles: A case in Hangzhou, China. Atmos. Environ. 2015, 123, 357–369. [Google Scholar]
  21. Jumaah, H.J.; Mansor, S.; Pradhan, B.; Adam, S.N. UAV-based PM2.5 monitoring for small-scale urban areas. Int. J. Geoinf. 2018, 14, 61–69. [Google Scholar]
  22. Caillouet, C.; Giroire, F.; Razafindralambo, T. Optimization of mobile sensor coverage with UAVs. In Proceedings of the IEEE INFOCOM 2018-IEEE Conference on Computer Communications Workshops (INFOCOM WKSHPS), Honolulu, HI, USA, 15–19 April 2018; pp. 622–627. [Google Scholar]
  23. Cichowicz, R.; Dobrzański, M. Spatial Analysis (Measurements at Heights of 10 m and 20 m above Ground Level) of the Concentrations of Particulate Matter (PM10, PM2. 5, and PM1. 0) and Gaseous Pollutants (H2S) on the University Campus: A Case Study. Atmosphere 2021, 12, 62. [Google Scholar] [CrossRef]
  24. Unit Golf Universiti Putra Malaysia Climate History. Available online: http://www.myweather2.com/City-Town/Malaysia/Unit-Golf-Universiti-Putra-Malaysia/climate-profile.aspx?month=7 (accessed on 12 July 2021).
  25. Cheong, Y.L.; Burkart, K.; Leitão, P.J.; Lakes, T. Assessing weather effects on dengue disease in Malaysia. Int. J. Environ. Res. Public Health 2013, 10, 6319–6334. [Google Scholar] [CrossRef] [PubMed]
  26. Offenhuber, D.; Schechtner, K. Accountability Technologies: Tools for Asking Hard Questions; Offenhuber, D., Schechtner, K., Eds.; Springer: Berlin/Heidelberg, Germany, 2013; ISBN 3709114748. [Google Scholar]
  27. Particle/Dust Sensor Module DSM 501 Series. 2012. Available online: https://www.elektronik.ropla.eu/pdf/stock/smy/dsm501.pdf (accessed on 12 July 2021).
  28. Zhou, Y.; Zhou, Q.; Kong, Q.; Cai, W. Wireless temperature & humidity monitor and control system. In Proceedings of the 2012 2nd International Conference on Consumer Electronics, Communications and Networks (CECNet), Three Gorges, China, 21–23 April 2012; pp. 2246–2250. [Google Scholar]
  29. Du, Y.; Liu, C.; Wu, D.; Jiang, S. Measurement of international roughness index by using-axis accelerometers and GPS. Math. Probl. Eng. 2014, 2014. [Google Scholar] [CrossRef] [Green Version]
  30. Bäumker, M.; Przybilla, H.J.; Zurhorst, A. Enhancements in UAV flight control and sensor orientation. Int. Arch. Photogramm. Remote Sens. Spat. Inf. Sci. 2013, 40, 33–38. [Google Scholar] [CrossRef] [Green Version]
  31. Ruslan, N. Air Polution Index (API) Real Time Monitoring System. Ph.D. Dissertation, Universiti Tun Hussein Onn Malaysia, Johor, Malaysia, January 2015. [Google Scholar]
Figure 1. The location map of the study area: (a) map of Malaysia; (b) UPM Engineering Faculty; (c) the test area where the measurements are conducted.
Drones 05 00060 g001
Figure 2. PM2.5 monitoring system components: (a) Arduino UNO R3 board; (b) dust sensor module DSM501A; (c) regulator (LM1084); (d) temperature and humidity sensor; (e) GPS module; (f) real-time module DS3231; (g) SD card logging shield and memory.
Drones 05 00060 g002
Figure 3. Supplementary materials of the system.
Drones 05 00060 g003
Figure 4. The UAV-based PM2.5 and metrological data monitoring system’s project circuit.
Drones 05 00060 g004
Figure 5. Uploaded code: Arduino version 1.6.6.
Drones 05 00060 g005
Figure 6. In situ data collection: (a) Test area I near the GISRC; (b) Test area II next to the library.
Drones 05 00060 g006
Figure 7. UAV-based PM2.5 monitoring system.
Drones 05 00060 g007
Figure 8. Measurement results for (a) Test area I and (b) Test area II.
Drones 05 00060 g008
Figure 9. Testing by air quality multimeter.
Drones 05 00060 g009
Publisher’s Note: MDPI stays neutral with regard to jurisdictional claims in published maps and institutional affiliations.

