An Integrated Spectral–Structural Workflow for Invasive Vegetation Mapping in an Arid Region Using Drones


Abstract
1. Introduction
2. Materials and Data
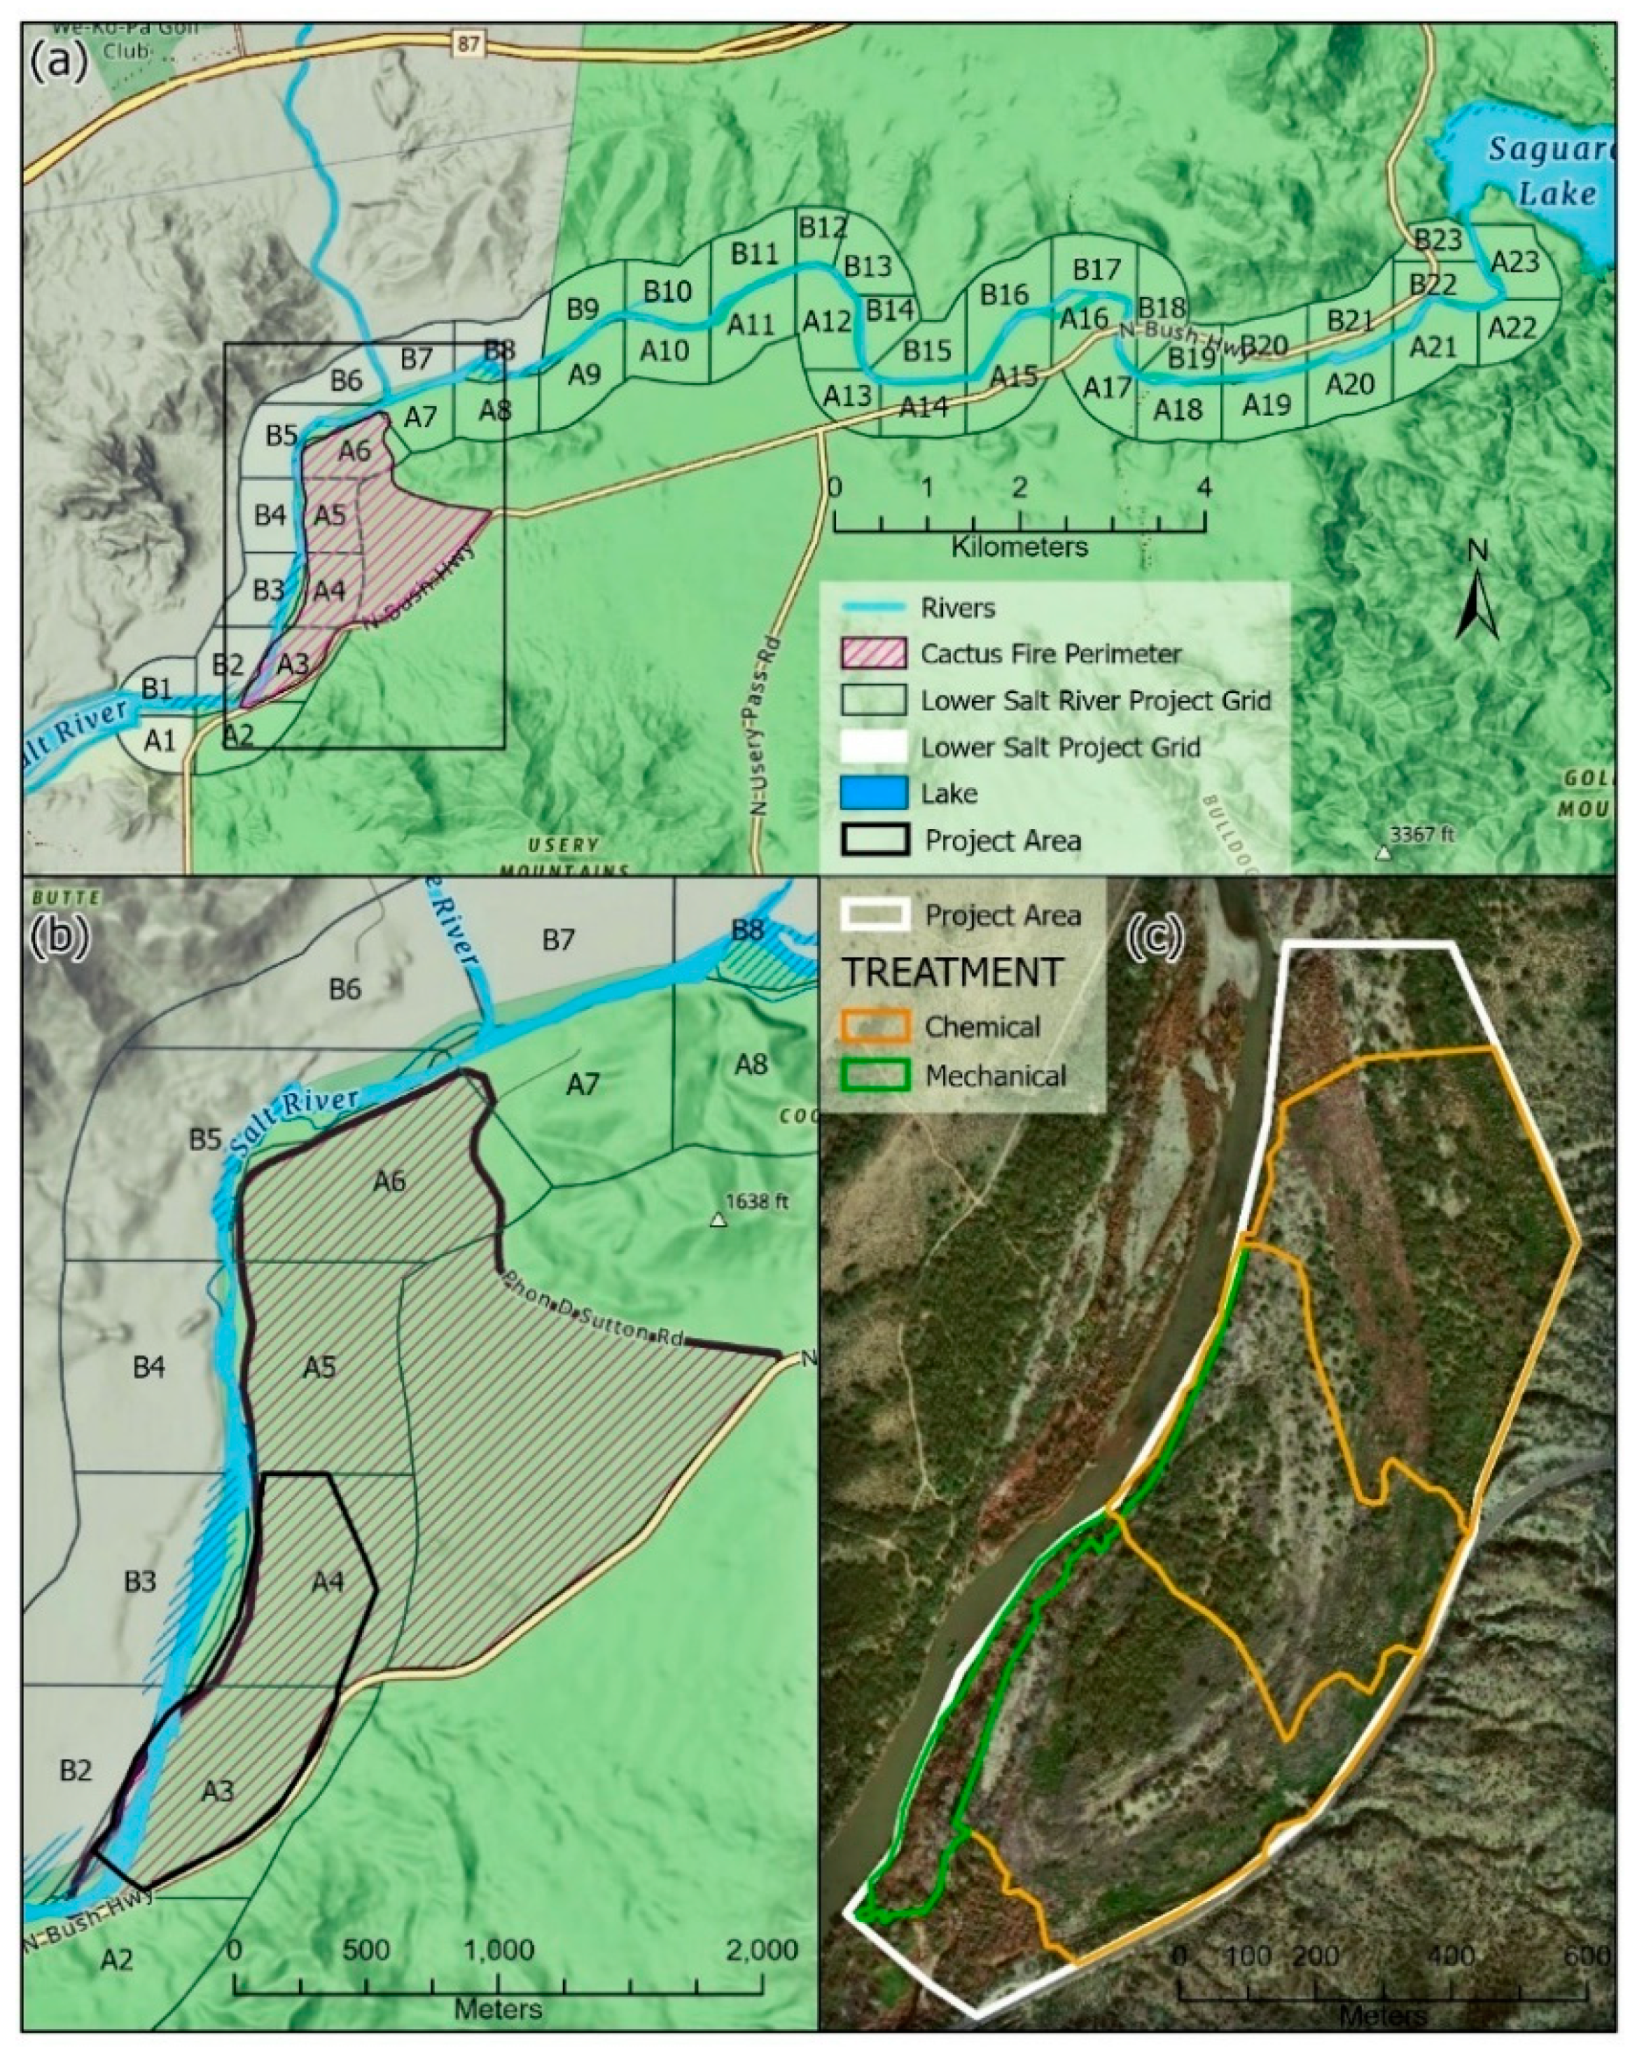
2.1. Study Area and Species of Concern
2.2. Cactus Fire and Flooding Event
2.3. Data Collection and Processing
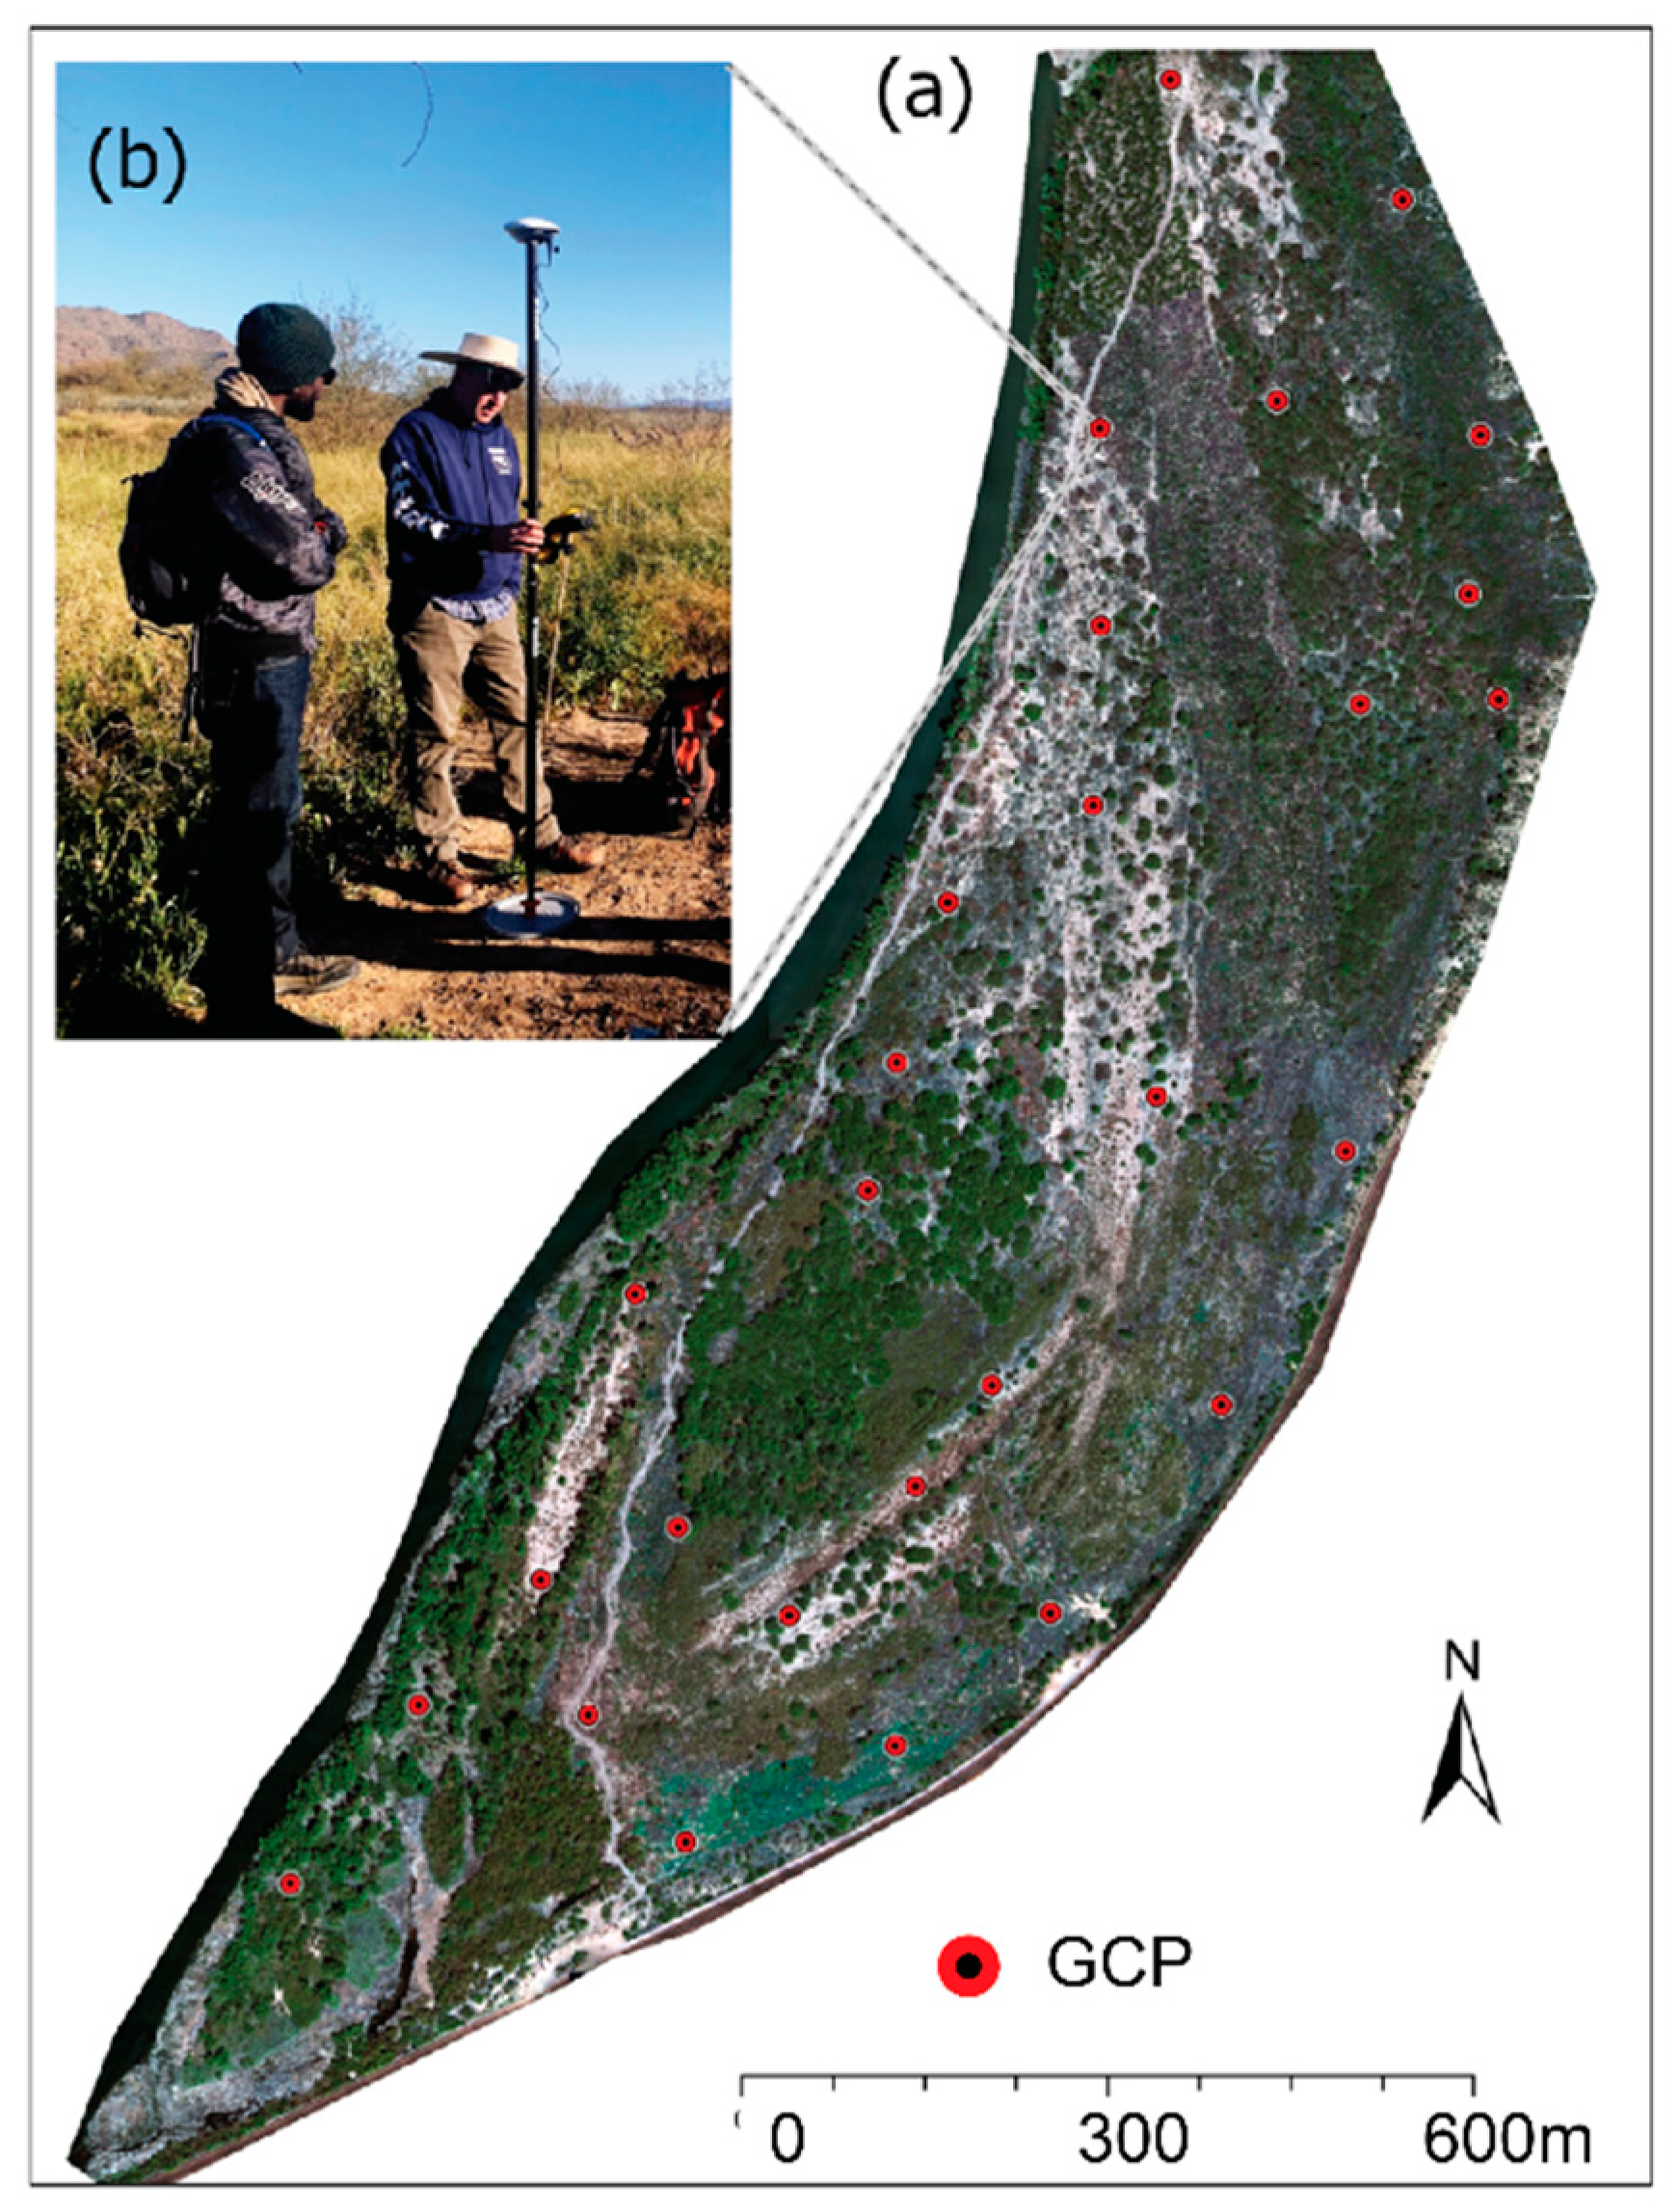
2.3.1. Image Data Collection
2.3.2. Ground Reference Vegetation Data Collection
3. Methods
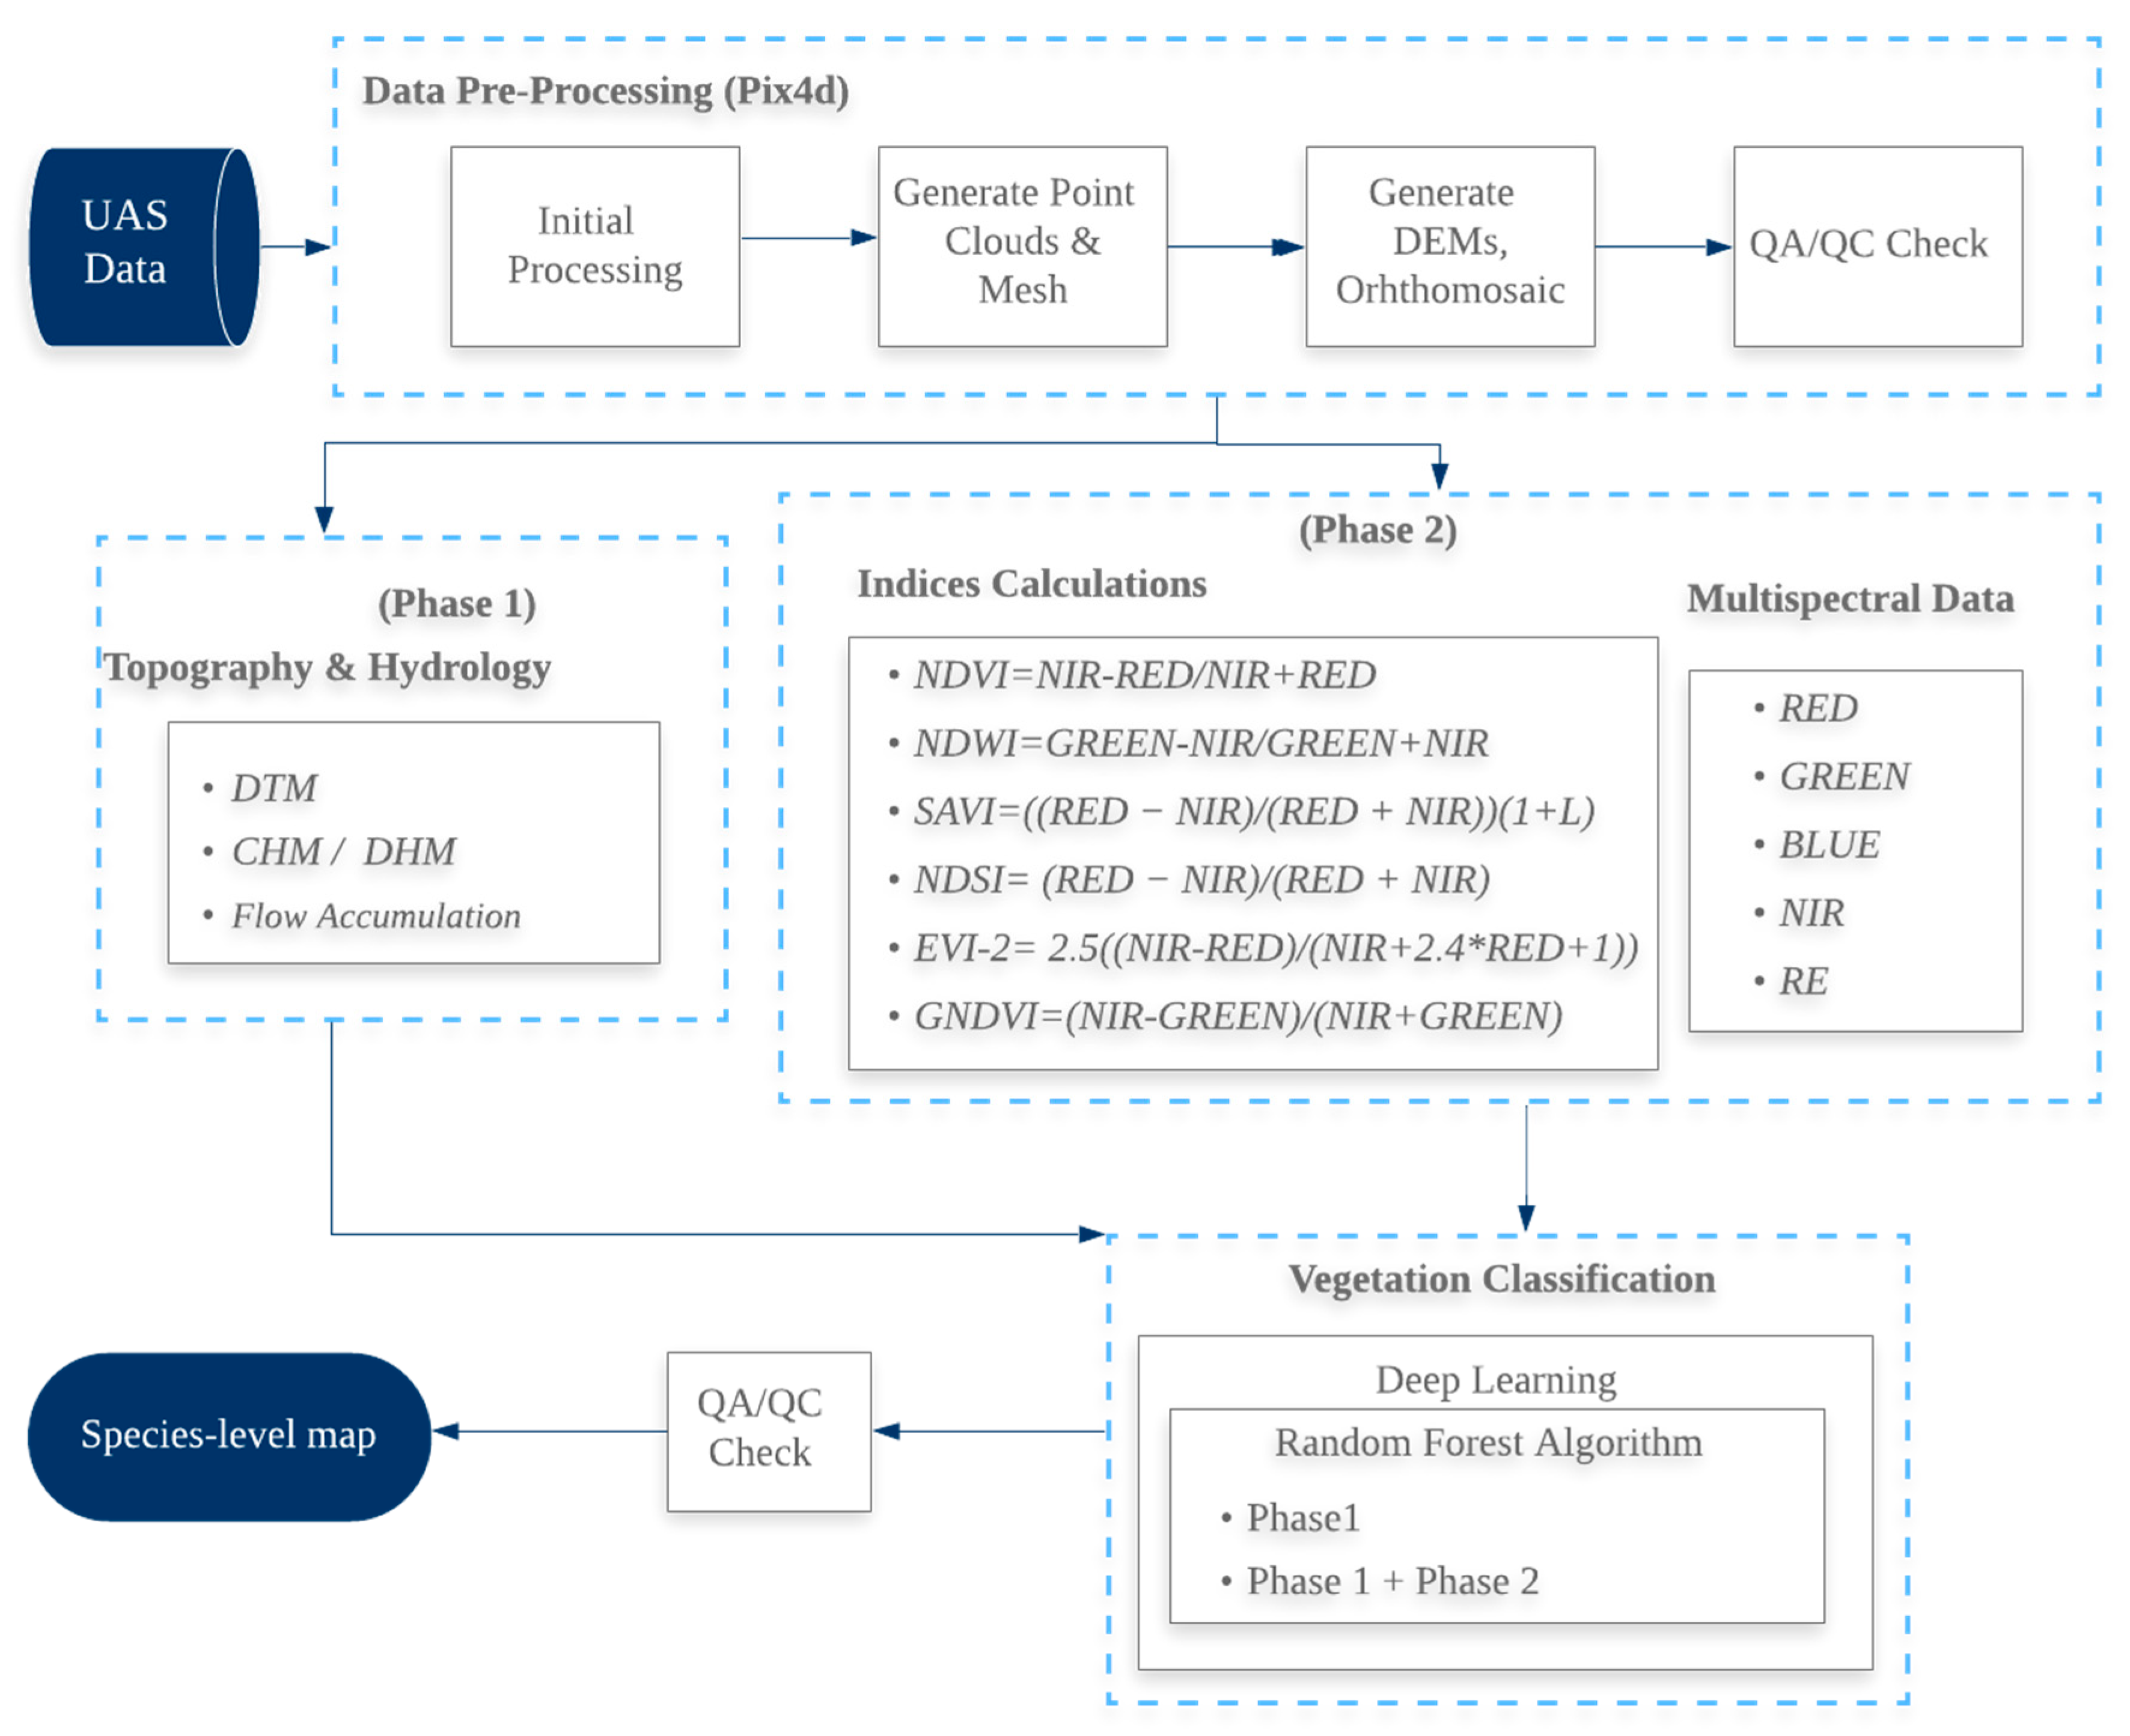
3.1. Image Data Processing
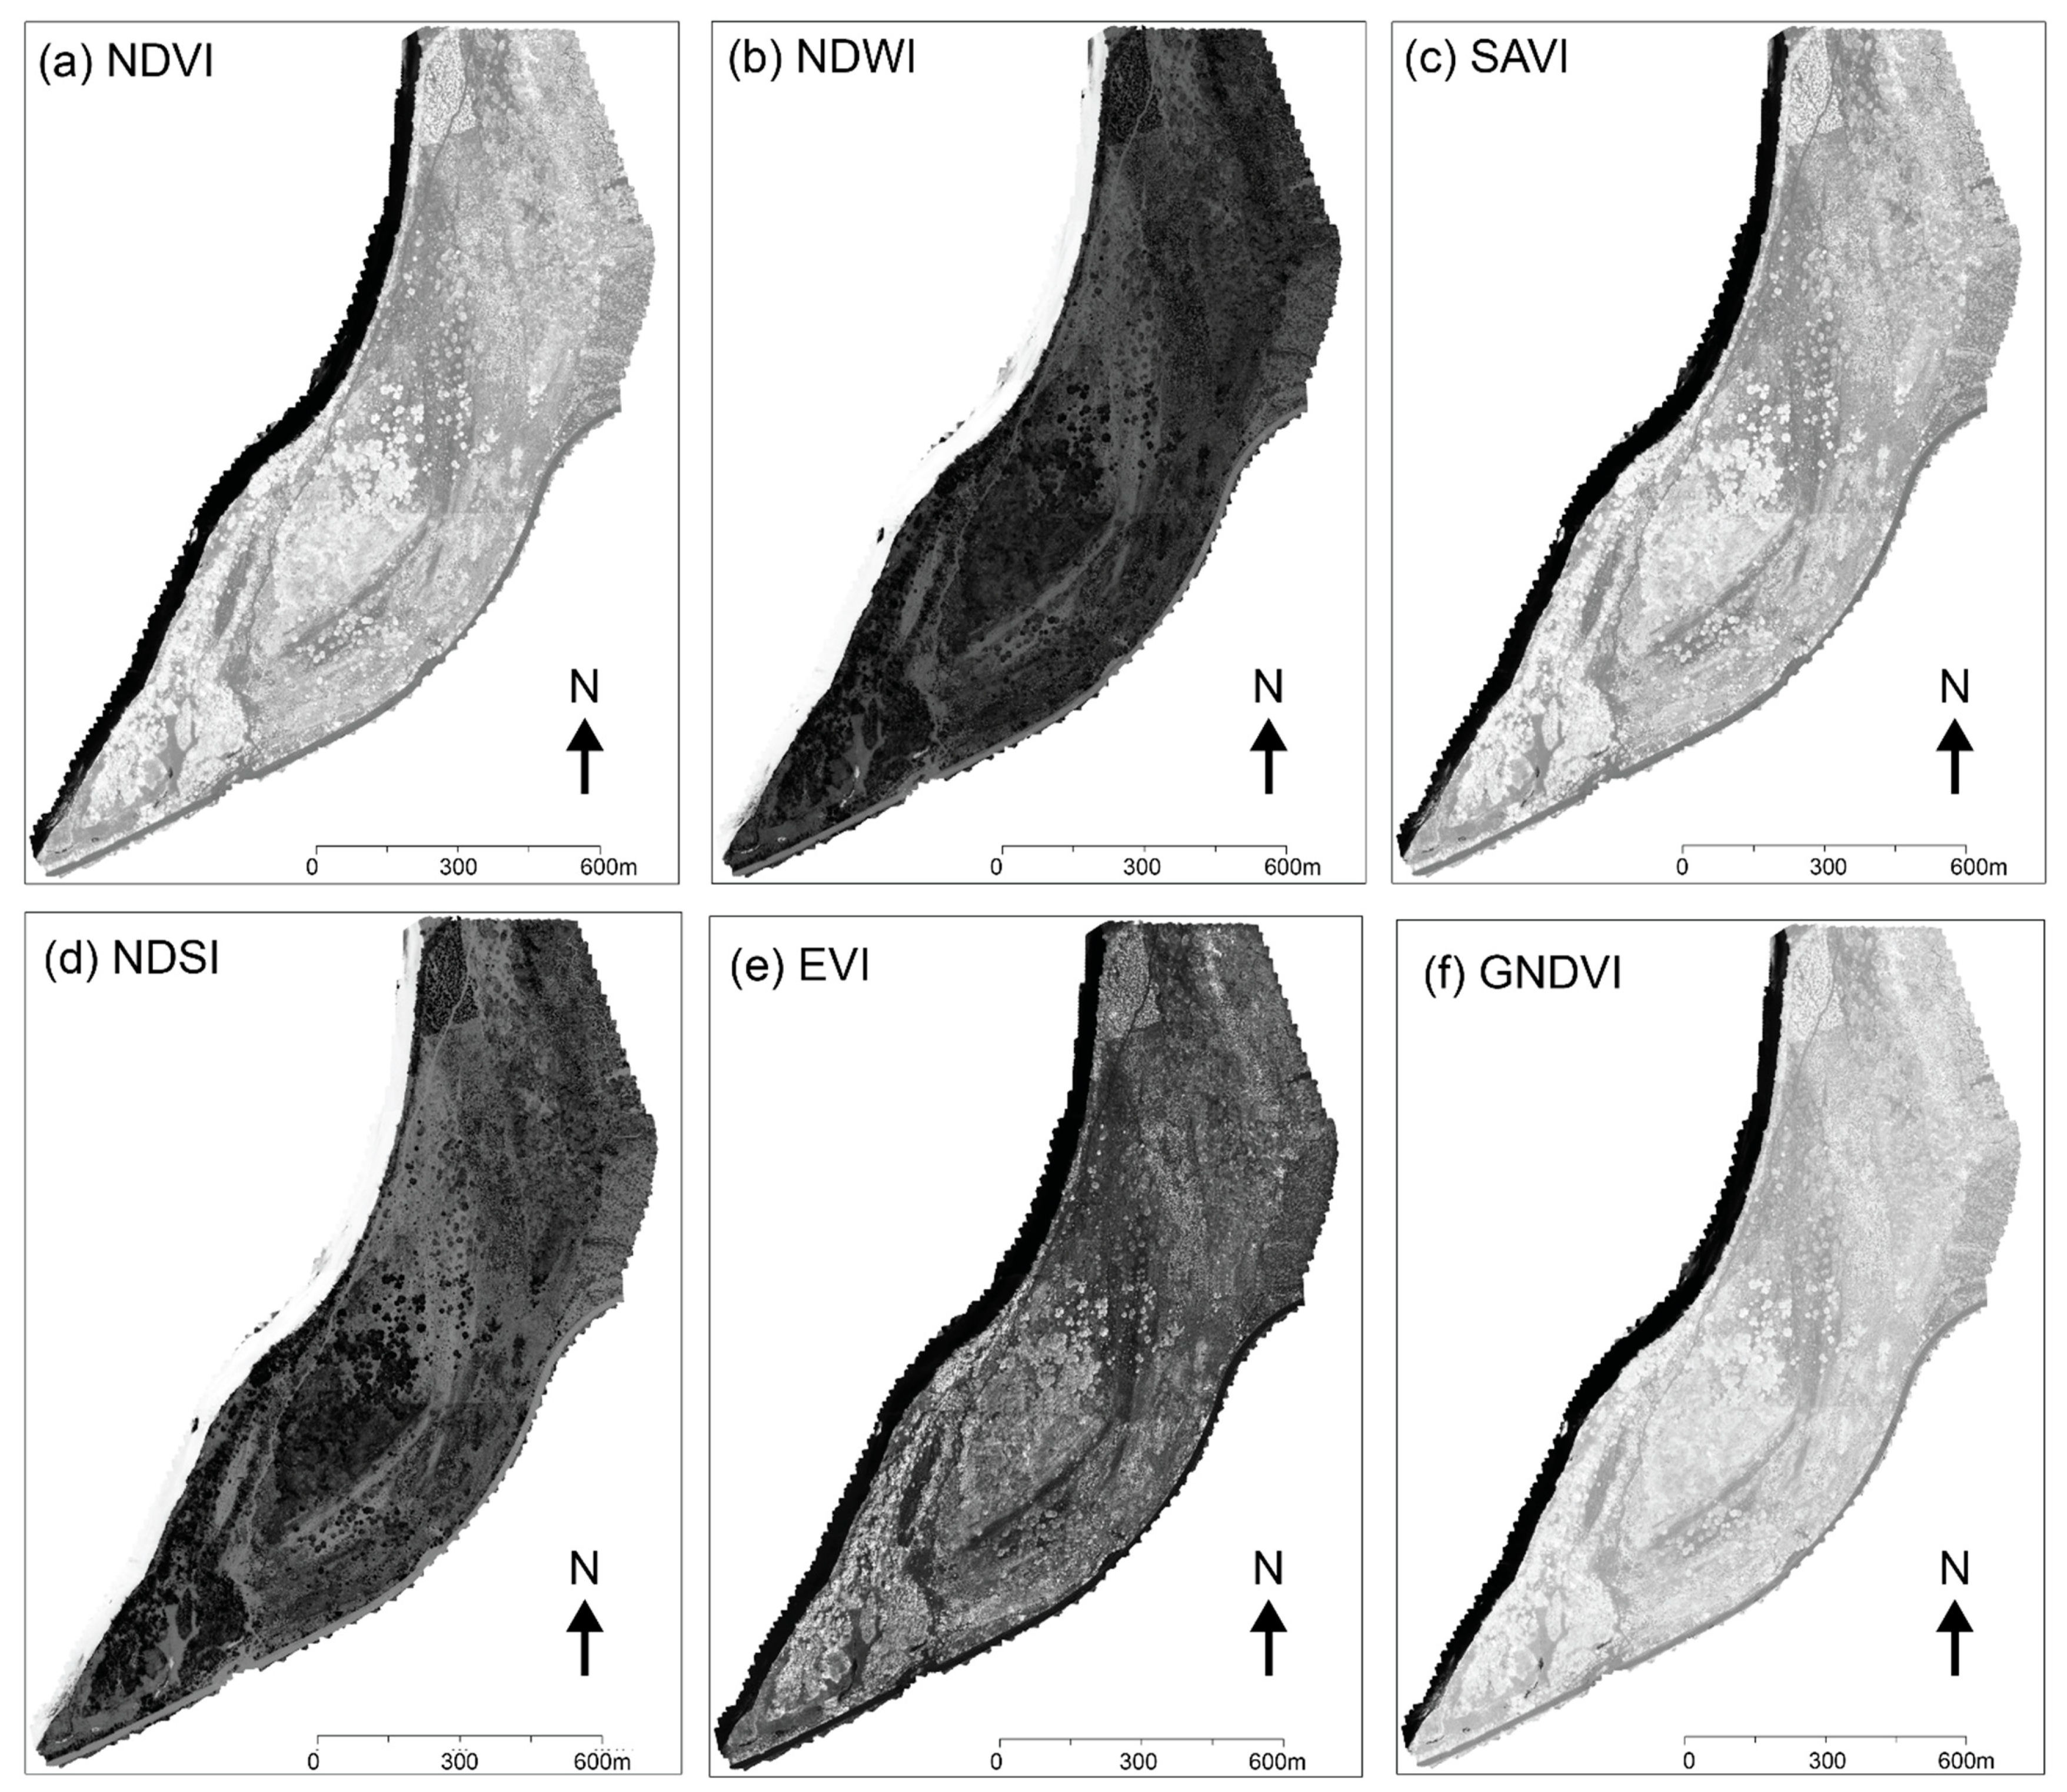
3.1.1. Vegetation Indices
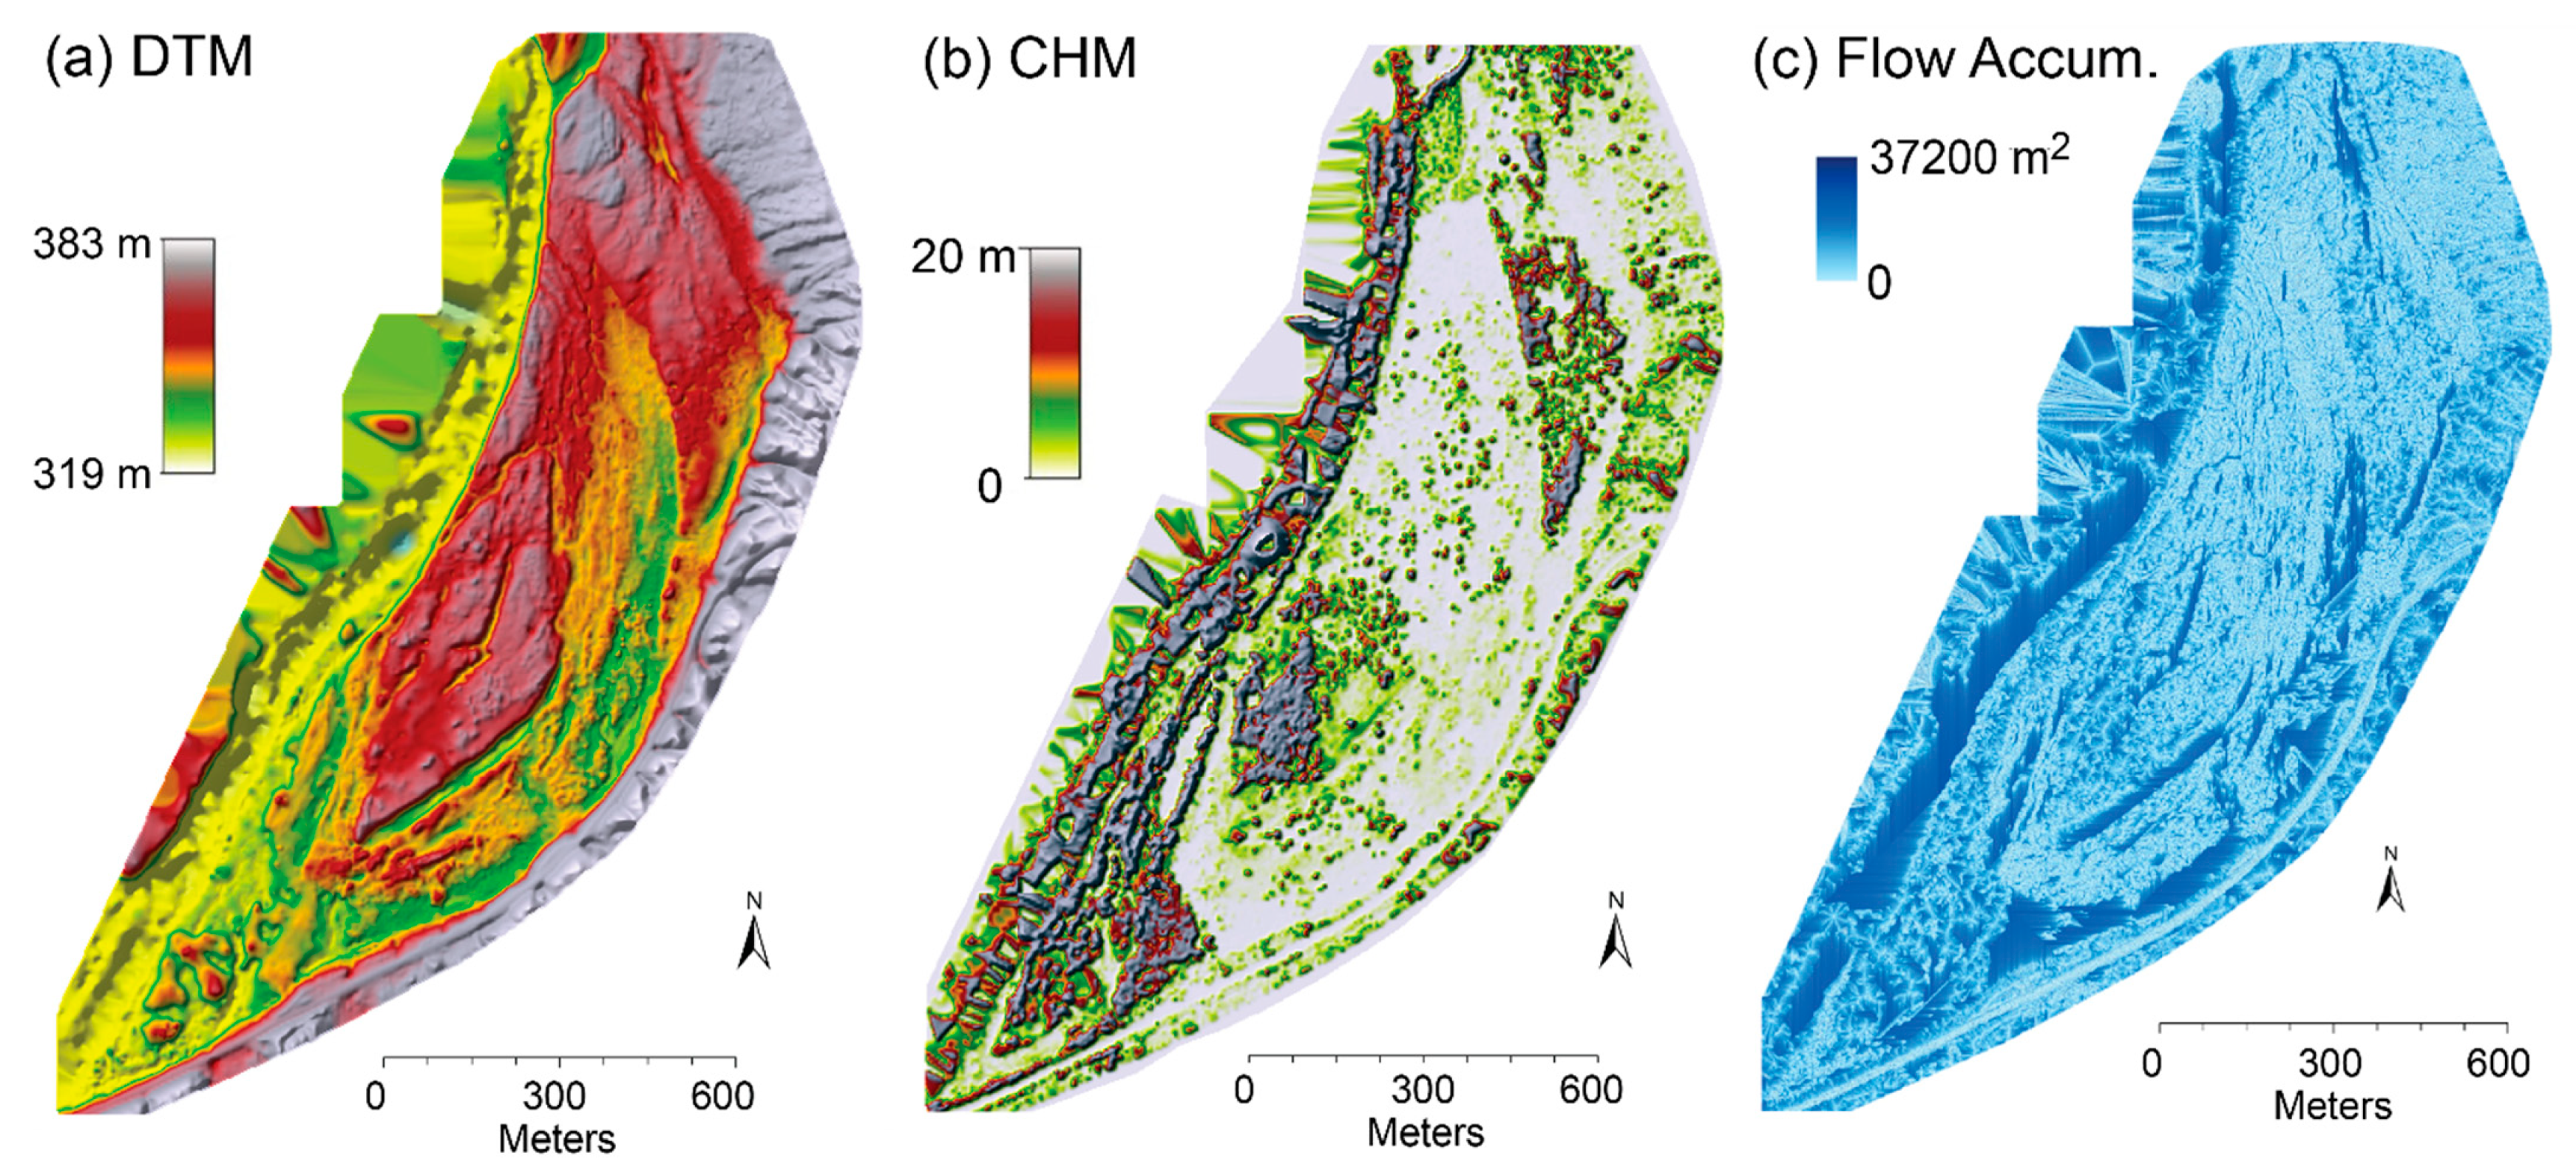
3.1.2. Hydrological Flow Accumulation
3.2. Image Classification
4. Results
4.1. Image Products
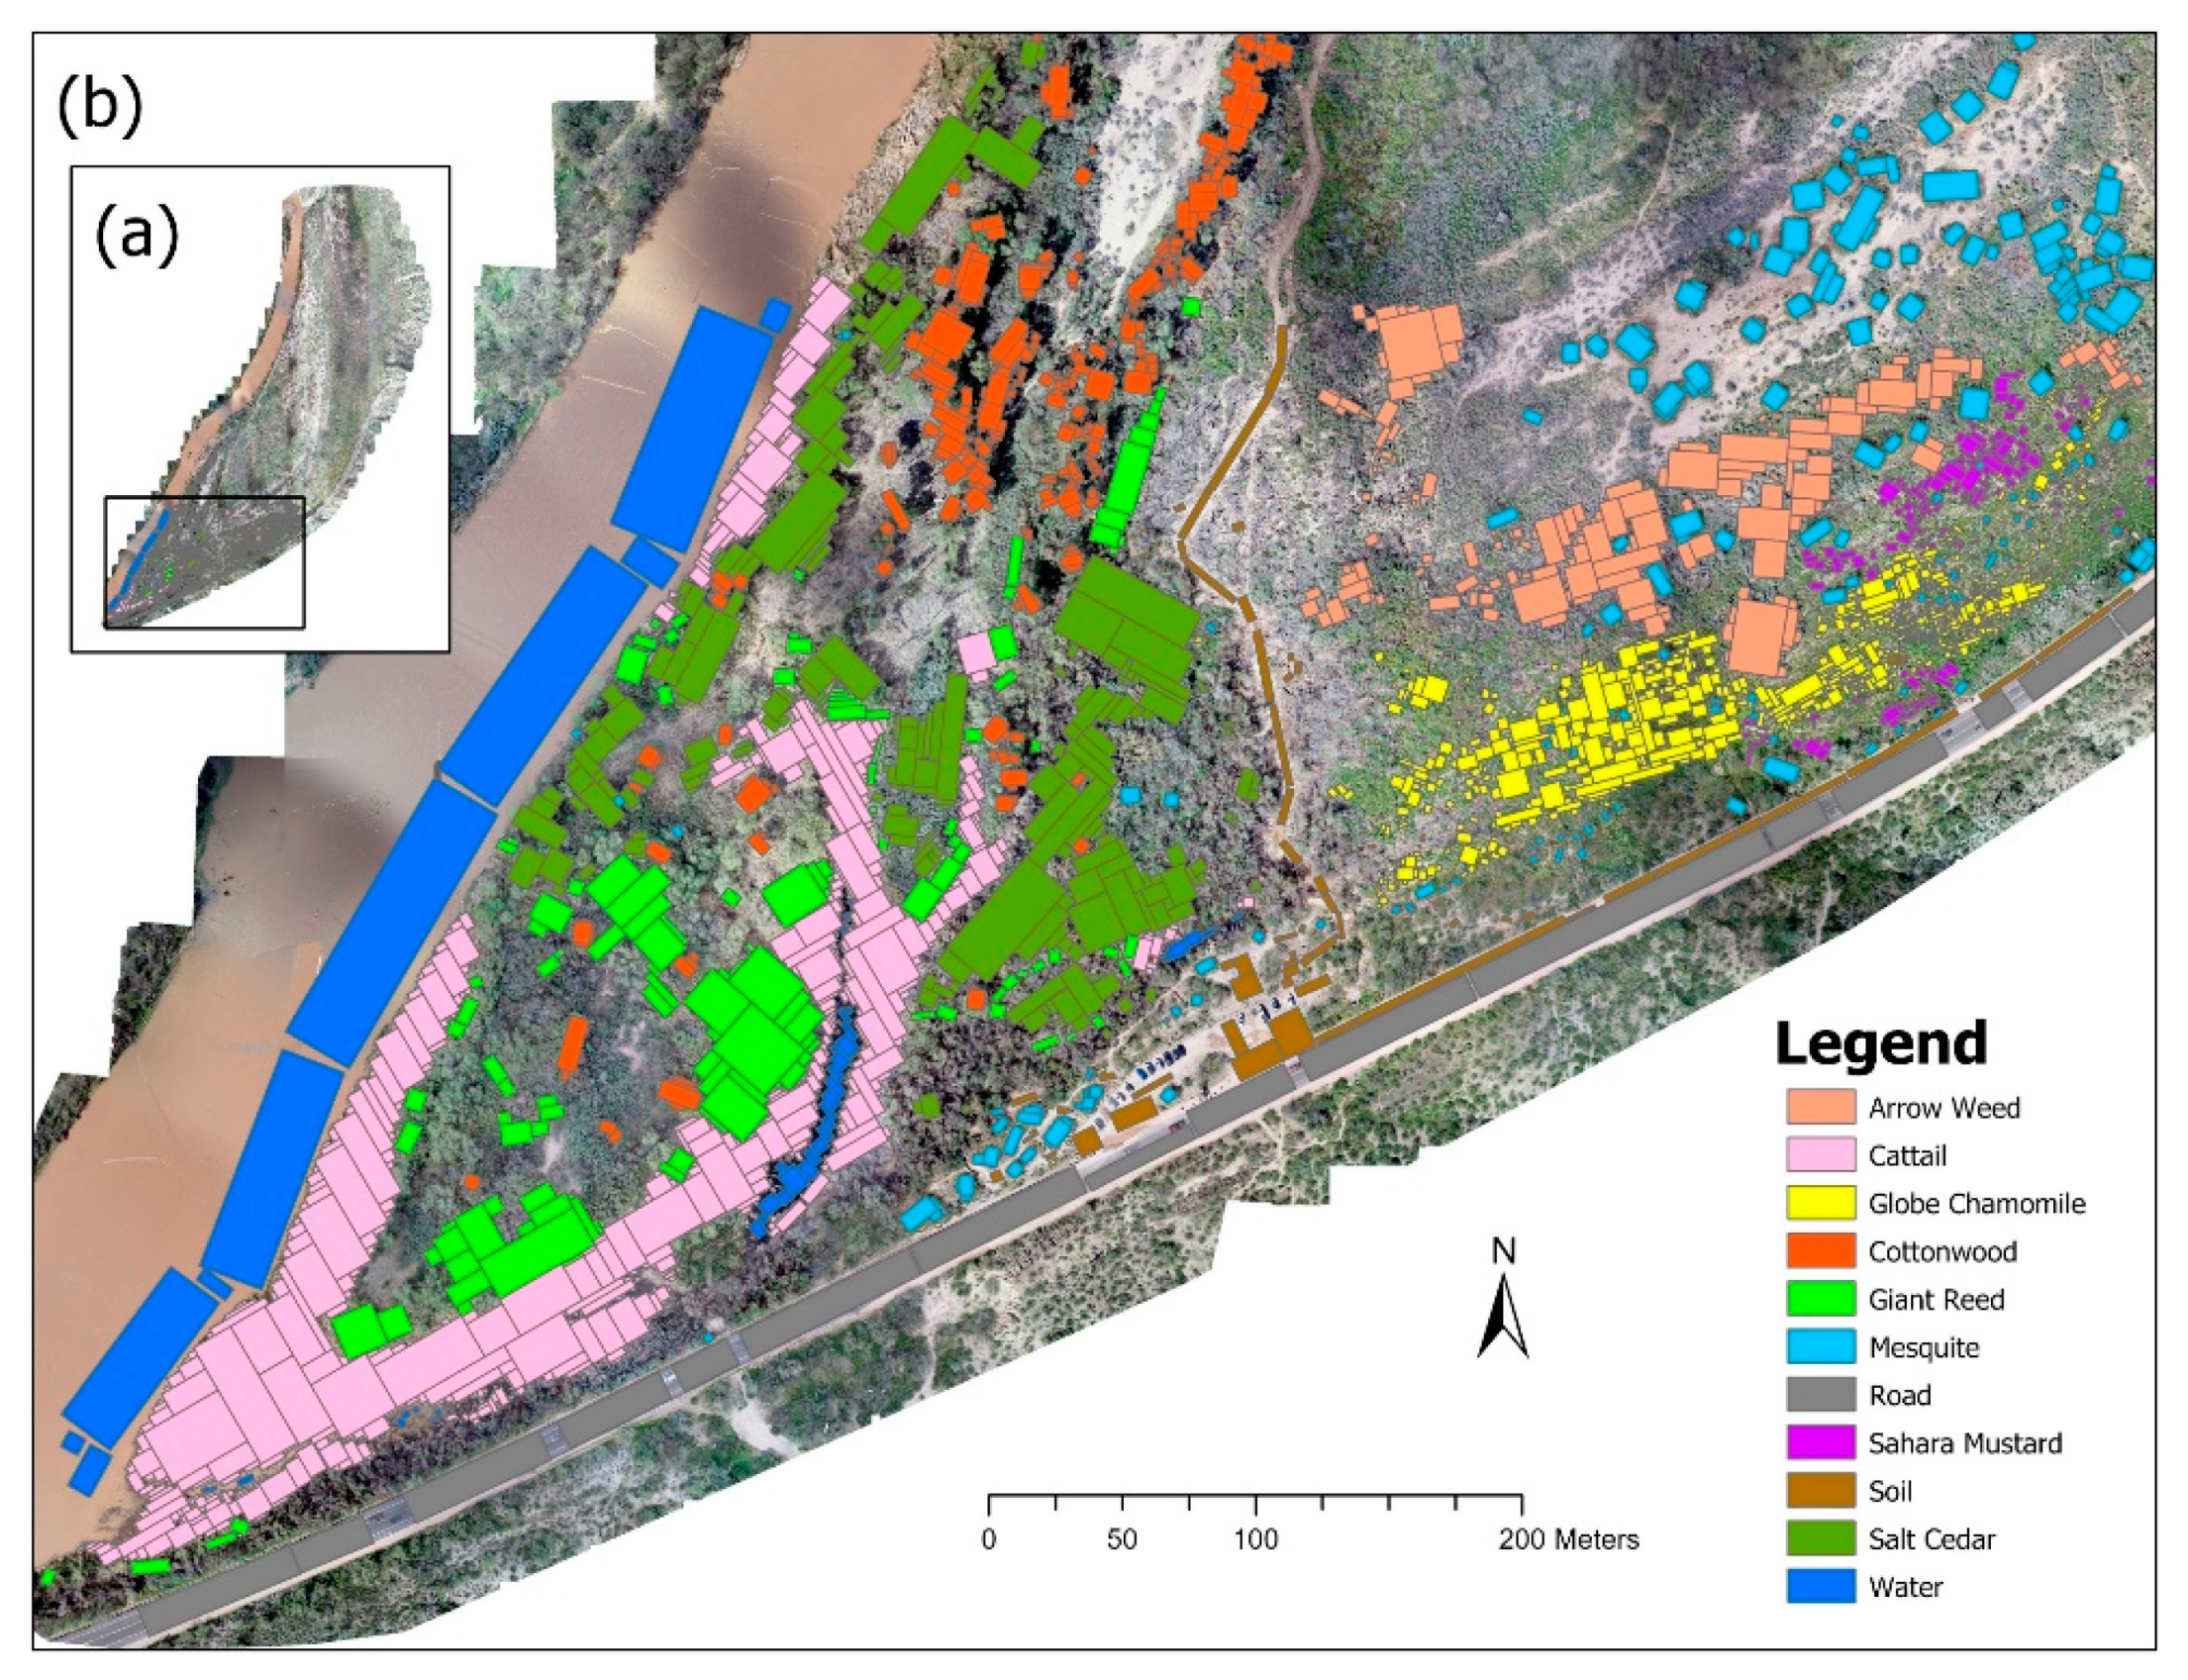
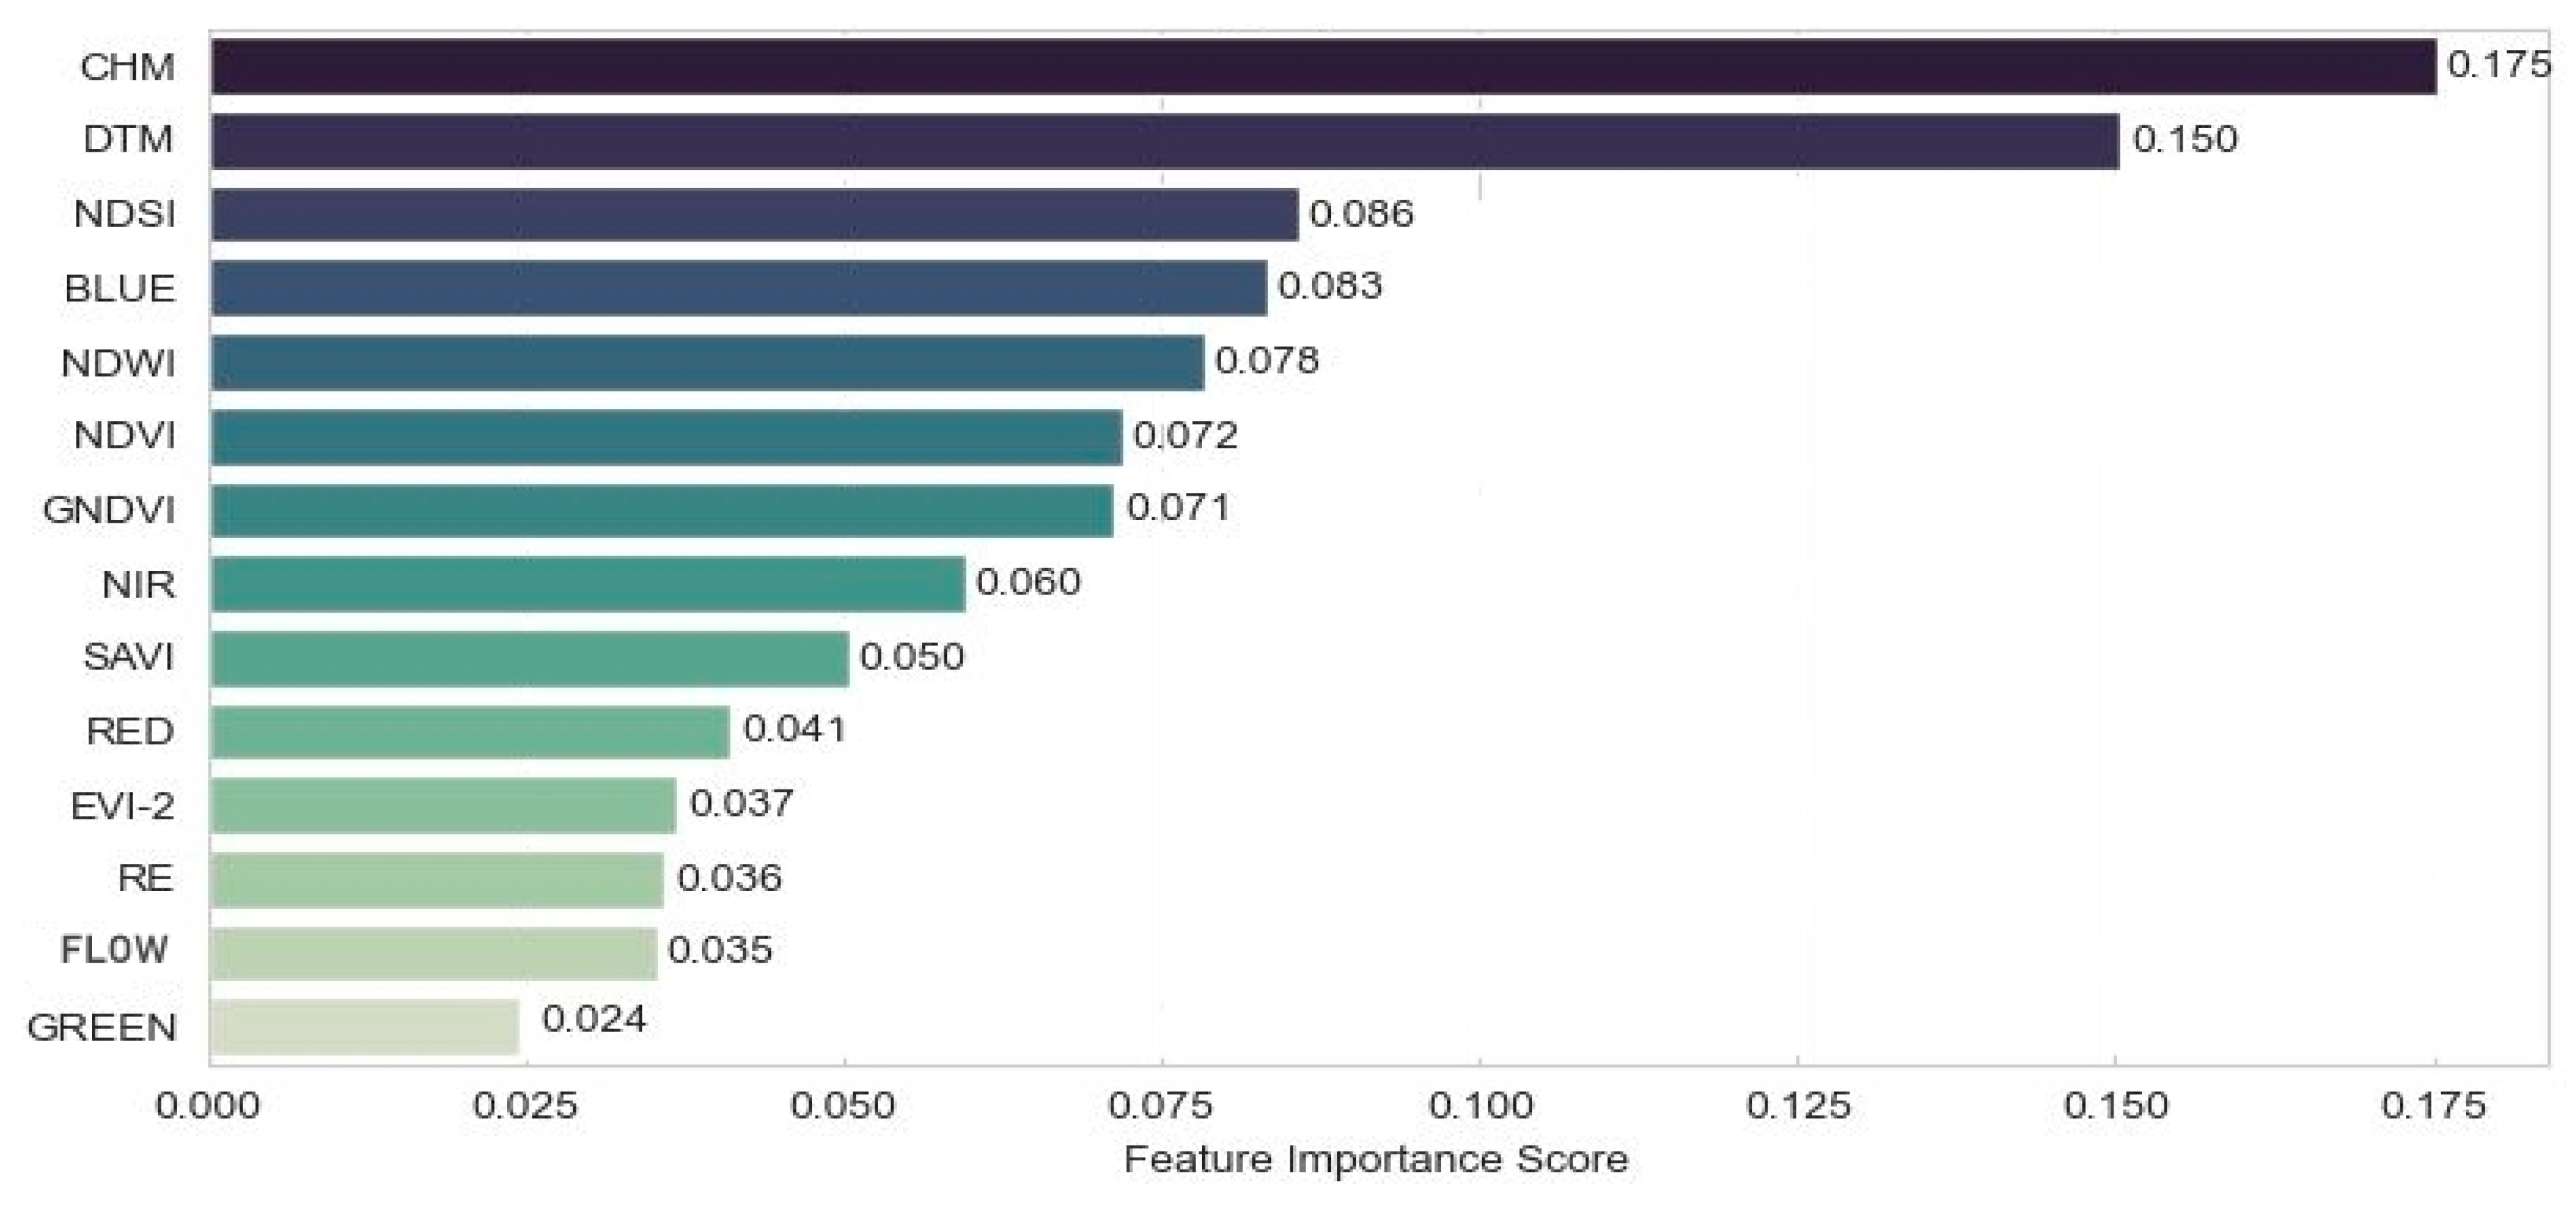
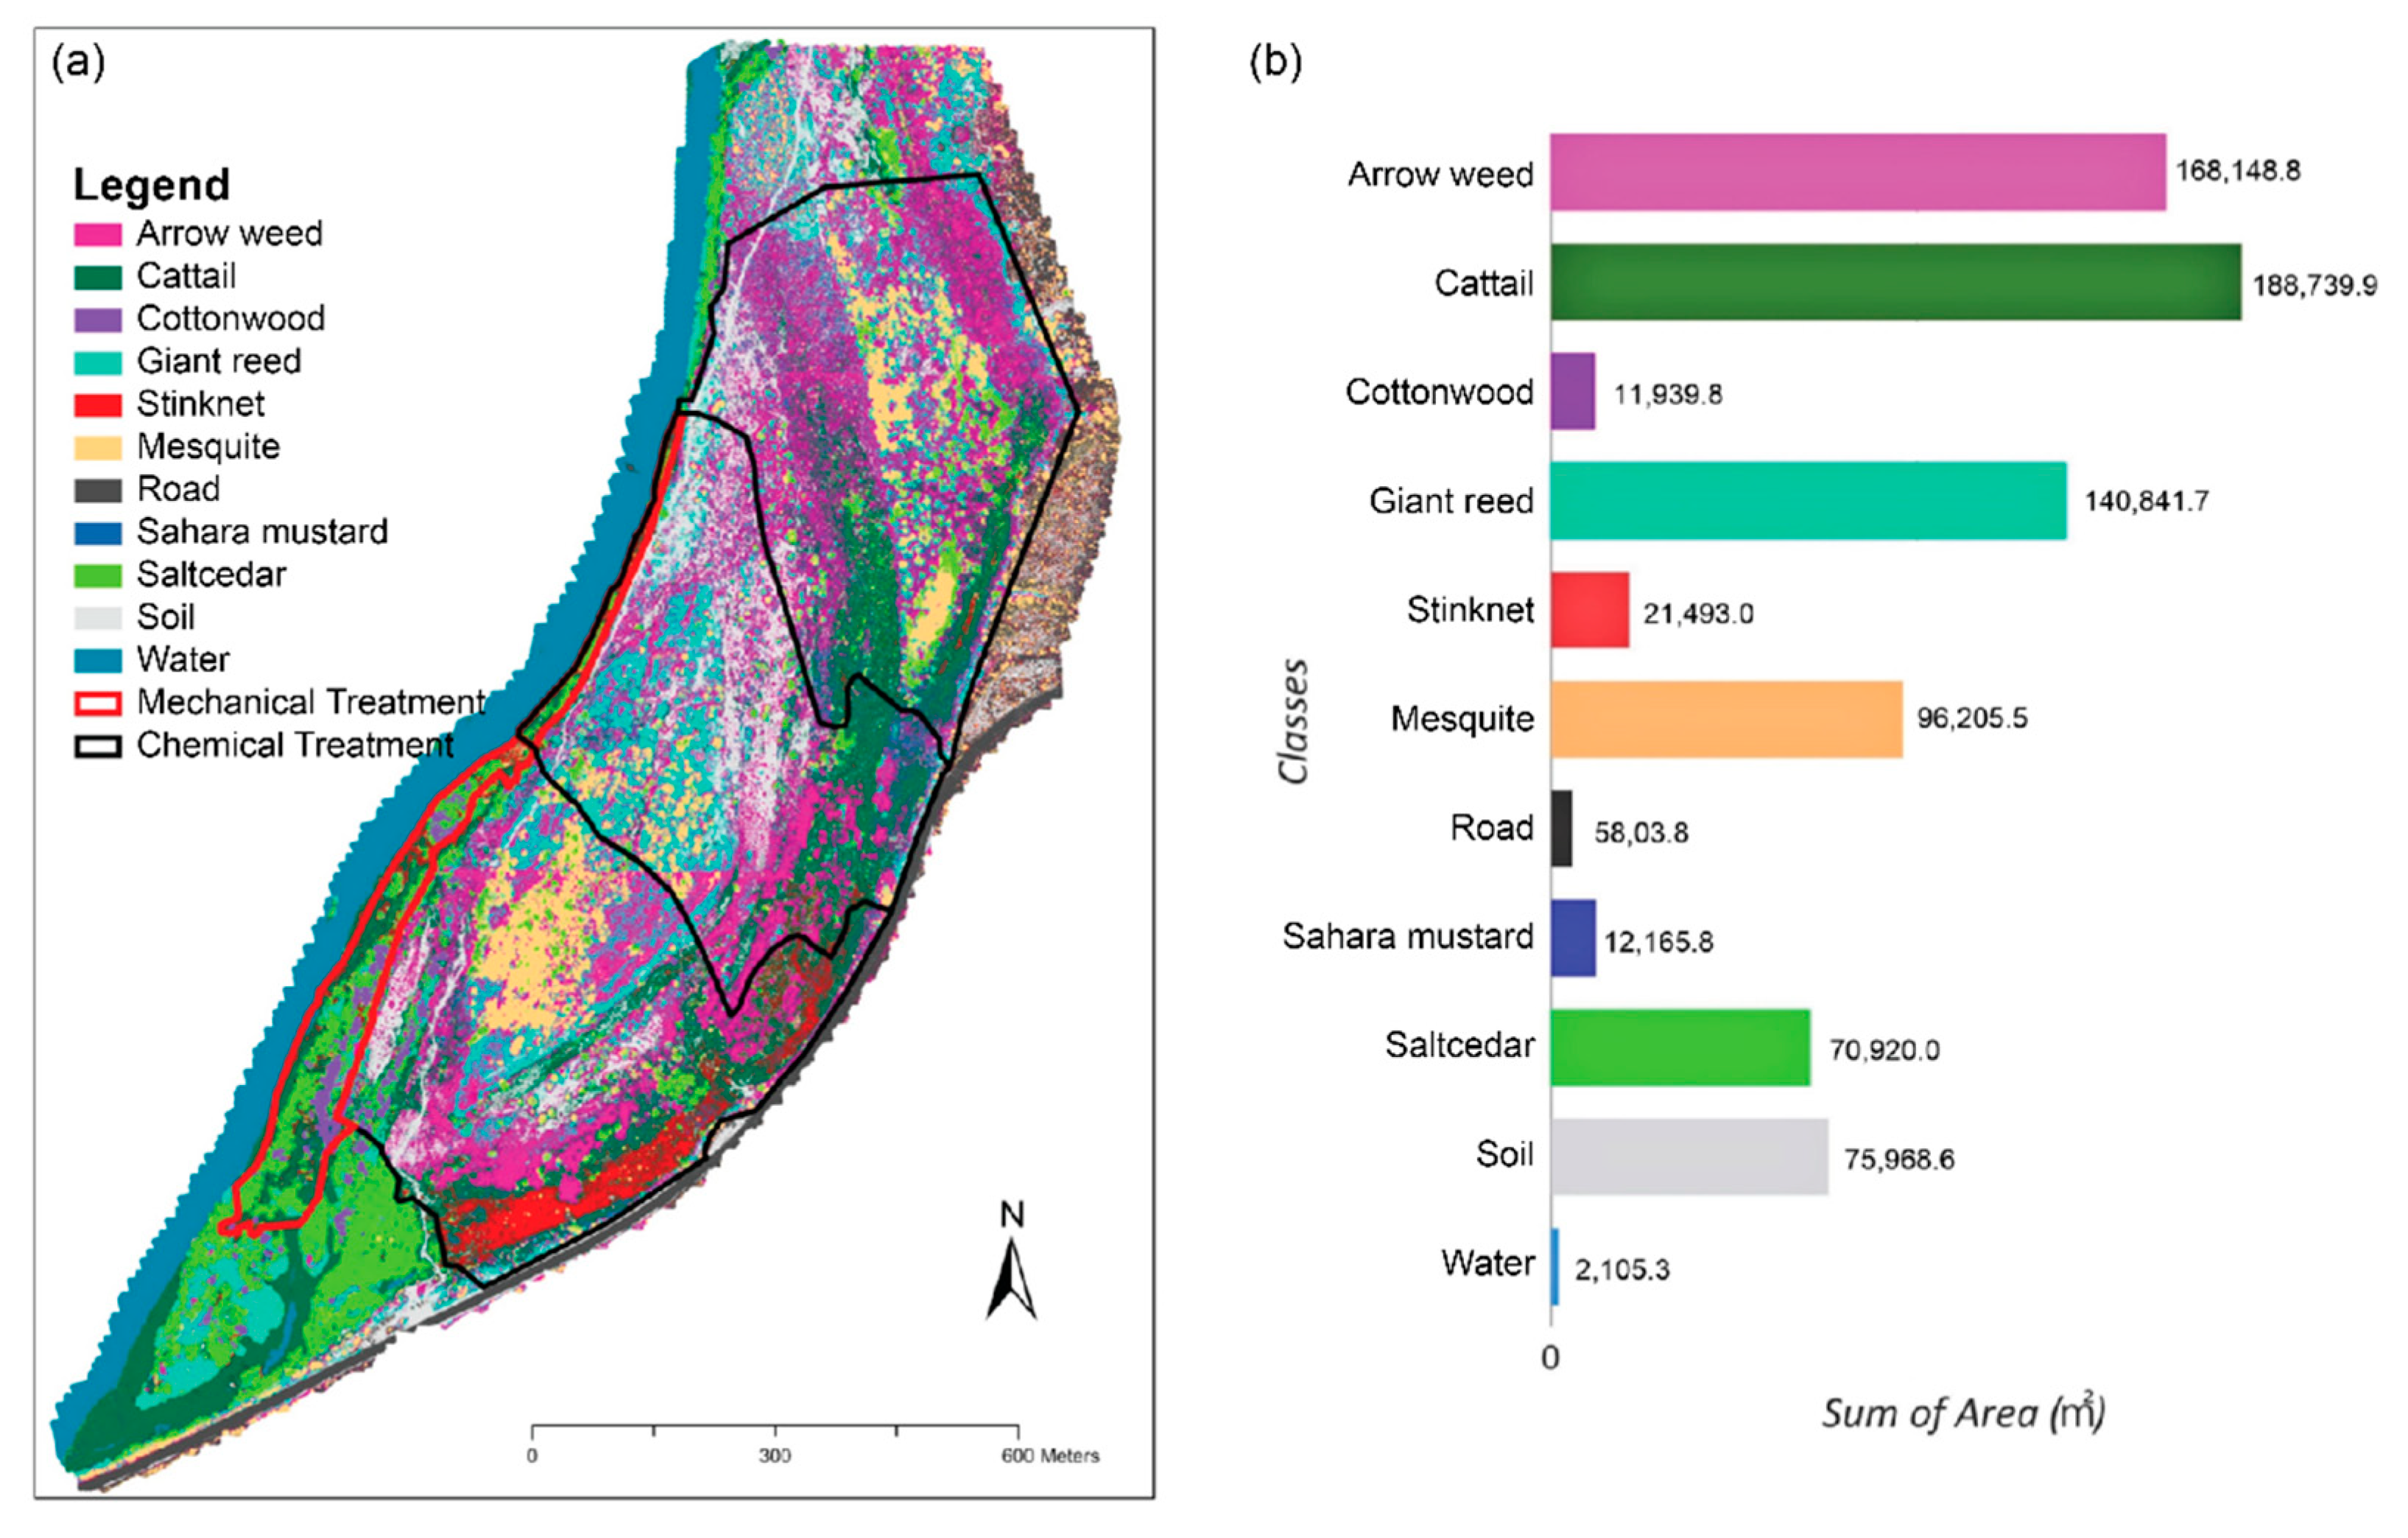
4.2. Classification Results
5. Discussion
6. Conclusions
Author Contributions
Funding
Institutional Review Board Statement
Informed Consent Statement
Data Availability Statement
Acknowledgments
Conflicts of Interest
Appendix A

| Parameters | Phantom 4 Pro | Phantom 4 Multispectral |
|---|---|---|
| Flight: altitude | 115 m | 61 m |
| Flight: sensor angle | Nadir | Nadir |
| Flight: forward lap | 90% | 85% |
| Flight: side overlaps | 80% | 75% |
| Flight: image trigger rate | 3.0 s | 2.5 s |
| Flight: resolution | 3.28 cm | 3.89 cm |
| Flight: Area covered | 121.05 ha | 121.05 ha |
| Camera: sensor | 1″ CMOS | 1/2.9″ CMOS |
| Camera: Focal length | 8.6 mm | 5.740 mm |
| Camera: sensor width | 13.2 mm | 4.96 mm |
| Camera: field of view | 84° | 62.7° |
| Camera: effective pixels | 20M | 2.12M |
| Camera: gimbal angle | Nadir | Nadir |
| Camera: optimization | All internal and external | All internal and external |
| Images: total number | 2268 | 78,555 * |
| Images: % calibrated | 100% | 99% |
| Images: % geolocated | 100% | 100% |
| Georeferencing: no. GCPs | 28 | 28 |
| Georeferencing: mean RMSE | 0.056 m | 0.046 m |
| Georeferencing: RMSE X, Y, Z | 0.3997, 0.0463, 0.0828 | 0. 0550, 0. 0517, 0. 1365 |
| Processing: no. key points | Automatic | Automatic |
| Processing: Calibration | Standard | Standard |
| Processing: Point cloud densification | ½ image scale | ½ image scale |
| Processing: Point density | Optimized | Optimized |
| Processing: Noise filtering | Yes | Yes |
| Processing: Surface smoothing | Yes | Yes |
| Processing: Type | Sharp | Sharp |
| Processing: Raster type | GeoTIFF | GeoTIFF |
| Class | Spectral-Only Model | Spectral–Structural Model | ||
|---|---|---|---|---|
| Producer’s | User’s | Producer’s | User’s | |
| Arrow Weed | 0.62 | 0.68 | 0.92 | 0.92 |
| Cattail | 0.82 | 0.89 | 0.90 | 0.97 |
| Chamomile | 0.94 | 0.84 | 0.96 | 0.93 |
| Cottonwood | 0.63 | 0.37 | 0.96 | 0.88 |
| Giant Reed | 0.63 | 0.6 | 0.90 | 0.89 |
| Mesquite | 0.55 | 0.32 | 0.90 | 0.67 |
| Road | 0.98 | 0.99 | 0.99 | 1.0 |
| Sahara Mustard | 0.56 | 0.29 | 0.82 | 0.43 |
| Saltcedar | 0.69 | 0.78 | 0.91 | 0.94 |
| Soil | 0.96 | 0.91 | 0.98 | 0.96 |
| Water | 0.99 | 0.99 | 1.0 | 1.0 |
| Arro | Catt | Cham | Cott | Gian | Mesq | Road | Saha | Salt | Soil | Water | |
|---|---|---|---|---|---|---|---|---|---|---|---|
| Arro | 38,013 | 2114 | 12 | 0 | 630 | 96 | 0 | 56 | 394 | 48 | 0 |
| Cat | 820 | 149,501 | 423 | 18 | 1695 | 102 | 190 | 494 | 600 | 124 | 137 |
| Cham | 35 | 2660 | 43,310 | 2 | 70 | 172 | 13 | 435 | 6 | 103 | 0 |
| Cott | 6 | 232 | 4 | 16,272 | 100 | 37 | 0 | 2 | 1912 | 0 | 1 |
| GR | 1017 | 2515 | 20 | 7 | 60,080 | 481 | 306 | 29 | 2869 | 6 | 3 |
| Mesq. | 757 | 1183 | 320 | 1 | 2080 | 13,875 | 16 | 96 | 2473 | 4 | 0 |
| Road | 0 | 8 | 1 | 0 | 23 | 34 | 63,004 | 1 | 0 | 107 | 0 |
| SM | 216 | 5497 | 900 | 1 | 160 | 87 | 0 | 5197 | 10 | 16 | 0 |
| Salt | 583 | 2105 | 76 | 599 | 1577 | 569 | 0 | 37 | 88,801 | 0 | 2 |
| Soil | 66 | 738 | 19 | 0 | 16 | 3 | 46 | 0 | 0 | 20,069 | 0 |
| Water | 0 | 156 | 3 | 0 | 4 | 0 | 0 | 0 | 8 | 0 | 88,935 |
References
- Didham, R.K.; Tylianakis, J.M.; Hutchison, M.A.; Ewers, R.M.; Gemmell, N.J. Are invasive species the drivers of ecological change? Trends Ecol. Evol. 2005, 20, 470–474. [Google Scholar] [CrossRef]
- Pejchar, L.; Mooney, H.A. Invasive species, ecosystem services and human well-being. Trends Ecol. Evol. 2009, 24, 497–504. [Google Scholar] [CrossRef]
- The National Wildlife Federation. Invasive Species. Available online: https://www.nwf.org/Educational-Resources/Wildlife-Guide/Threats-to-Wildlife/Invasive-Species (accessed on 3 November 2020).
- Di Tomaso, J.M. Impact, Biology, and Ecology of Saltcedar (Tamarix spp.) in the Southwestern United States. Weed Technol. 1998, 12, 326–336. [Google Scholar] [CrossRef]
- Frazier, A.E.; Wang, L. Characterizing spatial patterns of invasive species using sub-pixel classifications. Remote Sens. Environ. 2011, 115, 1997–2007. [Google Scholar] [CrossRef]
- Ji, W.; Wang, L. Phenology-guided saltcedar (Tamarix spp.) mapping using Landsat TM images in western U.S. Remote Sens. Environ. 2016, 173, 29–38. [Google Scholar] [CrossRef]
- Henderson, F.M.; Lewis, A.J. Radar detection of wetland ecosystems: A review. Int. J. Remote Sens. 2008, 29, 5809–5835. [Google Scholar] [CrossRef]
- Shaw, D.R. Translation of remote sensing data into weed management decisions. Weed Sci. 2005, 53, 264–273. [Google Scholar] [CrossRef]
- Roura-Pascual, N.; Richardson, D.M.; Krug, R.M.; Brown, A.; Chapman, R.A.; Forsyth, G.G.; Le Maitre, D.C.; Robertson, M.P.; Stafford, L.; Van Wilgen, B.W.; et al. Ecology and management of alien plant invasions in South African fynbos: Accommodating key complexities in objective decision making. Biol. Conserv. 2009, 142, 1595–1604. [Google Scholar] [CrossRef]
- Richardson, D.M. Fifty Years of Invasion Ecology: The Legacy of Charles Elton; Wiley-Blackwell: Chichester, UK; Hoboken, NJ, USA, 2011; ISBN 978-1-444-33585-9. [Google Scholar]
- Stefanski, J.; Mack, B.; Waske, O. Optimization of Object-Based Image Analysis with Random Forests for Land Cover Mapping. IEEE J. Sel. Top. Appl. Earth Obs. Remote Sens. 2013, 6, 2492–2504. [Google Scholar] [CrossRef]
- Madden, M.; Jordan, T.; Bernardes, S.; Cotten, D.; O’Hare, N.; Pasqua, A. Unmanned Aerial Systems and Structure from Motion Revolutionize Wetlands Mapping. In Remote Sensing of Wetlands; CRC Press: Boca Raton, FL, USA, 2015; pp. 195–220. [Google Scholar]
- Silván-Cárdenas, J.L.; Wang, L. Retrieval of subpixel Tamarix canopy cover from Landsat data along the Forgotten River using linear and nonlinear spectral mixture models. Remote Sens. Environ. 2010, 114, 1777–1790. [Google Scholar] [CrossRef]
- Frazier, A.E.; Wang, L. Modeling landscape structure response across a gradient of land cover intensity. Landsc. Ecol. 2013, 28, 233–246. [Google Scholar] [CrossRef]
- Michez, A.; Piégay, H.; Jonathan, L.; Claessens, H.; Lejeune, P. Mapping of riparian invasive species with supervised classification of Unmanned Aerial System (UAS) imagery. Int. J. Appl. Earth Obs. Geoinf. 2016, 44, 88–94. [Google Scholar] [CrossRef]
- Kattenborn, T.; Lopatin, J.; Förster, M.; Braun, A.C.; Fassnacht, F.E. UAV data as alternative to field sampling to map woody invasive species based on combined Sentinel-1 and Sentinel-2 data. Remote Sens. Environ. 2019, 227, 61–73. [Google Scholar] [CrossRef]
- Hill, D.J.; Tarasoff, C.; Whitworth, G.E.; Baron, J.; Bradshaw, J.L.; Church, J.S. Utility of unmanned aerial vehicles for mapping invasive plant species: A case study on yellow flag iris (Iris pseudacorus L.). Int. J. Remote Sens. 2017, 38, 2083–2105. [Google Scholar] [CrossRef]
- Lippitt, C.D.; Zhang, S. The impact of small unmanned airborne platforms on passive optical remote sensing: A conceptual perspective. Int. J. Remote Sens. 2018, 39, 4852–4868. [Google Scholar] [CrossRef]
- Snavely, N.; Seitz, S.M.; Szeliski, R. Modeling the World from Internet Photo Collections. Int. J. Comput. Vis. 2008, 80, 189–210. [Google Scholar] [CrossRef]
- Westoby, M.J.; Brasington, J.; Glasser, N.F.; Hambrey, M.J.; Reynolds, J.M. ‘Structure-from-Motion’ photogrammetry: A low-cost, effective tool for geoscience applications. Geomorphology 2012, 179, 300–314. [Google Scholar] [CrossRef]
- Yang, M.-D.; Huang, K.-S.; Kuo, Y.-H.; Tsai, H.; Lin, L.-M. Spatial and Spectral Hybrid Image Classification for Rice Lodging Assessment through UAV Imagery. Remote Sens. 2017, 9, 583. [Google Scholar] [CrossRef]
- Díaz-Varela, R.A.; Calvo Iglesias, S.; Cillero Castro, C.; Díaz Varela, E.R. Sub-metric analisis of vegetation structure in bog-heathland mosaics using very high resolution rpas imagery. Ecol. Indic. 2018, 89, 861–873. [Google Scholar] [CrossRef]
- Kirsch, M.; Lorenz, S.; Zimmermann, R.; Tusa, L.; Möckel, R.; Hödl, P.; Booysen, R.; Khodadadzadeh, M.; Gloaguen, R. Integration of Terrestrial and Drone-Borne Hyperspectral and Photogrammetric Sensing Methods for Exploration Mapping and Mining Monitoring. Remote Sens. 2018, 10, 1366. [Google Scholar] [CrossRef]
- Husson, E.; Reese, H.; Ecke, F. Combining Spectral Data and a DSM from UAS-Images for Improved Classification of Non-Submerged Aquatic Vegetation. Remote Sens. 2017, 9, 247. [Google Scholar] [CrossRef]
- Keeley, J.; Syphard, A. Climate Change and Future Fire Regimes: Examples from California. Geosciences 2016, 6, 37. [Google Scholar] [CrossRef]
- Wikipedia Mesa, Arizona. Available online: https://en.wikipedia.org/wiki/Mesa,_Arizona (accessed on 13 March 2012).
- National Park Service. Tamarisk. Available online: https://www.nps.gov/sagu/learn/nature/tamarisk.htm (accessed on 11 May 2020).
- Mokhtar, E.S.; Pradhan, B.; Ghazali, A.H.; Shafri, H.Z.M. Assessing flood inundation mapping through estimated discharge using GIS and HEC-RAS model. Arab. J. Geosci. 2018, 11, 682. [Google Scholar] [CrossRef]
- Wang, L.; Silván-Cárdenas, J.L.; Yang, J.; Frazier, A.E. Invasive Saltcedar (Tamarisk spp.) Distribution Mapping Using Multiresolution Remote Sensing Imagery. Prof. Geogr. 2013, 65, 1–15. [Google Scholar] [CrossRef]
- United States Department of Agriculture. Field Guide for Managing Giant Reed in the Southwest; United States Department of Agriculture: Washington, DC, USA, 2014. [Google Scholar]
- Hawkins, N.C.T.O. Invasive Plants of the Sonoran Desert. 2002. Available online: https://www.resolutionmineeis.us/documents/chambers-hawkins-2002 (accessed on 22 February 2021).
- Dudley, T.L.; Deloach, C.J. Saltcedar (Tamarix spp.), Endangered Species, and Biological Weed Control—Can They Mix? Weed Technol. 2004, 18, 1542–1551. [Google Scholar] [CrossRef]
- Cleverly, J.R.; Smith, S.D.; Sala, A.; Devitt, D.A. Invasive capacity of Tamarix ramosissima in a Mojave Desert floodplain: The role of drought. Oecologia 1997, 111, 12–18. [Google Scholar] [CrossRef]
- Verde River Cooperative Invasive Plant Management. Available online: https://verderiver.org/verde-watershed-restoration-coalition/vwrc-in-action/verde-river-cooperative-invasive-plant-management/ (accessed on 22 February 2021).
- Glenn, E.P.; Nagler, P.L. Comparative ecophysiology of Tamarix ramosissima and native trees in western U.S. riparian zones. J. Arid Environ. 2005, 61, 419–446. [Google Scholar] [CrossRef]
- Arizona Emergency Information Network. Firefighters Successful Holding Fire Lines on the Cactus Fire. 2017. Available online: https://ein.az.gov/emergencyinformation/emergency-bulletin/firefighters-successful-holding-fire-lines-cactus-fire (accessed on 1 August 2020).
- Matthew, B.; Michael, L. Fire Management and Invasive Plants: A Handbook. U. S. Fish Wildl. Serv. Arlingt. Va. 2008, 27. [Google Scholar]
- Van Wilgen, B. Natural fires & plant invaders—What is the link? Quest 2015, 11, 22–23. [Google Scholar]
- Rhoades, C.; Barnes, T.; Washburn, B. Prescribed Fire and Herbicide Effects on Soil Processes During Barrens Restoration. Restor. Ecol. 2002, 10, 656–664. [Google Scholar] [CrossRef]
- Singh, K.K.; Frazier, A.E. A meta-analysis and review of unmanned aircraft system (UAS) imagery for terrestrial applications. Int. J. Remote Sens. 2018, 39, 5078–5098. [Google Scholar] [CrossRef]
- Pix4d. Pix4Dmapper 4.1 User Manual. 2017. Available online: https://support.pix4d.com/hc/en-us/articles/204272989-Offline-Getting-Started-and-Manual-pdf (accessed on 6 June 2020).
- Nguyen, U.; Glenn, E.P.; Dang, T.D.; Pham, L.T.H. Mapping vegetation types in semi-arid riparian regions using random forest and object-based image approach: A case study of the Colorado River Ecosystem, Grand Canyon, Arizona. Ecol. Inform. 2019, 50, 43–50. [Google Scholar] [CrossRef]
- Jensen, J.R. Introductory Digital Image Processing: A Remote Sensing Perspective; Prentice Hall series in geographic information science; Prentice Hall: Upper Saddle River, NJ, USA, 2005; ISBN 9780131453616. [Google Scholar]
- Khan, N.M.; Rastoskuev, V.V.; Sato, Y.; Shiozawa, S. Assessment of hydrosaline land degradation by using a simple approach of remote sensing indicators. Agric. Water Manag. 2005, 77, 96–109. [Google Scholar] [CrossRef]
- Nguyen, K.-A.; Liou, Y.-A.; Tran, H.-P.; Hoang, P.-P.; Nguyen, T.-H. Soil salinity assessment by using near-infrared channel and Vegetation Soil Salinity Index derived from Landsat 8 OLI data: A case study in the Tra Vinh Province, Mekong Delta, Vietnam. Prog. Earth Planet. Sci. 2020, 7, 1. [Google Scholar] [CrossRef]
- Santos, W.J.R.; Silva, B.M.; Oliveira, G.C.; Volpato, M.M.L.; Lima, J.M.; Curi, N.; Marques, J.J. Soil moisture in the root zone and its relation to plant vigor assessed by remote sensing at management scale. Geoderma 2014, 221–222, 91–95. [Google Scholar] [CrossRef]
- Wahab, I.; Hall, O.; Jirström, M. Remote Sensing of Yields: Application of UAV Imagery-Derived NDVI for Estimating Maize Vigor and Yields in Complex Farming Systems in Sub-Saharan Africa. Drones 2018, 2, 28. [Google Scholar] [CrossRef]
- Huete, A. A soil-adjusted vegetation index (SAVI). Remote Sens. Environ. 1988, 25, 295–309. [Google Scholar] [CrossRef]
- Esri. Hillshade Function. Available online: https://desktop.arcgis.com/en/arcmap/10.3/manage-data/raster-and-images/hillshade-function.htm (accessed on 5 July 2020).
- Esri. An Overview of the Neighborhood Toolset. Available online: https://pro.arcgis.com/en/pro-app/tool-reference/spatial-analyst/an-overview-of-the-neighborhood-tools.htm (accessed on 5 July 2020).
- Garbrecht, J.; Martz, L.W. The assignment of drainage direction over flat surfaces in raster digital elevation models. J. Hydrol. 1997, 193, 204–213. [Google Scholar] [CrossRef]
- Mafanya, M.; Tsele, P.; Botai, J.; Manyama, P.; Swart, B.; Monate, T. Evaluating pixel and object based image classification techniques for mapping plant invasions from UAV derived aerial imagery: Harrisia pomanensis as a case study. ISPRS J. Photogramm. Remote Sens. 2017, 129, 1–11. [Google Scholar] [CrossRef]
- KopeĿ, D.; Michalska-Hejduk, D.; Sſawik, S.; Berezowski, T.; Borowski, M.; Rosadziſski, S.; Chormaſski, J. Application of multisensoral remote sensing data in the mapping of alkaline fens Natura 2000 habitat. Ecol. Indic. 2016, 70, 196–208. [Google Scholar] [CrossRef]
- Breiman, L. Random forests. Mach. Learn. 2001, 45, 5–32. [Google Scholar] [CrossRef]
- Myint, S.W.; Gober, P.; Brazel, A.; Grossman-Clarke, S.; Weng, Q. Per-pixel vs. object-based classification of urban land cover extraction using high spatial resolution imagery. Remote Sens. Environ. 2011, 115, 1145–1161. [Google Scholar] [CrossRef]
- Millard, K.; Richardson, M. Wetland mapping with LiDAR derivatives, SAR polarimetric decompositions, and LiDAR–SAR fusion using a random forest classifier. Can. J. Remote Sens. 2013, 39, 290–307. [Google Scholar] [CrossRef]
- Jin, H.; Mountrakis, G.; Stehman, S.V. Assessing integration of intensity, polarimetric scattering, interferometric coherence and spatial texture metrics in PALSAR-derived land cover classification. ISPRS J. Photogramm. Remote Sens. 2014, 98, 70–84. [Google Scholar] [CrossRef]
- Belgiu, M.; Drăguţ, L. Random forest in remote sensing: A review of applications and future directions. ISPRS J. Photogramm. Remote Sens. 2016, 114, 24–31. [Google Scholar] [CrossRef]
- Niemeyer, J.; Rottensteiner, F.; Soergel, U. Contextual classification of lidar data and building object detection in urban areas. ISPRS J. Photogramm. Remote Sens. 2014, 87, 152–165. [Google Scholar] [CrossRef]
- SEINet Data Portal: Arizona-New Mexico Chapter. Available online: https://swbiodiversity.org/seinet/index.php (accessed on 15 October 2020).
- Gausman, H.W. Reflectance of leaf components. Remote Sens. Environ. 1977, 6, 1–9. [Google Scholar] [CrossRef]
- Curran, P.J. Remote sensing of foliar chemistry. Remote Sens. Environ. 1989, 30, 271–278. [Google Scholar] [CrossRef]
- Dubayah, R.; Blair, J.B.; Goetz, S.; Fatoyinbo, L.; Hansen, M.; Healey, S.; Hofton, M.; Hurtt, G.; Kellner, J.; Luthcke, S.; et al. The Global Ecosystem Dynamics Investigation: High-resolution laser ranging of the Earth’s forests and topography. Sci. Remote Sens. 2020, 1, 100002. [Google Scholar] [CrossRef]
- Saura, S. Effects of minimum mapping unit on land cover data spatial configuration and composition. Int. J. Remote Sens. 2002, 23, 4853–4880. [Google Scholar] [CrossRef]
- O’Neill, R.V.; Hunsaker, C.T.; Timmins, S.P.; Jackson, B.L.; Jones, K.B.; Riitters, K.H.; Wickham, J.D. Scale problems in reporting landscape pattern at the regional scale. Landsc. Ecol. 1996, 11, 169–180. [Google Scholar] [CrossRef]
- Flynn, K.C.; Frazier, A.E.; Admas, S. Performance of chlorophyll prediction indices for Eragrostis tef at Sentinel-2 MSI and Landsat-8 OLI spectral resolutions. Precis. Agric. 2020, 21, 1057–1071. [Google Scholar] [CrossRef]
- O’mera, S.; Larsen, D.; Owens, C. Methods to Control Saltcedar and Russian Olive; Shafroth, P.B., Brown, C.A., Merritt, D.M., Eds.; U.S. Geological Survey Scientific Investigations Report 2009-5247; USGS: Washington, DC, USA, 2010.


| Index | Equation |
|---|---|
| Normalized Difference Vegetation Index (NDVI) | |
| Normalized Difference Water Index (NDWI) | |
| Soil Adjusted Vegetation Index (SAVI) * | |
| Normalized Difference Salinity Index (NDSI) | |
| Two Band Enhanced Vegetation Index (EVI-2) | |
| Green Normalized Difference Vegetation Index (GNDVI) |
| Layer Number | Scheme Number | Layer Name |
|---|---|---|
| 1 | 1, 2 | Red band (RED) |
| 2 | 1, 2 | Green band (GREEN) |
| 3 | 1, 2 | Blue band (BLUE) |
| 4 | 1, 2 | Red Edge band (RE) |
| 5 | 1, 2 | Near Infrared band (NIR) |
| 6 | 1, 2 | Two Band Enhanced Vegetation Index (EVI-2) |
| 7 | 1, 2 | Green Normalized Difference Vegetation Index (GNDVI) |
| 8 | 1, 2 | Normalized Difference Salinity Index (NDSI) |
| 9 | 1, 2 | Normalized Difference Vegetation Index (NDVI) |
| 10 | 1, 2 | Normalized Difference Water Index (NDWI) |
| 11 | 1, 2 | Soil-Adjusted Vegetation Index (SAVI) |
| 12 | 2 | Canopy Height Model (CHM) |
| 13 | 2 | Digital Terrain Model (DTM) |
| 14 | 2 | Flow Accumulation (FLOW) |
| Vegetation Species | Height (m) |
|---|---|
| Arrow Weed | 1.5–3 |
| Cattail | 1–3 |
| Cottonwood | up to 30 |
| Chamomile | 0.5 |
| Giant Reed | 2–5 |
| Sahara Mustard | 0.3–1.2 |
| Mesquite | up to 17 |
| Saltcedar | usually 4–5, up to 8 |
Publisher’s Note: MDPI stays neutral with regard to jurisdictional claims in published maps and institutional affiliations. |
© 2021 by the authors. Licensee MDPI, Basel, Switzerland. This article is an open access article distributed under the terms and conditions of the Creative Commons Attribution (CC BY) license (http://creativecommons.org/licenses/by/4.0/).
Share and Cite
Kedia, A.C.; Kapos, B.; Liao, S.; Draper, J.; Eddinger, J.; Updike, C.; Frazier, A.E. An Integrated Spectral–Structural Workflow for Invasive Vegetation Mapping in an Arid Region Using Drones. Drones 2021, 5, 19. https://doi.org/10.3390/drones5010019
Kedia AC, Kapos B, Liao S, Draper J, Eddinger J, Updike C, Frazier AE. An Integrated Spectral–Structural Workflow for Invasive Vegetation Mapping in an Arid Region Using Drones. Drones. 2021; 5(1):19. https://doi.org/10.3390/drones5010019
Chicago/Turabian StyleKedia, Arnold Chi, Brandi Kapos, Songmei Liao, Jacob Draper, Justin Eddinger, Christopher Updike, and Amy E. Frazier. 2021. "An Integrated Spectral–Structural Workflow for Invasive Vegetation Mapping in an Arid Region Using Drones" Drones 5, no. 1: 19. https://doi.org/10.3390/drones5010019
APA StyleKedia, A. C., Kapos, B., Liao, S., Draper, J., Eddinger, J., Updike, C., & Frazier, A. E. (2021). An Integrated Spectral–Structural Workflow for Invasive Vegetation Mapping in an Arid Region Using Drones. Drones, 5(1), 19. https://doi.org/10.3390/drones5010019