Article

Spray Deposition on Weeds (Palmer Amaranth and Morningglory) from a Remotely Piloted Aerial Application System and Backpack Sprayer

by
Daniel Martin
1,*,
Vijay Singh
2,†,
Mohamed A. Latheef
1 and
Muthukumar Bagavathiannan
2
1
Agricultural Research Service, United States Department of Agriculture, Aerial Application Technology Research Unit, 3103 F & B Road, College Station, TX 77845, USA
2
Department of Soil and Crop Sciences, Texas A&M University, College Station, TX 77845, USA
*
Author to whom correspondence should be addressed.
Present address: Eastern Shore Agricultural Research and Extension Center, Virginia Polytechnic Institute and State University, Painter, VA 23420, USA.
Drones 2020, 4(3), 59; https://doi.org/10.3390/drones4030059
Submission received: 11 August 2020 / Revised: 15 September 2020 / Accepted: 15 September 2020 / Published: 19 September 2020
(This article belongs to the Special Issue Feature Papers of Drones)

Abstract

:
This study was designed to determine whether a remotely piloted aerial application system (RPAAS) could be used in lieu of a backpack sprayer for post-emergence herbicide application. Consequent to this objective, a spray mixture of tap water and fluorescent dye was applied on Palmer amaranth and ivyleaf morningglory using an RPAAS at 18.7 and 37.4 L·ha−1 and a CO2-pressurized backpack sprayer at a 140 L·ha−1 spray application rate. Spray efficiency (the proportion of applied spray collected on an artificial sampler) for the RPAAS treatments was comparable to that for the backpack sprayer. Fluorescent spray droplet density was significantly higher on the adaxial surface for the backpack sprayer treatment than that for the RPAAS platforms. The percent of spray droplets on the abaxial surface for the RPAAS aircraft at 37.4 L·ha−1 was 4-fold greater than that for the backpack sprayer at 140 L·ha−1. The increased spray deposition on the abaxial leaf surfaces was likely caused by rotor downwash and wind turbulence generated by the RPAAS which caused leaf fluttering. This improved spray deposition may help increase the efficacy of contact herbicides. Test results indicated that RPAASs may be used for herbicide application in lieu of conventional backpack sprayers.

1. Introduction

Weeds are one of the major limiting factors to the production of agricultural crops and cause significant yield loss in crop farming systems throughout the world [1,2,3]. It is estimated that weeds in corn and soybean alone would reduce yield by 50%, costing growers $43 billion in economic loss annually in the United States and Canada according to a recent study conducted by the Weed Science Society of America in conjunction with Kansas State University spanning over a seven-year period [4,5,6]. In general, broadleaf weeds are more competitive than grasses and early germinating weeds reduce yield more than weeds which emerge later in the growing season [7]. In many parts of the world, weed control with herbicides has gained traction in lieu of tillage and it is purported to improve environmental conditions including a reduction in soil erosion, fuel use and greenhouse gas emissions [8].
Recently, the use of unmanned aerial application systems (UASs) or remotely piloted aerial application systems (RPAASs) for field mapping, weed classification by species, plant stress detection, biomass and field nutrition estimation and application of pest control products in small-farm operations and site-specific management of crop pests in difficult terrains not easily accessible to manned aircraft has received increased attention around the globe [9,10,11,12]. RPAASs have the potential to occupy this niche because of their ability to fly at low altitudes and to hover close to plant canopies at different application heights and ground speeds with precision and safety. RPAASs are remotely piloted telemetrically and can fly autonomously using preprogrammed georeferenced flight paths. In precision agriculture, data on soil variability and crop characteristics to optimize field applications of seed, fertilizer and irrigation can be collected by remote sensing [13,14,15]. Huang et al. [16] developed UAS systems for digital imaging to identify glyphosate-resistant weeds and to determine crop injury from dicamba herbicide. Göktoǧan et al. [17] used a rotary wing UAS to locate, classify and map alligator weed and Salvinia in an inaccessible aquatic habitat. Using multispectral cameras, Castaldi et al. [18] acquired aerial images of weed patches in maize fields and developed prescription maps for herbicide application. Peña et al. [19] found strong correlation between on-ground weed coverage and that estimated by aerial remote imagery captured by an UAV (r2 = 0.89). Moreover, Peña et al. [19] reported that the determination of weed-free and low to moderate weed density areas would likely facilitate the growers to reduce herbicide application in maize fields. Although several researchers have reported that spray drones offer good potential for site-specific herbicide application in commercial farms or for monitoring weed populations over much larger areas [20], hardly any data exist on the use of RPAAS in controlling weeds. Exceptions to these reports was that of Ahmad et al. [21], who recently reported that the operational parameters, 2 m application height and 2 m s−1 flight speed provided the highest average herbicide spray deposition on weed canopy.
Backpack sprayers are the preferred method for applying herbicides in small-farm operations, in small plot weed science research trials and in rangelands where selective application to patches of invasive species is required [22,23]. Research data comparing applications of pest control products made by backpack sprayers with spray drones are limited. Spray application rates for backpack sprayers are usually between 94 and 318 L·ha−1 at 207 to 345 kPa pressure, with nozzle flow rates varying between 0.4 and 0.8 L·min−1. The walking speed of the operator is usually held at 1.4 m·s−1 [22,24]. However, RPAAS vehicles are typically programmed to apply pesticides between 2 and 4 m application height and 1 and 7 m·s−1 ground speed. The spray application rates usually vary between 19 and 38 L·ha−1 [25]. These key differences can affect spray pattern uniformity, droplet spectra and application rates and efficacy of pest control products [22,26,27,28]. It is, therefore, essential to characterize and compare spray deposition and droplet spectra characteristics produced by these two delivery systems under field conditions. Such fundamental studies are required to assess whether RPAASs could be used in lieu of backpack sprayers for herbicide applications.
This research was designed to evaluate conventional ground and novel aerial spray technologies for herbicide applications against weed populations. This study was conducted in a soybean field pre-seeded with Palmer amaranth (Amaranthus palmeri S. Watson) and ivyleaf morningglory (Ipomoea hederacea (L.) Jacq.), summer annual and most problematic weeds [29,30,31].

2. Materials and Methods

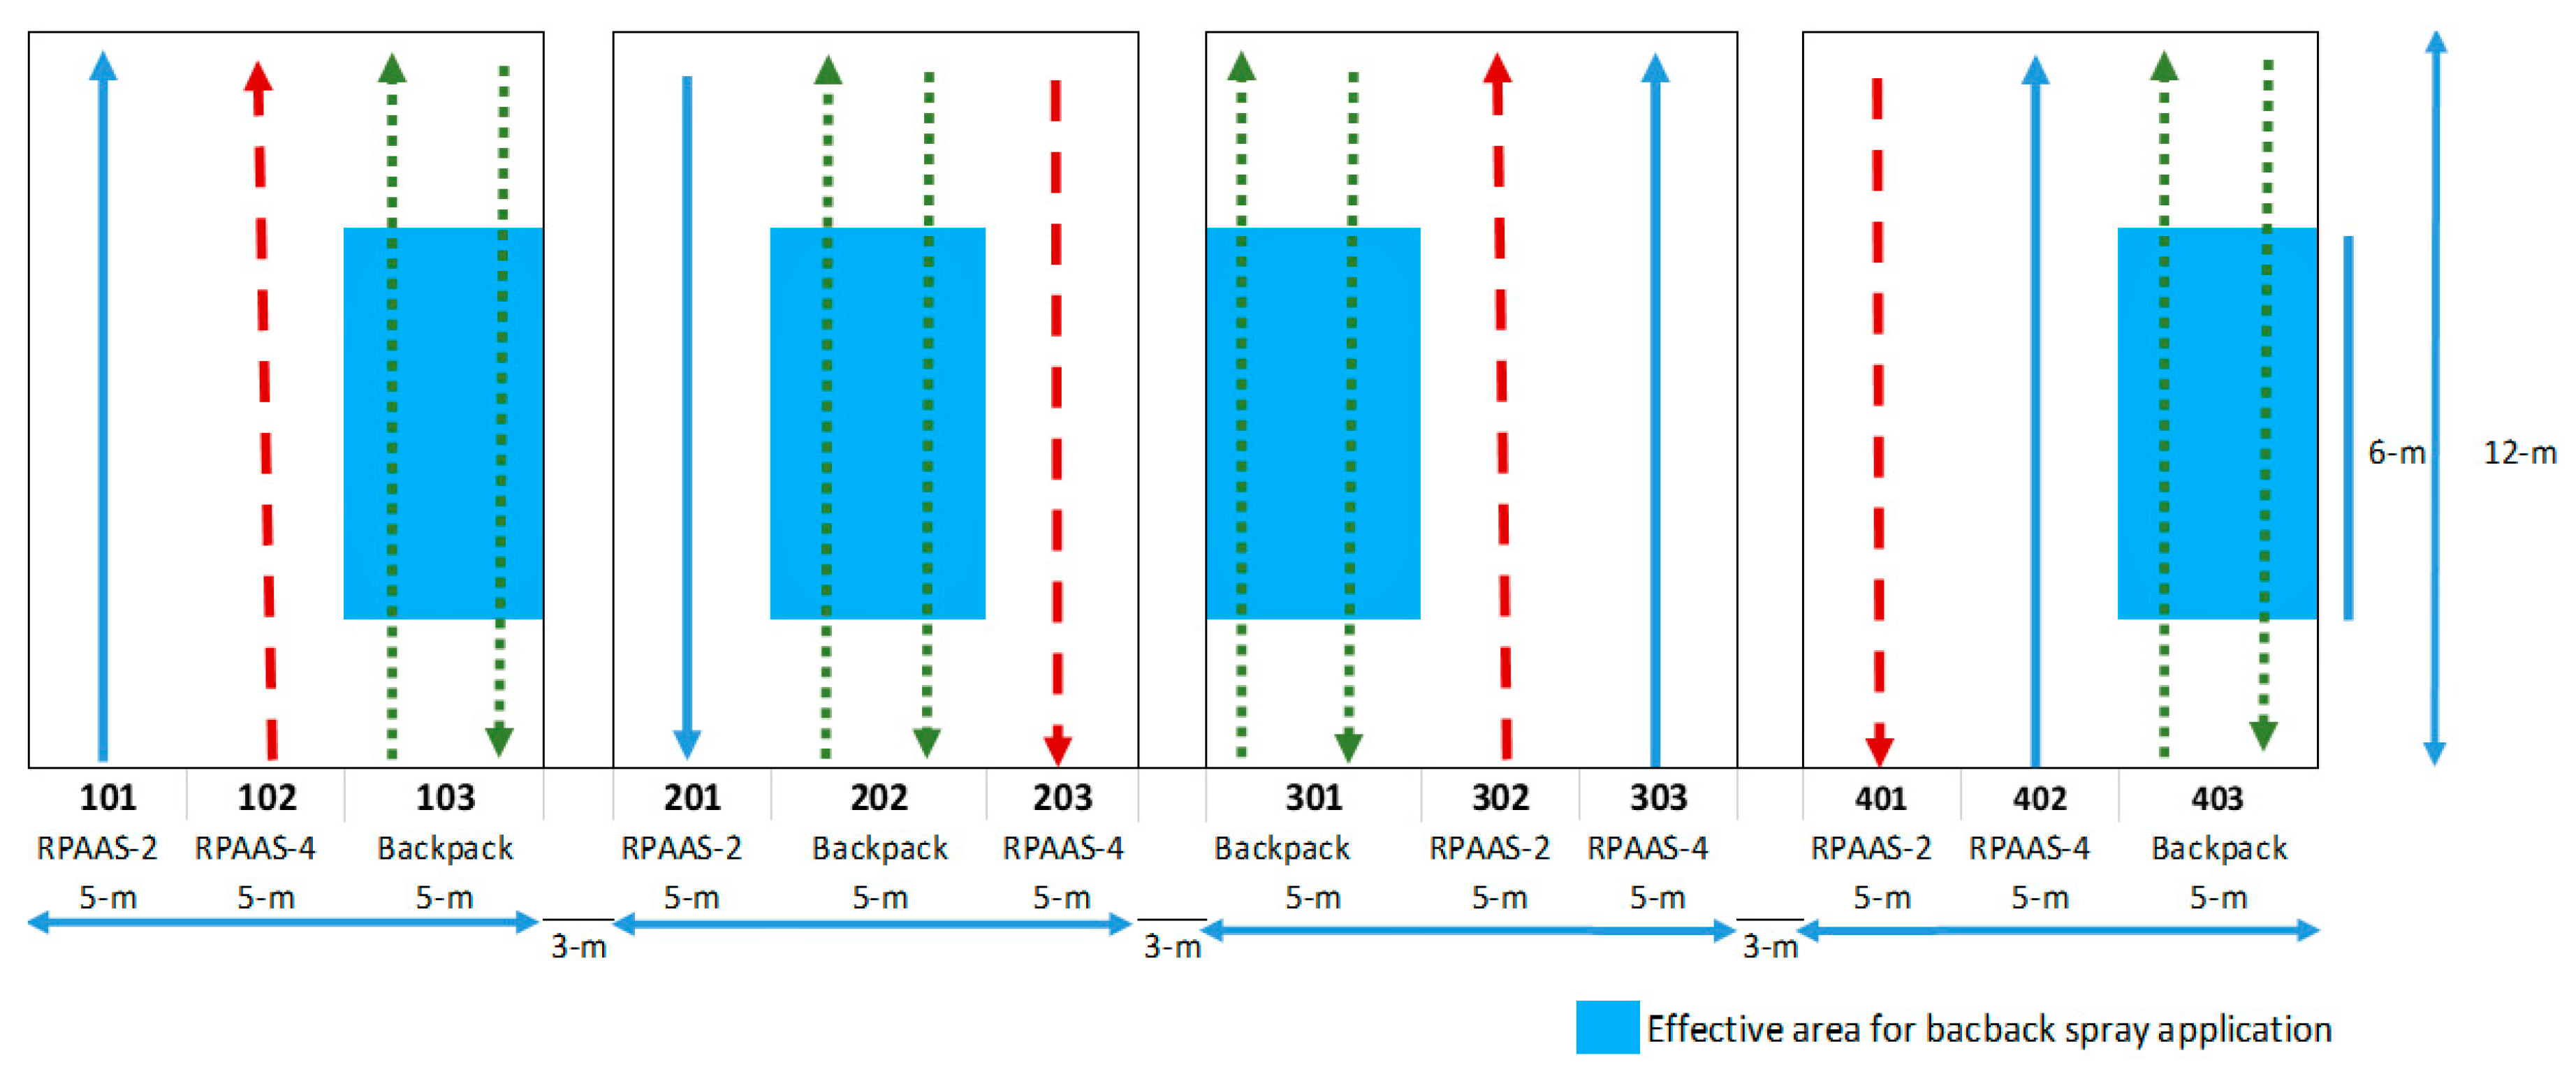
The field experiments were conducted at Texas A&M research farm near College Station, TX, USA (30°32′17″ N; 96°25′19″ W). Four blocks, each 15 m wide × 12 m long, with 3 m between each block, were established with a 5 m strip of land earmarked at random for each treatment (Figure 1). The experimental units were assembled in a randomized complete block design with four replications to overcome heterogeneity in field conditions, relative to weed density and edaphic conditions between replicated blocks. Soybean was drill seeded at 320,000 seeds·ha−1 with 76 cm row spacing on 15 May 2018. Weed seeds were broadcasted after soybean planting and were lightly incorporated into the soil. Weed density and size were recorded before spray application. Palmer amaranth and ivyleaf morningglory densities were 19 and 28 plants·m−2, respectively at the time of spray application. The widest areas of the leaf blades of Palmer amaranth were ca. 7 cm long and 4 cm wide, while those of ivyleaf morning glory were ca. 9 cm long and 7 cm wide when the test was conducted.
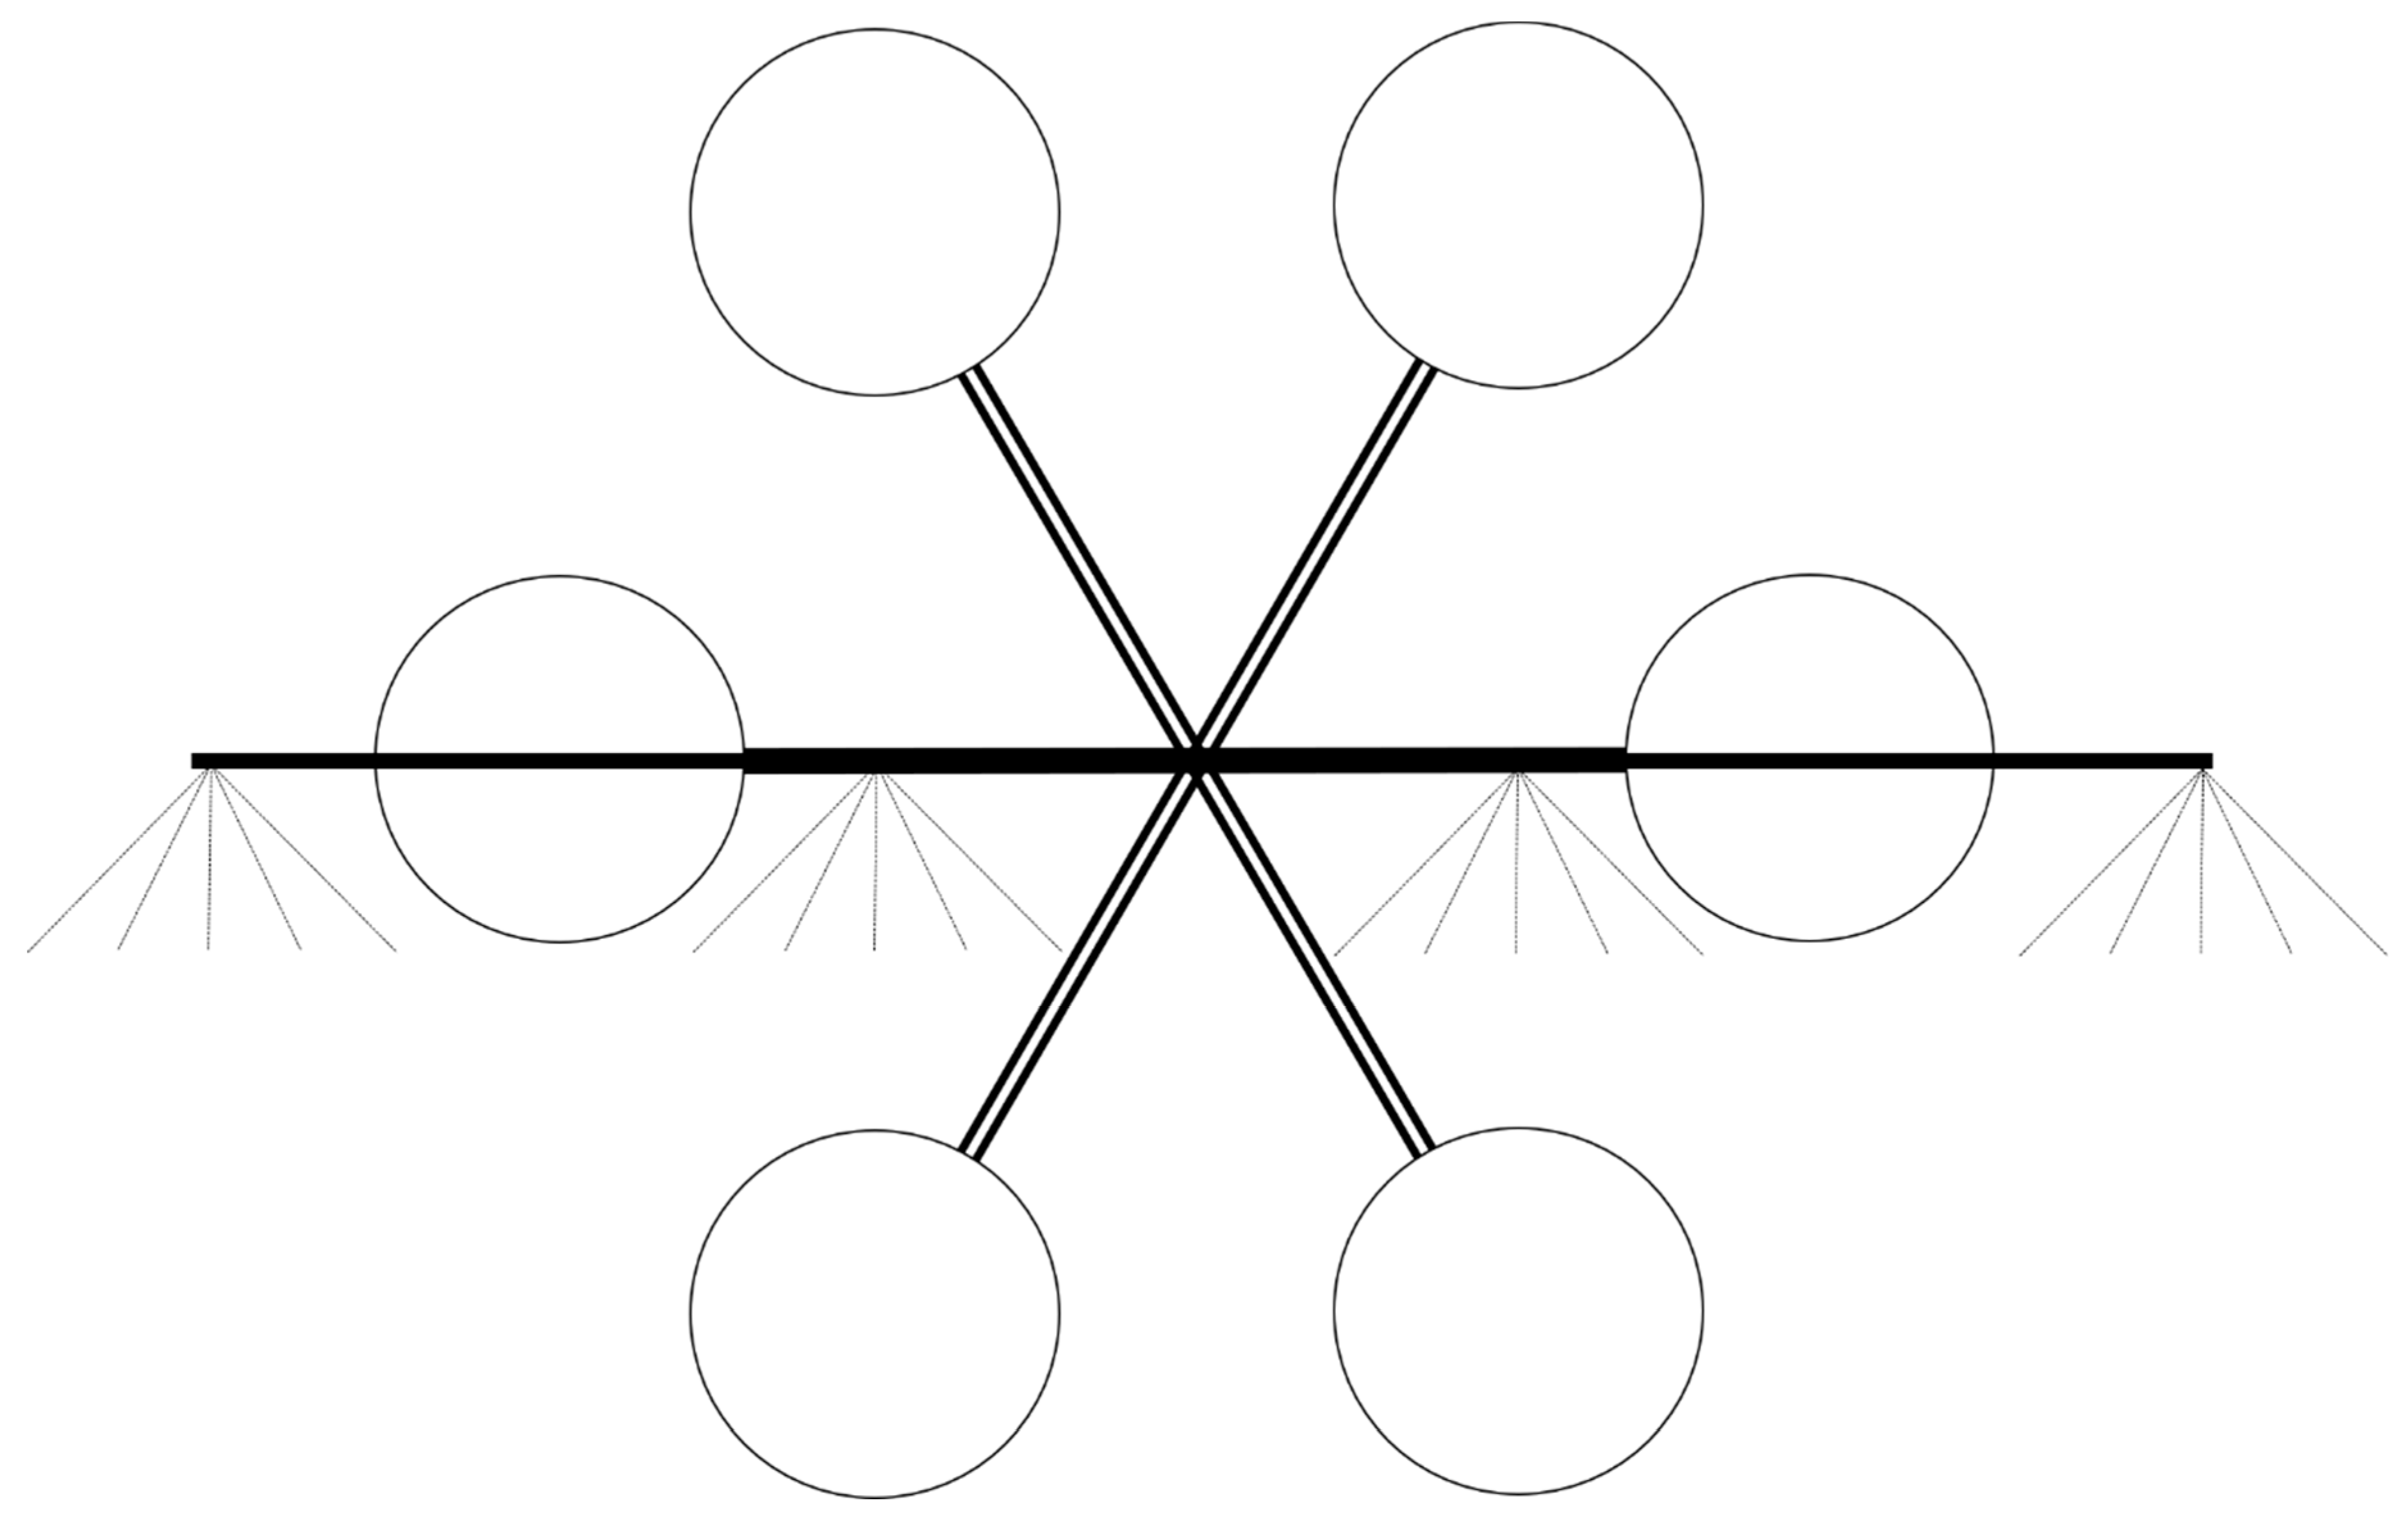
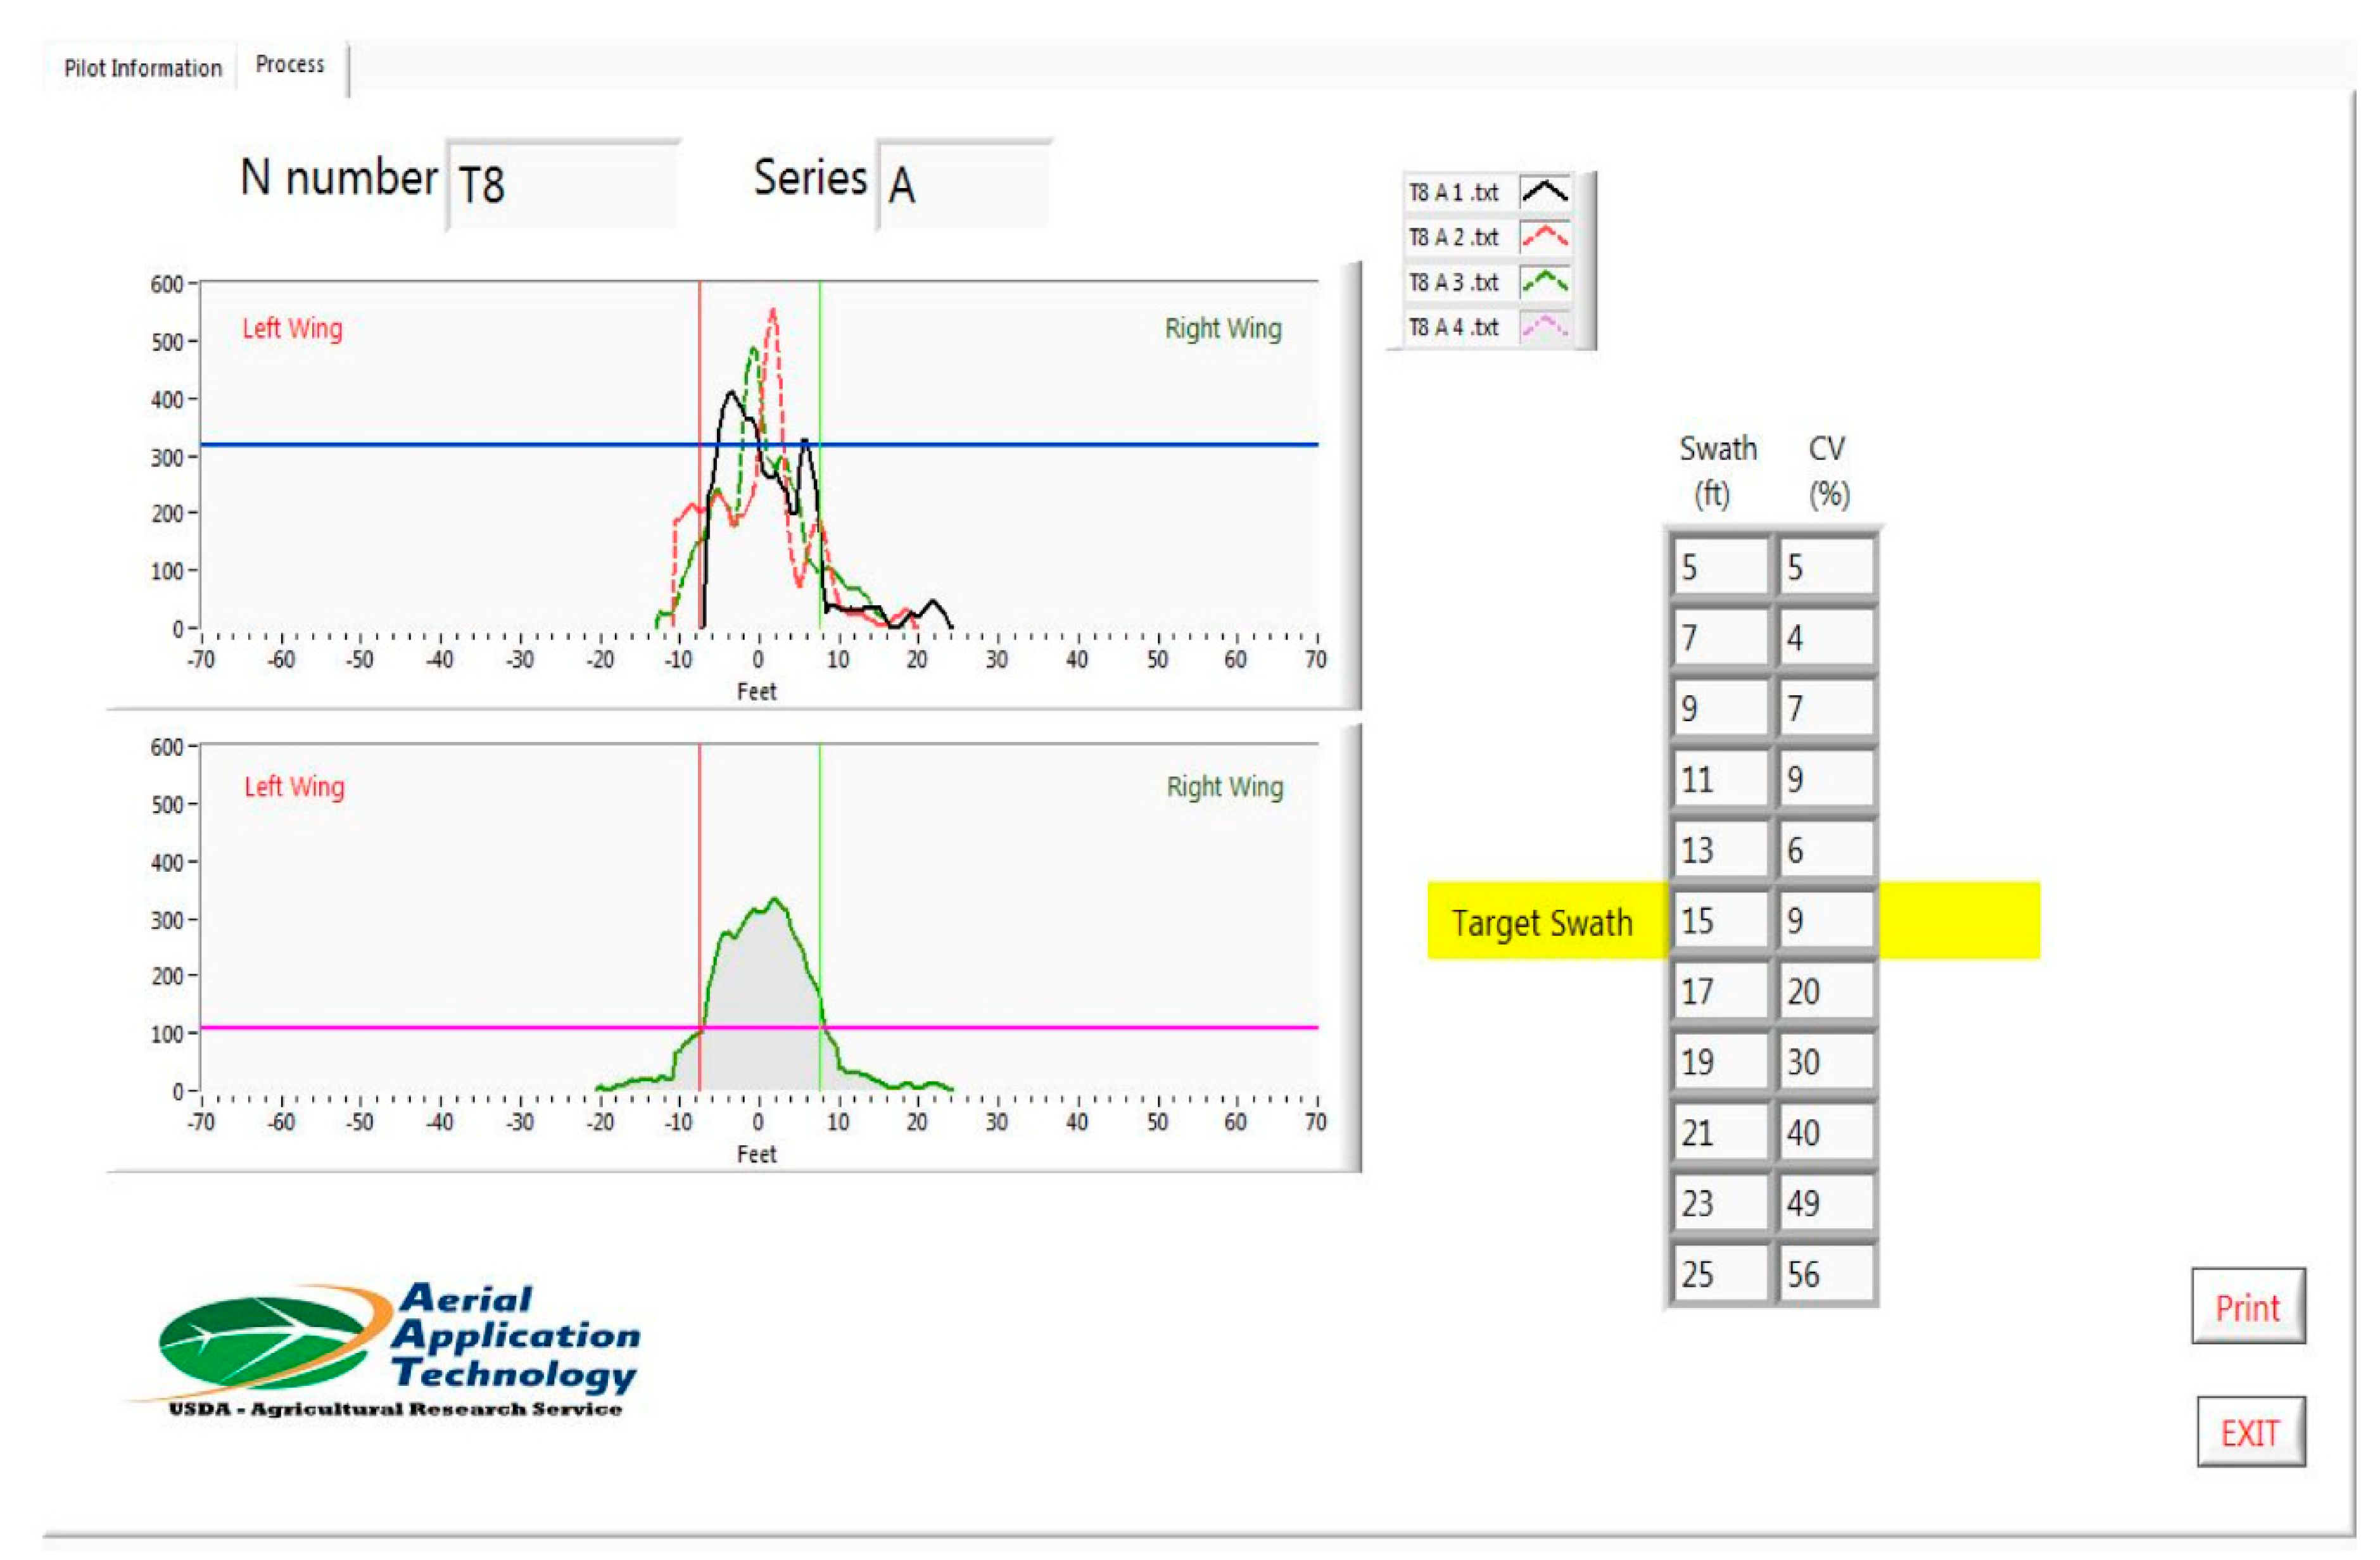
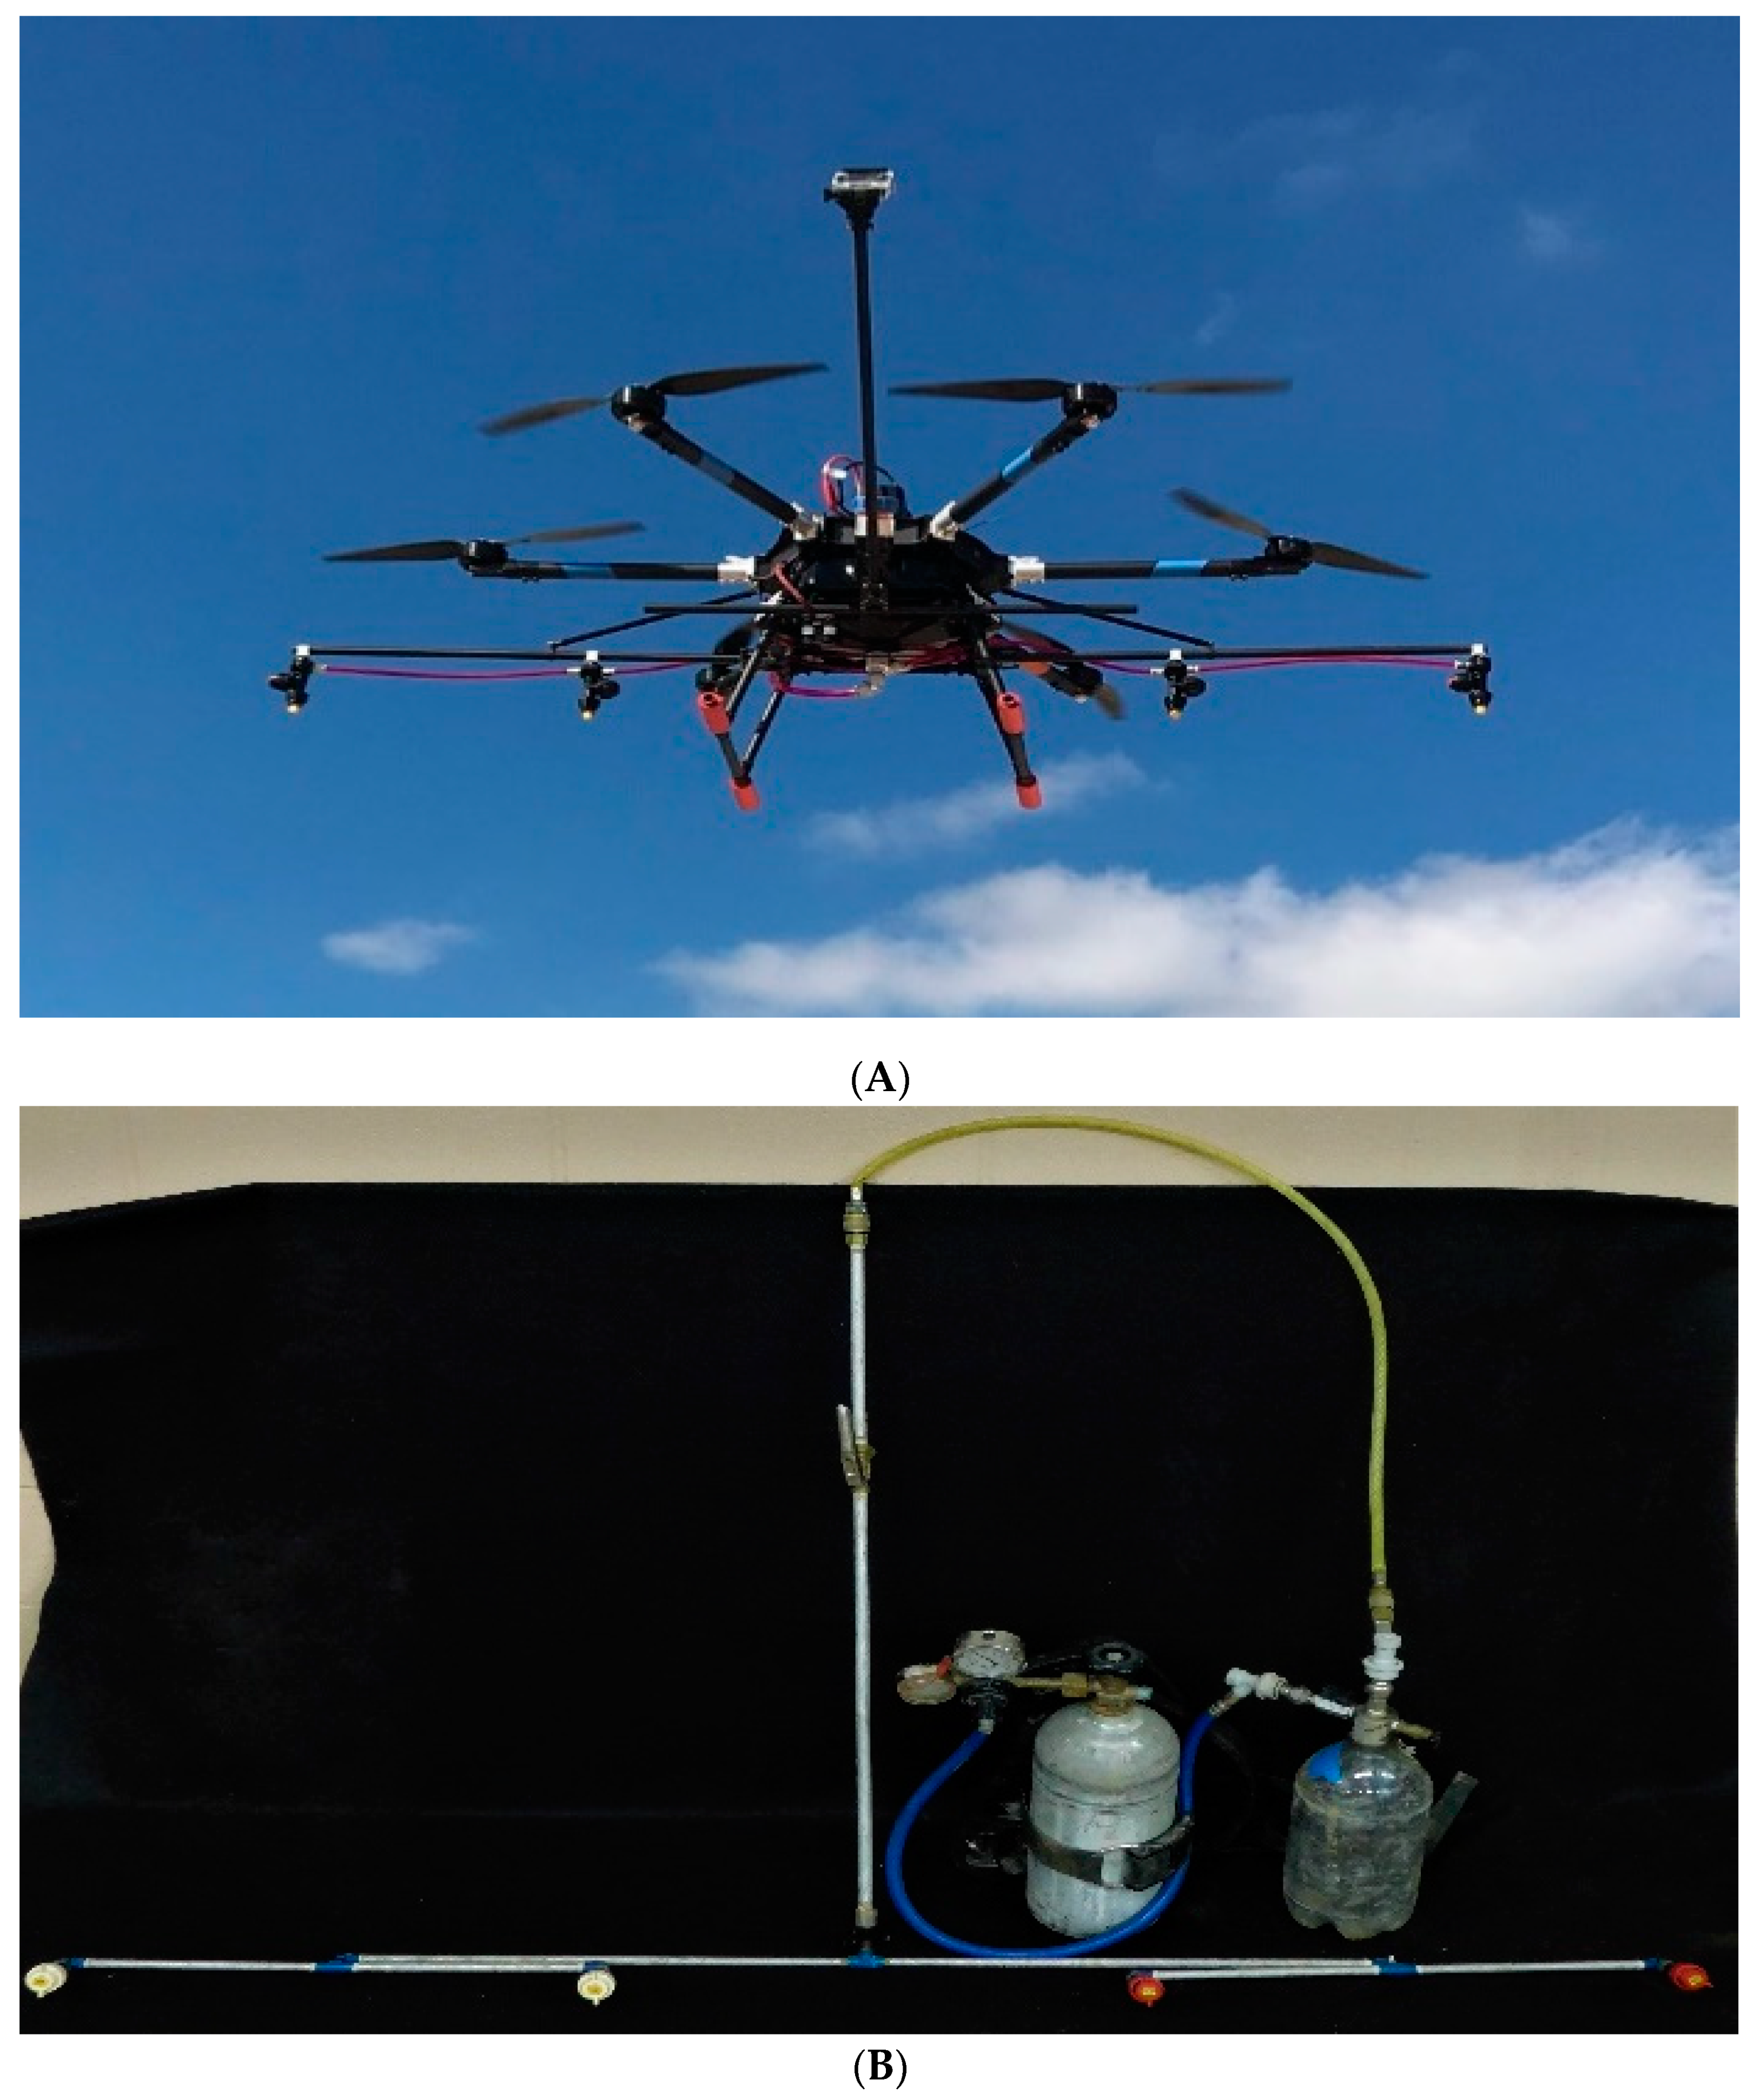
Two spray treatments (18.7 and 37.4 L·ha−1) were applied with a RPAAS (model V6A, Homeland Surveillance and Electronics, Seattle, WA), and one treatment (140 L·ha−1) was applied with a custom-made CO2 backpack sprayer (Figure 2A,B), respectively, show V6A aircraft and backpack sprayer). These treatments are described in the text for brevity as acronyms, RPAAS-2, RPAAS-4, and BP-15, each representing spray application rates of 2, 4 and 15 gallons per acre or 18.7, 37.4 and 140 L·ha−1, respectively. This study was conducted on 27 June 2018 (Study 1) and was repeated in time and space two weeks later on 11 July 2018 (Study 2). The details about the spray treatment setups, operating parameters for the backpack sprayer and the RPAAS aircraft, including spray pressure, spray rates, nozzle type and orifice, aircraft ground speed, walking speed for the backpack sprayer and application height are provided in Table 1. Initially, four TTI110-015 nozzles were installed on the RPAAS. However, due to the low pump capacity, a pressure of only 345 kPa was achievable. For the RPAAS, the outboard nozzles were positioned 0.41 m away from the inboard nozzles, which were 0.82 m apart (Figure 3). Spray pattern testing was conducted with this setup according to the conventional pattern-testing technique described earlier [25]. Briefly, four spray passes were conducted with water and fluorescent dye and patterns from each of the passes were averaged to yield a representative spray pattern for the aircraft. The results showed a symmetrical pattern with an effective swath of 4.6 m (15 ft) (Figure 4). During the field study, only three of the four nozzles were operational (the left outboard nozzle was non-functional), likely due to the daylight visible dye used in the study for image analysis, which reduced system pressure. This pressure was not enough to open the check valves on all the nozzles. As a result, only three of the four nozzles were operational for Study 1, and a full spray pattern for each nozzle was not achieved. With an effective swath of 4.6 m and a ground speed of 4 m·s−1 for three operational nozzles, the resulting spray application rate was 17.8 L·ha−1. Two of these passes would yield an application rate of 35.6 L·ha−1. For Study 2, only the two inboard nozzles were used to achieve a pressure of 414 kPa, which activated both nozzles and provided a full spray pattern for each nozzle. Spray pattern testing for this two-nozzle configuration was not conducted.
The spray solution was comprised of a daylight visible fluorescent dye (Tintex Rocket Red, TX-13, DayGlo Color Corporation, Cleveland, OH, USA) at 10% v/v mixed with tap water. The fluorescent dye was used to quantify spray droplets on Palmer amaranth and morningglory leaves using the digital imaging technique documented previously [32,33].

2.1. Sampling of Spray Deposition

Water-sensitive paper (WSP) samplers (26 mm × 76 mm) (Spraying Systems, Wheaton, Ill.) were paper clipped to a metal plate (100 mm × 100 mm) and placed on a 0.3 m × 0.3 m wooden board. WSPs were oriented towards the upwind side of the metal plate to keep them flat and secured. There were four artificial samplers placed in each backpack treatment plot and five samplers in each RPAAS treatment plot. WSP samplers were diagonally placed in the test plots with the first sampling location 2 m in from the edge of each plot and subsequent locations 2 m farther down and 1 row over from the previous location.
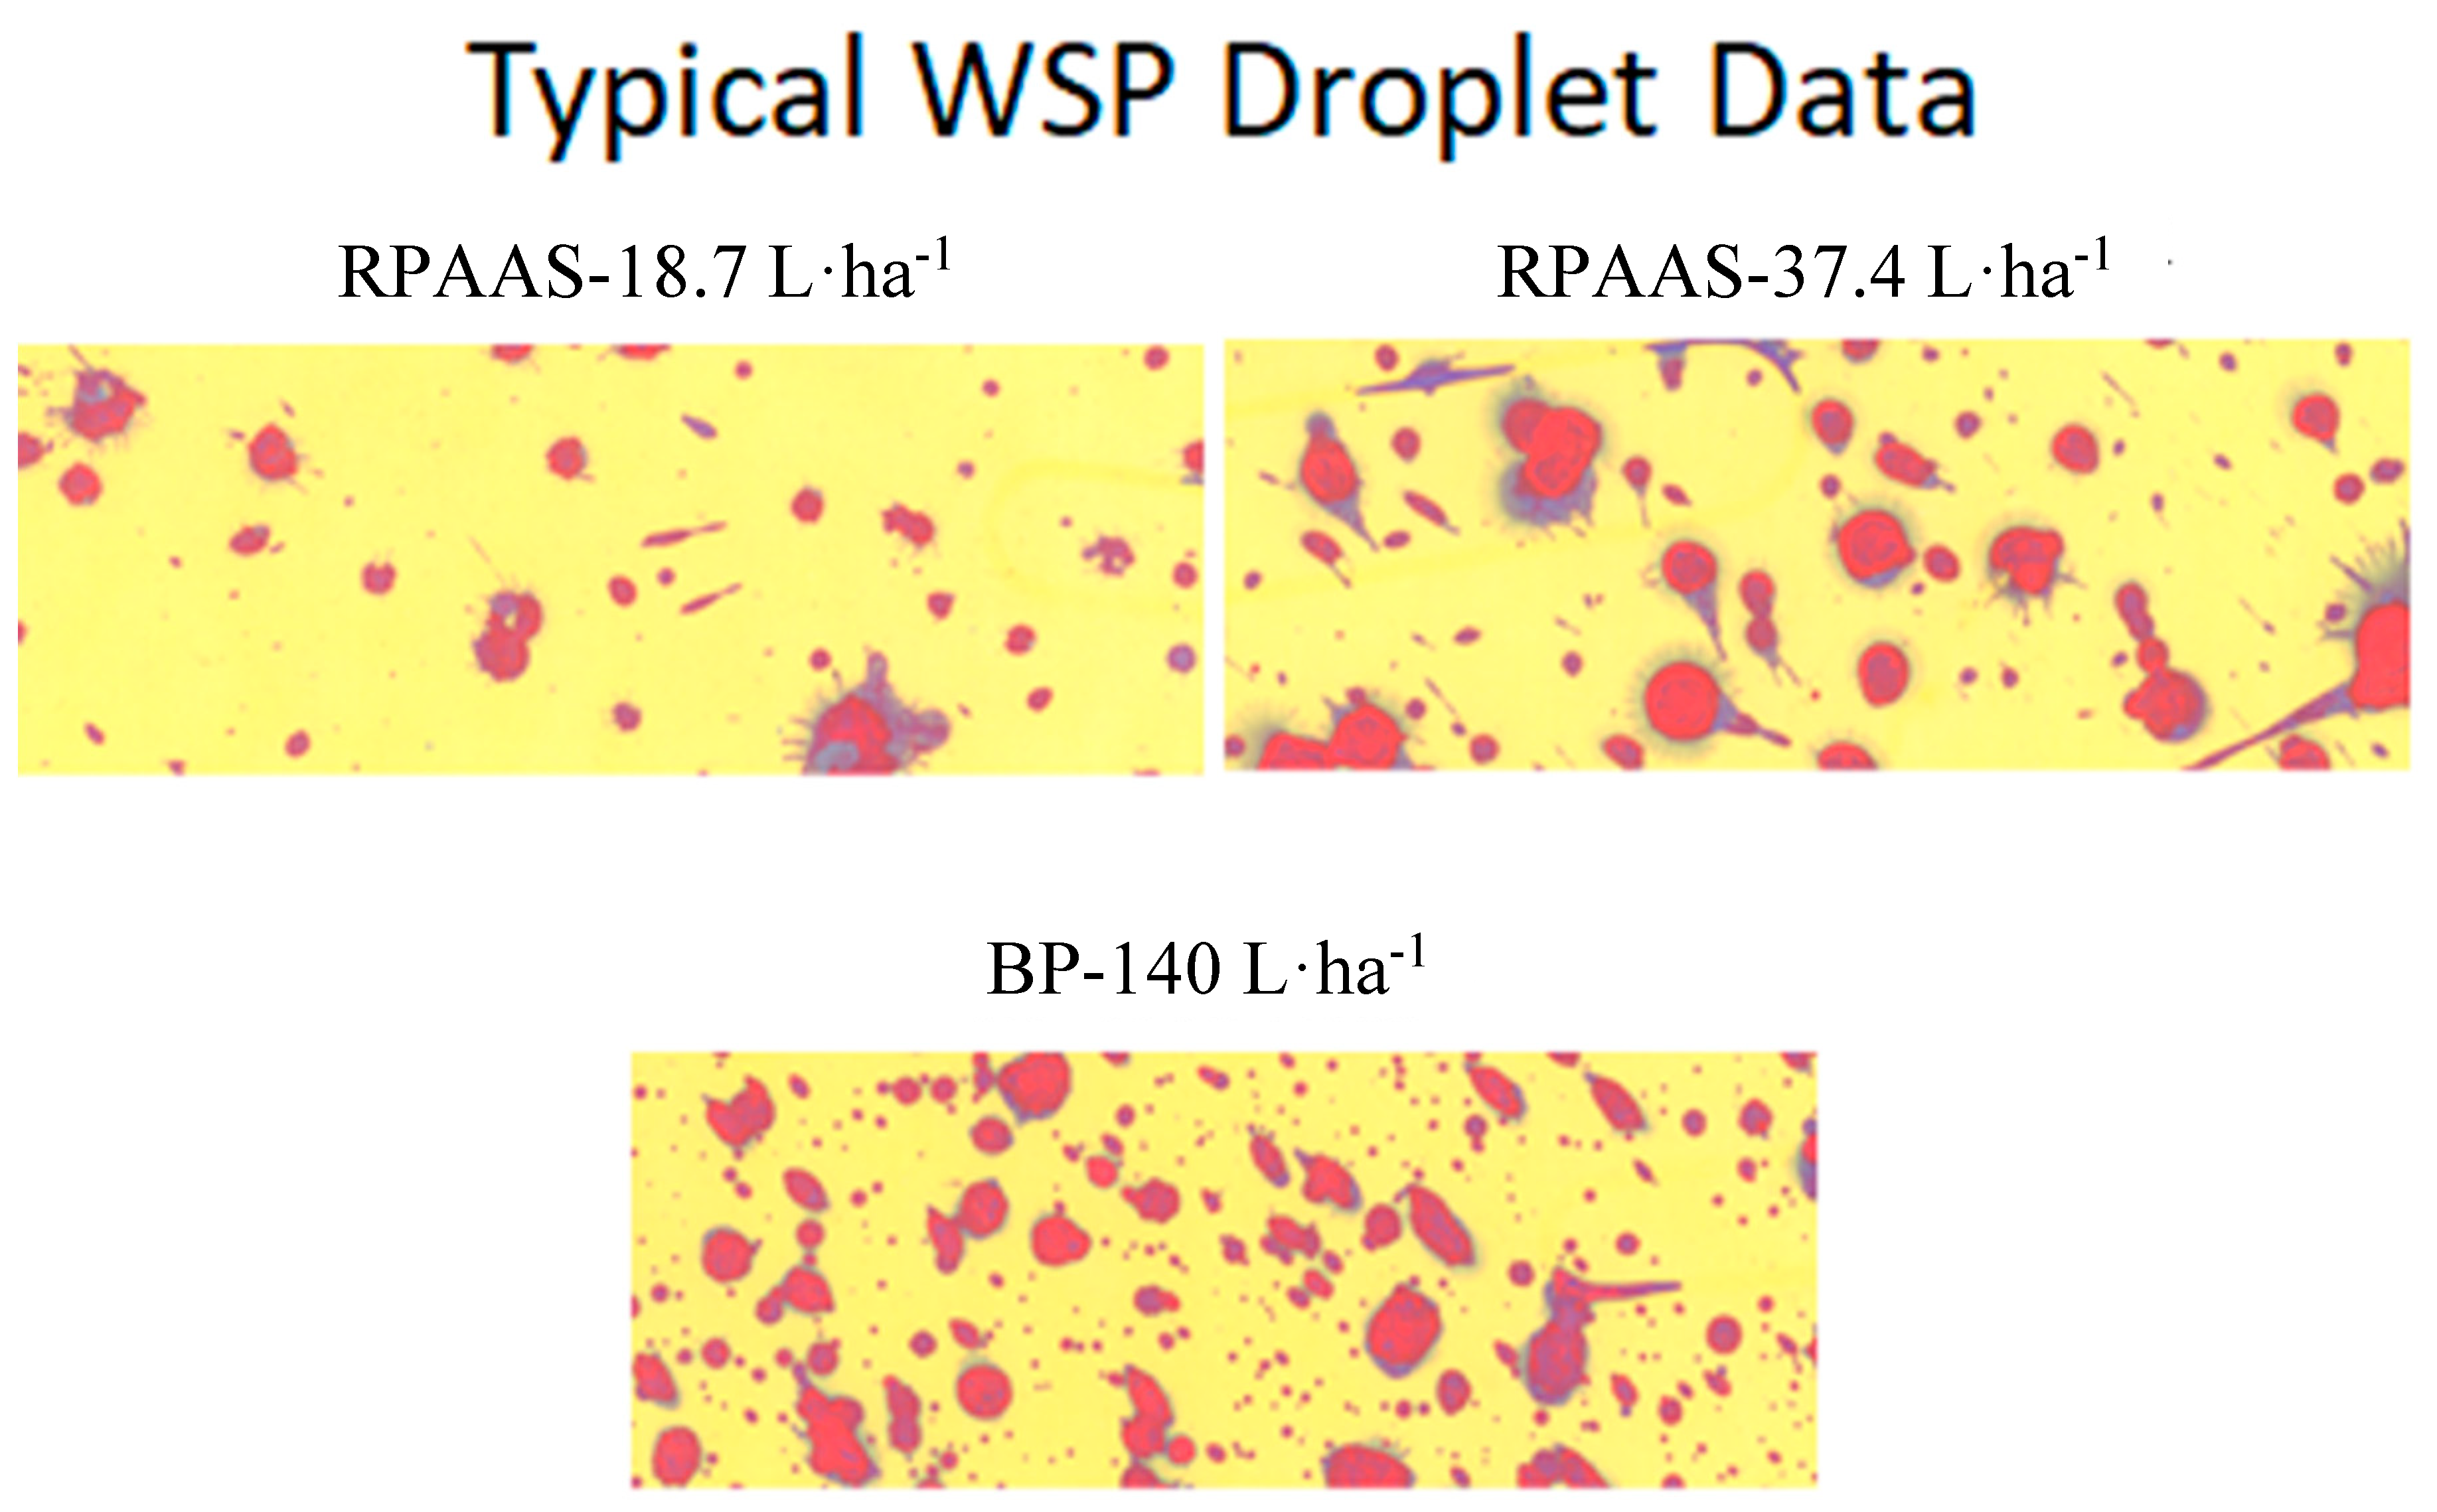
After five minutes of drying time, WSPs were placed inside film negative sleeves. The spray droplets (Figure 5) captured on them were analyzed in the laboratory by the DropletScan™ scanner-based software system [34]. The droplet spectra parameters examined were Dv0.1, Dv0.5, Dv0.9, droplet density (droplets/cm2), percent area coverage and spray efficiency (proportion of spray relative to the target application rate). Dv0.1 is the droplet diameter (µm), where 10% of the spray volume is contained in droplets smaller than this value. Similarly, Dv0.5 and Dv0.9 are droplet diameters, where 50% and 90% of the spray volumes, respectively, are contained in droplets smaller than these values.

2.2. Fluorescent Imaging

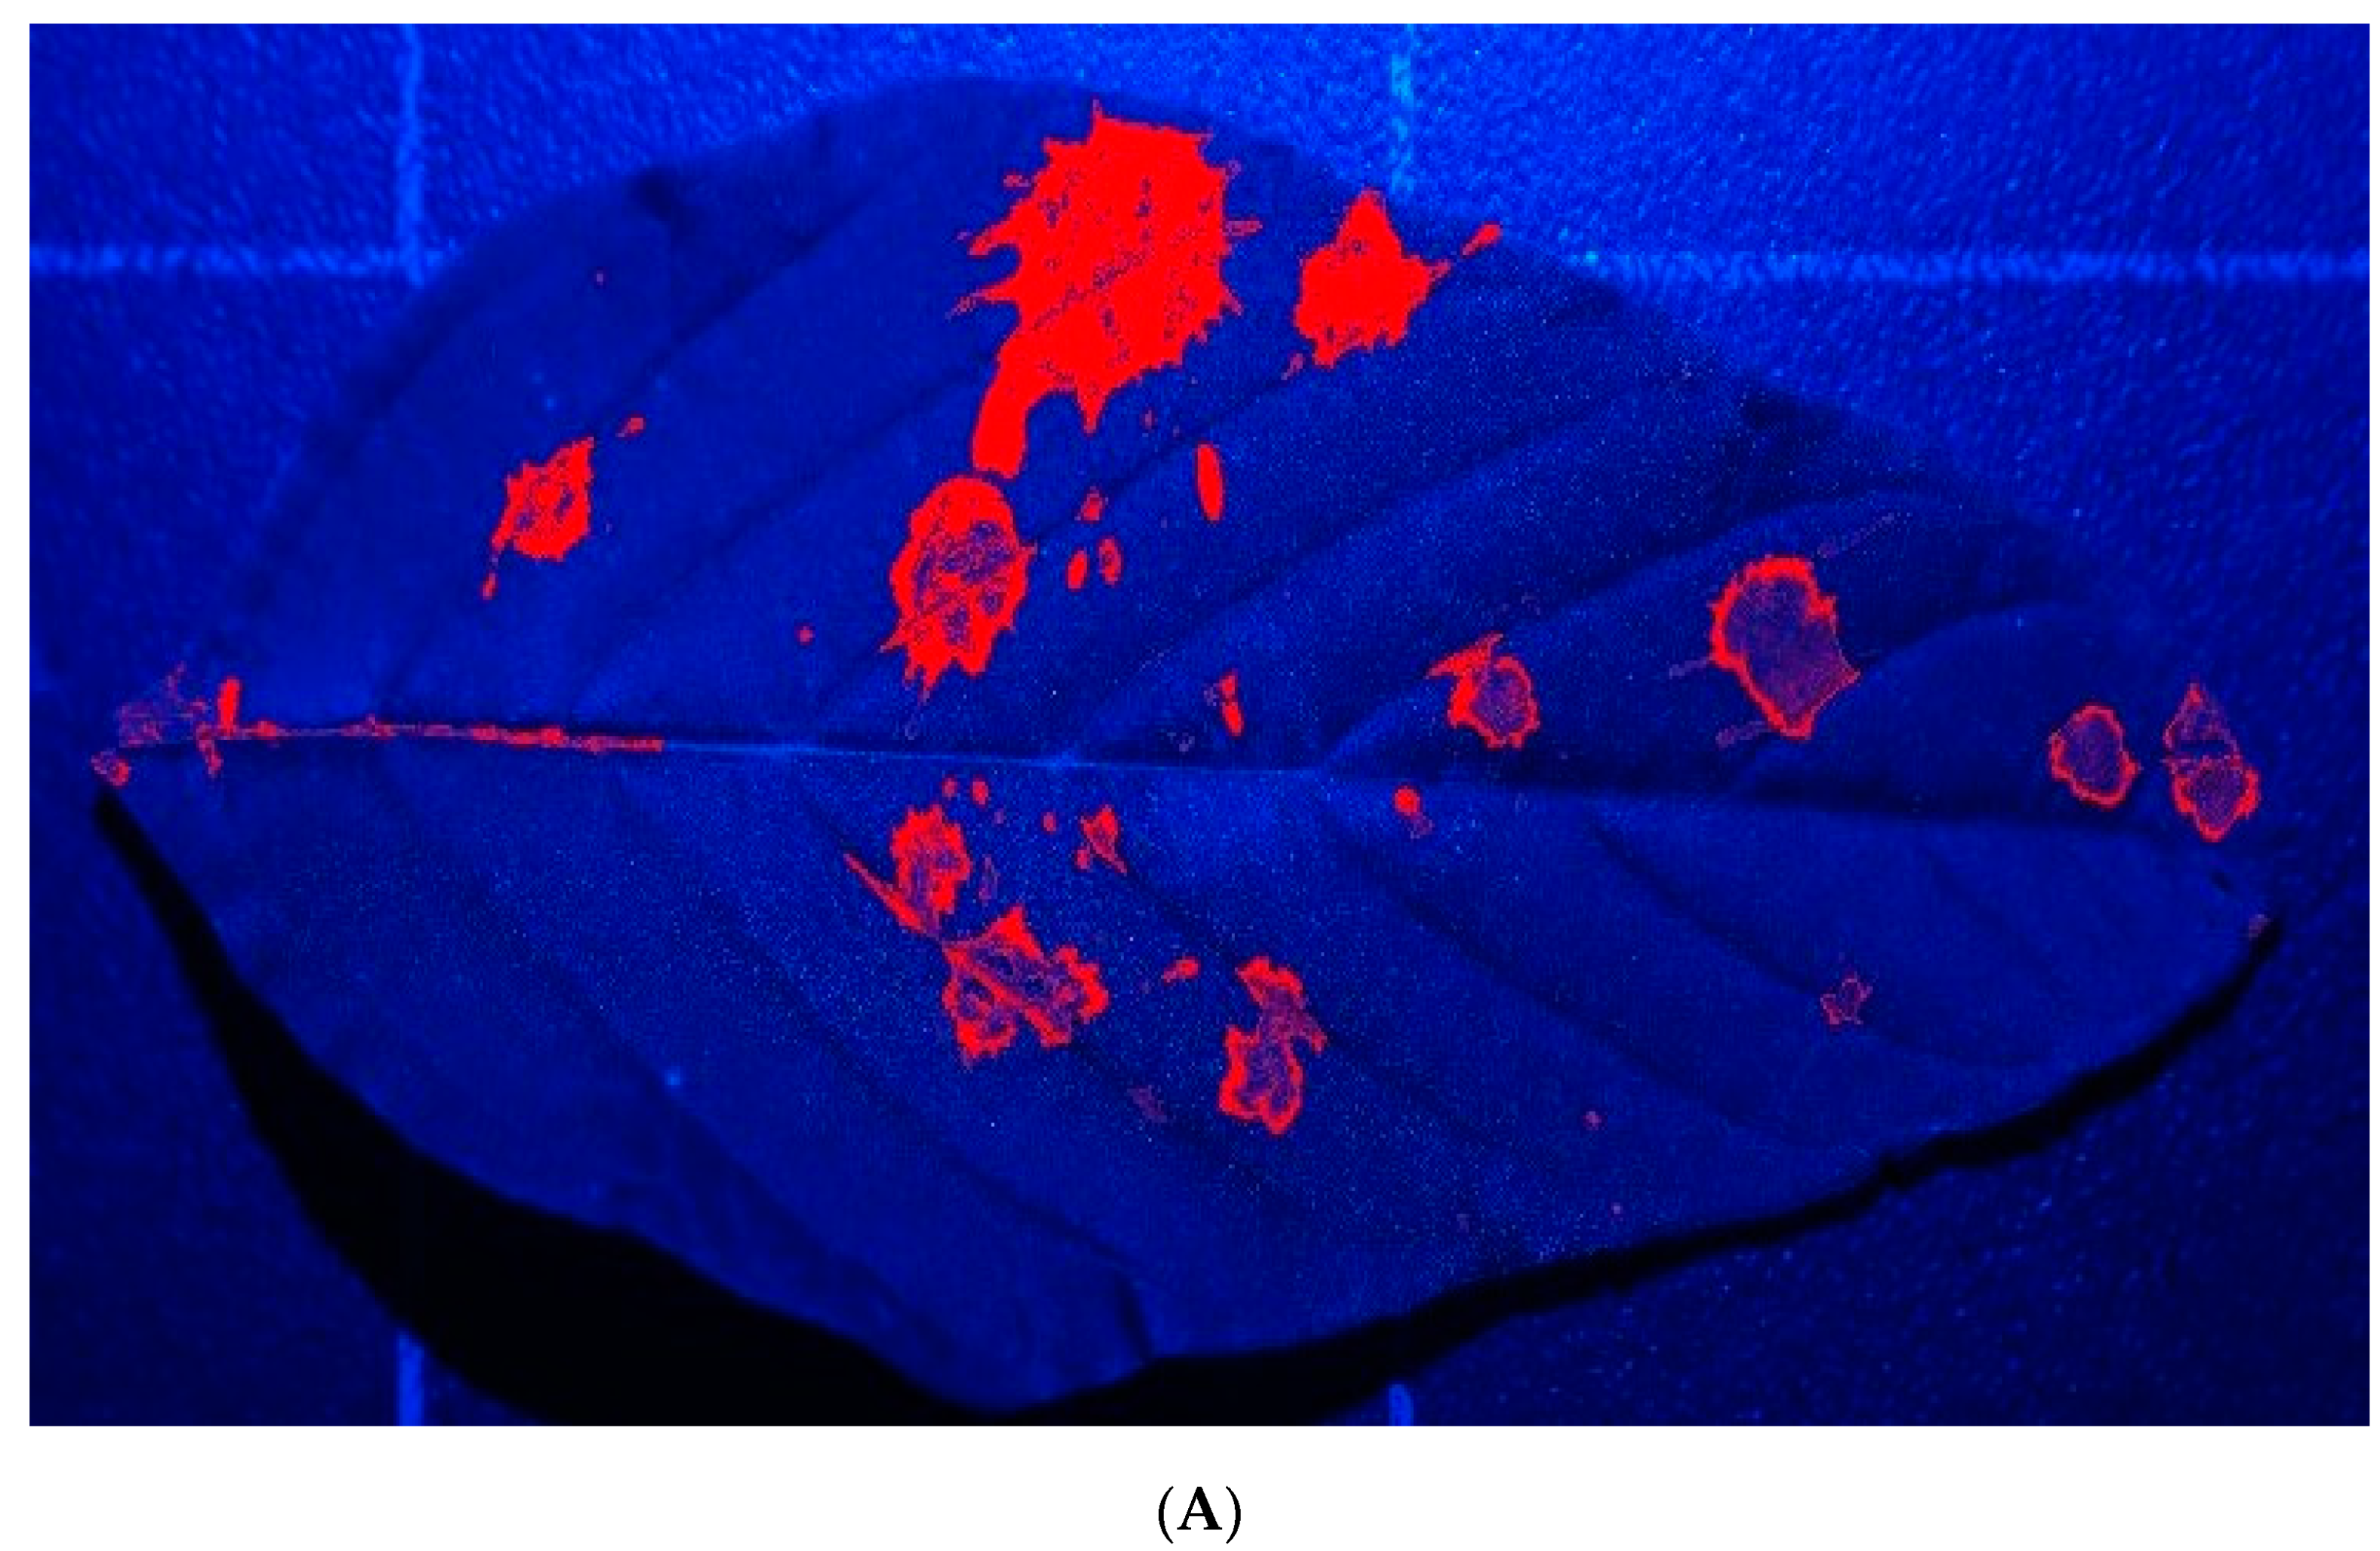
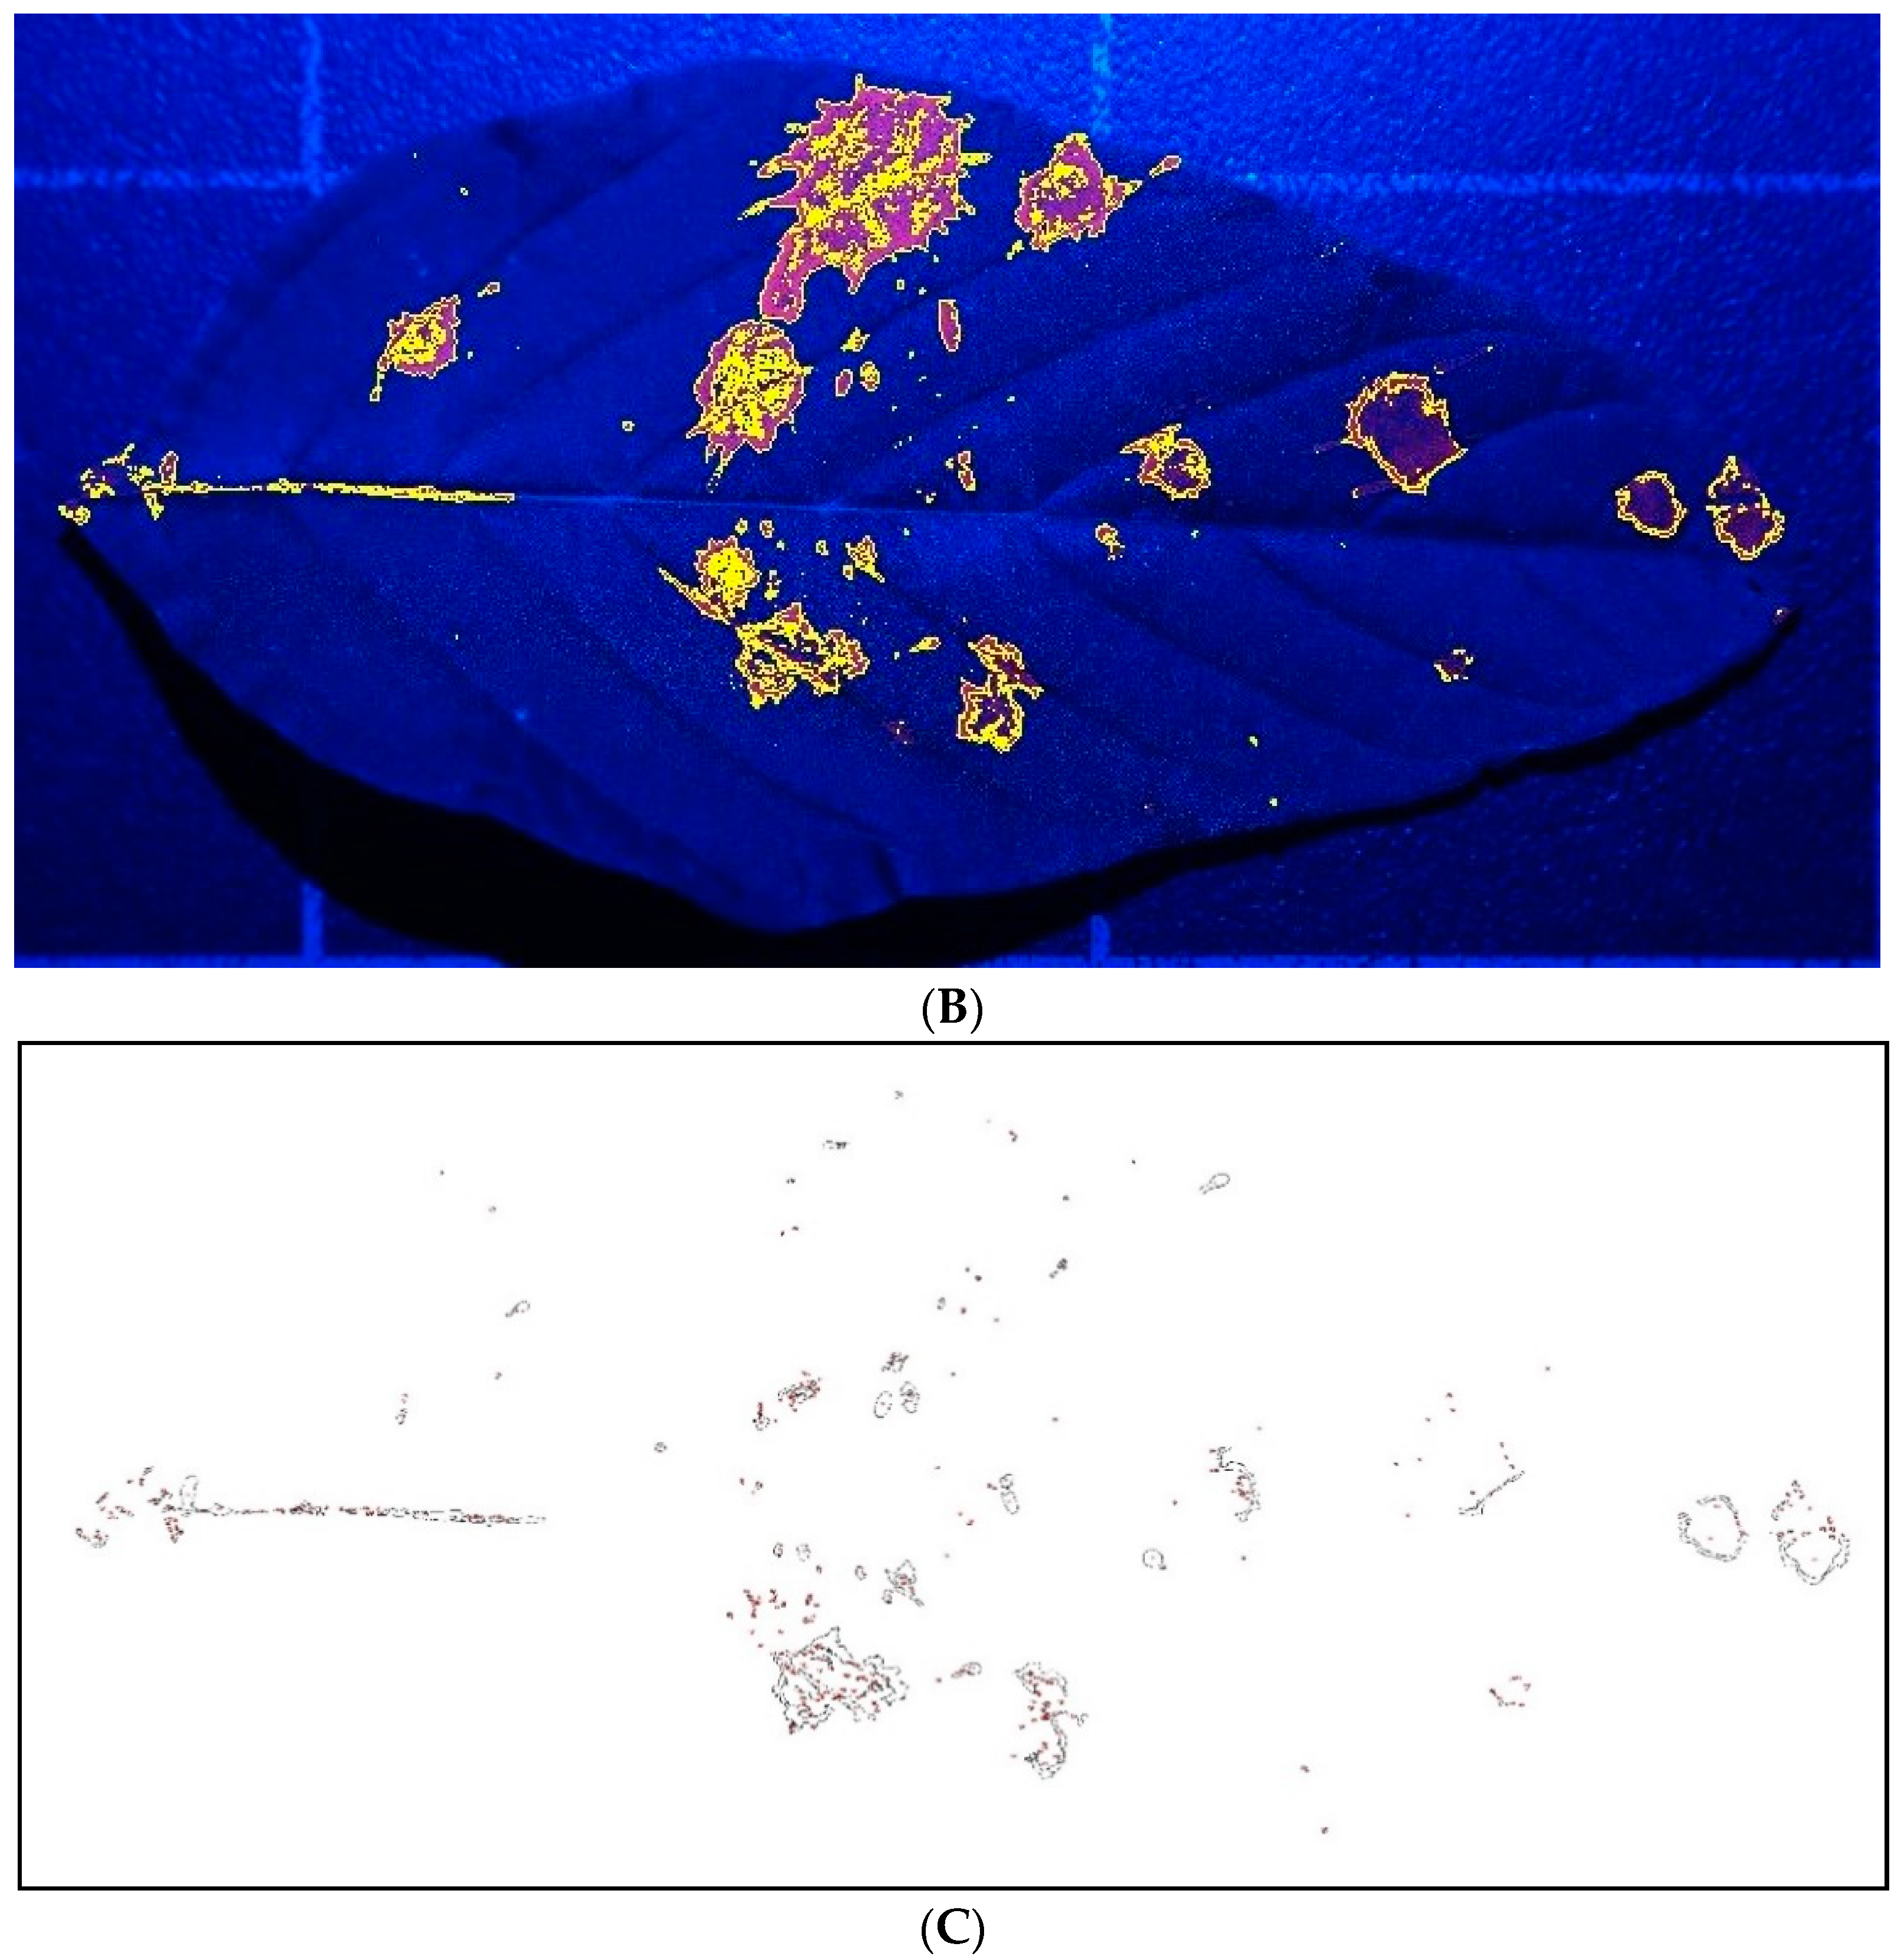
Five leaves of Palmer amaranth and morningglory were collected from each replicated block close to where the wooden boards containing the WSP samplers were placed. A total of 20 leaf samples of each weed species were collected from each treatment for the RPAAS platform. However, four leaves of each species were collected for the BP-15 treatment, with a total of 16 leaf samples per species per treatment. Leaves were imaged in the laboratory using a digital single-lens reflex camera (Model Alpha 7R, Sony Corp., Tokyo, Japan), secured to an adjustable camera stand. The camera was equipped with a macro lens (Close-up + 4 Polaroid) and UV filter (49 mm) to help zoom in and obtain a closer view of the droplets, while maintaining high spatial resolution (ca. 30 µm). Each leaf was placed on an integrated platform at the base of the camera stand where the abaxial and adaxial surfaces of the leaves were imaged. A blue LED light at a wavelength of 470 nm (StellarNet Inc., Tampa, FL, USA) illuminated the droplets during the imaging process. After imaging, the photographs of both the top and bottom leaf surfaces were processed using ImageJ, a public domain, Java-based image processing software. The image processing procedure used in the study was similar to that described earlier by Martin [32]. However, some modifications were made to accommodate the larger droplet spectrum produced by the TT110-015 nozzles used in the study. Lab color space was used to detect the droplets, with the red threshold color chosen to align with the Rocket Red color of the fluorescent dye. In Lab color space, the ‘L’, ‘a’ and ‘b’ minimum and maximum values were set to 55 and 255, 179 and 205, and 52 and 115, respectively. Spray droplet particles were determined by setting the minimum and maximum pixel area size of the droplets between 10 and 4000 pixels. Circularity values were set between 0.00 and 1.0 to include all of the droplets, regardless of shape. The Show: Outlines option displayed the outlines of the individual droplets and the images were saved for the top and the bottom leaf surfaces. Figure 6 illustrates the enhanced (Figure 6A), selected (Figure 6B) and computer drawings (Figure 6C) of the image of spray droplets on the top surface of a Palmer amaranth leaf as an example.
Thus, the fluorescent imaging provided data on the number of droplets found in each sample of leaves collected. Spray droplet density (droplets/cm2) on the adaxial and abaxial surfaces of the weed foliage was calculated using the area of each leaf determined by a leaf area meter (Model 3100, Li-Cor, Lincoln, NE, USA). Because the droplet density data were highly variable, the percentage of spray droplets on the adaxial and abaxial surfaces of the leaves was calculated for each sample collected from the designated locations in each treated block to compare the treatments using a common format.

2.3. Data Analysis

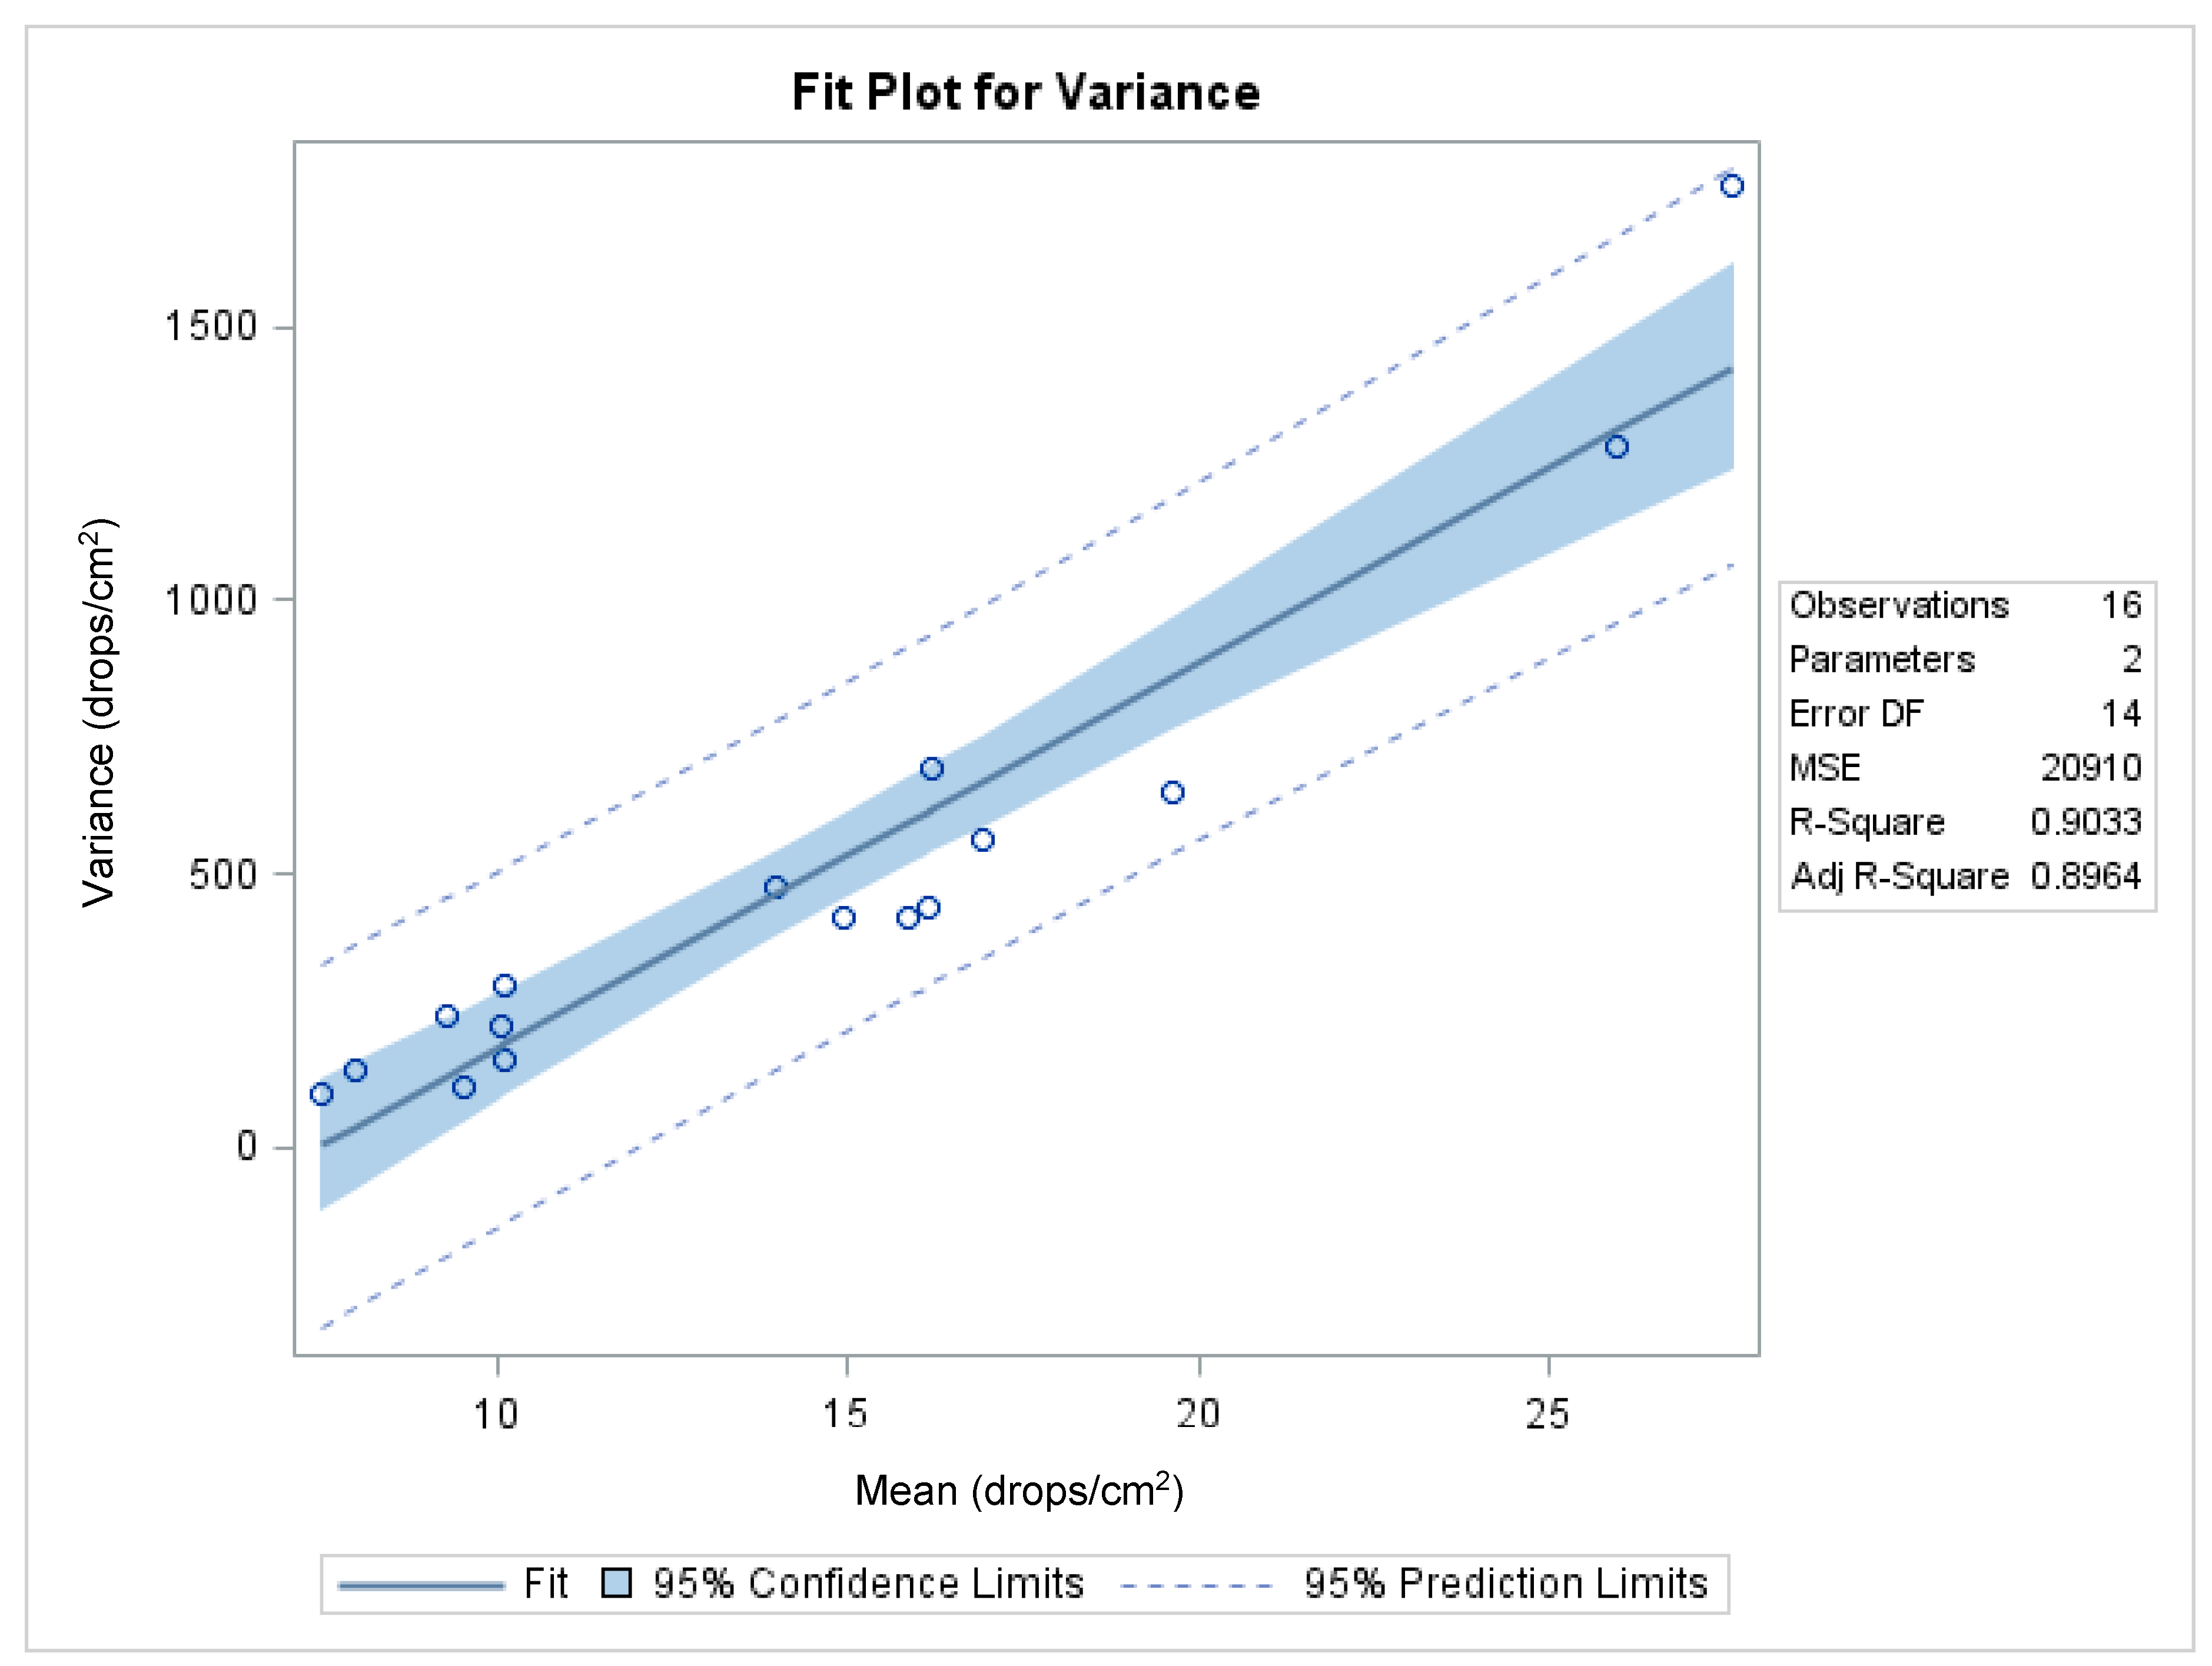
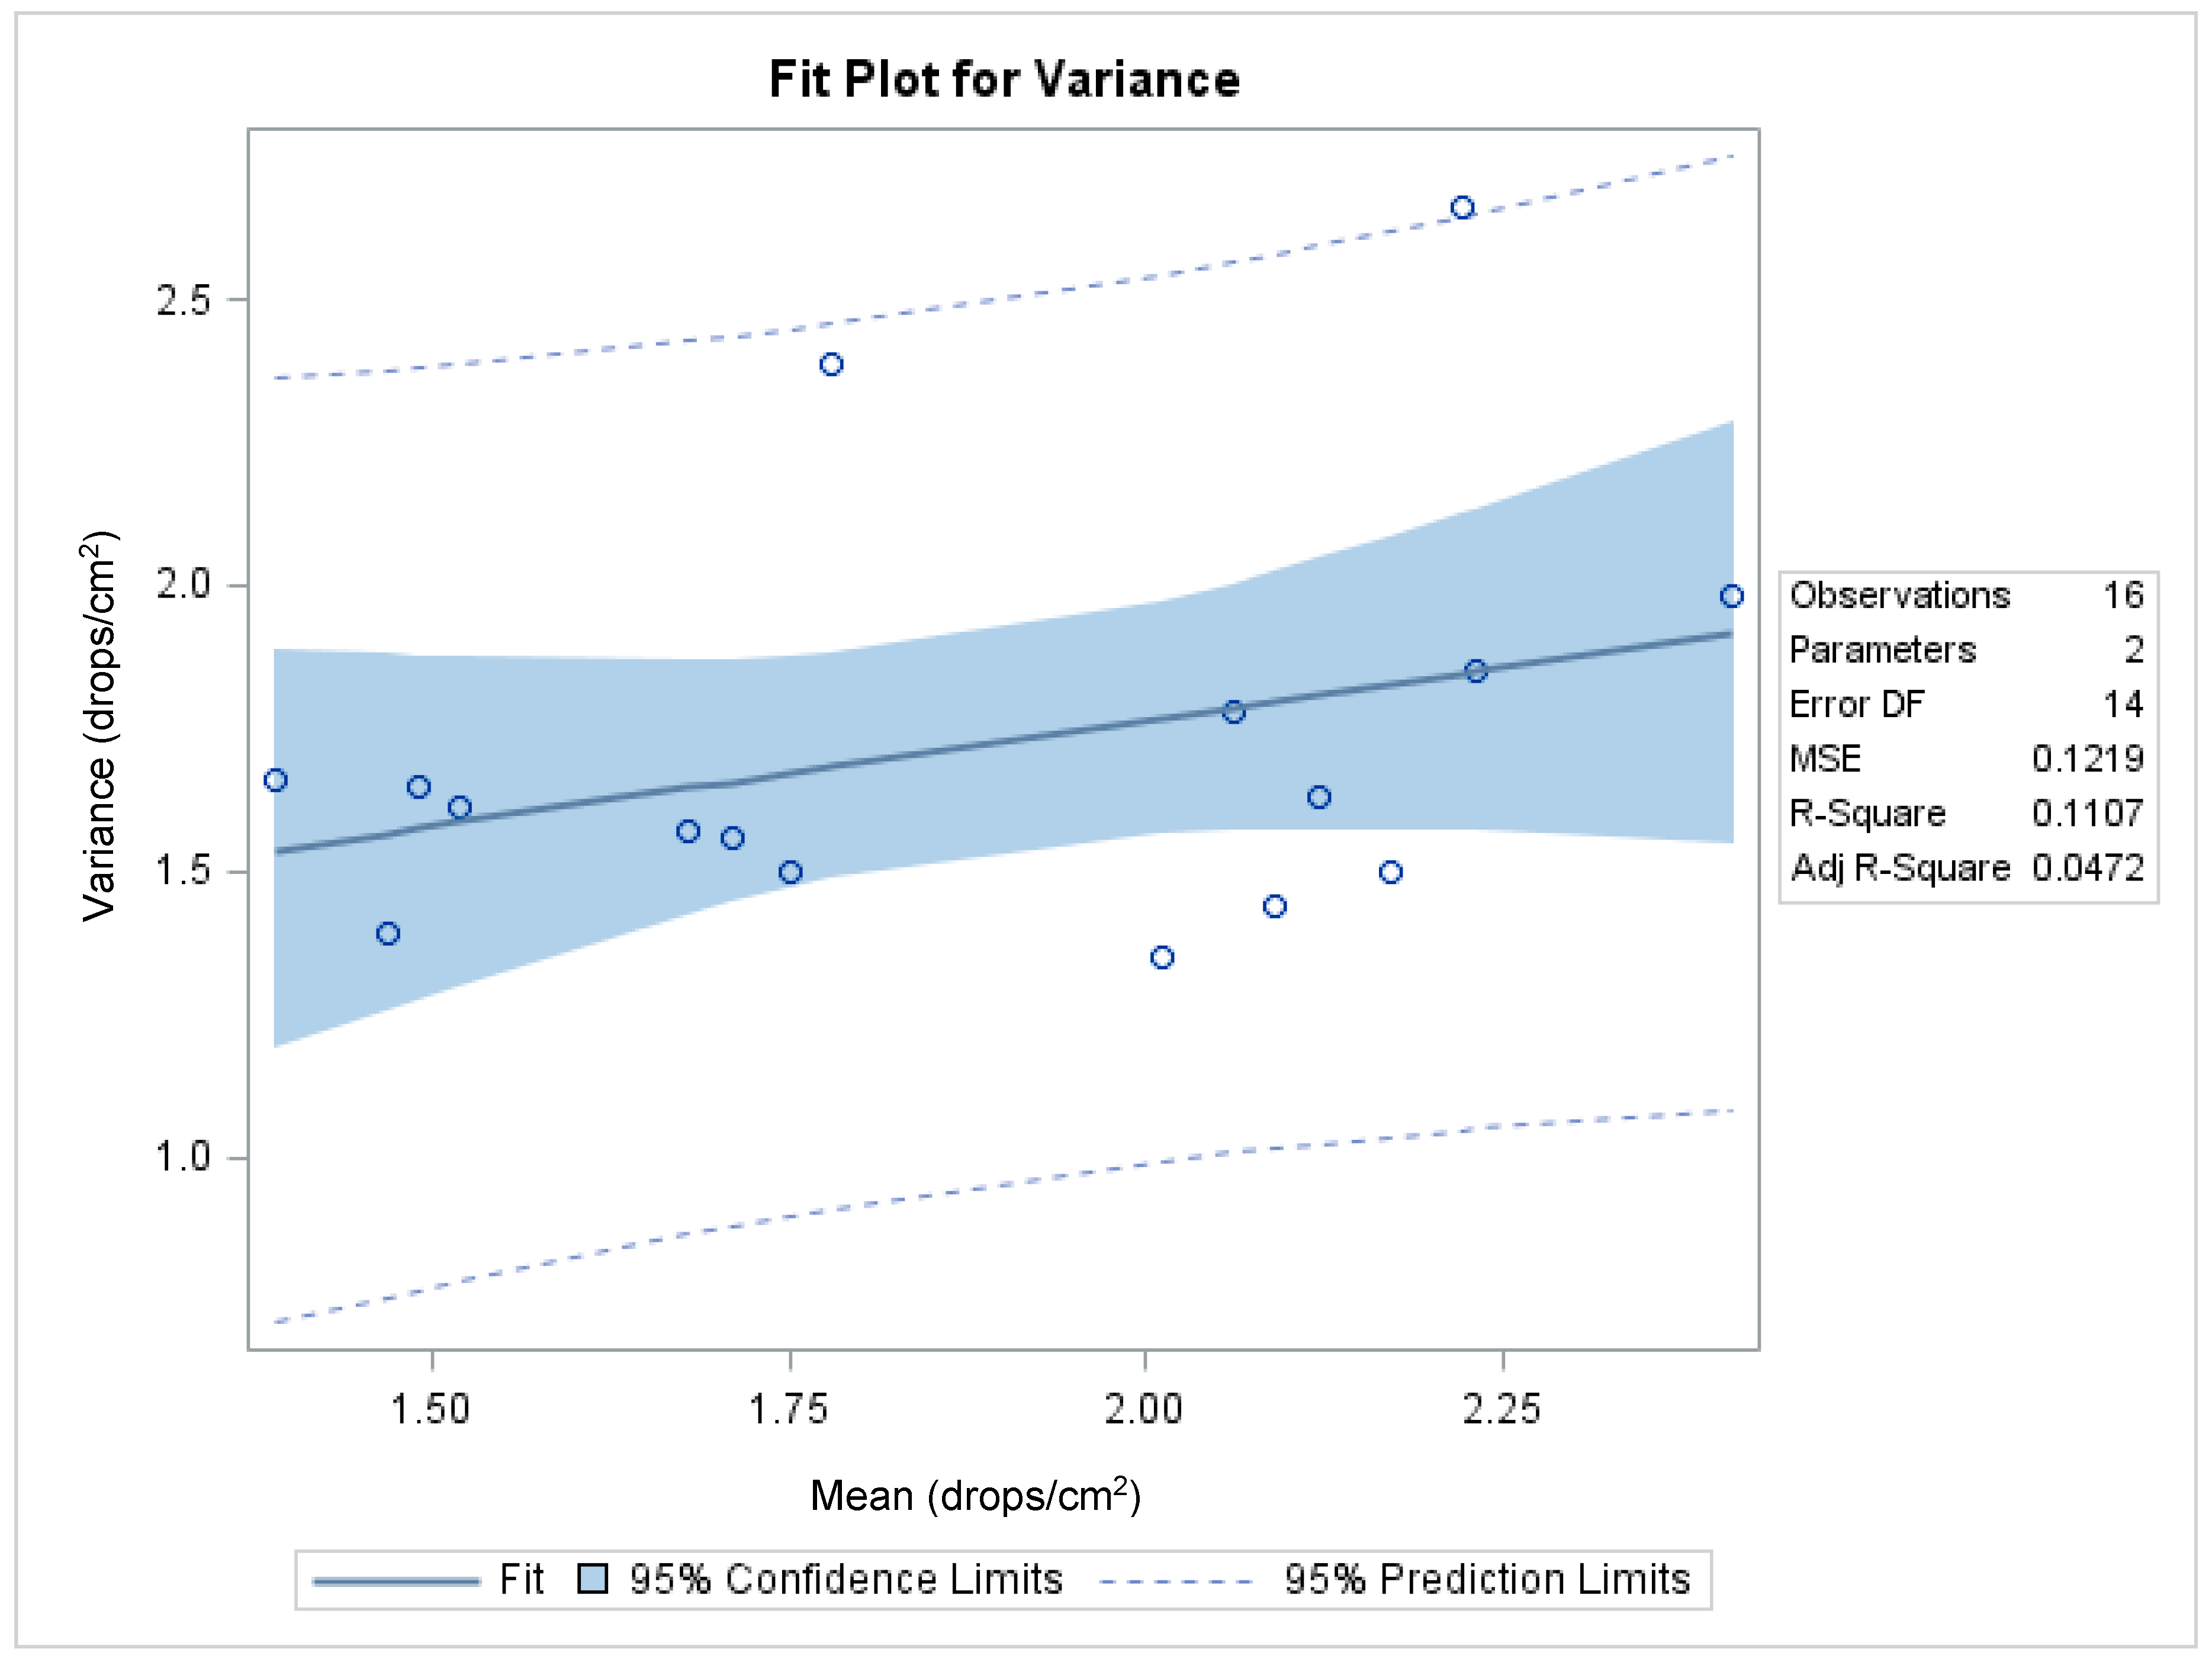
Spray deposits, as a percentage of the target application rate, were highly variable and comprised of values ranging from 0 to 100%. Because of the high variability of the data, they were transformed to arcsine p , where p = original variates in proportions [35]. The spray droplet density of the fluorescent imaging data was transformed to log (x + 1), where x = the original variate. When the mean is positively correlated with the variance, the logarithmic transformation is likely to remedy the situation, and make the variance independent of the mean [36]. Figure 7 shows the functional relationship between the variance and the mean, with an R2 of 0.9033 (p < 0.0001; df = 14) and a highly significant slope coefficient (b = 70.7; t = 11.4; p < 0.0001), which indicates that the data do not meet the assumptions of the analysis of variance. The adequacy of the transformation in stabilizing the variance was achieved following transformation by calculating the correlation coefficient between the two parameters (Figure 8) as suggested by several researchers [36,37,38,39]. The coefficient of determination between the two parameters was 0.11, with a non-significant slope coefficient (b = 0.37; t = 1.32; p > 0.21). The transformed fluorescent droplet density data were used for statistical analysis. All other data were analyzed without transformation. The analysis of variance of the data was conducted using the Proc GLIMMIX procedure (SAS) and least square means were separated using the lines option at p < 0.05 when sample size was equal [40]. The replicated block effects were not significant for any of the data discussed in this study.
3. Results

Meteorological data for each test/replication combination are presented in Table 2. Mean temperature and relative humidity remained relatively constant. Wind speed was variable; however, the angular deviation of the wind from row orientation was well within 40° used for studies designed to mitigate spray drift [41]. Moreover, each test plot was separated by 5 m from each other as shown in Figure 1 to mitigate the effect of cross winds that can move spray deposits between plots.

3.1. Spray Droplet Spectra on WSPs

The spray droplet characteristics revealed from the WSP samplers (Dv0.1 and Dv0.5) were not significantly different between treatments in Study 1 (Table 3). However, the Dv0.9 of the deposits was higher for the backpack sprayer than those for the RPAAS aircraft, as would be expected since the backpack sprayer was operated at a lower pressure. The spray droplet spectra (Dv0.1, Dv0.5 and Dv0.9) were not significantly different between treatments in Study 2, likely due to the small sample size collected. Numerically, the backpack sprayer again yielded a larger droplet spectrum. The spray droplet density (drops/cm2) and % area coverage were higher for the high-volume treatment (140 L·ha−1) applied with the backpack sprayer than those for the low-volume treatments (18.7 and 37.4 L·ha−1) applied with the RPAAS platform in both Study 1 and Study 2 (Table 3 and Table 4).
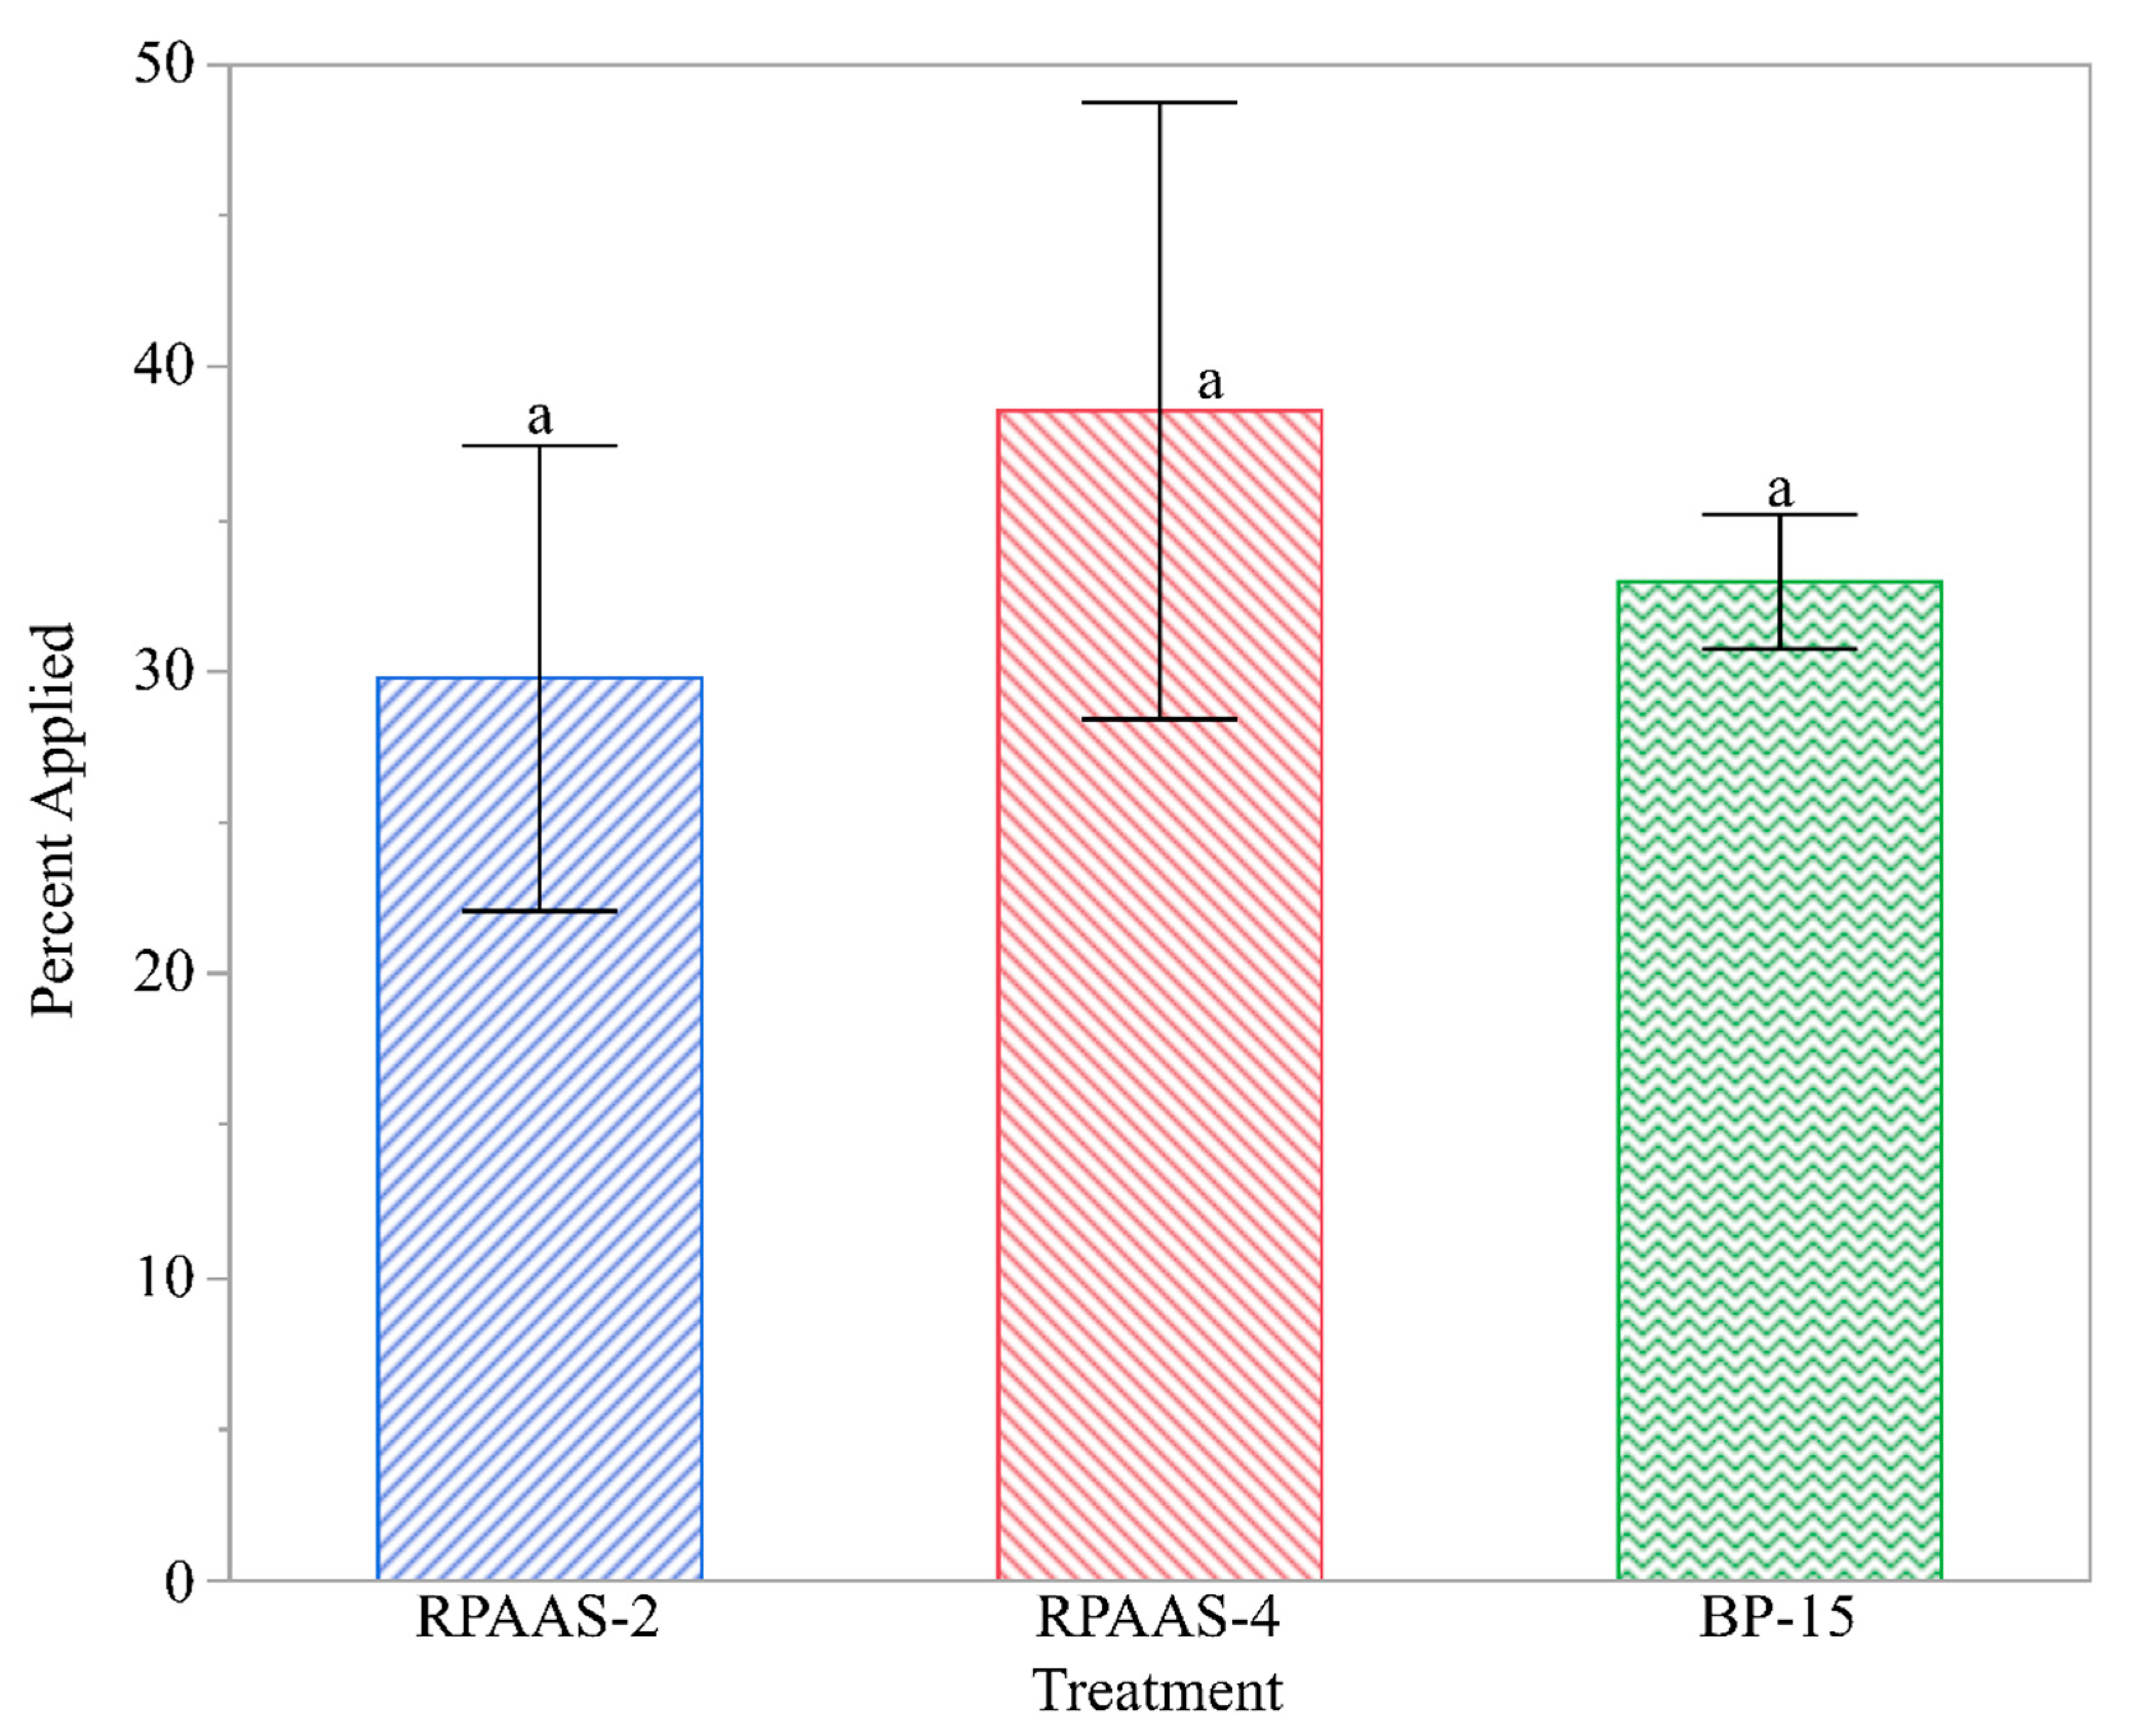
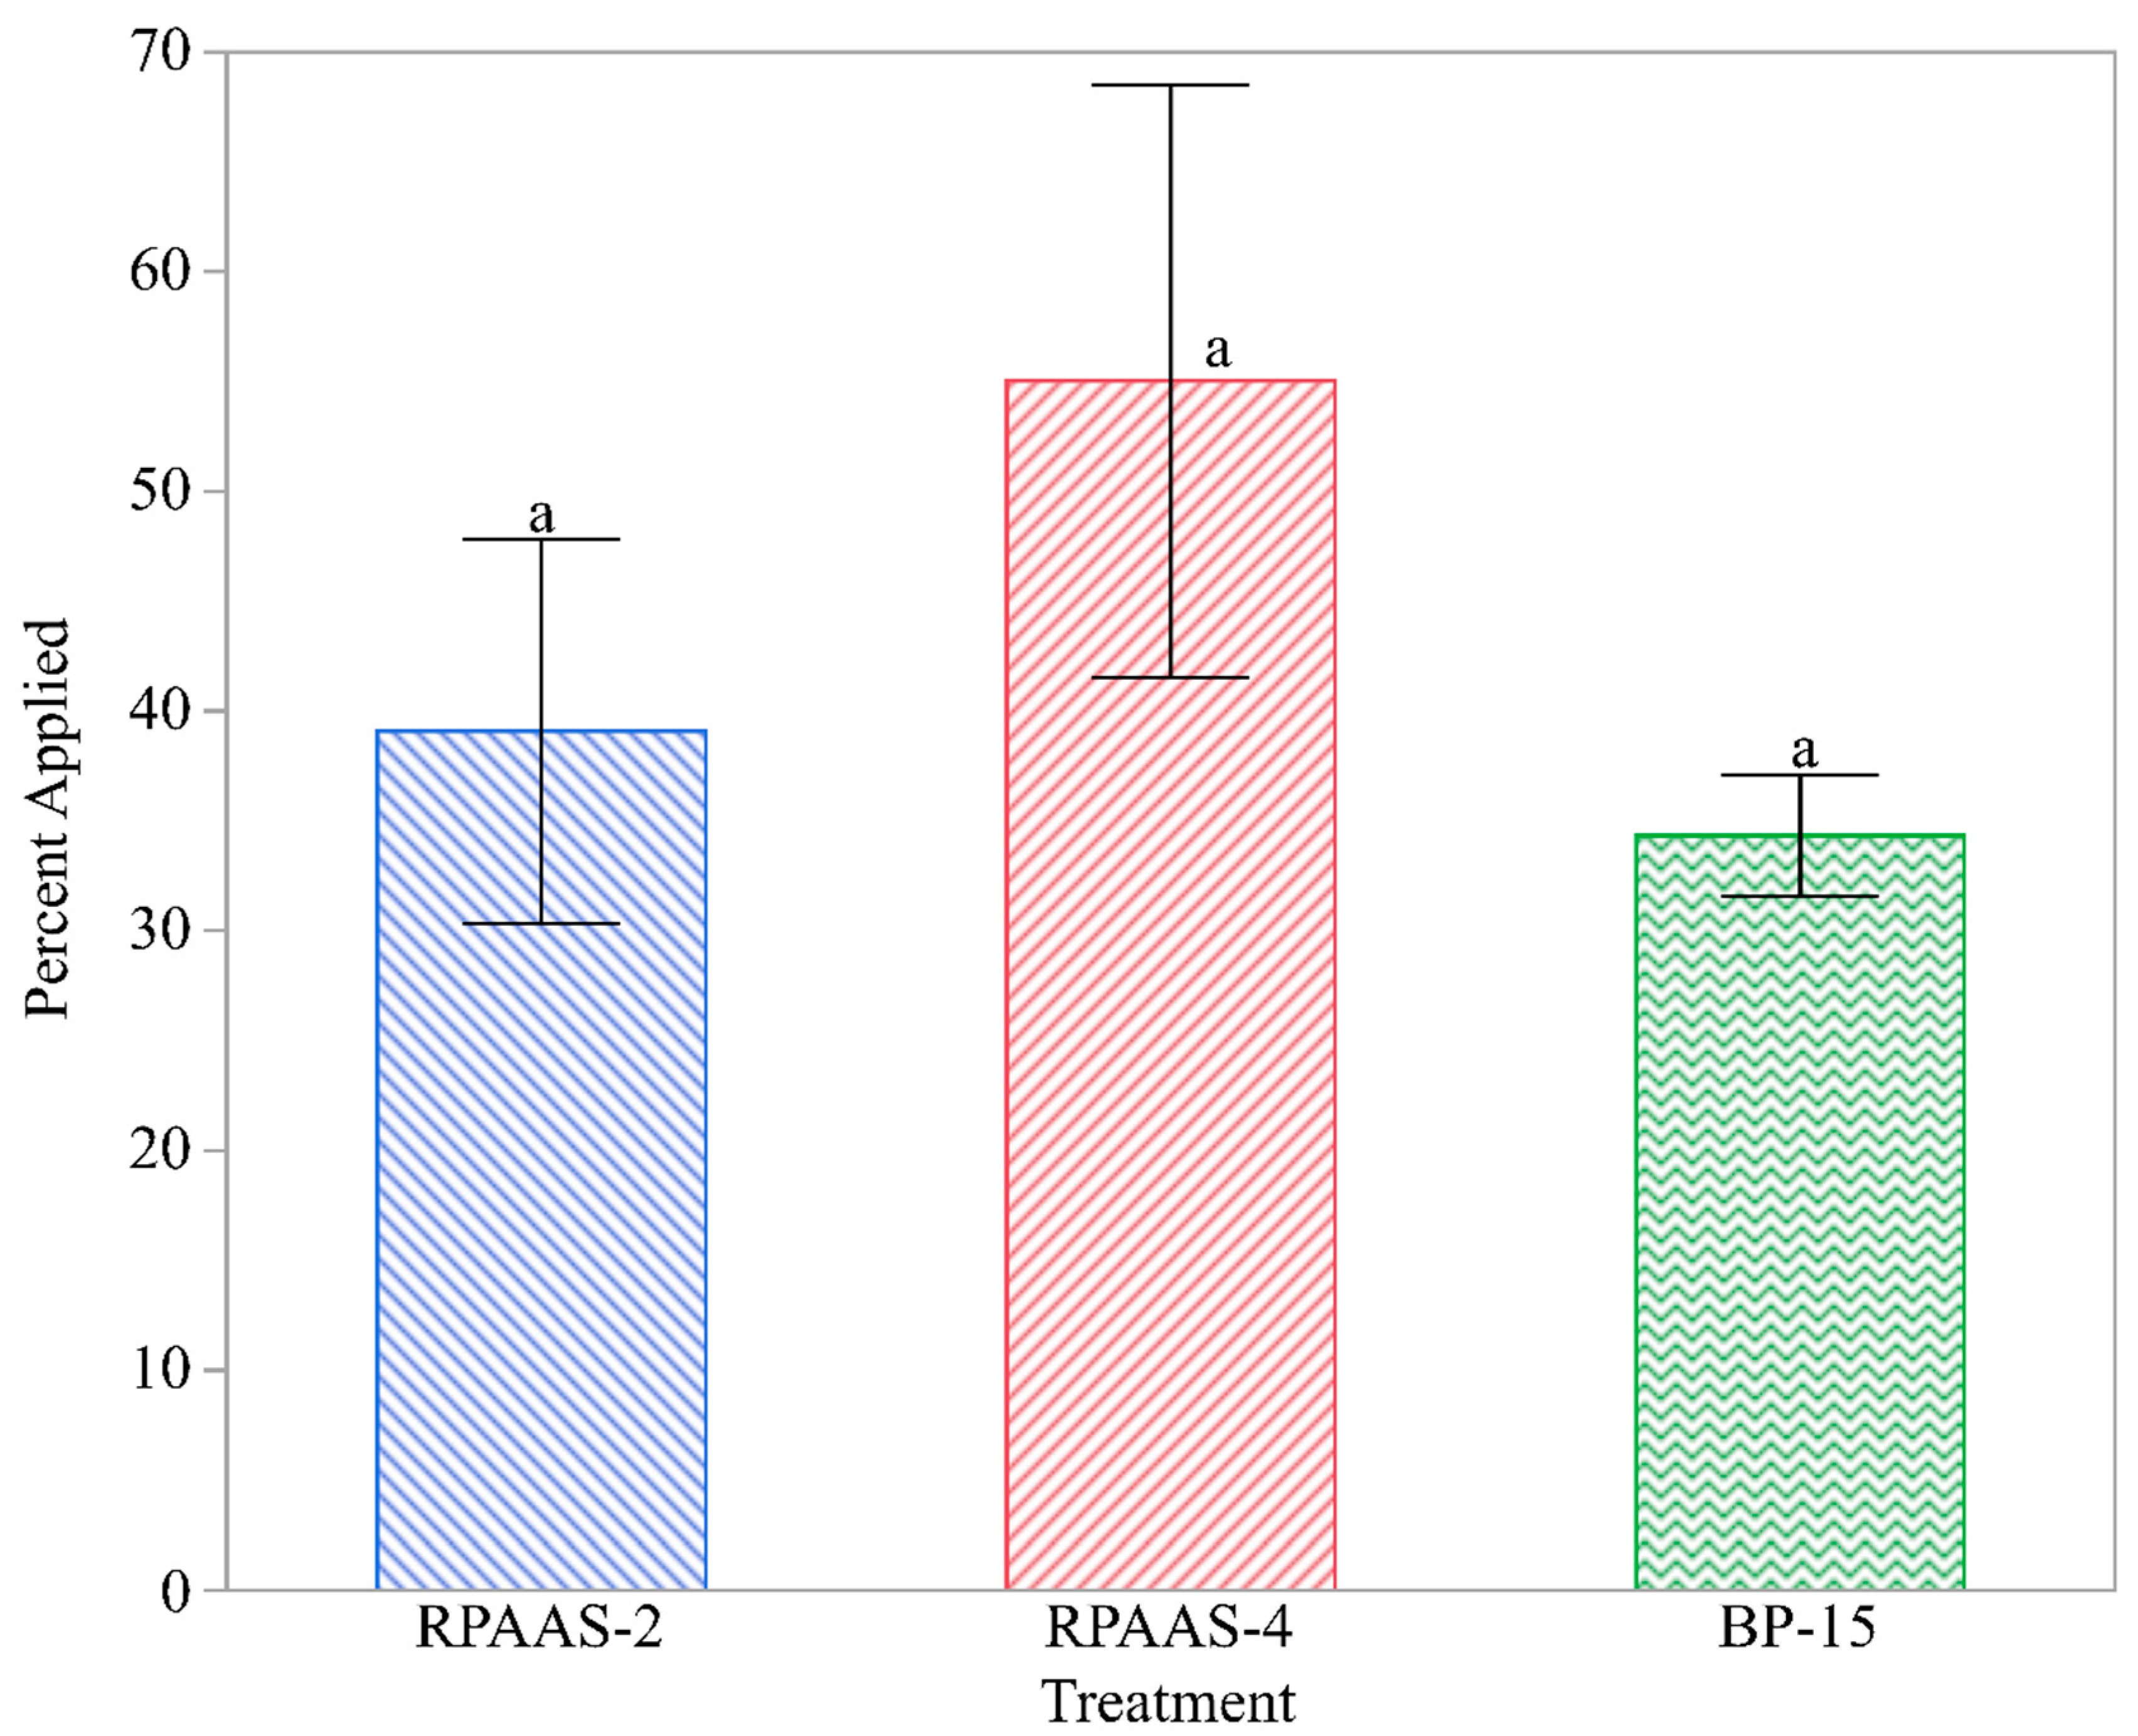
The spray application efficiency, which is the percent of spray deposits collected on artificial samplers relative to the theoretical application rate, in Study 1 and Study 2 is shown in Figure 9 and Figure 10, respectively. The spray application efficiency for each treatment was the same for Study 1 (F = 1.94; p > 0.15; df = 2,49) as it was for Study 2 (F = 0.73; p > 0.48; df = 2,53).

3.2. Fluorescent Droplets on Weed Leaves

Droplet density, determined by fluorescent imaging on adaxial and abaxial surfaces of Palmer amaranth and ivyleaf morningglory leaves for the RPAAS platforms and the backpack sprayer in Studies 1 and 2, are shown in Table 5 and Table 6, respectively. Transformed means are presented in original scale to maintain clarity. Droplet density varied between treatments and leaf surfaces for both Palmer amaranth and morningglory in Studies 1 and 2. Interactions between the treatments and the leaf surfaces were observed for both studies and for both weed species. Droplet density on the adaxial leaf surfaces of Palmer amaranth and morningglory leaves was higher for the BP-15 treatment than those for the RPAAS platforms in Studies 1 and 2. The abaxial leaf surfaces of both weed species had greater droplet density with RPAAS-4 compared to RPAAS-2 treatment and that the RPAAS-4 treatment resulted in greater droplet density on the abaxial leaf surfaces of morningglory than the BP-15 treatment. Droplet density test results for Study 2 were similar to Study 1 (Table 6).
Table 7 and Table 8 describe the percent of spray droplets deposited in the adaxial and abaxial leaf surfaces of weed foliage in Study 1 and Study 2, respectively. In Study 1, the proportion of spray droplets on Palmer amaranth was significantly higher on the abaxial leaf surface when the spray rate was 37.4 L·ha−1 (20.76%) than when the spray rate was 18.7 L·ha−1 (9.30%) for the RPAAS platform. Likewise, the proportion of spray droplets on morningglory was significantly higher on the abaxial leaf surface when the spray rate was 37.4 L·ha−1 (30.25%) than when the spray rate was 18.7 L·ha−1 (9.50%). In Study 2, similar results were evident. The proportion of spray droplets on the abaxial leaf surface for the Palmer amaranth was 20.93% vs. 6.28%, while that for the morningglory was 27.54% vs. 12.47% for the 37.4 and 18.7 L·ha−1 spray rates, respectively. The BP-15 treatment resulted in deposition of only 6% of the total droplets on abaxial surface (average of both weeds) in both studies. The RPAAS-4 treatment in both studies deposited approximately 25% of the total droplets on abaxial surface (average of both weeds), which was four times than that of BP-15 treatment (Table 7 and Table 8).

4. Discussion

4.1. Spray Droplet Spectra

The percent of applied spray on WSPs did not significantly differ among treatments in either of the two studies. The total percent spray deposits on WSP samplers (mean ± SEM) were 31.7 ± 5.3, 40.3 ± 8.1 and 33.0 ± 2.3 for RPAAS-2, RPAAS-4, and the backpack treatments, respectively, in Study 1. The total spray deposits (mean ± SEM) were 42.4 ± 8.9, 59.8 ± 12.2 and 36.7 ± 9.1 for RPAAS-2, RPAAS-4, and the backpack treatments, respectively, in Study 2. Although these values were numerically different, statistical differences between treatments were not realized likely due to small sample size. However, test results indicate that although all of the spray application systems were equally effective in the delivery of spray deposits as sampled on artificial collectors, none of the systems were able to produce 100% of the targeted spray rates.
Our data agree with Wang et al. [42], who reported that the amount of imidacloprid (µg/cm2) deposited on wheat did not vary between an RPAAS and a conventional backpack sprayer. In another study on wheat, Wang et al. found that with higher spray volume (>18.8 L·ha−1) and with coarser nozzles, deposition of tebuconazole fungicide with a spray drone was similar to that of a conventional backpack sprayer, but the deposition was depressed at the lower spray application rate (<9.0 L·h−1) with fine nozzles. Hill and Inaba [43] studied the deposition of deltamethrin and permethrin formulations on WSP samplers and found a significant linear relationship between µg of the chemicals/WSP and spray droplets per cm2 with similar size droplet spectra. This indicates that droplet density from non-active spray applications should be a good indicator of active formulation spray deposits. Test results reported by Hill and Inaba and Wen et al. [44] indicate that the spray quality assessments with WSPs are reliable when using conventional hydraulic spray nozzles.
Despite the difference in operational parameters between the RPAAS platforms and the backpack sprayer, no significant difference in Dv0.5 between the RPAAS and the backpack treatments were observed. The operational parameters used in this study were closer to those used by Qin et al. [45], who reported testing a UAV flown at 3.5 m height and 4 m/s ground speed with a fungicide over a wheat canopy and compared that to a backpack sprayer operated at 0.5 m height and 0.8 to 1.0 m s−1 ground speed. Although the spray volume (140 L·ha−1) applied with the backpack sprayer was 3.7 to 7.5 times greater than those of the RPAAS treatments, droplet size was not affected by the carrier volume. In a laboratory study, Creech et al. [26] evaluated the effects of nozzle type, orifice size, herbicide active ingredients, pressure, and carrier volume on the droplet spectra of the spray, and found that when averaged across all the experimental variables, the herbicide carrier volume had the least effect on Dv0.5 spray droplets. When the carrier volume increased from 47 to 187 L·ha−1, Dv0.5 increased only by 5%, indicating that the droplet size of the herbicides tested was not highly dependent on spray volume. Even though the 37.6 L·ha−1 application rate was achieved by making two passes over the research plots, there is no expectation that this should change the resulting droplet spectrum.

4.2. Fluorescent Droplets on Weed Leaves

Data reported herein indicate that the backpack sprayer with a 140 L·ha−1 spray volume produced only 6% of the total number of applied spray droplets on the abaxial surface, while the RPAAS aircraft with a 37.4 L·ha−1 spray volume produced a 4-fold increase in the number of spray droplets on the abaxial surface. Thus, it is likely that this would help improve the efficacy of contact herbicides against weed foliage, because it increases the probability of a spray droplet occupying an active site on the under surface of the leaf. These data suggest that leaf fluttering caused by rotor downwash likely caused this increased spray deposition on the abaxial surfaces of Palmer amaranth and morningglory leaves.
The results reported here corroborate research data which indicate that downwash and wind turbulence created by rotor blades of RPAAS aircraft assist in droplet deposition and canopy penetration [46,47,48,49,50,51,52]. For instance, Qing et al. [48] studied the movement of spray plumes in the laboratory at different rotor speeds, using an 8-rotor RPAAS and found that the spray angle of the nozzles was reduced with an increase in the speed of the downwash flow and spray droplets tended to move towards the direction of the rotors. The reduction in nozzle spray angle is known to be highly correlated with an increase in air velocity past a nozzle. Songchao et al. [53] used a single rotor unmanned helicopter to study downwash distribution using a computational fluid dynamics model and found that the downwash covered an area equivalent to the rotor radius of 3.0 m in size with a boundary velocity of 0.5 m·s−1. This appears to indicate that the downwash effect extends beyond the immediate vicinity of the aircraft. Yang et al. [54] reported that the downwash airflow of the RPAAS rotor caused a pressure differential between the upper and lower surfaces of the leaf producing a torque and thus enabling the spray droplets to penetrate as much as 4-fold to the bottom surface of the leaf.

5. Conclusions

The spray application efficiency described as the percent of spray deposits collected on an artificial sampler for the RPAAS systems at the 18.7 and 37.4 L·ha−1 spray rates was comparable to that for the backpack sprayer at a 140.0 L·ha−1 spray rate. The spray droplets, Dv0.5, deposited on an artificial collector were statistically similar for both backpack and RPAAS treatments, although these spray platforms were operated at different heights and ground speeds. Test results suggest that if the nozzles were kept similar for the remotely piloted aerial and the conventional ground spray application systems, operational protocols (application height and ground speed) may not significantly influence the spray droplet spectra characteristics. Higher-volume treatment (140 L·ha−1) applied with the backpack sprayer resulted in greater fluorescent droplet density on the adaxial leaf surface compared to the lower-volume RPAAS treatments. However, the highest spray rate RPAAS platform (37.4 L·ha−1) resulted in the deposition of the largest proportion of droplets on the abaxial surface of weed foliage, relative to the total number of depositing droplets. This suggests that the rotor downwash and wind turbulence created by the RPAAS aircraft when operated at a ground speed of 4.0 m·s−1 to achieve 37.4 L·ha−1 spray application rate likely helped flip leaves over and enabled spray deposition onto the lower surface of weed canopy. It is important to note that the spray application rate (37.4 L·ha−1) was achieved by flying the aircraft twice over the test plots at 4 m·s−1 and this could have likely helped to increase spray deposition on the abaxial surfaces of weed leaves. However, if the 37.4 L·ha−1 spray application rate was achieved with a single pass of the aircraft, it would have required a 2 m s−1 ground speed, and the slower ground speed would have increased the residence time of the aircraft over the weed canopy, thus increasing the downwash effect of the rotors. Whether or not a single pass of the aircraft with a delivery volume at 37.4 L·ha−1 would similarly increase under-leaf surface deposition remains conjectural and should be investigated. Test results suggest that RPAAS systems may be used for herbicide applications against post-emergence weeds in lieu of conventional backpack sprayers. Data reported here indicate that further research should be conducted to evaluate herbicidal efficacy of spray applications from the RPAAS platforms compared to backpack sprayers.

Author Contributions

Conceptualization, D.M., V.S., and M.B., methodology, D.M., V.S., post M.B.; formal analysis, M.A.L.; writing—original draft preparation, D.M. post M.A.L., writing—review and editing, M.A.L., D.M., post V.S. All authors have read and agreed to the published version of the manuscript.

Funding

This research received no external funding.

Acknowledgments

The authors would like to thank Al Nelson for allowing them to use the research plots at the Texas A&M University Research Farm.

Conflicts of Interest

The authors declare no conflict of interest. Disclaimer: The use of trade, firm, or corporation names in this publication is for the information and convenience of the reader. Such use does not constitute an official endorsement or approval by the United States Department of Agriculture or the Agricultural Research Service of any product or service to the exclusion of others that may be suitable.

References

  1. Buchanan, G.A.; Burns, E.R. Influence of weed competition on cotton. Weed Sci. 1970, 18, 149–154. [Google Scholar] [CrossRef]
  2. Staniforth, D.W.; Weber, C.R. Effects of annual weeds on the growth and yield of soybeans 1. Agron. J. 1956, 48, 467–471. [Google Scholar] [CrossRef]
  3. Cousens, R. A simple model relating yield loss to weed density. Ann. Appl. Biol. 1985, 107, 239–252. [Google Scholar] [CrossRef]
  4. University, K.S. Left Uncontrolled, Weeds Would Cost Billions in Economic Losses Every Year. ScienceDaily. 2016. Available online: https://www.sciencedaily.com/releases/2016/05/160516130720.htm (accessed on 18 September 2020).
  5. Soltani, N.; Dille, J.; Burke, I.; Everman, W.; VanGessel, M.; Davis, V.; Sikkema, P. Potential corn yield losses due to weeds in North America. Weed Technol. 2016, 30. [Google Scholar] [CrossRef]
  6. Gianessi, L.P.; Nathan, P.R. The Value of Herbicides in U.S. Crop Production. Weed Technol. 2007, 21, 559–566. [Google Scholar] [CrossRef]
  7. Sikkema, P.H.; Hamill, A.S. Weed costs per day (2). In New Perspectives into Research on Early Weed Control; Syngenta: Basel, Switzerland, 2005; p. 4. [Google Scholar]
  8. Gianessi, L.P. The increasing importance of herbicides in worldwide crop production. Pest. Manag. Sci. 2013, 69, 1099–1105. [Google Scholar] [CrossRef]
  9. Hassler, S.C.; Baysal-Gurel, F. Unmanned Aircraft System (UAS) Technology and Applications in Agriculture. Agronomy 2019, 9, 618. [Google Scholar] [CrossRef] [Green Version]
  10. Pflanz, M.; Nordmeyer, H.; Schirrmann, M. Weed mapping with UAS imagery and a Bag of Visual Words based image classifier. Remote Sens. 2018, 10, 1530. [Google Scholar] [CrossRef] [Green Version]
  11. Rasmussen, J.; Nielsen, J.; Streibig, J.; Jensen, J.; Pedersen, K.; Olsen, S. Pre-harvest weed mapping of Cirsium arvense in wheat and barley with off-the-shelf UAVs. Precis. Agric. 2019, 20, 983–999. [Google Scholar] [CrossRef]
  12. Bah, M.D.; Hafiane, A.; Canals, R. Weeds Detection in UAV Imagery Using SLIC and the Hough Transform. In Proceedings of the 2017 Seventh International Conference on Image Processing Theory, Tools and Applications (IPTA), Montreal, QC, Canada, 28 November–1 December 2017; pp. 1–6. [Google Scholar]
  13. Baluja, J.; Diago, M.P.; Balda, P.; Zorer, R.; Meggio, F.; Morales, F.; Tardaguila, J. Assessment of vineyard water status variability by thermal and multispectral imagery using an unmanned aerial vehicle (UAV). Irrig. Sci. 2012, 30, 511–522. [Google Scholar] [CrossRef]
  14. Ge, Y.; Thomasson, J.A.; Sui, R. Remote sensing of soil properties in precision agriculture: A review. Front. Earth Sci. 2011, 5, 229–238. [Google Scholar] [CrossRef]
  15. Saari, H.; Pellikka, I.; Pesonen, L.; Tuominen, S.; Heikkilä, J.; Holmlund, C.; Mäkynen, J.; Ojala, K.; Antila, T. Unmanned Aerial Vehicle (UAV) Operated Spectral Camera System for Forest and Agriculture Applications. In Remote Sensing for Agriculture, Ecosystems, and Hydrology XIII; Neale, C.M.U., Maltese, A., Eds.; SPIE—International Society for Optics and Photonics: Bellingham, WA, USA, 2011; p. 81740H. [Google Scholar]
  16. Huang, Y.; Reddy, K.N.; Fletcher, R.S.; Pennington, D. UAV Low-altitude remote sensing for precision weed management. Weed Technol. 2018, 32, 2–6. [Google Scholar] [CrossRef]
  17. Göktoǧan, A.H.; Sukkarieh, S.; Bryson, M.; Randle, J.; Lupton, T.; Hung, C. A rotary-wing unmanned air vehicle for aquatic weed surveillance and management. J. Intell. Robot. Syst. 2010, 57, 467. [Google Scholar] [CrossRef]
  18. Castaldi, F.; Pelosi, F.; Pascucci, S.; Casa, R. Assessing the potential of images from unmanned aerial vehicles (UAV) to support herbicide patch spraying in maize. Precis. Agric. 2017, 18, 76–94. [Google Scholar] [CrossRef]
  19. Peña, J.M.; Torres-Sánchez, J.; de Castro, A.I.; Kelly, M.; López-Granados, F. Weed mapping in early-season maize fields using object-based analysis of unmanned aerial vehicle (UAV) images. PLoS ONE 2013, 8, e77151. [Google Scholar] [CrossRef] [Green Version]
  20. Rasmussen, J.; Nielsen, J.; Garcia-Ruiz, F.; Christensen, S.; Streibig, J.C. Potential uses of small unmanned aircraft systems (UAS) in weed research. Weed Res. 2013, 53, 242–248. [Google Scholar] [CrossRef]
  21. Ahmad, F.; Qiu, B.; Dong, X.; Ma, J.; Huang, X.; Ahmed, S.; Chandio, F.A. Effect of operational parameters of UAV sprayer on spray deposition pattern in target and off-target zones during outer field weed control application. Comput. Electron. Agric. 2020, 172, 105350. [Google Scholar] [CrossRef]
  22. Meyer, C.J.; Norsworthy, J.K.; Kruger, G.R.; Barber, T. Effects of Nozzle Selection and Ground Speed on Efficacy of Liberty and Engenia Applications and Their Implication on Commercial Field Applications. Weed Technol. 2016, 30, 401–414. [Google Scholar] [CrossRef]
  23. DiTomaso, J.M.; Smith, B.S. Linking ecological principles to tools and strategies in an EBIPM program. Rangelands 2012, 34, 30–34. [Google Scholar] [CrossRef] [Green Version]
  24. Bellinder, R.R.; Kirkwyland, J.J.; Wallace, R.W.; Colouhoun, J.B. Weed Control and Potato (Solanum tuberosum) yield with banded herbicides and cultivation. Weed Technol. 2000, 14, 30–36. [Google Scholar] [CrossRef]
  25. Martin, D.E.; Woldt, W.E.; Latheef, M.A. Effect of Application Height and Ground Speed on Spray Pattern and Droplet Spectra from Remotely Piloted Aerial Application Systems. Drones 2019, 3, 83. [Google Scholar] [CrossRef] [Green Version]
  26. Creech, C.F.; Henry, R.S.; Fritz, B.K.; Kruger, G.R. Influence of herbicide active ingredient, nozzle type, orifice size, spray pressure, and carrier volume rate on spray droplet size characteristics. Weed Technol. 2015, 29, 298–310. [Google Scholar] [CrossRef]
  27. McKinlay, K.; Ashford, R.; Ford, R. Effects of drop size, spray volume, and dosage on paraquat toxicity. Weed Sci. 1974, 22, 31–34. [Google Scholar] [CrossRef]
  28. Wolf, T.M.; Liu, S.H.; Caldwell, B.C.; Hsiao, A.I. Calibration of greenhouse spray chambers: The importance of dynamic nozzle patternation. Weed Technol. 1997, 11, 428–435. [Google Scholar] [CrossRef]
  29. Culpepper, A.S.; Webster, T.M.; Sosnoskie, L.M.; York, A.C.; Nandula, V. Glyphosate-resistant Palmer amaranth in the United States. In Glyphosate Resistance in Crops and Weeds: History, Development, and Management; John Wiley & Sons: Hoboken, NJ, USA, 2010; pp. 195–212. [Google Scholar]
  30. Norsworthy, J.K. Use of soybean production surveys to determine weed management needs of South Carolina farmers. Weed Technol. 2003, 17, 195–201. [Google Scholar] [CrossRef]
  31. Ward, S.M.; Webster, T.M.; Steckel, L.E. Palmer amaranth (Amaranthus palmeri): A review. Weed Technol. 2013, 27, 12–27. [Google Scholar] [CrossRef] [Green Version]
  32. Martin, D. A fluorescent imaging technique for quantifying spray deposits on plant leaves. At. Sprays 2014, 24, 367–373. [Google Scholar] [CrossRef] [Green Version]
  33. Martin, D.E.; Latheef, M.A. Aerial electrostatic spray deposition and canopy penetration in cotton. J. Electrost. 2017, 90, 38–44. [Google Scholar] [CrossRef]
  34. Whittney, R.W.; Gardisser, D.R. DropletScan Operators Manual; WRK of Oklahoma and WRK of Arkansas: Stillwater, OK, USA, 2003. [Google Scholar]
  35. Sokal, R.R.; Rohlf, R.R. Biometry—The principles and Practice of Statistics in Biological Research; W. H. Freeman and Company: San Francisco, CA, USA, 1969. [Google Scholar]
  36. Guppy, J.; Harcourt, D. Spatial pattern of the immature stages and teneral adults of Phyllophaga spp.(Coleoptera: Scarabaeidae) in a permanent meadow. Can. Entomol. 1970, 102, 1354–1359. [Google Scholar] [CrossRef]
  37. Harcourt, D. Population dynamics of Leptinotarsa decemlineata (Say) in eastern Ontario: I. Spatial pattern and transformation of field counts. Can. Entomol. 1963, 95, 813–820. [Google Scholar] [CrossRef]
  38. Mukerji, M.; Harcourt, D. Spatial pattern of the immature stages of Hylemya brassicae on cabbage. Can. Entomol. 1970, 102, 1216–1222. [Google Scholar] [CrossRef]
  39. Miller, C.; Mukerji, M.; Guppy, J. Notes on the spatial pattern of Hypera postica (Coleoptera: Curculionidae) on alfalfa. Can. Entomol. 1972, 104, 1995–1999. [Google Scholar] [CrossRef]
  40. Westfall, P.H.; Tobias, R.D.; Wolfinger, R.D. Multiple Comparisons and Multiple Tests Using SAS; SAS Institute: Cary, NC, USA, 2011. [Google Scholar]
  41. Nuyttens, D.; De Schampheleire, M.; Baetens, K.; Sonck, B. The Influence of Operator-Controlled Variables on Spray Drift from Field Crop Sprayers. Trans. Asabe 2007, 50, 1129–1140. [Google Scholar] [CrossRef]
  42. Wang, G.; Lan, Y.; Yuan, H.; Qi, H.; Chen, P.; Ouyang, F.; Han, Y. Comparison of spray deposition, control efficacy on wheat aphids and working efficiency in the wheat field of the unmanned aerial vehicle with boom sprayer and two conventional knapsack sprayers. Appl. Sci. 2019, 9, 218. [Google Scholar] [CrossRef] [Green Version]
  43. Hill, B.; Inaba, D. Use of water-sensitive paper to monitor the deposition of aerially applied insecticides. J. Econ. Entomol. 1989, 82, 974–980. [Google Scholar] [CrossRef]
  44. Wen, Y.; Zhang, R.; Chen, L.; Huang, Y.; Yi, T.; Xu, G.; Li, L.; Hewitt, A.J. A new spray deposition pattern measurement system based on spectral analysis of a fluorescent tracer. Comput. Electron. Agric. 2019, 160, 14–22. [Google Scholar] [CrossRef]
  45. Qin, W.; Xue, X.; Zhang, S.; Gu, W.; Wang, B. Droplet deposition and efficiency of fungicides sprayed with small UAV against wheat powdery mildew. Int. J. Agric. Biol. Eng. 2018, 11, 27–32. [Google Scholar] [CrossRef] [Green Version]
  46. Xinyu, X.; Kang, T.; Weicai, Q.; Yubin, L.; Huihui, Z. Drift and deposition of ultra-low altitude and low volume application in paddy field. Int. J. Agric. Biol. Eng. 2014, 7, 23–28. [Google Scholar]
  47. Fengbo, Y.; Xinyu, X.; Ling, Z.; Zhu, S. Numerical simulation and experimental verification on downwash air flow of six-rotor agricultural unmanned aerial vehicle in hover. Int. J. Agric. Biol. Eng. 2017, 10, 41–53. [Google Scholar] [CrossRef] [Green Version]
  48. Qing, T.; Ruirui, Z.; Liping, C.; Min, X.; Tongchuan, Y.; Bin, Z. Droplets movement and deposition of an eight-rotor agricultural UAV in downwash flow field. Int. J. Agric. Biol. Eng. 2017, 10, 47–56. [Google Scholar]
  49. Wen, S.; Han, J.; Ning, Z.; Lan, Y.; Yin, X.; Zhang, J.; Ge, Y. Numerical analysis and validation of spray distributions disturbed by quad-rotor drone wake at different flight speeds. Comput. Electron. Agric. 2019, 166, 105036. [Google Scholar] [CrossRef]
  50. Tan, Y.; Chen, J.; Norton, T.; Wang, J.; Liu, X.; Yang, S.; Zheng, Y. The computational fluid dynamic modeling of downwash flow field for a six-rotor UAV. Front. Agric. Sci. Eng. 2018, 5, 159–167. [Google Scholar]
  51. Yang, S.; Liu, X.; Chen, B.; Li, S.; Zheng, Y. CFD Models and Verification of the Downwash Airflow of an Eight-Rotor UAV. In Proceedings of the 2019 ASABE Annual International Meeting, St. Joseph, MI, USA, 7–10 July 2019; p. 1. [Google Scholar]
  52. Yang, S.; Zheng, Y.; Liu, X. Research Status and Trends of Downwash Airflow of spray UAVs in Agriculture. Int. J. Precis. Agric. Aviat. 2019, 2, 1–8. [Google Scholar] [CrossRef] [Green Version]
  53. Songchao, Z.; Xinyu, X.; Zhu, S.; Lixin, Z.; Yongkui, J. Downwash distribution of single-rotor unmanned agricultural helicopter on hovering state. Int. J. Agric. Biol. Eng. 2017, 10, 14–24. [Google Scholar] [CrossRef] [Green Version]
  54. Yang, Z.; Qi, L.; Wu, Y. Influence of UAV Rotor Down-Wash Airflow for Droplet Penetration. In Proceedings of the 2018 ASABE Annual International Meeting, Detroit, MI, USA, 29 July–1 August 2018; p. 1. [Google Scholar]
Figure 1. Field plot layout of the study on Palmer amaranth and ivyleaf morningglory. Backpack spray application was evaluated only for the 6 m × 5 m sections of the plots indicated in blue.
Drones 04 00059 g001
Figure 2. (A) V6A aircraft in flight. (B) The backpack sprayer with spray boom, nozzles, spray tank, and pressure gage.
Drones 04 00059 g002
Figure 3. Schematic of HSE V6A, showing rotor configurations and corresponding nozzle locations on spray boom. Circles represent rotor positions.
Drones 04 00059 g003
Figure 4. Pattern test results for RPAAS with the four-nozzle configuration. The top graph shows the pattern of individual passes. The bottom graph shows the average of the four passes. The table on the right shows the coefficient of variation (CV) at different swath widths. An effective swath of 4.6 m (15 ft) was chosen because it was the largest swath width with a CV < 15%.
Drones 04 00059 g004
Figure 5. Spray droplet images captured on WSP samplers in each of the three treatments. The RPAAS at 18.7 L·ha−1, RPAAS-4 at 37.4 L·ha−1 and Backpack Sprayer at 140 L·ha−1.
Drones 04 00059 g005
Figure 6. Fluorescent images of a Palmer amaranth leaf processed by ImageJ software: enhanced image of spray droplets (A), selected image of spray droplets (B) and the computer drawing of spray droplets (C).
Drones 04 00059 g006aDrones 04 00059 g006b
Figure 7. Relationship between the original variance and original mean of spray droplet density of the fluorescent imaging data.
Drones 04 00059 g007
Figure 8. Relationship between the transformed variance and transformed mean of spray droplet density of the fluorescent imaging data in log (x + 1) transformed scale, where x is the original variate.
Drones 04 00059 g008
Figure 9. Percent of spray deposits collected on WSP samplers relative to target application rate in Study 1. Data analysis was based upon arcsine transformation. Bars with original means ± SEM with the same lower-case letter are not significantly different (p > 0.05).
Drones 04 00059 g009
Figure 10. Percent of spray deposits collected on WSP samplers relative to target application rate in Study 2. Data analysis was based upon arcsine transformation. Bars with original means ± SEM with the same lower-case letter are not significantly different (p > 0.05).
Drones 04 00059 g010
Table 1. Spray application setups for the backpack sprayer and the RPAAS aircraft in Study 1 and Study 2.
TreatmentApplication Rate (L·ha−1)Nozzle Orifice# of NozzlesNozzle Spacing (cm)Flow Rate/Nozzle (L·m−1)Pressure (kPa)Speed (m·s−1)Height (m)
RPAAS-218.7TTI 110-015 a4 b*0.6534543
RPAAS-437.4TTI 110-015 a4 b*0.653454 c3
BP-15140TTI 110-015 a4510.562761.250.51
a TeeJet Technologies, Wheaton, Ill. b In Study 1, only three nozzles were operational for the RPAAS aircraft because of lack of adequate pressure due to large nozzle orifice size. In Study 2, the number of nozzles was reduced to two, which provided a full nozzle spray pattern at 414 kPa. The two nozzles used were the inboard nozzles which remained in their original positions. c This treatment was flown twice at this speed to achieve double the application rate. * Please see Figure 2.
Table 2. Meteorological data during the test periods.
Temperature (C)Relative Humidity (%)Wind Speed (km/h)Wind Direction (°)Crosswind a
Test 1
31.7–33.259–67(8.8–13.9)175–20015–40°
Test 2
33.7–34.555.1–57.8(7.2–10.2)174–20015–41°
a Angular deviation of the wind from row orientation (215°).
Table 3. Spray droplet spectra parameters sampled by WSP collectors in Study 1 a.
TreatmentDv0.1 (µm)Dv0.5 (µm)Dv0.9 (µm)Droplet Density (Drops/cm2)Coverage (%)
RPAAS-2253.6 a517.4 a617.5 b24.4 b3.5 b
RPAAS-4286.6 a482.1 a625.2 b26.5 b6.0 b
BP-15342.8 a651.8 a839.4 a49.2 a18.6 a
F2,531.55 ns2.57 ns3.48 *6.24 **24.1 **
p0.220.090.040.00370.0001
a Least square means were separated using the lines option at p = 5%. Means followed by the same lower-case letter are not significantly different. ns = Not significant. *, ** significant and highly significant, respectively. “a” and “b” represent means separation.
Table 4. Spray droplet parameters sampled by WSP collectors in Study 2 a.
TreatmentDv0.1 (µm)Dv0.5 (µm)Dv0.9 (µm)Droplet Density (Drops/cm2)Coverage (%)
RPAAS-2246.5 a490.9 a644.0 a16.9 b4.9 b
RPAAS-4263.3 a540.4 a706.6 a38.7 b10.3 b
BP-15276.7 a574.3 a768.8 a51.1 a19.8 a
F2,530.29 ns0.75 ns0.98 ns5.72 **7.84 **
p0.750.480.380.00560.001
a Least square means were separated using the lines option at p = 5%. Means followed by the same lower-case letter are not significantly different. ns = Not significant. ** significant and highly significant, respectively.
Table 5. Fluorescent imaging of spray droplet density (drops/cm2) on the top and the bottom surface of weed leaves in Study 1.
TreatmentPalmer AmaranthMorningglory
TopBottomTopBottom
RPAAS-213.09 b0.83 d9.98 b0.94 d
RPAAS-415.55 b3.86 c8.99 b3.42 c
BP-1536.45 a3.12 c29.77 a0.90 d
Treatment (T)F = 14.4; p < 0.0001; df = 2,102F = 7.4; p > 0.0009; df = 2,106
Surface (S)F = 85.6; p < 0.0001; df = 1,102F = 123.5; p < 0.0001; df = 1,106
T × SF = 4.3; p > 0.016; df = 2,102F = 4.3; p > 0.016; df = 2,106
Droplet density data were transformed to log (x + 1). Original means within each column followed by the same lower-case letters are not significantly different (p = 5%).
Table 6. Fluorescent imaging of spray droplet density (drops/cm2) on the top and the bottom surface of weed leaves in Study 2.
TreatmentPalmer AmaranthMorningglory
TopBottomTopBottom
RPAAS-222.30 b1.75 d14.08 b2.43 d
RPAAS-442.14 b5.80 c21.48 b5.44 c
BP-1563.83 a3.28 cd51.76 a1.86 d
Treatment (T)F = 4.1; p > 0.02; df = 2,94F = 4.9; p > 0.0094; df = 2,106
Surface (S)F = 268.9; p < 0.0001; df = 1,94F = 189.7; p < 0.0001; df = 1,106
T × SF = 3.9; p > 0.02; df = 2,94F = 16.3; p > 0.0001; df = 2,106
Data were transformed to log (x + 1). Original means within each column followed by the same lower-case letters are not significantly different (p = 5%).
Table 7. Fluorescent imaging of percent of spray droplets in the top and the bottom surface of weed leaves in Study 1.
TreatmentPalmer AmaranthMorningglory
TopBottomTopBottom
RPAAS-290.70 a9.30 d90.50 a9.50 d
RPAAS-479.24 b20.76 c69.75 b30.25 c
BP-1591.34 a8.66 d96.52 a3.48 d
Treatment (T)F = 0.0; p > 1.0; df = 2,102F = 0.1; p > 1.0; df = 2,98
Surface (S)F = 493.2; p < 0.00001; df = 1,102F = 416.0; p < 0.00001; df = 1,98
T × SF = 5.7; p < 0.0045; df = 2,102F = 21.7; p < 0.0001; df = 2,98
Means within each column followed by the same lower-case letters are not significantly different (p = 5%).
Table 8. Fluorescent imaging of percent of spray droplets in the top and the bottom surface of weed leaves in Study 2.
TreatmentPalmer AmaranthMorningglory
TopBottomTopBottom
RPAAS-293.72 a6.28 d87.53 a12.47 d
RPAAS-479.07 b20.93 c72.46 b27.54 c
BP-1592.91 a7.09 d94.89 a5.11 d
Treatment (T)F = 0.0; p > 1.0; df = 2,106F = 0.0; p > 1.0; df = 2,106
Surface (S)F = 635.2; p < 0.00001; df = 1,106F = 632.5; p < 0.0001; df = 1,106
T × SF = 10.1; p < 0.0045; df = 2,106F = 22.5; p < 0.0001; df = 2,106
Means within each column followed by the same lower-case letters are not significantly different (p = 5%).