1. Introduction
1.1. Motivation
In September 2018 photogrammetric images and terrestrial laser scans were carried out as part of a measurement campaign for the three-dimensional recording of three historical churches in Georgia. Several project objectives were defined in advance:
3D reconstruction of the outer skin of the buildings
3D reconstruction of an exemplary interior space
Use and examination of the new Leica BLK360 scanner under practical conditions
Combination of UAV and terrestrial image acquisition with terrestrial laser scans
Use of data for future semantic segmentation studies
Use of the data for restoration work and tourism.
As part of ongoing research work on model-based reconstruction of badly damaged structures from point clouds of Russian Orthodox churches [
1], Jade University in Oldenburg and the University of Bamberg collaborate with Georgian Technical University in Tbilisi. In a one-week measuring campaign, three churches were recorded with different measuring systems:
Terrestrial laser scanners Faro Focus 3D X330 and Leica BLK360
UAV DJI Mavic Pro with FC 220 f = 4.7 mm
DSLR cameras Canon EOS 200D, f = 10–20 mm, and Canon EOS D6 Mark II, f = 24–50 mm.
The aim was complete spatial reconstruction with high quality textures and a spatial resolution and accuracy of approx. 1 cm. Partly difficult external conditions required the combination of different measuring techniques. The significance of the work was also in definition of epochal architecture connected with Russian empire expansion policy and influence to local life by orthodox rules which reflects in architecture with its positive and negative sides. The photogrammetric reconstructions are carried out with Agisoft Photoscan (Metashape) and RealityCapture (RC). For the Agisoft workflow, the photogrammetric point cloud will be merged with laser scans afterwards, e.g., in CloudCompare (At the time of paper writing, a new version of Agisoft Metashape allows importing of TLS point clouds, but the option of TLS and photogrammetric data fusion are not yet apparent). In RC, photogrammetric images and laser scans are processed simultaneously, hence no extra data fusion step is required. Since the RC results have shown better quality for the first case study (see [
2]), this paper concentrates on the integrated workflow offered by RC.
A tachymetric control point measurement could not be carried out for technical reasons. It was therefore decided to take control points for photogrammetric orientation from the registered point clouds of the laser scanning.
Studies of a similar kind can be found in the literature, they reference other hardware and software solutions. Examples include, among others, [
3,
4,
5]. Useful workflows for fusion of hybrid survey data in BIM have been described in [
6]. Fusion and integration of photogrammetry and laser scanning has been studied by different authors, e.g., [
7,
8,
9].
1.2. Measurement Objects
Within one week, three Georgian churches were recorded, all located in the Georgian capital Tbilisi. Two of them, namely Lurdji and Sioni, have been modelled and will be presented here. Descriptions of the churches can be found in [
10,
11]. Parts of the buildings were difficult to access due to occlusions by vegetation or very close neighboring buildings. Special permissions for operating UAV flights were not required at that time. For each object several UAV flights, two terrestrial DSLR image sets and two laser scan measurements were conducted. The churches are described in more detail in
Section 3.
2. Methodology
The objective of this project is to combine UAV photogrammetry with terrestrial imagery and laser scanning data in order to achieve an accurate and complete 3D representation of the monuments. Since none of these technologies could solve the task individually, data fusion is necessary to meet the requirements. However, due to a large variety of imaging distances, resolution and accuracy within the final point clouds may vary and have to be analyzed.
In the following, the basic data processing procedures will be explained. The results of the two case studies will be presented in
Section 3.
2.1. Laser Scanning
2.1.1. Targeting
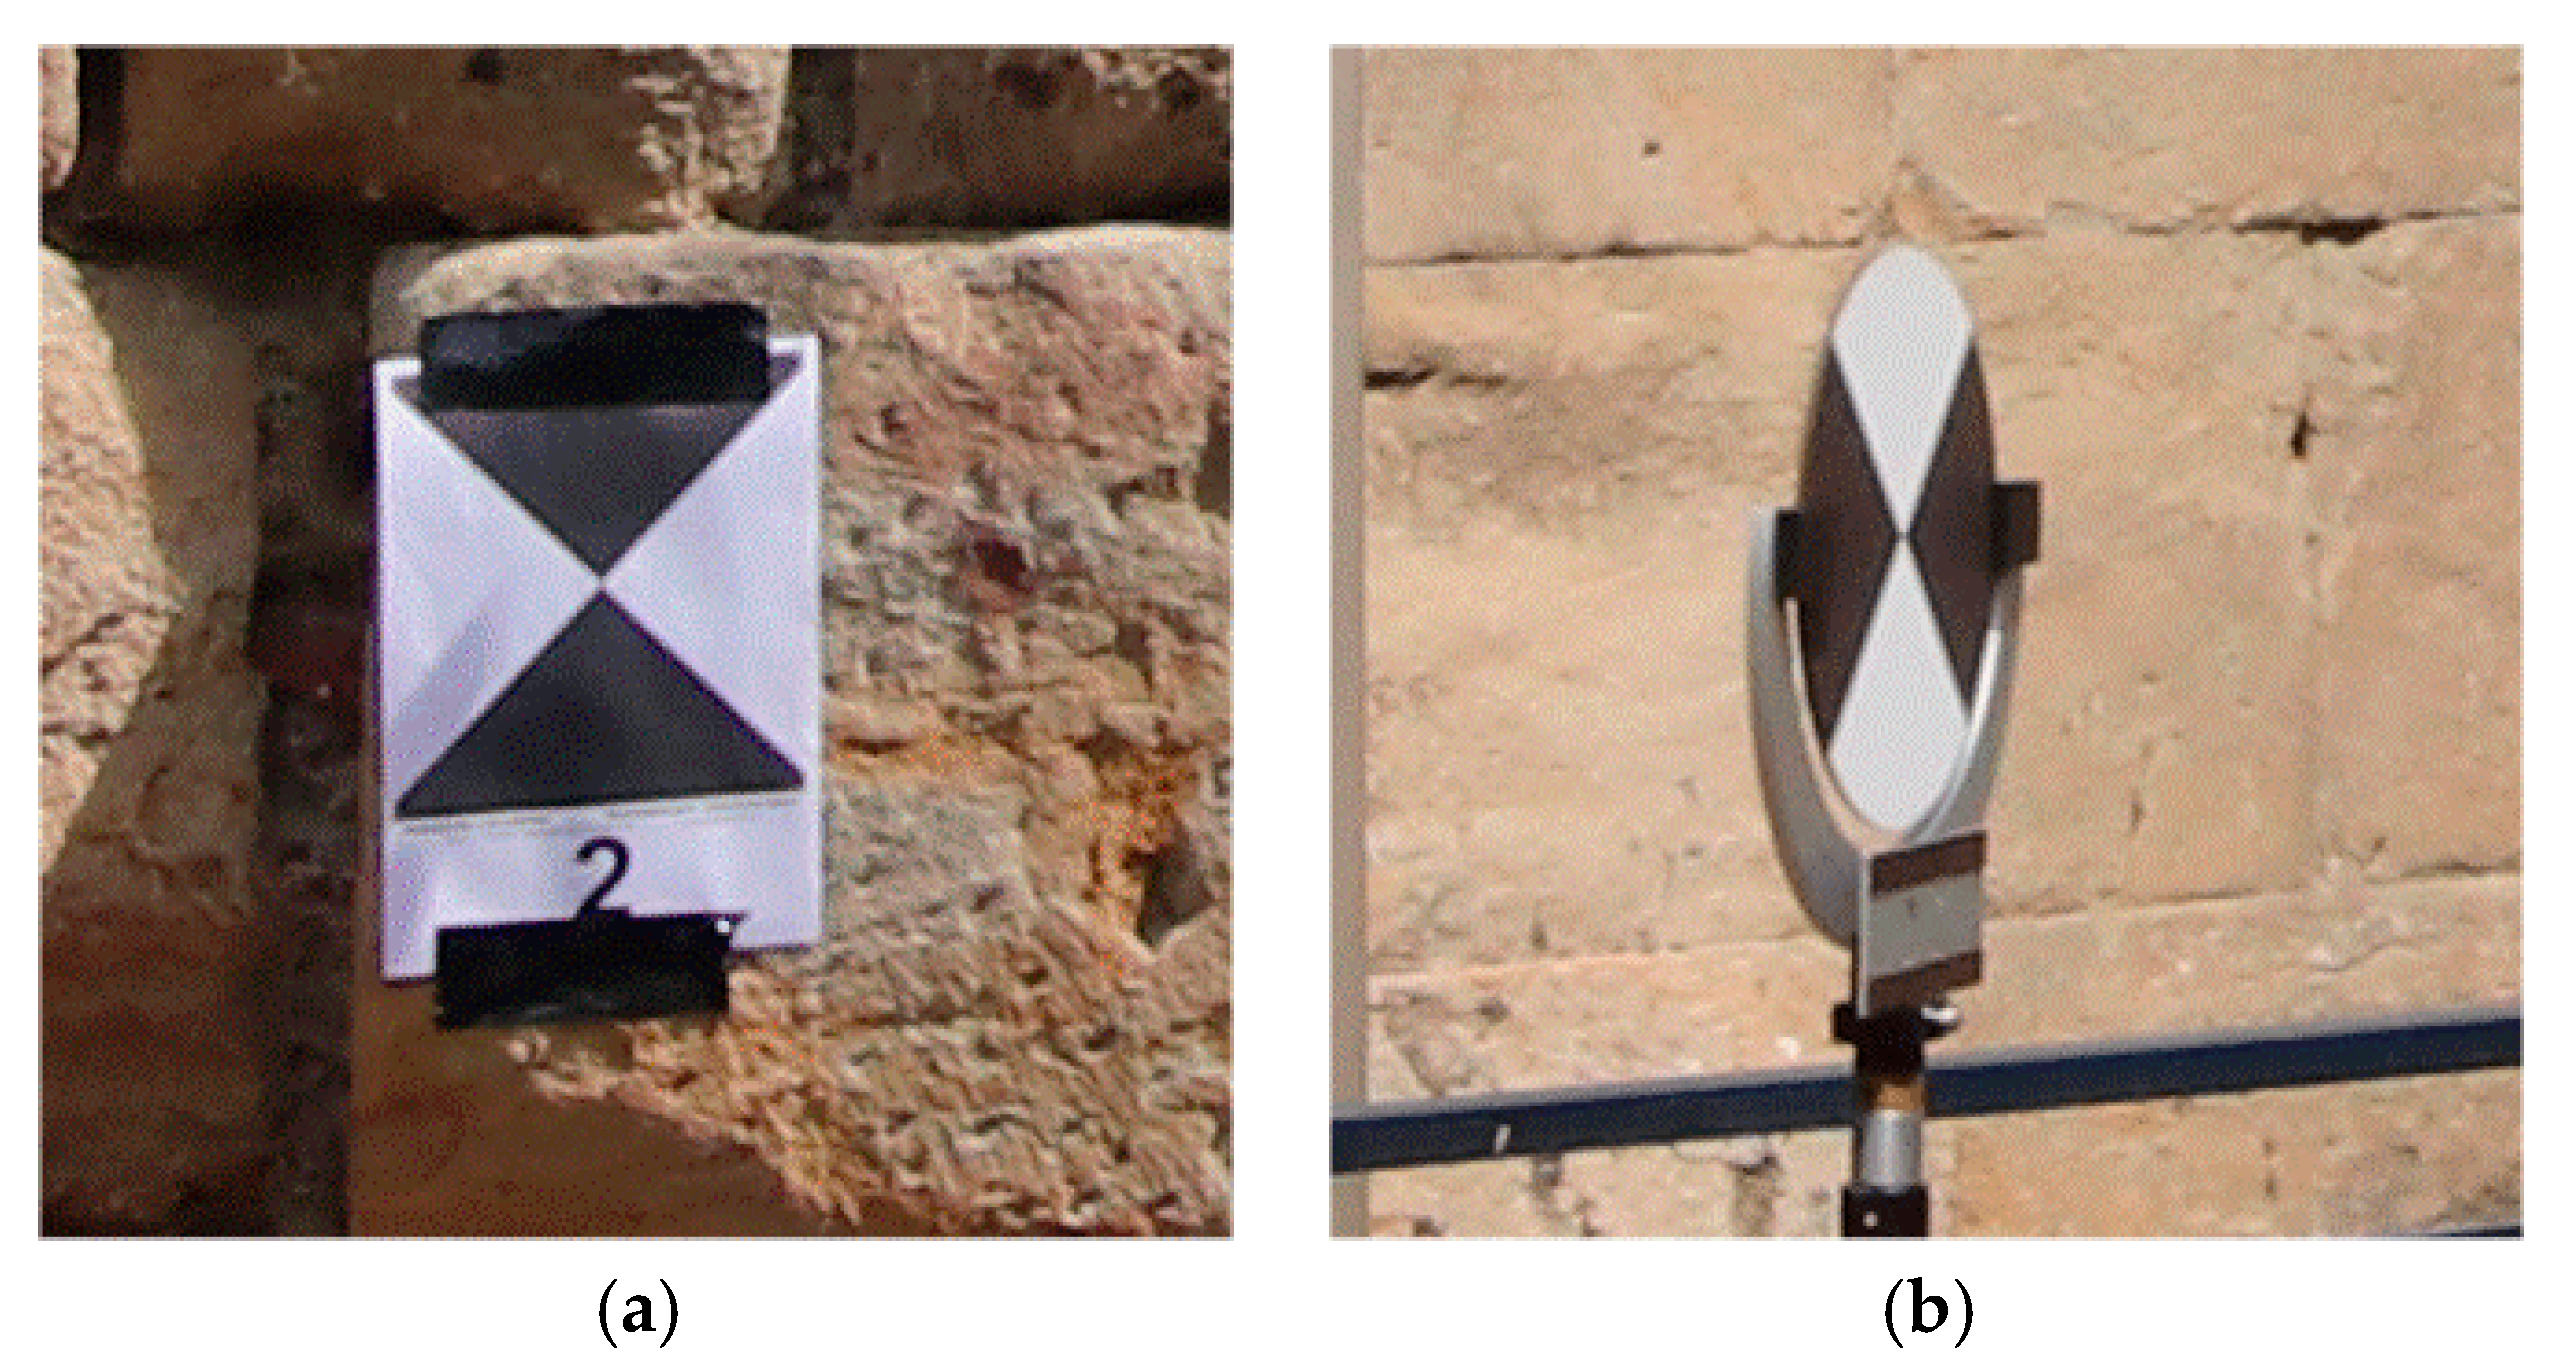
The buildings were marked with targets which were placed at a distance of approx. 5–10 m from each other directly on the building and in the rear surroundings areas behind them. As previously mentioned, the targets could not be measured by total station. Instead, they were used as tie points for laser scanning and their final 3D coordinates then used for photogrammetric datum definition.
The targets consisted of the usual chessboard-like signals (A4 size,
Figure 1a). In addition, some tilt and turn targets (
Figure 1b) were employed. These can be rotated around their horizontal and vertical axes without changing the target center, to enable optimal sights from different positions and from the air. The mechanical accuracy of these targets is around 1 mm.
2.1.2. Faro Focus 3D X330
The Faro Focus 3D X330 (
Figure 2a) is a geodetic laser scanner with phase-based distance measurement and a 3D point accuracy of approx. 2 mm at 10 m distance. The maximum range is 330 m. For laser scanning, a point spacing of 6 mm at a distance of 10 m was selected. In this mode, a complete scan takes approx. 25 min, including the acquisition of image data. An overview of the captured data can be found in
Table 1.
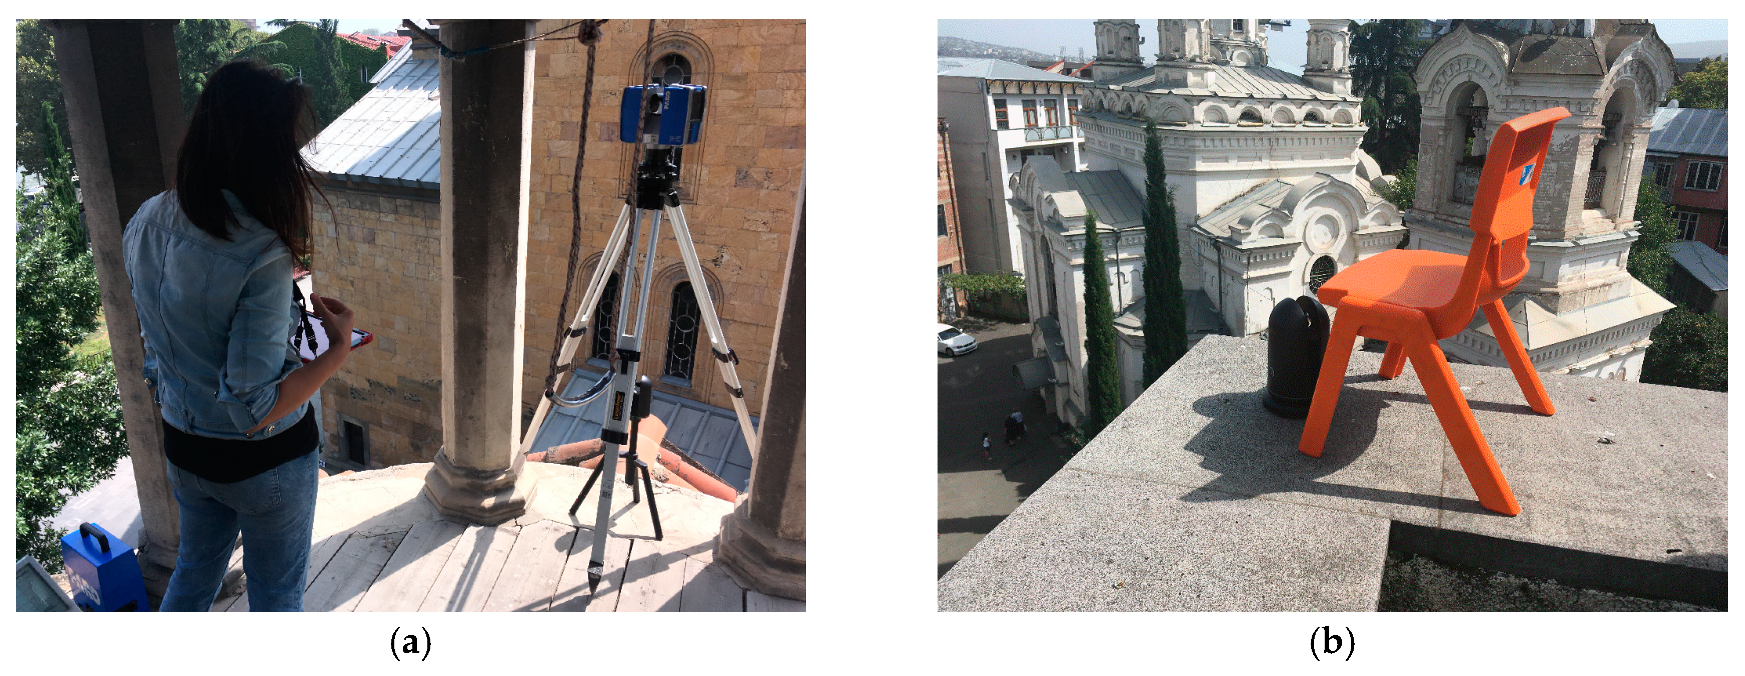
In addition to the ground level positions, a few scans were taken from elevated positions in the neighboring bell tower (
Figure 2a) and from a roof terrace on another building (
Figure 2b). Due to the limited choice of scan stations, some parts of the roof and the tower could not be captured. The point resolution at the target buildings varies between approx. 3 mm and 15 mm (tower) due to very different measuring distances.
The registration was carried out via the targets with subsequent optimization (ICP). The average standard deviation of the final registration with Cyclone software lies between 3 mm and 4 mm (see
Table 1).
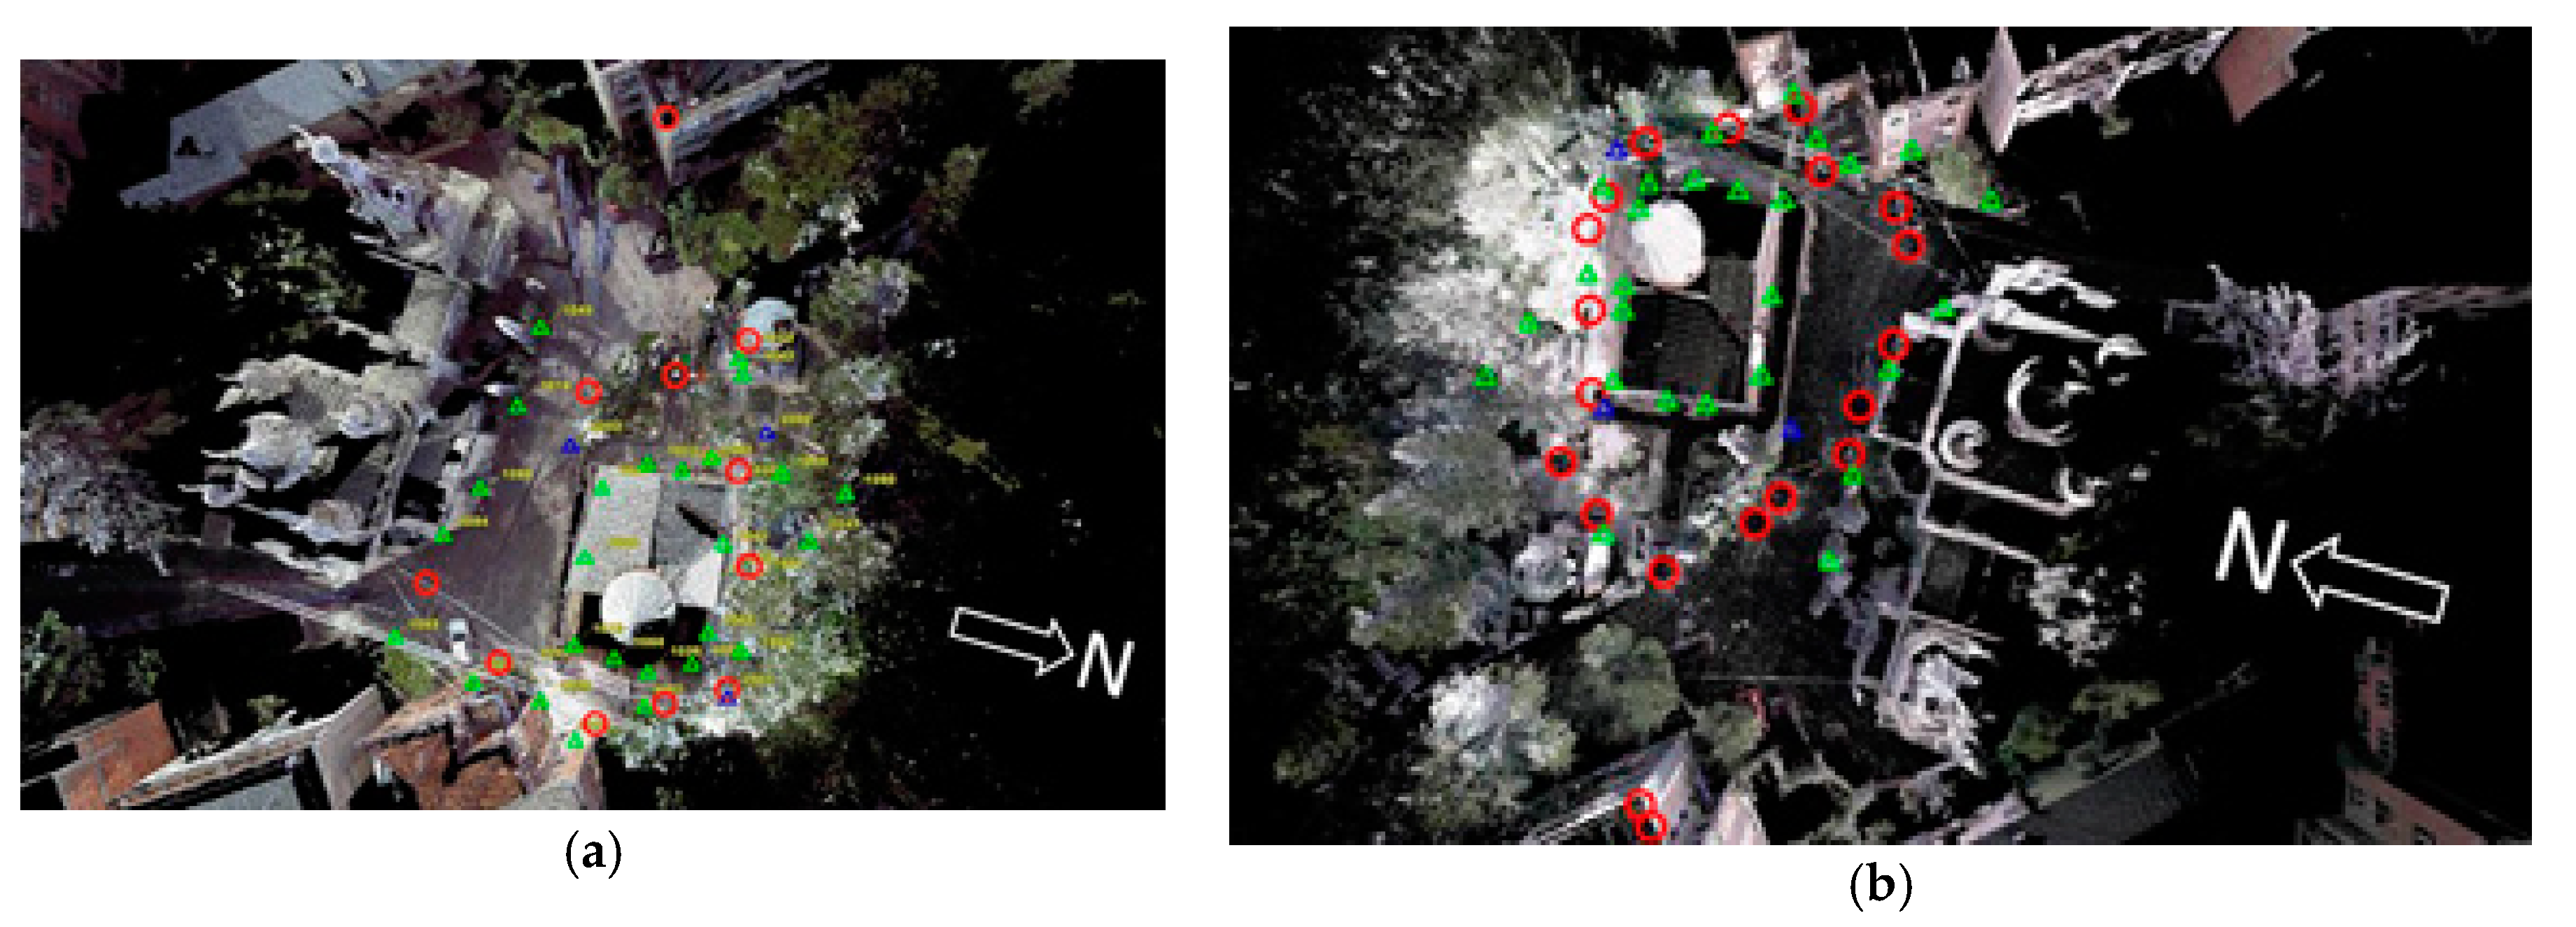
Figure 3a shows an overview of the registered point cloud with the positions and the recorded targets.
2.1.3. Leica BLK360
The Leica BLK360 laser scanner (
Figure 2b), which has been available on the market since 2017, is particularly easy to use. The device is primarily designed for simple building surveys with medium accuracy requirements at a range of up to 60 m. A 3D point accuracy of approx. 6 mm at a distance of 10 m can be achieved. The distance measurement is carried out according to the WFD principle (wave form digitizer). With the BLK, the captured data is first stored in the scanner and then transferred to a tablet computer via WiFi. Laser scanning was carried out in High Density mode, which corresponds to a point separation of 6 mm at 10 m distance. In this mode, a complete scan, including the acquisition of panorama images, takes approx. 5 min. An overview of the acquired data can be found in
Table 1.
As for the Faro scans, the registration was carried out using the targets with subsequent optimization (ICP) in Cyclone resulting in a mean error of 4 to 7 mm. The mean point resolution lies between 4 mm in areas close to the ground and 16 mm at the tower.
Figure 3b shows an overview of the registered point cloud with the scan positions and the recorded targets. A comparison of data and registration quality is reported in [
2].
2.2. Photogrammetry
2.2.1. UAV Flights
The local partners provided a DJI Mavic Pro drone with FC 220 camera (12 Mpixel, focal length f = 4.7 mm, image format 6.4 mm × 4.8 mm, pixel size 1.6 µm). The maximum flight duration is approx. 22 min. The drone was manually controlled by an experienced pilot. A meandering image configuration with nadir images as well as circular flights with oblique images from different distances were captured.
Table 2 compiles the most important flight data of the campaigns.
The UAV was operated in a stop-and-go mode, meaning that for each image recording the drone was kept in a fixed flight position. Therefore, the built-in rolling shutter of the FC 220 camera had no significant negative impact on the subsequent photogrammetric results.
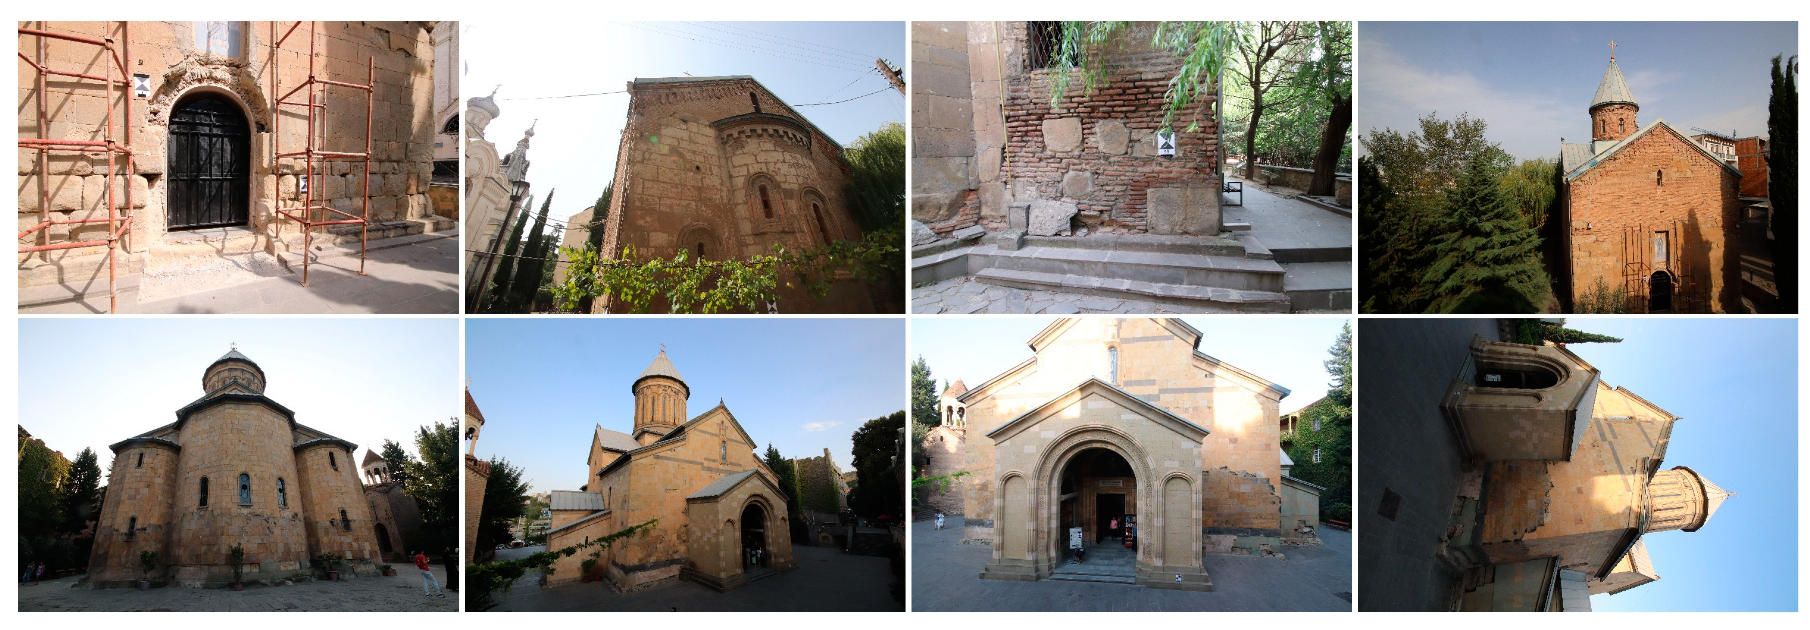
Figure 4 shows example images of different flights.
Altogether, the image quality of the UAV flights was satisfactory in terms of sharpness and exposure. As seen from
Figure 4, changing sunlight conditions lead to different image brightness. Especially on surfaces with high reflectivity, here the metal roofs, some of the images are close to over-exposure. However, the subsequent photogrammetric processing was conducted without any problems which might be due to image quality.
2.2.2. Terrestrial Images
From the ground, two hand-held sets of images were taken with digital SLR cameras (DSLRs), each of which had zoom lenses since fixed-focus lenses were not available. The lenses were fixed at their shortest focal length with adhesive tape, and autofocus and sensor cleaning were deactivated. The images were saved in JPEG format with low compression.
The Canon EOS D6 Mark II with lens f = 24–50 mm has a 26.2 Mpixel full frame CMOS sensor (35.9 mm × 24.0 mm, pixel size 6.5 µm) and an integrated GPS receiver. The Canon EOS 200D with lens f = 10–20 mm has a 24.2 Mpixel CMOS sensor in DX format (22.3 mm × 14.9 mm, pixel size 3.7 µm). The field angles related to the image diagonal are 84° (Canon D6) or 106° (Canon 200D). The duration of the image acquisition was approx. 1.5 h per image set.
Figure 5 shows some examples of acquired images.
Table 3 summarizes the most relevant data for photogrammetric image acquisition.
The image acquisition was designed in such a way that the following criteria were largely met:
High overlap for reliable measurement and matching of feature points;
Combination of vertical and oblique images for optimum geometric intersection conditions;
Combination of close-up images (distance 1–2 m) and long-distance images (5–20 m) to achieve a high object resolution with simultaneous large object coverage by overview images;
Numerous tilted (90° rotated) images for reliable camera calibration;
Small aperture to achieve a sufficiently large depth of field.
2.2.3. Photogrammetric Processing
As mentioned above, the Lurdji project was processed using Photoscan (now Metashape) and with RealityCapture [
2]. The most significant differences between both software packages are processing speed and pricing. In general, RC performs around 10 times faster than Metashape which is a significant advantage in professional projects. However, standard licenses are about 10 times more expensive than Metashape, depending on the license model. Pay-per-use is also possible, as one of many options. In addition, RC allows for the good integration of laser-scan data as described below. Due to the performance and quality of the RC results, the following analysis is restricted to the RC processing.
As for all typical image-based modelling software based on Structure-from-Motion (SfM), the programs expect images with a high relative overlap. Abrupt changes of exterior orientation, e.g., rotating a camera by 90° or large differences in scale, may lead to alignment problems. If different cameras are involved, they should be organized in separate calibration groups so that individual camera calibration is possible. Absolute datum definition is provided by the integration of ground control point coordinates with individual statistical weighting.
RC is characterized by its fast and highly parallel, GPU-based data processing and the possibility of direct integration of laser scanning point clouds. It is implicitly assumed that the laser scanning data is of higher accuracy than the photogrammetric evaluation, i.e., the orientation of the images and the calculated point cloud utilizes the laser scanning as reference. A disadvantage of the program is the limited possibility of influencing the parameter control and the very poor output of statistical parameters of the results. Depending on the model selected for camera calibration, the parameters of the interior orientation are determined separately for each image (image-variant interior orientation) or are common for one camera group. Other parameters (e.g., “Image overlap”) also might have a significant effect on alignment quality, but the behavior of these settings remains unclear even for experienced users. Dense point clouds are not calculated but direct 3D meshing is performed from sparse point clouds.
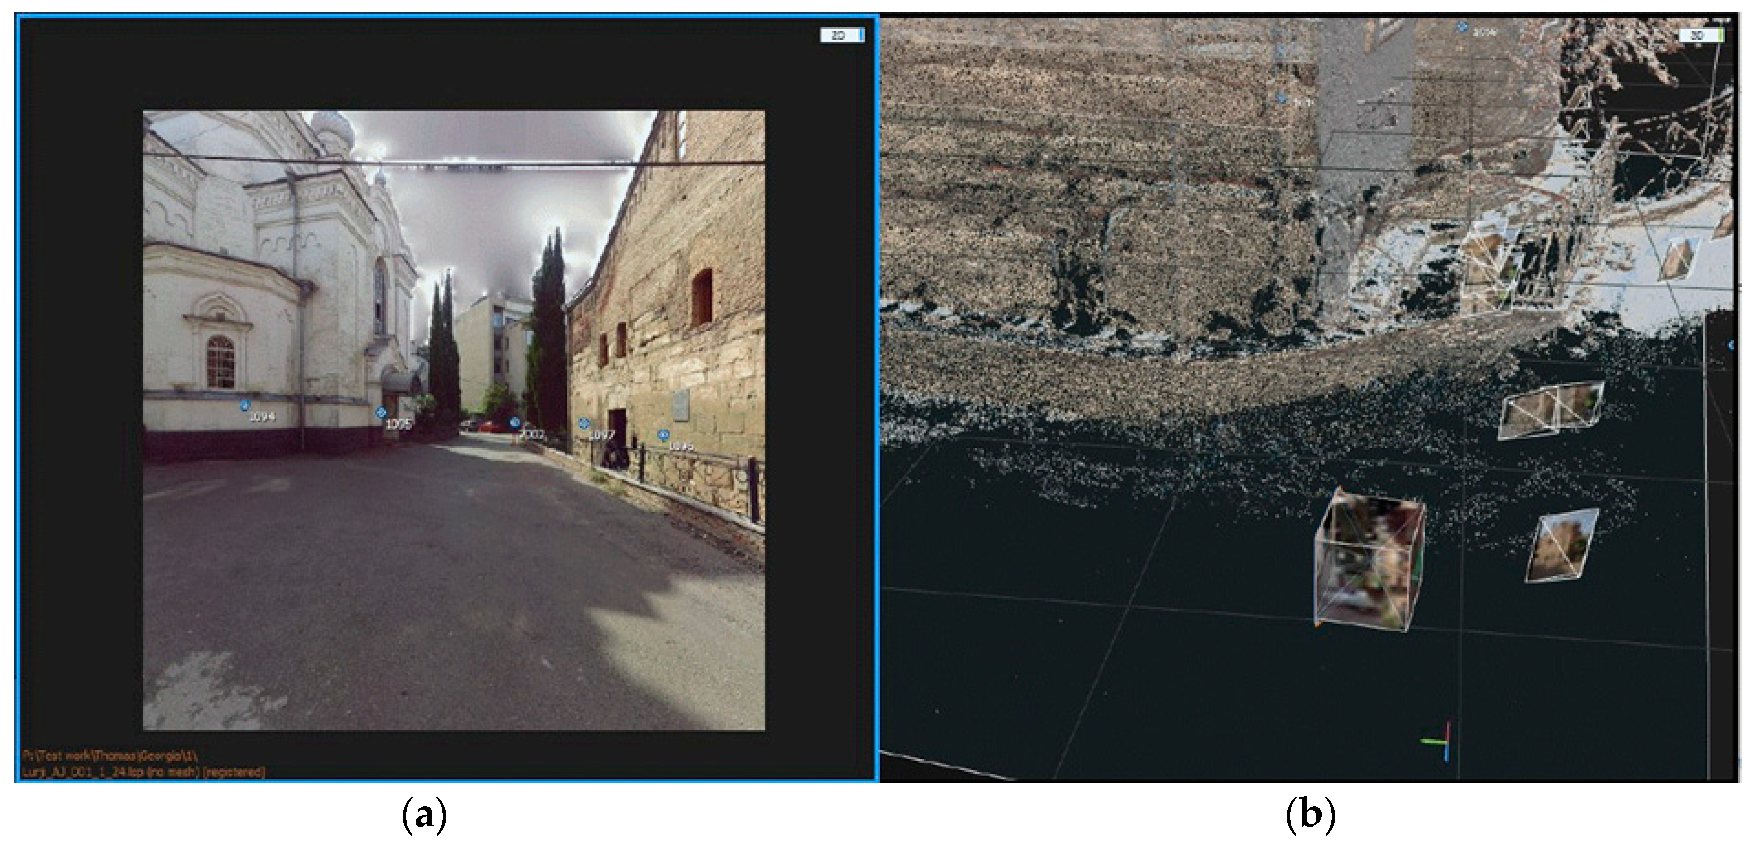
The integration of laser scans in RC is based on synthetic images that are generated from the laser scan point clouds using color or intensity. Similar concepts have been discussed in [
6,
7,
8].
Figure 6a shows an example of synthetic images. The exterior orientation (position) is identical to the standpoint of the laser scan. For that position, six spatial rotations of the image are calculated and which form a cube (
Figure 6b). The interior orientation is fixed to an ideal, error-free synthetic camera. Consequently, the synthetic images are already oriented and calibrated, hence the whole process of image matching and orientation of the other (photogrammetric) images is based on the laser scan framework which allows for a very fast and robust image alignment.
With respect to camera calibration, RC generates parameters that differ significantly from the physical settings. For example, the calibrated principal distance is displayed equivalently to a 35 mm or full-format DSLR camera, hence it uses the focal length extension factor known for small-format digital photography. This approach results in around 27 mm for Mavic Pro, while the physical focal length is about 4.7 mm. For the Canon 200D with 10 mm lens the principal distance was calibrated to around 16 mm. In contrast, Photoscan (Metashape) calibrates both cameras close to the physical focal length. It significantly complicates the comparison of calibration results.
2.2.4. Workflow for Data Fusion
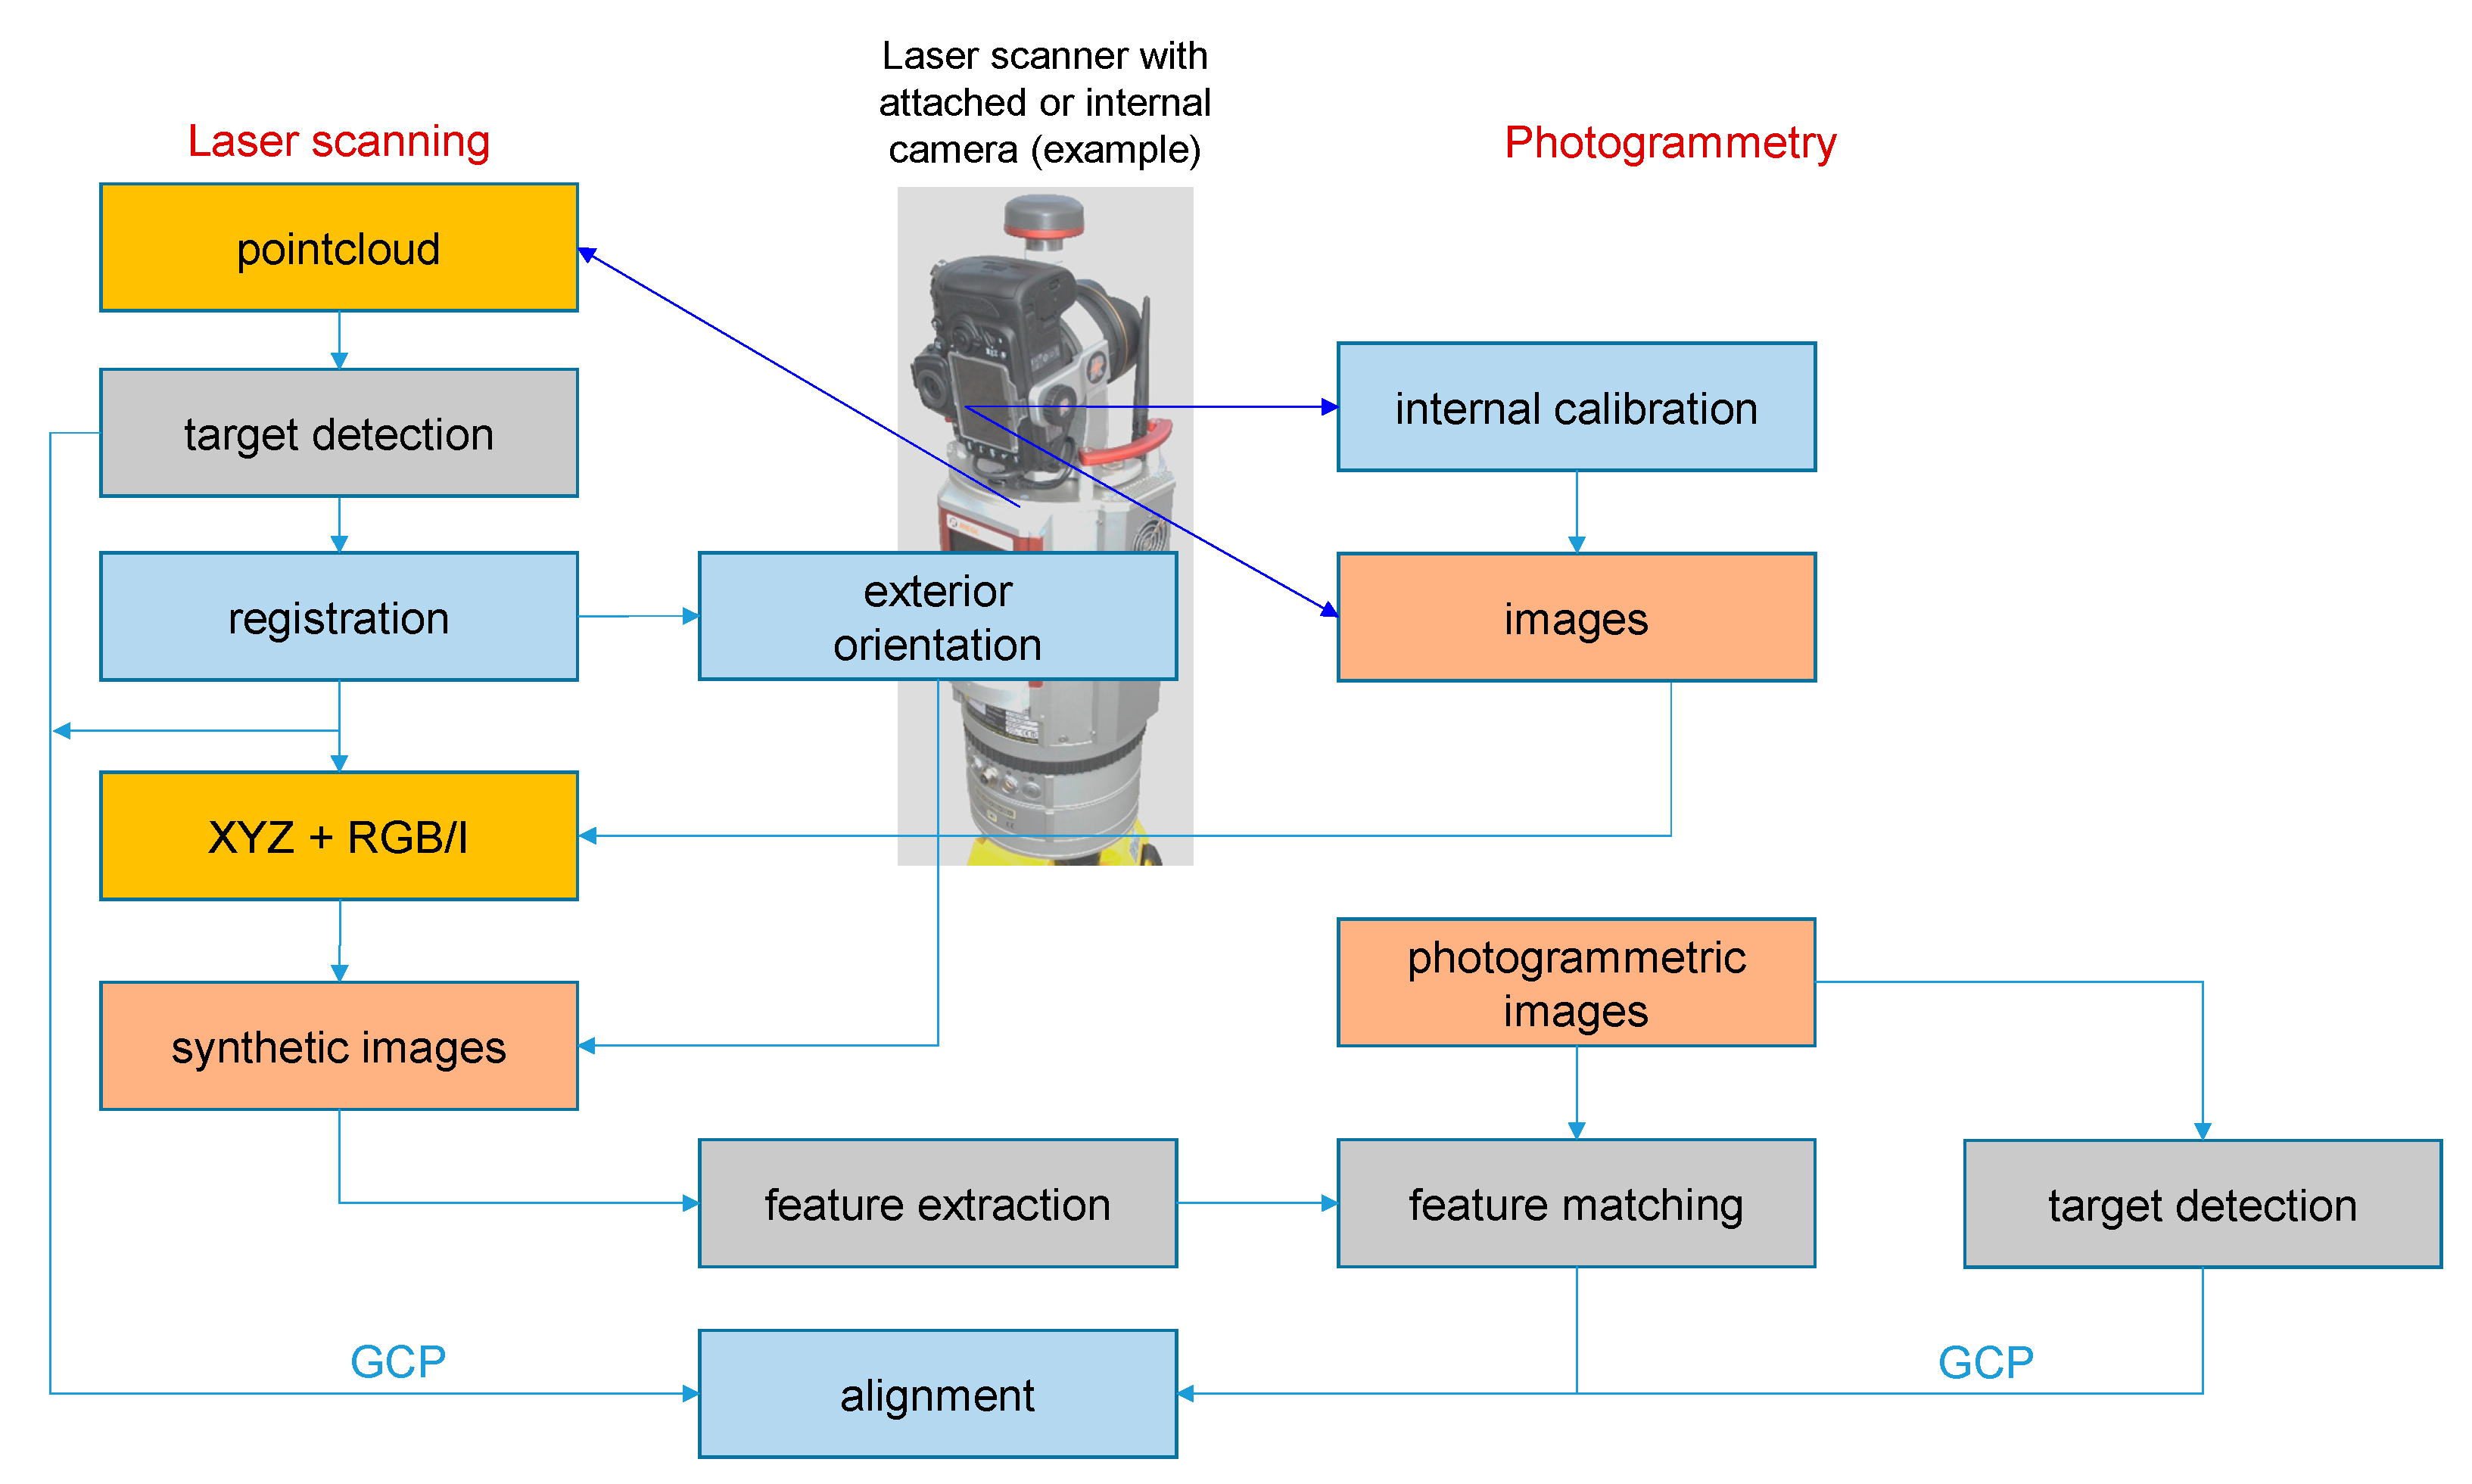
Figure 7 illustrates the basic workflow for fusion of laser scan point clouds and photogrammetric images. The single laser scans are registered by means of targets (see
Section 2.1.1) which are detected automatically by the registration software, or which are measured manually if their visibility is poor. The registration is finalized by an ICP-based optimization process which then provides the coordinates (exterior orientations) of each laser scan station and the final coordinates of the ground control points (GCP).
If the laser scanner incorporates a built-in camera, the camera is normally calibrated in the factory and hence its interior and exterior orientation are given in the laser scanner’s internal coordinate system. Consequently, images acquired by the laser scanner are already oriented in space, and after registration the orientation parameters refer to the coordinate system of the registration process. Consequently, the registered point cloud can be colored using the RGB pixel values from the integrated camera. If no camera picture is available, the intensity values of the reflected laser beam can be used which, however, lead to reduced image information.
As discussed in
Section 2.2.3, synthetic images can now be generated which have the exterior orientations given by the scanner stations.
Additional photogrammetric imagery, e.g., taken from UAV flights, are now aligned to the synthetic images. After coarse alignment, feature detection and feature matching can be conducted between all images. Taking the GCP coordinates from the registration into account, the final alignment (bundle adjustment) can be performed.
The main advantage of this procedure is the possibility to close gaps in the point clouds if parts of the objects are only visible from one or the other measuring system. For the current case studies, missing parts of the roofs in particular, and some other hidden areas, were able to be covered by photos. In addition, images may have a better resolution than the laser scan point cloud, thus fusing photogrammetric images with laser scan data can result in higher density and quality of the final point cloud and 3D model.
3. Case Studies
3.1. Lurdji Monastery
The Lurdji Monastery is an orthodox architectural complex in Tbilisi (
Figure 8). The monastery was founded in the 7th century, and the oldest parts date back to the 12th century, which corresponds to the reign of Queen Tamar. In the 16th century the monastery was destroyed by Persians and restored only a century later. Currently, the sacral complex consists of two churches and the associated historical Vera park. After its destruction, the Andreas Church was restored in the 17th century as a basilica with a three-part nave. At the end of the 19th century, the church was reconstructed according to a project by A. Chizhov and received a new spherical dome, which was not typical for Georgian architecture. This dome was replaced in 1995 by a classic Georgian conical dome. The roof, once covered with blue ceramic tiles, is now made of blue-grey painted zinc sheets. The roof design determined the name of the monastery: “lurdji” means blue. Due to the various alterations, the church is not in the typical style of Georgian churches with a cruciform ground plan. Instead it has a rectangular form with a cross-roof and a central tower, which has a cylindrical base and a conical top. Further information is available from [
10,
11].
The church measures approximately 17 m × 12 m × 25 m (W × L × H). It is located in the middle of a built-up residential area with the park on the edge, so that access from the ground was sometimes very restricted. The material of the outer walls consists of sandstone or brick and has a natural roughness as well as broken out places, which resulted from weathering and wear. The roof surfaces mostly have limited texture.
For this church the measurement of the external surface was determined. Three UAV flights, two terrestrial DSLR image sets and two laser scan measurements were conducted.
Figure 9 shows the distribution of targets and the configuration of image blocks around the building.
In the Lurdji project all images from all cameras were evaluated together with the Faro point cloud including 22 GCPs. In this process, 1100 of 1570 images were orientated fully automatically. Only in some areas of the roof and the spire did the automatic image orientation fail, as either predominantly homogeneous (textureless) object surfaces or strong variations between foreground (cross) and background (trees, park) occurred. For camera calibration, a model with three radially symmetric and two tangential distortion parameters was chosen. The mean re-projection error (Sigma 0) is 0.6 pixels. The root mean square (RMS) error in object space is about 5 mm.
The surface triangulated in RC consists of approx. 140 million triangles. The computing time for the alignment on a computer with i7 6700k processor, 64GB RAM and Nvidia GTX980TI graphics card was about 7 min. The calculation of the dense point cloud and meshing (quality level medium) took about 4.5 h.
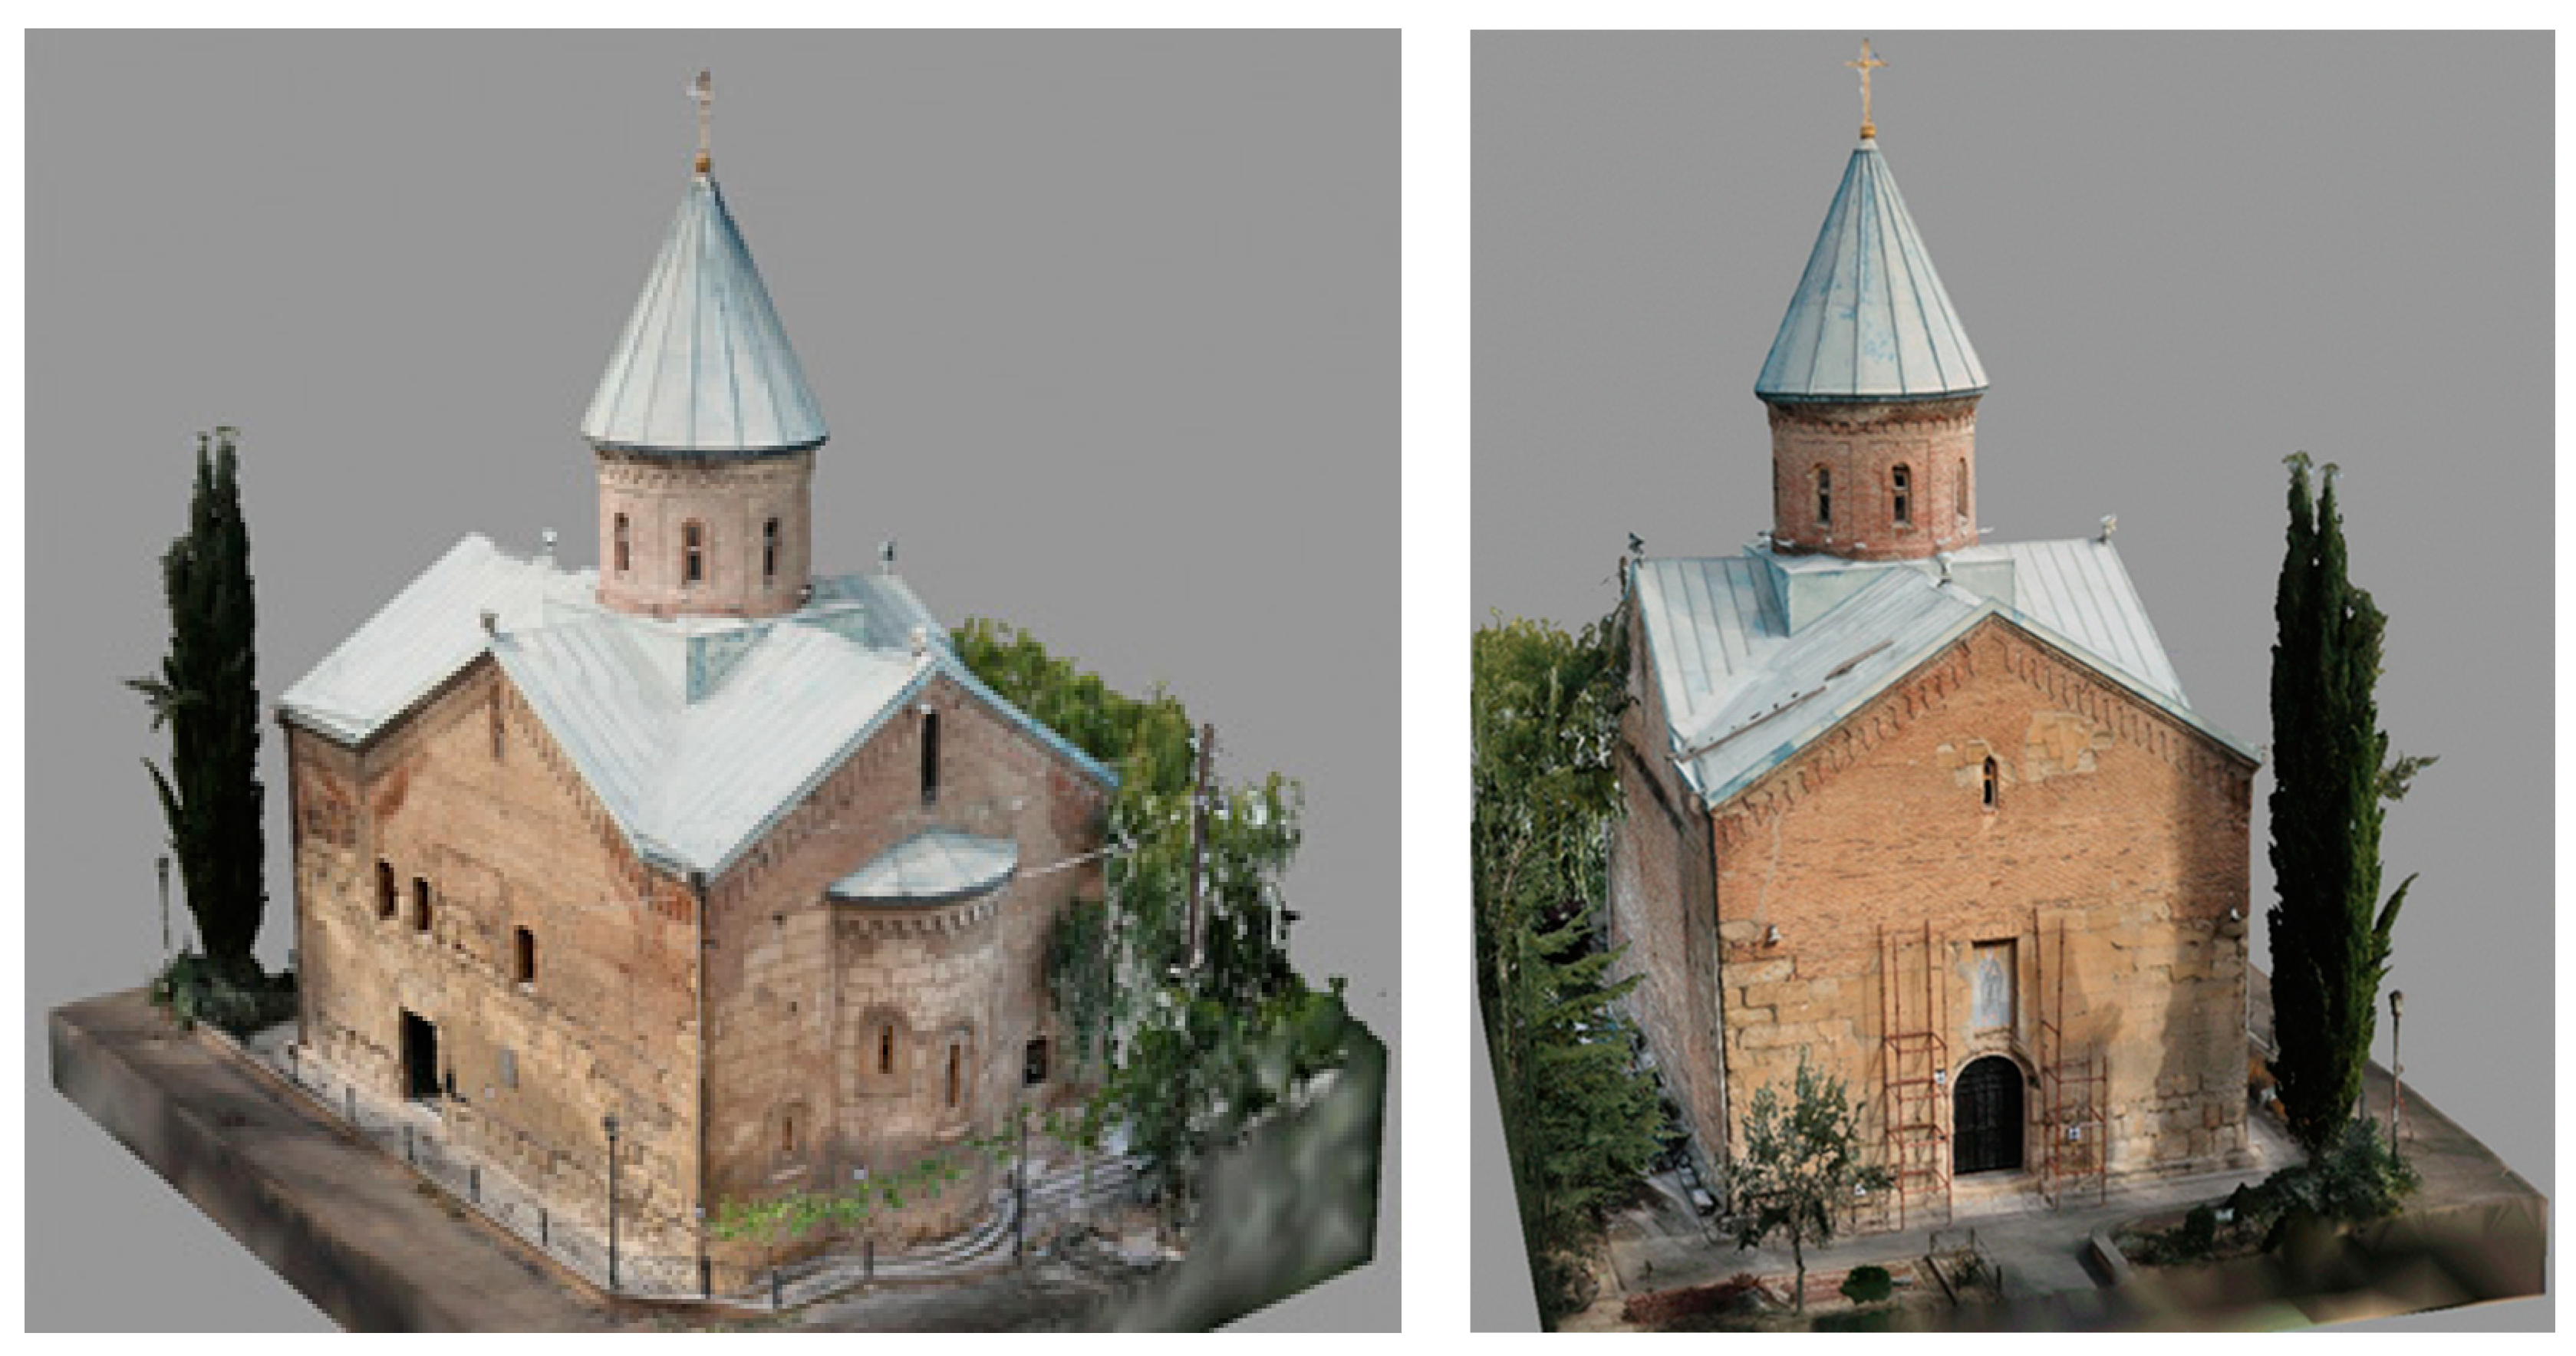
Figure 10 shows the calculated 3D meshed model (approx. 5 mm point spacing). The high quality is demonstrated in two ways. Firstly, by the completeness of the overall model. Secondly, detailed views also show how well the object was reconstructed, especially on the sides that are difficult to access (
Figure 11).
Fine details such as the scaffolding at the entrance or the filigree cast-iron fences at the rear are reconstructed correctly. Only the cross on the top of the tower still shows “shadows” caused by missing pictures.
3.2. Sioni Cathedral
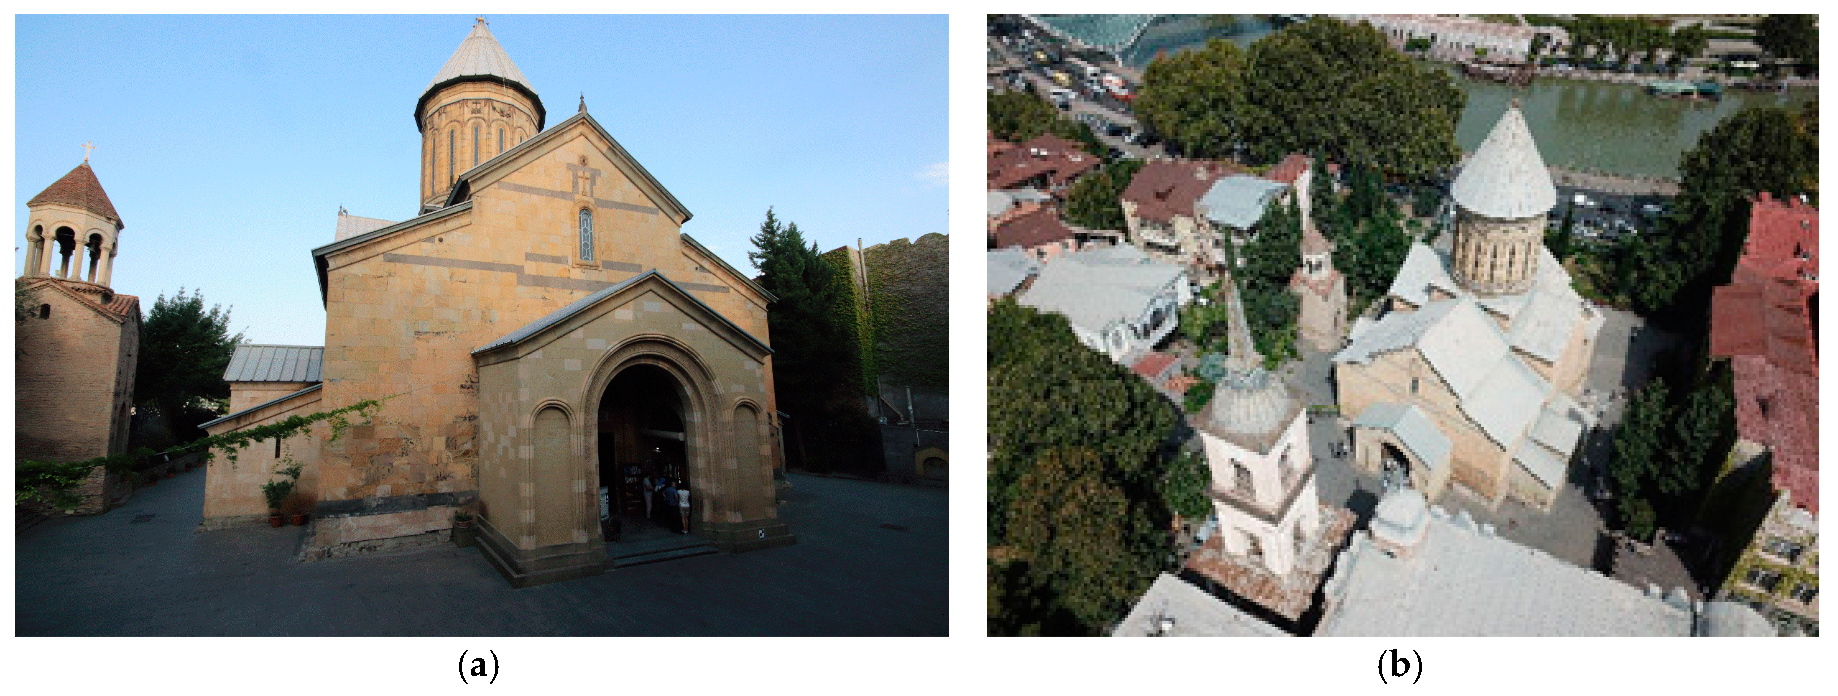
The Sioni Cathedral is the historical main church of the city of Tbilisi and one of the most important centers of Georgian orthodoxy (
Figure 12). The construction of the original church was begun in the 6th century by the Georgian king Wachtang I. Gorgassali. Its final construction dates back to the 7th century. This first church was completely destroyed after the establishment of the Tbilisi Emirate. The new Sioni Cathedral was built in the 12th century and underwent several destructions and reconstructions (17th and 18th centuries). After its restoration in 1980–1983, the church retained its medieval appearance and stylistically corresponds to the classical pre-Mongolian religious architecture of Georgia.
The church measures approximately 34 m × 30 m × 37 m (W × L × H). It is located in the historical town center and visited by a large number of tourists and local people. The material of the outer walls consists of sandstone and the roofs are covered with sheet metal offering limited texture. The building was recorded both from the outside and from the inside. In total, two UAV flights, three terrestrial DSLR image sets and four laser scan measurements were carried out in the interior and exterior.
Figure 13 shows the distribution of targets and the configuration of image blocks around the church.
Data processing follows the scheme of the Lurdji project. In this case, both BLK and Faro point clouds have been used separately. All images from the UAV and the two Canon cameras have been processed simultaneously. Altogether, 664 UAV images, 280 + 738 terrestrial images and 132 synthetic cube images have been processed. For the BLK point cloud, 1779 images in total could ultimately be aligned while 1700 images have been oriented to the Faro data. From 36 GCPs available from the laser scans, only 16 have been measured within the photogrammetric images. Note also that a number of targets were removed from the church walls by local people during the acquisition with the D6 and 200D.
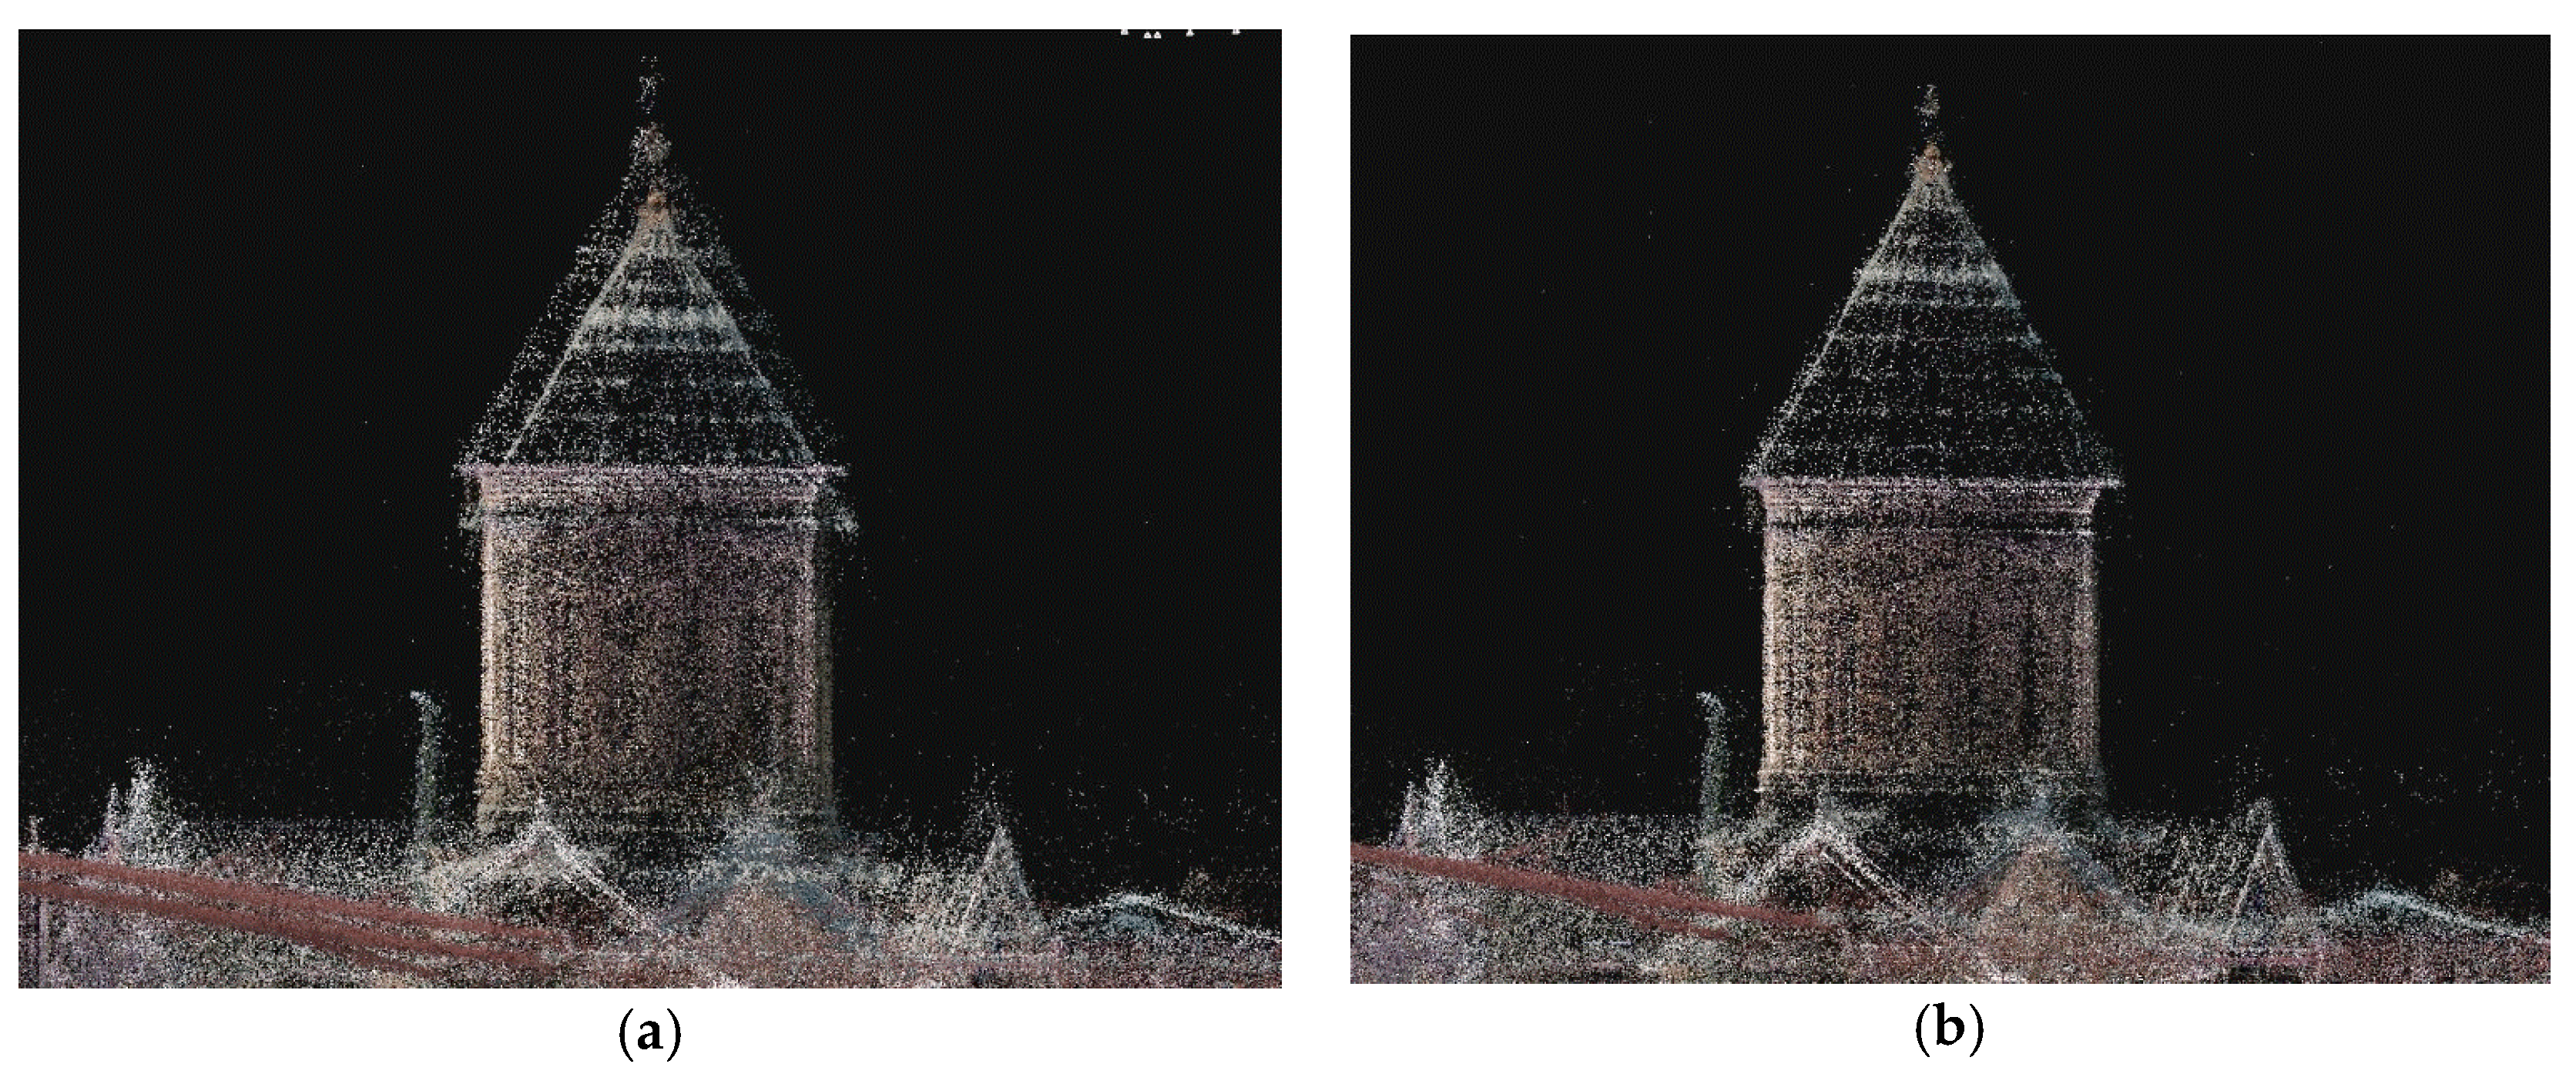
As discussed above, the operation in RC is not straightforward.
Figure 14a shows point clouds at different scales that may result if the camera calibration setting is modified. In this case, all camera images were treated as one group, so RC obviously failed with camera calibration. If the different cameras are organized as separate calibration groups, the results look much better (
Figure 14b).
Finally, the best result shows a re-projection error of 0.6 px and average RMS errors of 7 mm to 20 mm for GCPs for both BLK and Faro data sets. With respect to the difficult environmental conditions, the results are acceptable.
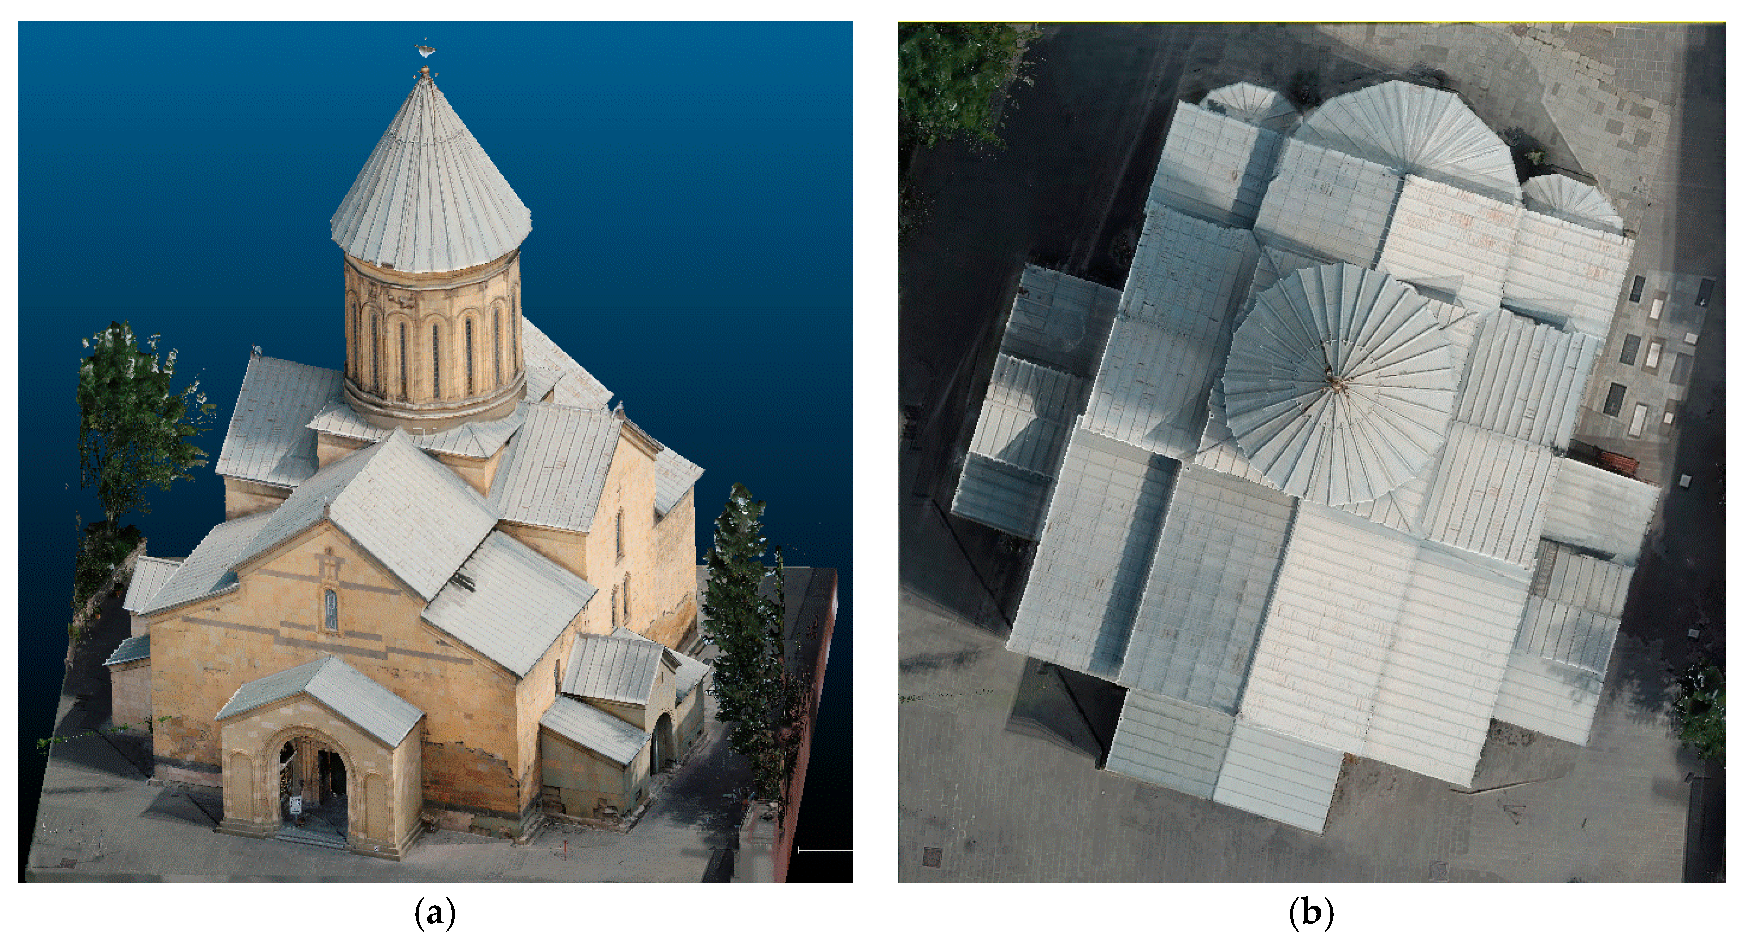
Examples of the final 3D model using the BLK point cloud are displayed in
Figure 15a. The model consists of about 220 million triangles.
Figure 15b shows a top view of the roof structure which has been reconstructed mainly by the UAV images.
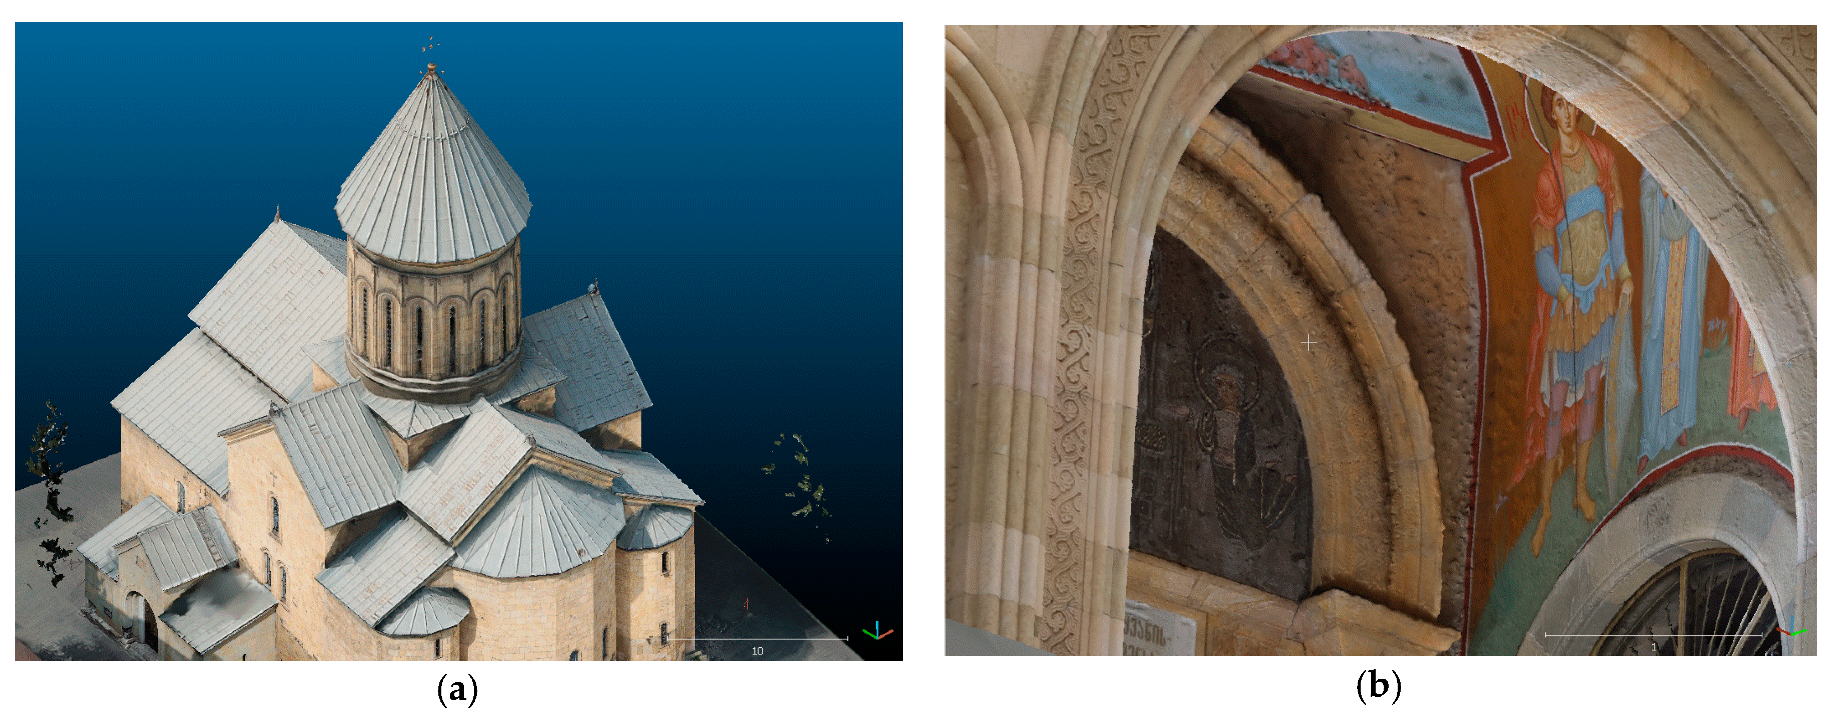
Figure 16a displays the 3D model using the Faro scans while
Figure 16b gives an example of the level of detail and completeness of the entrance hall.
Some inconsistencies remain and can be observed at the tower.
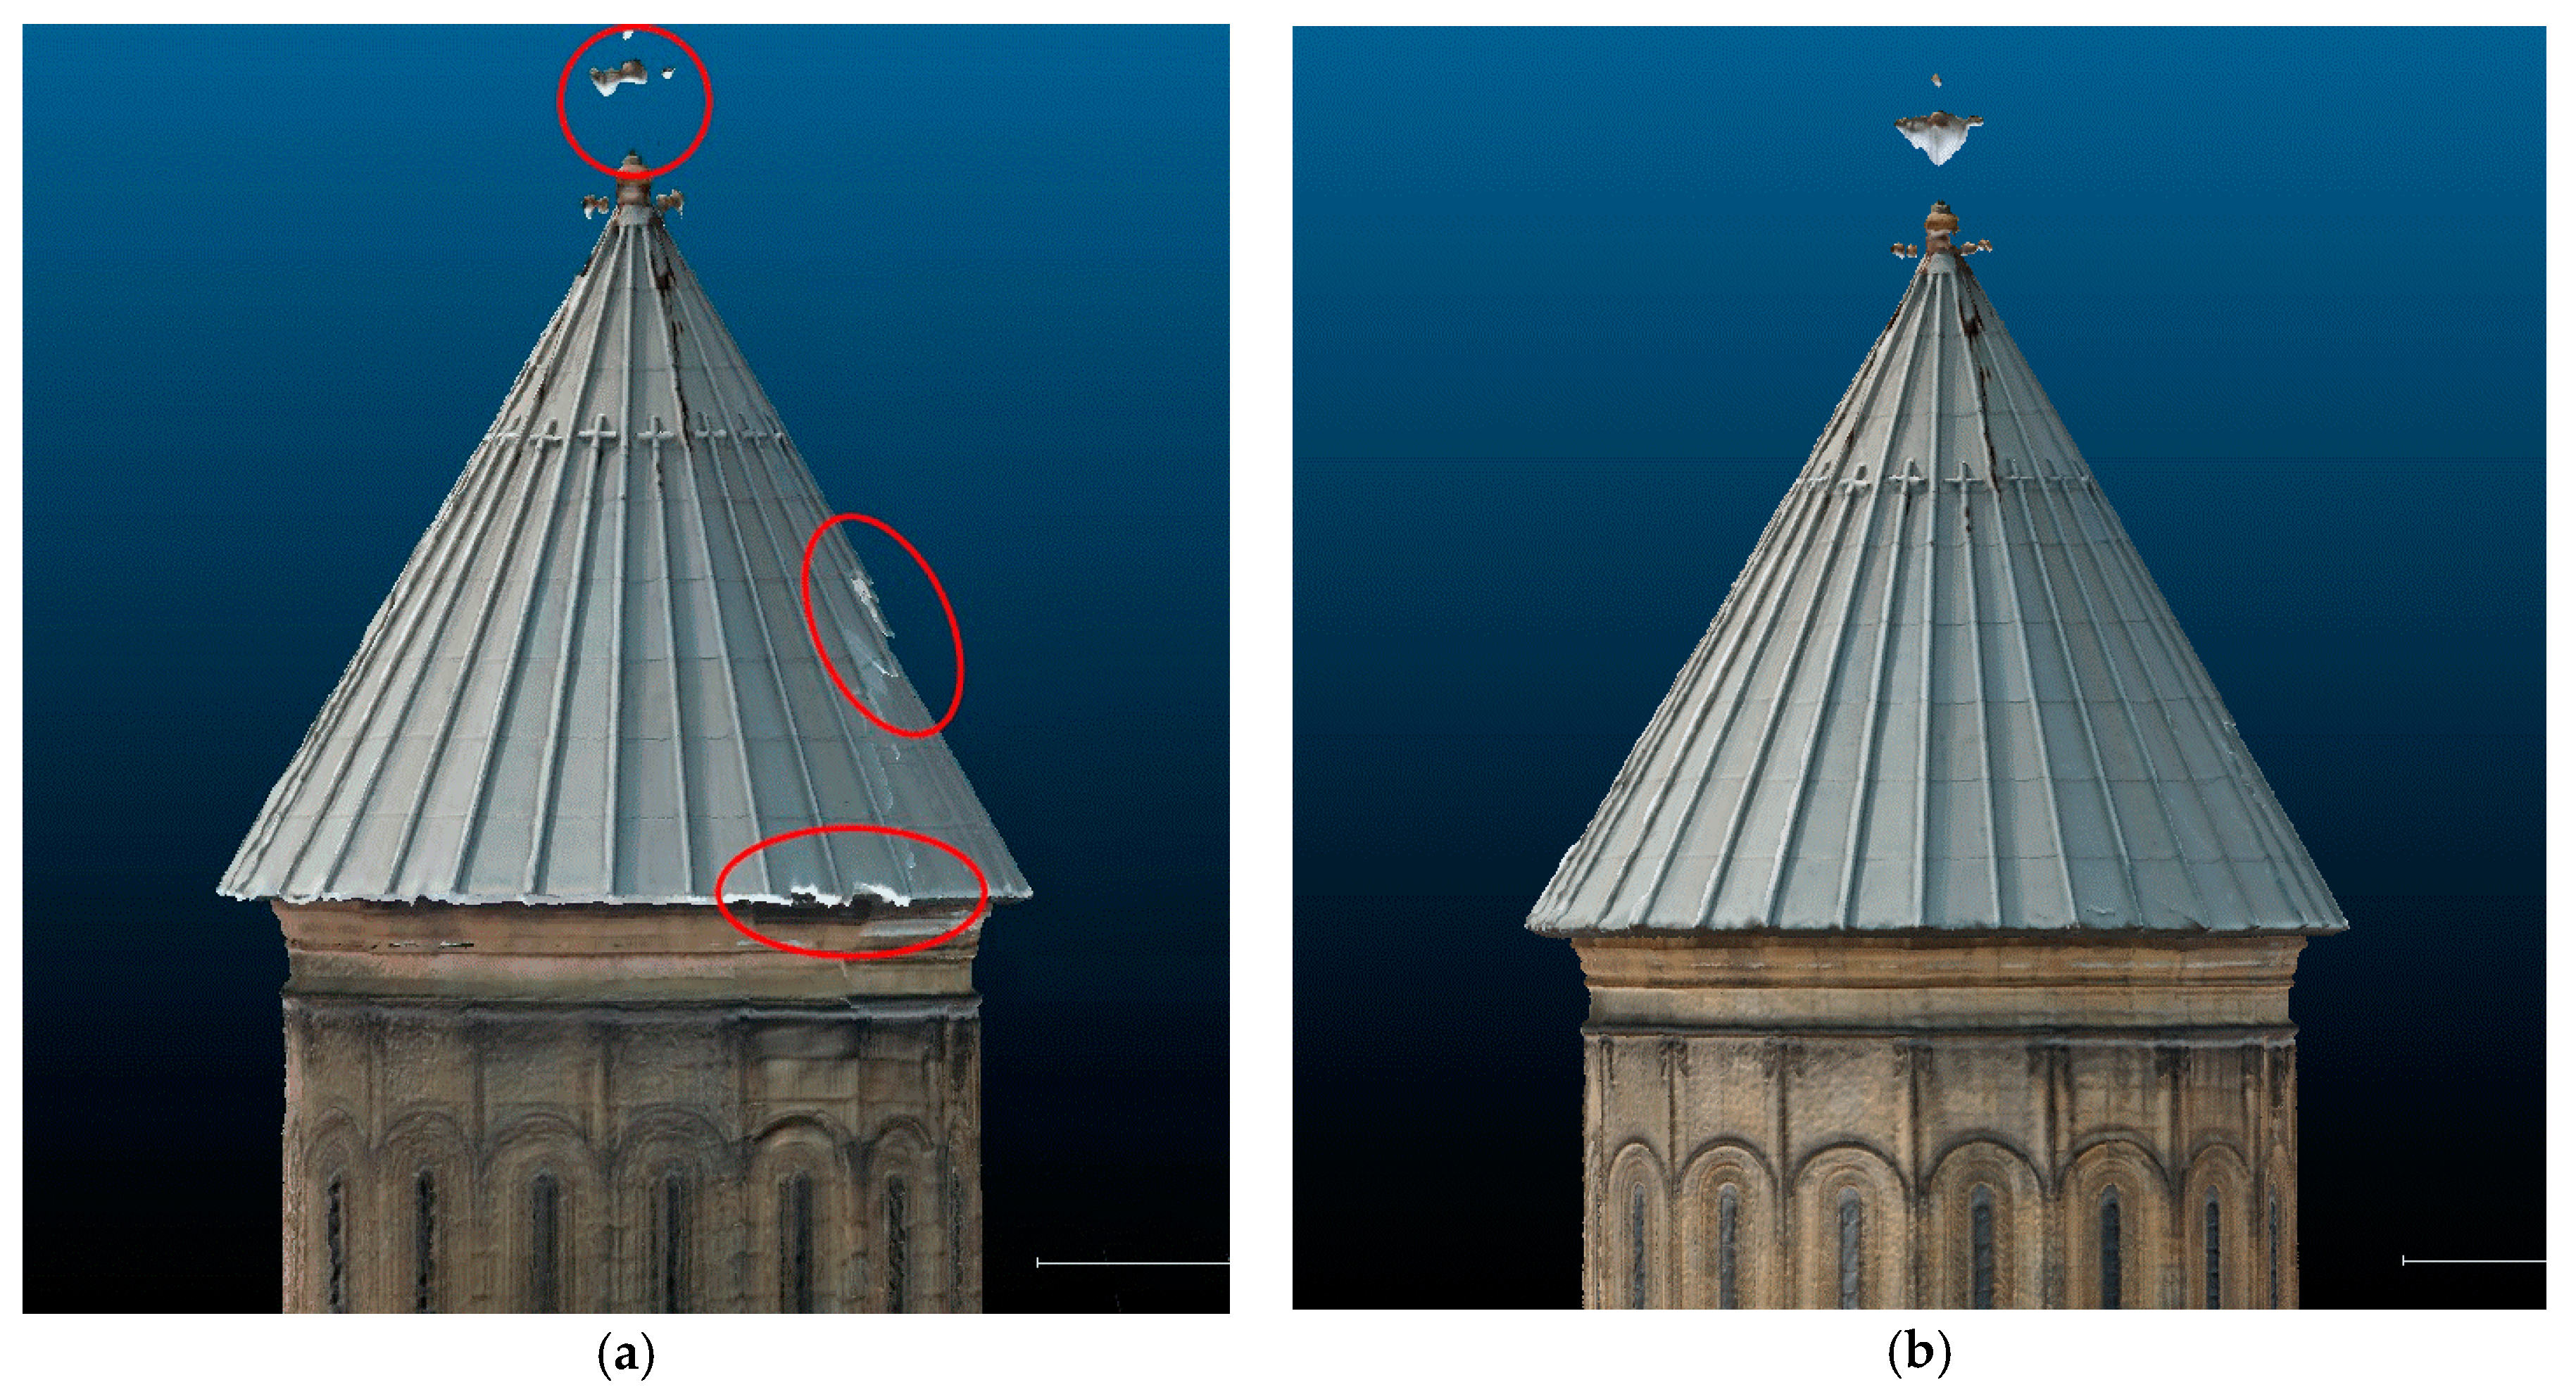
Figure 17a shows the 3D model based on the BLK point cloud, UAV and Canon 200D images (without Canon D6). There are still some major gaps in the point clouds which may result from error propagation of laser scan registration with increasing height. Since no GCP targets were available on the upper parts of the building, there is only limited control of the geodetic network. In addition, image resolution decreases with height.
Figure 17b displays the same region but making use of the Canon D6 imagery. It can be observed that meshing quality is higher and fewer errors occur. In general, for the UAV flight it would be desirable to have one more circular flight around the tower with horizontally arranged viewing directions.
4. Analysis of Results
The two presented case studies are used to investigate the practical application of data fusion of terrestrial laser point clouds with UAV and terrestrial images. Both test objects differ in size, accessibility and complexity. The camera equipment can be regarded as low-cost systems which holds also for the laser scanners. Both Faro and BLK belong to a cheaper class of systems on the market.
The acquired images were recorded using high relative overlaps which were easy to achieve for the UAV data due to regular flight conditions. However, for the terrestrial images optimal camera stations could not always be selected. For both data sets, UAV and terrestrial, large changes in image scale and GSD occur (see
Table 2). These scale differences resulted in a number of images that could not be aligned. However, the number of images not aligned is less than 6%.
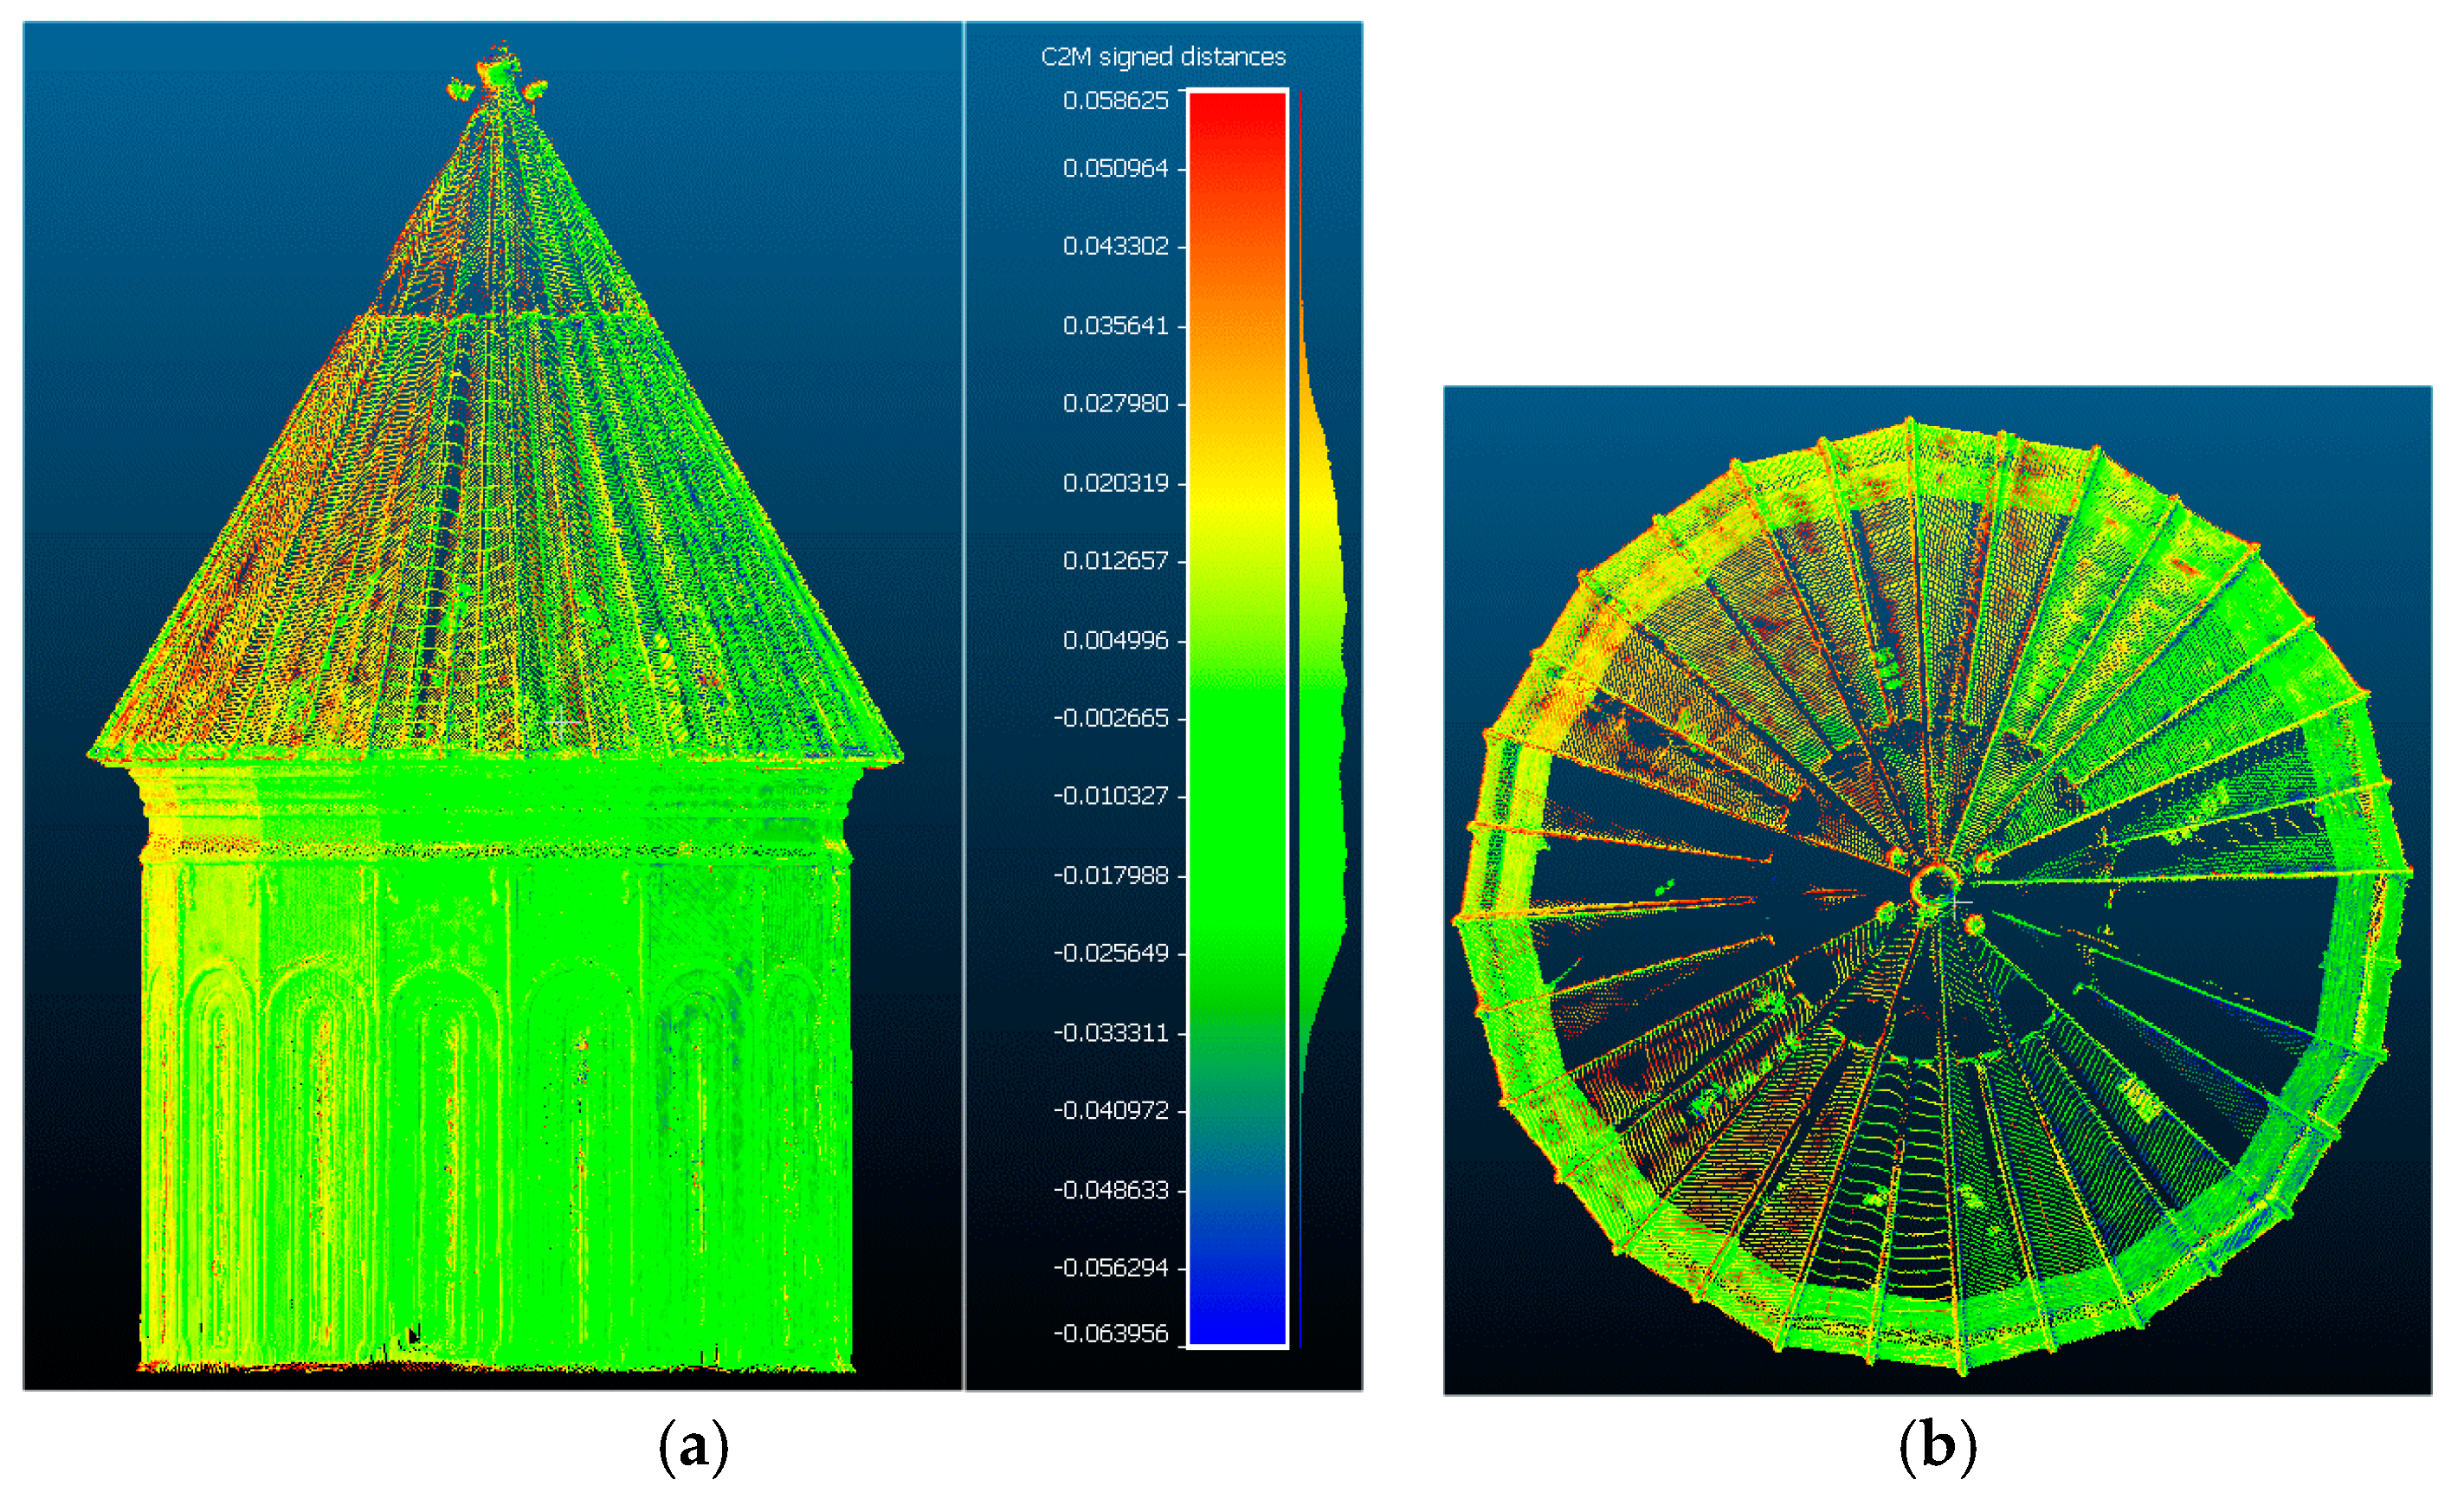
Figure 18 shows a comparison (cloud-to-mesh) of the point cloud calculated with RealityCapture with all image data and Faro point cloud, compared to the reference from the Faro laser scan, without any ICP adjustment. It can be seen that the TLS point cloud contains a large number of holes especially around the cone. For the RC mesh model, these areas are filled by the UAV images. The average error is in the order of 2 cm with maximum errors of about 5 cm in the top regions. It should be pointed out again that there are no GCPs in the upper part of the building, hence with increasing height and distance the overall accuracy of the model will get worse. However, the capability of adding photogrammetric images, namely from UAV, serves for contributes to a higher stability and completeness of the final point cloud.
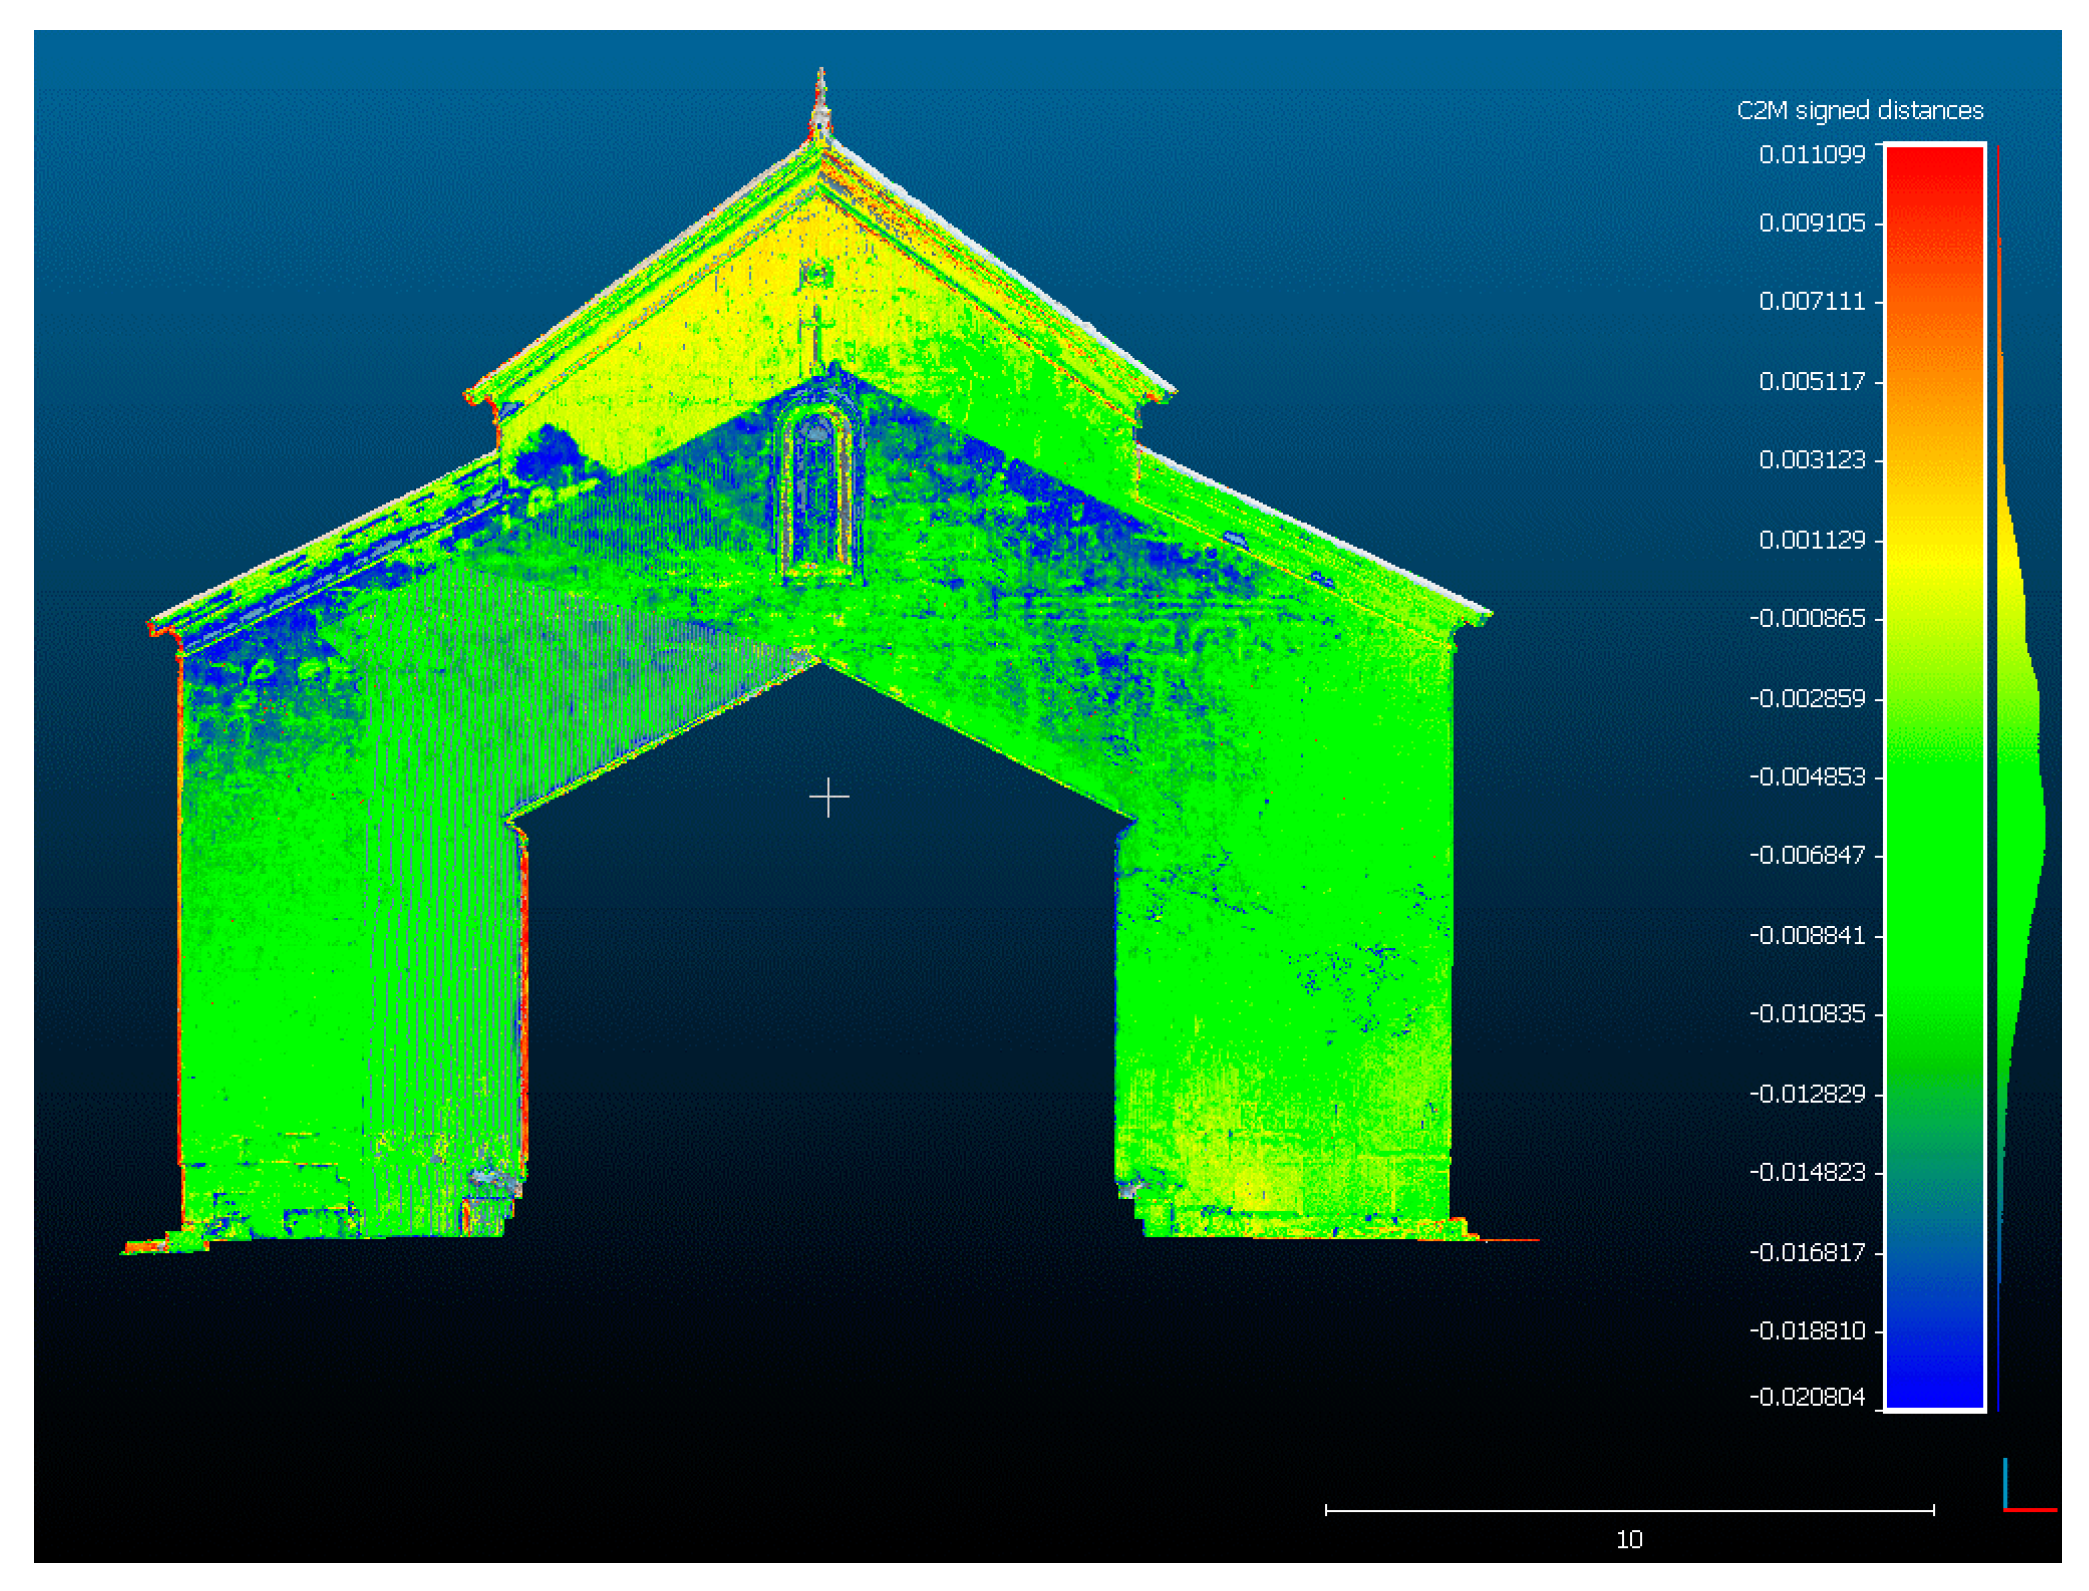
For lower building parts the relative deviations between TLS point cloud and RC model are much smaller. As shown in
Figure 19 for the entrance region, most deviations are in the order of 3 mm or better which corresponds to the accuracy of the Faro scanner. The blue colored areas with higher deviations are related to parts of the buildings which were less visible to the laser scanner due to the entrance portal in front (cut out in
Figure 19). A systematic offset between both point clouds of –5 mm can be observed. Altogether, the achieved accuracy for the Sioni case study is about a factor 2 worse than for the Lurdji project, mainly due to the larger object size and the missing UAV images closer to the tower. Details about the Lurdji results are given in [
2].
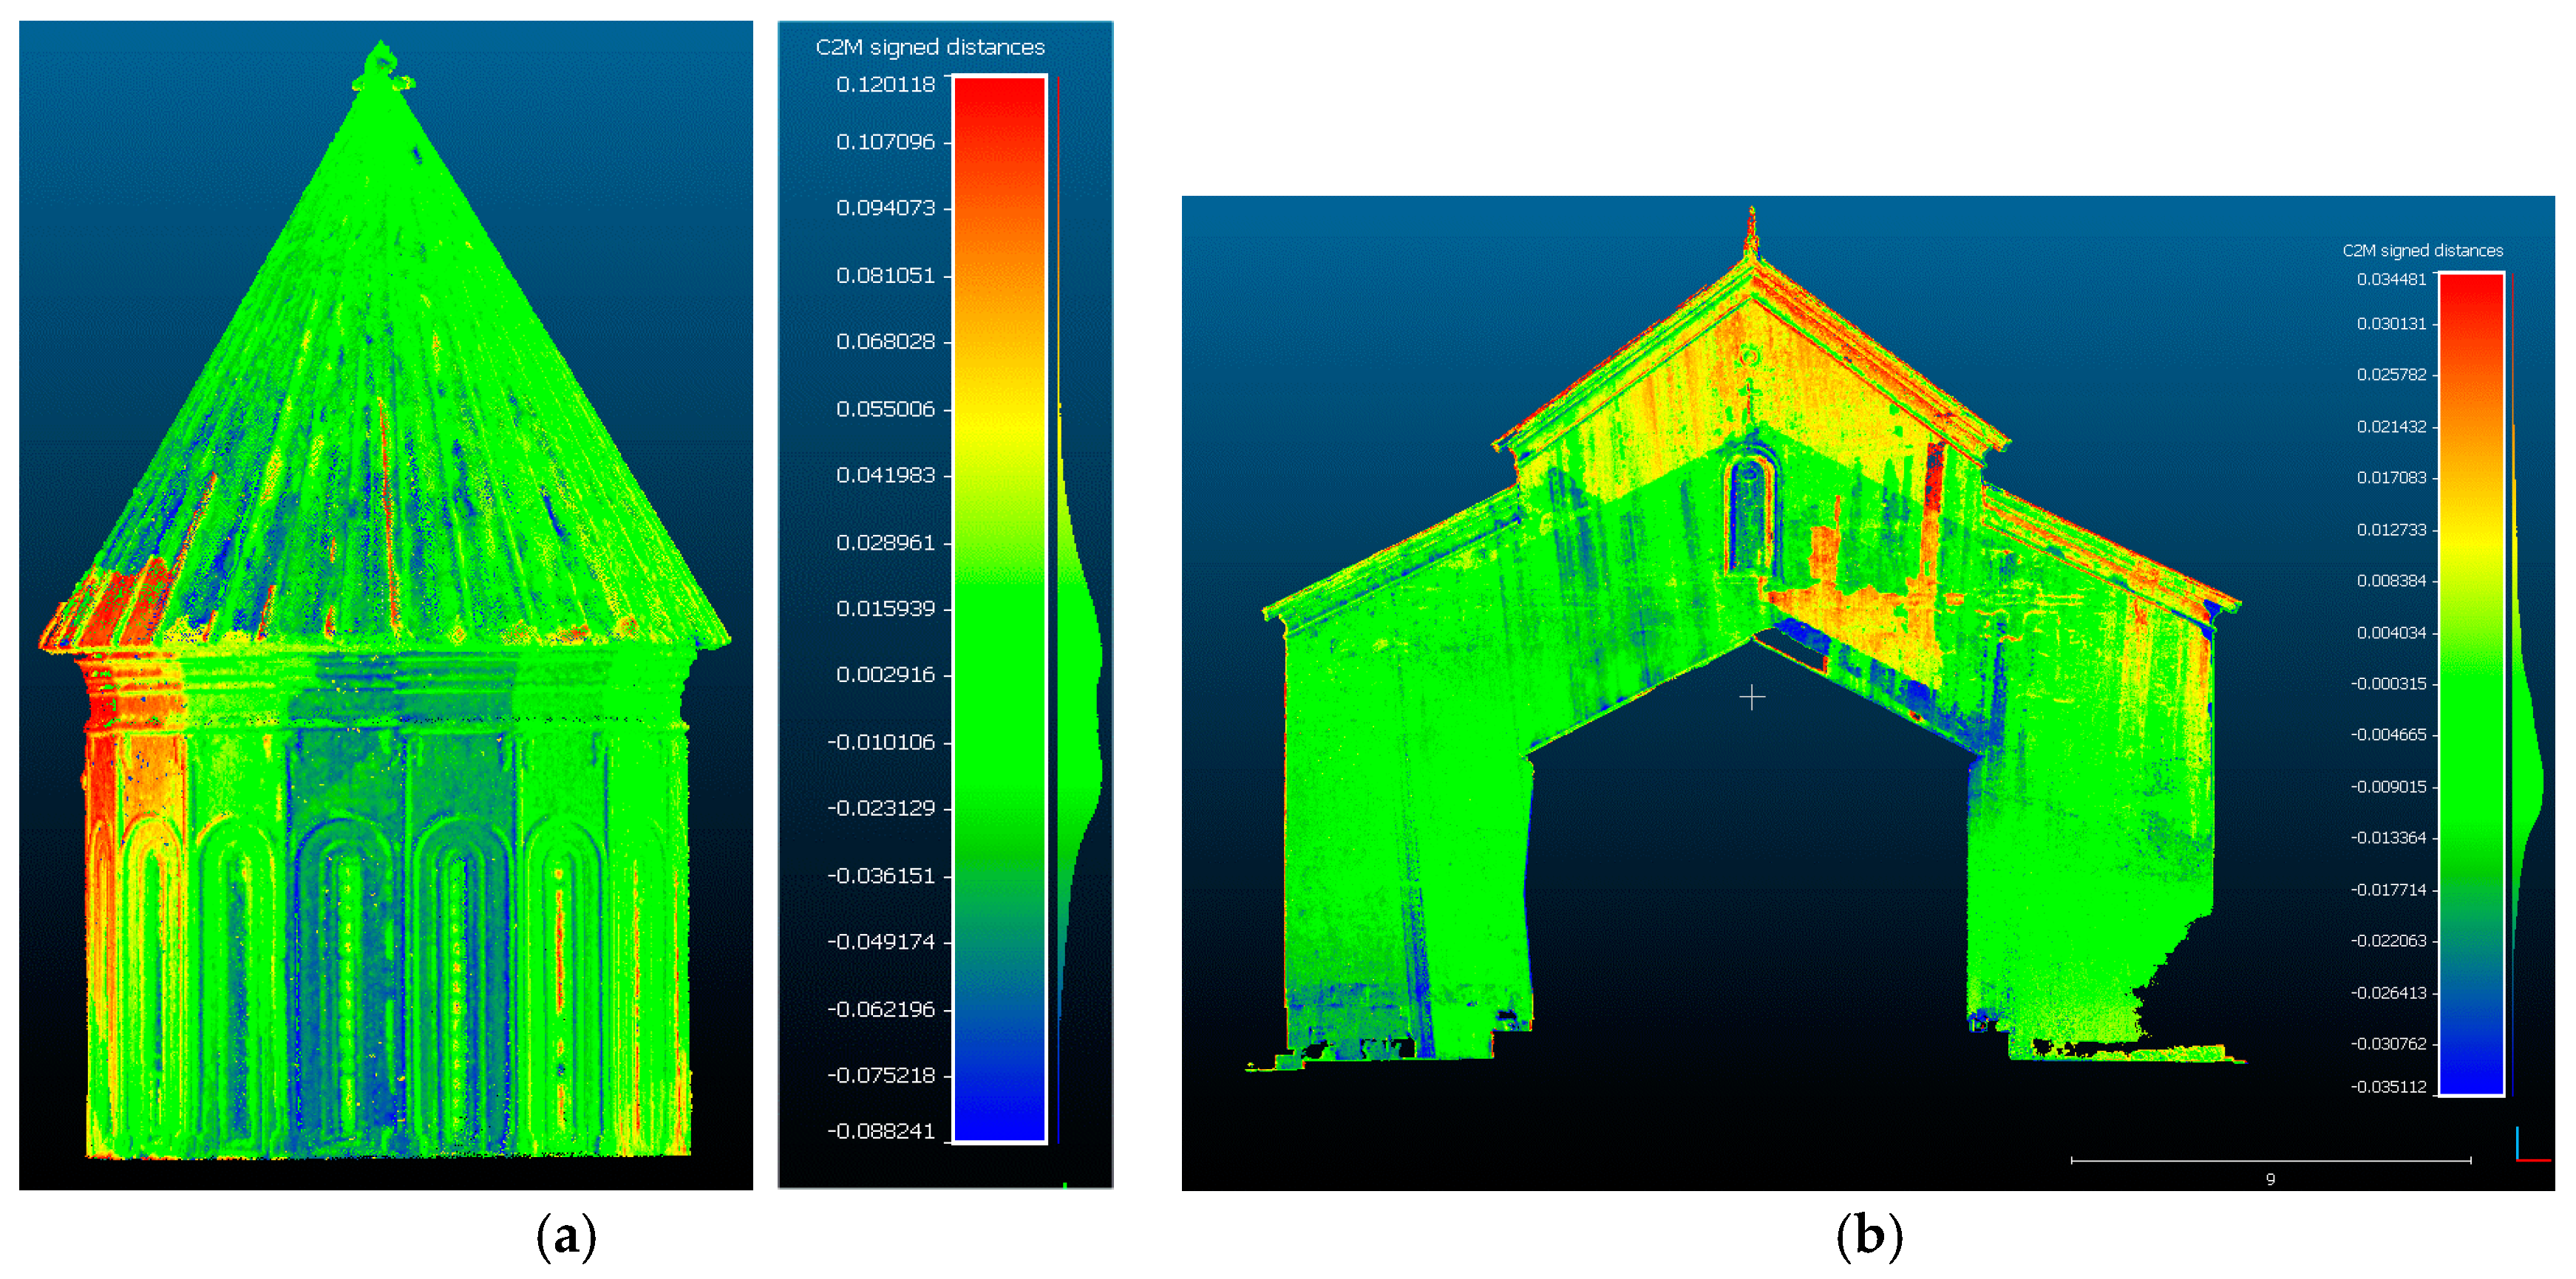
Figure 20a displays a comparison between the RC models using the Faro and the BLK point clouds for the tower region. Both regions have been adjusted by ICP before cloud-to-mesh analysis. The error map indicates larger regions with systematic deviations which may reach up to 12 cm. The source of deviations has still not been investigated but possible reasons may be due to the lower accuracy of the BLK scanner, inaccurate alignment of images and/or remaining errors in laser scan registration.
Figure 20a shows the same analysis for the entrance regions where maximum deviations of about 3 cm are visible while most of the errors are below 1 cm.
Altogether, the result of the photogrammetric evaluation shows that an average standard deviation of the 3D points of approx. 5–10 mm in object space is achievable for object areas of good visibility. It should be noted that the GCP coordinates were taken from the laser scan and not measured by total station (with possible higher accuracy). The distribution of GCP on site was not optimal, e.g., targets could only be placed near the ground. In addition, some targets disappeared between separate data recordings.
If UAV imagery is to be combined with terrestrial laser scanning and hand-held images, the design and distribution of targets must be optimized. Users should ensure that targets can be measured from all sensor data, e.g., by using tilt & turn targets.
The displayed point clouds and 3D models are raw data without any filtering or manual post-processing. For subsequent applications or visualizations, however, they must still be processed and cleaned.
5. Conclusions
This report presents results of an extensive measurement campaign carried out in Georgia in September 2018. The initial aim was to evaluate the use of different measurement systems and evaluation methods for the 3D reconstruction of historical churches under real conditions in order to gain experience for future projects. Basically, terrestrial laser scanning and photogrammetric methods based on Structure-from-Motion provide similar results. If both technologies are combined, 3D models can be generated which are almost complete.
The advantage of laser scanning is the reliable capture of point clouds without the need for special engineering know-how. The prerequisites are stable positions and sufficient mutual overlaps or control point configurations. The time required for recording in the field was 2–5 times that of a photogrammetric image recording with the devices used. The Leica BLK360 laser scanner has proven to be a suitable device that delivers reliable results within its specifications.
The UAV-supported photogrammetry allows for the measurement of roof and tower areas that cannot be seen by TLS or terrestrial images. The use of even a simple, inexpensive drone has proven to be practical here. The terrestrial images can then be evaluated without any problems if a large overlap (approx. 80–90%) is ensured. The processing of individual terrestrial images was not easily possible, but in combination with the UAV images almost all images could be oriented. The overall accuracy of approx. 5–10 mm is similar to laser scanning. Depending on the hardware and software equipment, the required computing times may not be practicable due to the high number of images. However, RealityCapture’s highly parallel solution shows that optimized implementations with simultaneous TLS data fusion are possible and lead to high-quality results.
Further investigations are planned for the future, in which more intensive analyses of the camera calibration and the dense point clouds will be carried out. It is also planned to test further SfM programs with these data.
Author Contributions
This article is a joint work of all authors together. All authors have read and agreed to the published version of the manuscript.
Funding
This research received no external funding.
Acknowledgments
The authors would like to thank Nino Chachava from Georgian Technical University and her team for the great support of the work in Tbilisi.
Conflicts of Interest
The authors declare no conflict of interest. The funders had no role in the design of the study; in the collection, analyses, or interpretation of data; in the writing of the manuscript, or in the decision to publish the results.
References
- Chizhova, M.; Korovin, D.; Gurianov, A.; Brunn, A.; Luhmann, T.; Stilla, U. A general Approach for the Reconstruction of Complex Buildings from 3D Pointclouds Using Bayesian Networks and Cellular Automata. In Latest Developments in Reality-Based 3D Surveying and Modelling; Remondino, F., Georgopoulos, A., González-Aguilera, D., Agrafiotis, P., Eds.; MDPI: Basel, Switzerland, 2018; pp. 74–92. [Google Scholar]
- Luhmann, T.; Chizhova, M.; Gorkovchuk, D.; Hastedt, H.; Chachava, N.; Lekveishvili, N. Combination of terrestrial laserscanning, uav and close-range photogrammetry for 3d reconstruction of complex churches in georgia. ISPRS Int. Arch. Photogramm. Remote. Sens. Spat. Inf. Sci. 2019, 2, 753–761. [Google Scholar] [CrossRef]
- Adamopoulos, E.; Tsilimantou, E.; Keramidas, V.; Apostolopoulou, M.; Karoglou, M.; Tapinaki, S.; Ioannidis, C.; Georgopoulos, A.; Moropoulou, A. Multi-sensor documentation of metric and qualitative information of historic stone structures. ISPRS Ann. Photogramm. Remote. Sens. Spat. Inf. Sci. 2017, 1–8. [Google Scholar] [CrossRef]
- Kersten, T.P.; Hinrichsen, N.; Lindstaedt, M.; Weber, C.; Schreyer, K.; Tschirschwitz, F. Architectural Historical 4D Documentation of the Old-Segeberg Town House by Photogrammetry, Terrestrial Laser Scanning and Historical Analysis. In Digital Heritage. Progress in Cultural Heritage: Documentation, Preservation, and Protection; Springer Science and Business Media LLC: Berlin/Heidelberg, Germany, 2014; Volume 8740, pp. 35–47. [Google Scholar]
- Remondino, F. Heritage Recording and 3D Modeling with Photogrammetry and 3D Scanning. Remote Sens. 2011, 3, 1104–1138. [Google Scholar] [CrossRef]
- Craggs, D.; Crilly, M.; Dawood, N. REALITY CAPTURE for BIM—Application, evaluation and integration within an architectural plan of works. In Proceedings of the 16th International Conference on Construction Applications of Virtual Reality, Hong Kong, China, 11–13 December 2016. [Google Scholar]
- Forkuo, E.K.; King, B. Automatic fusion of photogrammetric imagery and laser scanner point clouds. Int. Arch. Photogramm. Remote Sens. Spatial Inf. Sci. 2019. Available online: https://www.isprs.org/proceedings/XXXV/congress/comm4/papers/475.pdf (accessed on 31 August 2020).
- Moussa, W. Integration of Digital Photogrammetry and Terrestrial Laser Scanning for Cultural Heritage Data Recording. Ph.D. Thesis, University of Stuttgart, Stuttgart, Germany, 2014. [Google Scholar] [CrossRef]
- Rönnholm, P.; Honkavaara, E.; Litkey, P.; Hyyppä, H.; Hyyppä, J. Integration of laser scanning and photogrammetry. Int. Arch. Photogramm. Remote Sens. Spatial Inf. Sci. 2019, 36, 355–362. [Google Scholar]
- Anchabadze, Y.D.; Volkova, N.G. Altes Tbilisi; Maklai, M., Ed.; Russian Academy of Sciences, Institute of Ethnography: Moscow, Russia, 1990. [Google Scholar]
- Beridze, V. The History of Georgian Architecture; Tumanishvili, D., Ed.; Chubinashvili National Research Centre for History of Georgian Art and Monument Protection: Tbilisi, GA, USA, 2014. [Google Scholar]
Figure 1.
Targeting: (a) chessboard paper targets; (b) tilt and turn targets.
Figure 1.
Targeting: (a) chessboard paper targets; (b) tilt and turn targets.
Figure 2.
Terrestrial laser scanners: (a) Faro Focus 3D X330 placed on a neighboring bell tower; (b) Leica BLK360 placed on a neighboring roof under a chair for sun protection.
Figure 2.
Terrestrial laser scanners: (a) Faro Focus 3D X330 placed on a neighboring bell tower; (b) Leica BLK360 placed on a neighboring roof under a chair for sun protection.
Figure 3.
Overview of the registered total point cloud of Lurdji with distribution of scan stations (red) and targets (paper targets green, tilt and turn targets blue) (a) Faro Focus 3D X330; (b) Leica BLK360.
Figure 3.
Overview of the registered total point cloud of Lurdji with distribution of scan stations (red) and targets (paper targets green, tilt and turn targets blue) (a) Faro Focus 3D X330; (b) Leica BLK360.
Figure 4.
Example images of UAV flights: top row Lurdji; bottom row Sioni; note the different scales and contrasts; the upper right figure is the enlarged subset of the red rectangle.
Figure 4.
Example images of UAV flights: top row Lurdji; bottom row Sioni; note the different scales and contrasts; the upper right figure is the enlarged subset of the red rectangle.
Figure 5.
Example images of terrestrial photogrammetry: top row Lurdji; bottom row Sioni.
Figure 5.
Example images of terrestrial photogrammetry: top row Lurdji; bottom row Sioni.
Figure 6.
(a,b) Synthetic images from laser scan point cloud in RealityCapture.
Figure 6.
(a,b) Synthetic images from laser scan point cloud in RealityCapture.
Figure 7.
Scheme for data fusion of laser scan point cloud with photogrammetric images.
Figure 7.
Scheme for data fusion of laser scan point cloud with photogrammetric images.
Figure 8.
Andreas Church in Lurdji complex: (a) terrestrial image; (b) UAV image.
Figure 8.
Andreas Church in Lurdji complex: (a) terrestrial image; (b) UAV image.
Figure 9.
(a) Control point overview of the evaluation in RealityCapture; (b) overview of image data from image flight and terrestrial images after image orientation.
Figure 9.
(a) Control point overview of the evaluation in RealityCapture; (b) overview of image data from image flight and terrestrial images after image orientation.
Figure 10.
Meshed complete model with RealityCapture 1.0.3.
Figure 10.
Meshed complete model with RealityCapture 1.0.3.
Figure 11.
Detailed views from the point cloud calculated with RealityCapture.
Figure 11.
Detailed views from the point cloud calculated with RealityCapture.
Figure 12.
Sioni Cathedral in Tbilisi: (a) terrestrial image; (b) UAV image.
Figure 12.
Sioni Cathedral in Tbilisi: (a) terrestrial image; (b) UAV image.
Figure 13.
(a) Control point overview of the evaluation in RealityCapture; (b) overview of image data from image flight and terrestrial images after image orientation.
Figure 13.
(a) Control point overview of the evaluation in RealityCapture; (b) overview of image data from image flight and terrestrial images after image orientation.
Figure 14.
Scaling problems in RealityCapture: (a) double point clouds at two different scales for the tower cupola; (b) correct point clouds at equal scale.
Figure 14.
Scaling problems in RealityCapture: (a) double point clouds at two different scales for the tower cupola; (b) correct point clouds at equal scale.
Figure 15.
Final 3D model based on combined laser scanning (BLK point cloud) and photogrammetry: (a) 3D view of complete church; (b) top view of roof structure.
Figure 15.
Final 3D model based on combined laser scanning (BLK point cloud) and photogrammetry: (a) 3D view of complete church; (b) top view of roof structure.
Figure 16.
Final 3D model based on combined laser scanning (Faro point cloud) and photogrammetry: (a) 3D view of complete church; (b) detailed view of entrance hall.
Figure 16.
Final 3D model based on combined laser scanning (Faro point cloud) and photogrammetry: (a) 3D view of complete church; (b) detailed view of entrance hall.
Figure 17.
Remaining errors in 3D models: (a) gap in point cloud with UAV and 200D images; (b) 3D model calculated with additional D6 images.
Figure 17.
Remaining errors in 3D models: (a) gap in point cloud with UAV and 200D images; (b) 3D model calculated with additional D6 images.
Figure 18.
Cloud-to-mesh comparison of the point cloud calculated with RealityCapture (Faro and images) compared to Faro TLS; (a) side view of tower region; (b) top view of tower region scale: −0.06 m (blue) to +0.06 m (red).
Figure 18.
Cloud-to-mesh comparison of the point cloud calculated with RealityCapture (Faro and images) compared to Faro TLS; (a) side view of tower region; (b) top view of tower region scale: −0.06 m (blue) to +0.06 m (red).
Figure 19.
Cloud-to-mesh comparison of the point cloud calculated with RealityCapture (Faro and images) compared to Faro TLS of entrance region; scale: −0.02 m (blue) to +0.01 m (red).
Figure 19.
Cloud-to-mesh comparison of the point cloud calculated with RealityCapture (Faro and images) compared to Faro TLS of entrance region; scale: −0.02 m (blue) to +0.01 m (red).
Figure 20.
Comparison of the point cloud calculated with RealityCapture (BLK360 and all images) compared to RealityCapture (Faro and all images) after ICP adjustment: (a) scale −0.09 m (blue) to +0.12 m (red); (b) scale −0.03 m (blue) to +0.03 m (red).
Figure 20.
Comparison of the point cloud calculated with RealityCapture (BLK360 and all images) compared to RealityCapture (Faro and all images) after ICP adjustment: (a) scale −0.09 m (blue) to +0.12 m (red); (b) scale −0.03 m (blue) to +0.03 m (red).
Table 1.
Laser scan data.
Table 1.
Laser scan data.
| | Lurdji | Sioni |
|---|
| | Faro | BLK | Faro | BLK |
| Stations | 11 | 20 | 18 | 23 |
| 3D points (mill.) | 350 | 784 | 540 | 950 |
| Scan duration (h) | 4.5 | 1.5 | 2.5 | 2.0 |
| Mean resolution (mm) | 3–5 | 4–8 | 3–15 | 4–16 |
| Registration precision (mm) | 4 | 4 | 3 | 7 |
Table 2.
UAV data (approx. values).
Table 2.
UAV data (approx. values).
| | Images | Altitude (m) | Distance (m) | Image scales | GSD (mm) |
|---|
| Lurdji | | | | | |
| Nadir | 173 | 30–35 | 20–30 | 4600–6500 | 7–10 |
| Circle 1 | 88 | 15–20 | 10–25 | 2200–5200 | 3–9 |
| Circle 2 | 107 | 45–55 | 25–32 | 5500–6800 | 9–11 |
| Total | 368 | 15–55 | 14–32 | 2200–6800 | 3–11 |
| Sioni | | | | | |
| Nadir | 512 | 45–65 | 5–25 | 1000–5300 | 2–8 |
| Circle | 152 | 60–65 | 20–25 | 4300–5300 | 6–8 |
| Total | 664 | 45–65 | 5–25 | 1000–5300 | 2–8 |
Table 3.
Photogrammetric data.
Table 3.
Photogrammetric data.
| | Lurdji | Sioni |
|---|
| | UAV | 200D | D6 | UAV | 200D | D6 |
| Images | 368 | 206 | 465 | 664 | 280 | 738 |
| Focal length (mm) | 4.7 | 10 | 24 | 4.7 | 10 | 24 |
| Data size raw(GB) | 12.34 | 13.81 | 34.70 | 22.26 | 18.78 | 55.07 |
| Data size JPEG (GB) | 1.70 | 1.94 | 3.16 | 3.16 | 1.97 | 5.28 |
| Mean image scale | 4468 | 1400 | 583 | 3191 | 1400 | 583 |
| Mean GSD (mm) | 7 | 5 | 4 | 5 | 5 | 4 |
© 2020 by the authors. Licensee MDPI, Basel, Switzerland. This article is an open access article distributed under the terms and conditions of the Creative Commons Attribution (CC BY) license (http://creativecommons.org/licenses/by/4.0/).


