Article

A CFAR-Enhanced Spectral Whitening Method for Acoustic Sensing via UAVs

Faculty of Engineering and Applied Science, Memorial University of Newfoundland, St. John’s, NL A1B 3X5, Canada
*
Author to whom correspondence should be addressed.
Submission received: 2 December 2017 / Revised: 20 December 2017 / Accepted: 20 December 2017 / Published: 22 December 2017

Abstract

:
The following paper addresses the issue of performing CFAR detection on signals with colored noise distributions, such as that found when performing acoustic sensing via UAVs. With respect to the outlined considerations, a CFAR-enhanced spectral whitening method is proposed to maintain detector functionality without inhibiting detection sensitivity. The performance of the method is also demonstrated using acoustic data taken from experiments involving a fixed-wing UAV. From the results obtained, it is evident the approach performs significantly better than standard techniques such as inverse spectral whitening, which tend to attenuate acquired target source components.

1. Introduction

Often for many real-world applications, signal noise does not follow a Gaussian distribution but rather exhibits some colored form that is a function of frequency. For example, the transmission of acoustic energy in a viscoelastic medium results in amplitude attenuation that is proportional to the square of the component frequency as described by Stokes’ Law [1]. The resulting effect is a coloring of acoustic energy across the frequency band of interest, which includes both noise and desired signal components. For transmission in atmospheric conditions, semi-empirical models have been developed to predict attenuation levels based on source frequency and thermodynamic properties of the medium [2]. Thus, frequency-dependent attenuation or coloring of acoustic spectra is typical when performing acoustic sensing of aircraft such as unmanned aerial vehicles (UAVs). This can be observed in Figure 1 displayed below which provides power spectra for various propeller-driven aircraft during a fly-by. From the plots, it is evident that the self-generated noise consists of strong harmonic narrowband components, superimposed on a frequency-dependent broadband base. Although the general downward power trend can be attributed to transmission effects, the specific shape is due to more complex features regarding the aircraft design [3]. The presence of spectral coloring may greatly influence the ability to perform operations such as target source detection. For example, common CFAR detection methods require noise to follow a small class of known distributions that must remain stationary with time [4]. For situations in which the underlying distribution is either unknown or does not follow a standard form (e.g., Gaussian and Exponential), distribution-free methods may be used to achieve constant false alarm rates. However, distribution-free CFAR (DF-CFAR) methods require noise samples be independent and identically distributed (IID) to maintain accurate functionality [5].
One particular application subject to these conditions is acoustic sensing via UAVs. Although generally considered unconventional, this technology is currently being investigated for the detection of various ground-based and airborne acoustic sources [6,7,8,9,10,11]. However, current studies have not employed the use of CFAR detectors to establish fixed false alarm rates during flight operations. Robust detection techniques using DF-CFAR detectors have been previously presented to address bandwidth limitations and nonstationary signals associated with this particular application [12]. Here we examine the issue of applying these detectors to acoustic signals with colored noise distributions. Thus, the purpose of this paper is to present a spectral whitening technique that would enable the use of DF-CFAR detectors for acoustic sensing via UAVs.

2. Background Information

The two most common forms of spectral whitening are inverse filtering and frequency-band gain control [13]. The frequency-band method is a time domain approach, where multiple band-pass filters are applied in parallel to section the signal into various frequency bands. Each of the filtered sections are then equalized using an active scaling approach such as automatic gain control (AGC) or linear predictive coding (LPC). The benefit of this method is a continuously whitened output that does not require any block-based processing such as that inherent with FFT operations. The major downside is potential phase distortions since these scaling operations are typically non-linear [13]. In contrast, inverse filtering is typically performed in the frequency domain and does not produce phase distortions. It involves dividing the spectrum of concern by the mean of its noise approximation according to the following [14]:
Y ( f ) = X ( f ) | X ˜ ( f ) | γ + C
where | X ˜ ( f ) | is the approximated or smoothed magnitude spectrum of X ( f ) , γ is a scaling or degree-of-flattening factor, and C is a constant to prevent division by zero. If desired, we may exclude the division constant by simply performing the operation in the log-decibel domain instead:
| Y ( f ) | = | X ( f ) | γ | X ˜ ( f ) | .
To reconstruct the complex signal, the whitened spectrum is simply multiplied by the original phase response:
Y ( f ) = | Y ( f ) | e j θ ( f )
where θ ( f ) = Arg [ X ( f ) ] .
To obtain the noise approximation | X ˜ ( f ) | , multiple spectra are typically taken consecutively in time and averaged together. If the signal is continuously windowed and frequency transformed, a moving average function may be applied to obtain an accurate approximation. Common averaging methods include the cumulative mean, the recursive exponential mean, and the windowed mean as given by the following equations, respectively:
| X ˜ ( f , w ) | = 1 w [ | X ( f , w ) | + ( w 1 ) | X ˜ ( f , w ) | ]
| X ˜ ( f , w ) | = ξ | X ( f , w ) | + ( 1 ξ ) | X ˜ ( f , w ) |
| X ˜ ( f , w ) | = 1 W k = 1 W | X ( f , w k ) |
where w is the current windowed segment number, ξ is the recursive forgetting factor ( 0 < ξ < 1 ) , and W is the total number of windows used for the mean estimate.
Although simplistic and often effective, the major drawback with the above approach is the potential attenuation of desired signal components from a contaminated noise estimate. If target signal components are present in past windowed spectra that constitute the current noise estimate, the normalization process will act to remove them from the whitened spectra. The obvious solution to this problem is to simply remove these components from the spectra before taking a mean estimate. However, in many instances, the desired signal component(s) and frequency location(s) are not known to facilitate removal. For such cases, the above methods are clearly not optimal in any sense.

3. CFAR-Enhanced Whitening

3.1. Description

A proposed solution to the problem of attenuating target signal components by inclusion into the mean noise estimate, is to simply remove all peak components that may constitute a potential target signal. This can be achieved using a CFAR detector, such as the DF-CFAR previously mentioned. Using the detector, potential signals can be identified and effectively removed from the noise estimate by flooring them to some scaled value of the CFAR detection threshold used. To ensure all potential components are successfully located, a very high false alarm probability is used to maximize sensitivity. By using a value much higher than that of the final target detection stage (performed after whitening), the inability to detect a source component and subsequent inclusion into the mean noise estimate will not affect the final detection performance. It is proposed that the OS-CFAR detector be utilized since this form offers computational simplicity and superior performance in multi-target environments [15]. However, essentially any CFAR detector may be used instead. Some common forms include the cell-averaging CFAR (CA-CFAR) [16], the greatest-of cell averaging CFAR (GOCA-CFAR) [17], the smallest-of cell averaging CFAR (SOCA-CFAR) [17], the ordered statistic CFAR (OS-CFAR) [18], the censored mean level CFAR (CML-CFAR) [19], and the trimmed mean CFAR (TM-CFAR) [20]. Each of these detectors operate using the same principles, with differences only in the method in which the reference noise level is determined. For the OS-CFAR detector, the following binary testing function may be constructed:
T ( f , w ) = { 1   ,   i f   | X ( f , w ) | η ( f , w ) 0   ,   i f   | X ( f , w ) | < η ( f , w )
where η ( f , w ) is the threshold factor given by
η ( f , w ) = α o s | X k ( f , w ) |
where α o s is the order statistic scaling factor, and | X k ( f , w ) | is the k t h largest spectral component contained in the noise sample bandwidth of size N taken about the test cell | X ( f , w ) | .
Prior to calculating the mean approximation, potential signal components are effectively removed by flooring their value to some scaled fraction of the detection threshold used. This can be expressed by the following operation:
| X ( f , w ) | = δ η ( f , w ) T ( f , w ) + [ 1 T ( f , w ) ] | X ( f , w ) |
where δ is the flooring scale factor. The mean approximation is then found by substituting the above value into Equations (4)–(6). Finally, the spectrally whitened form can then be obtained via Equations (1) and (2) with γ = 0 .

3.2. Validation

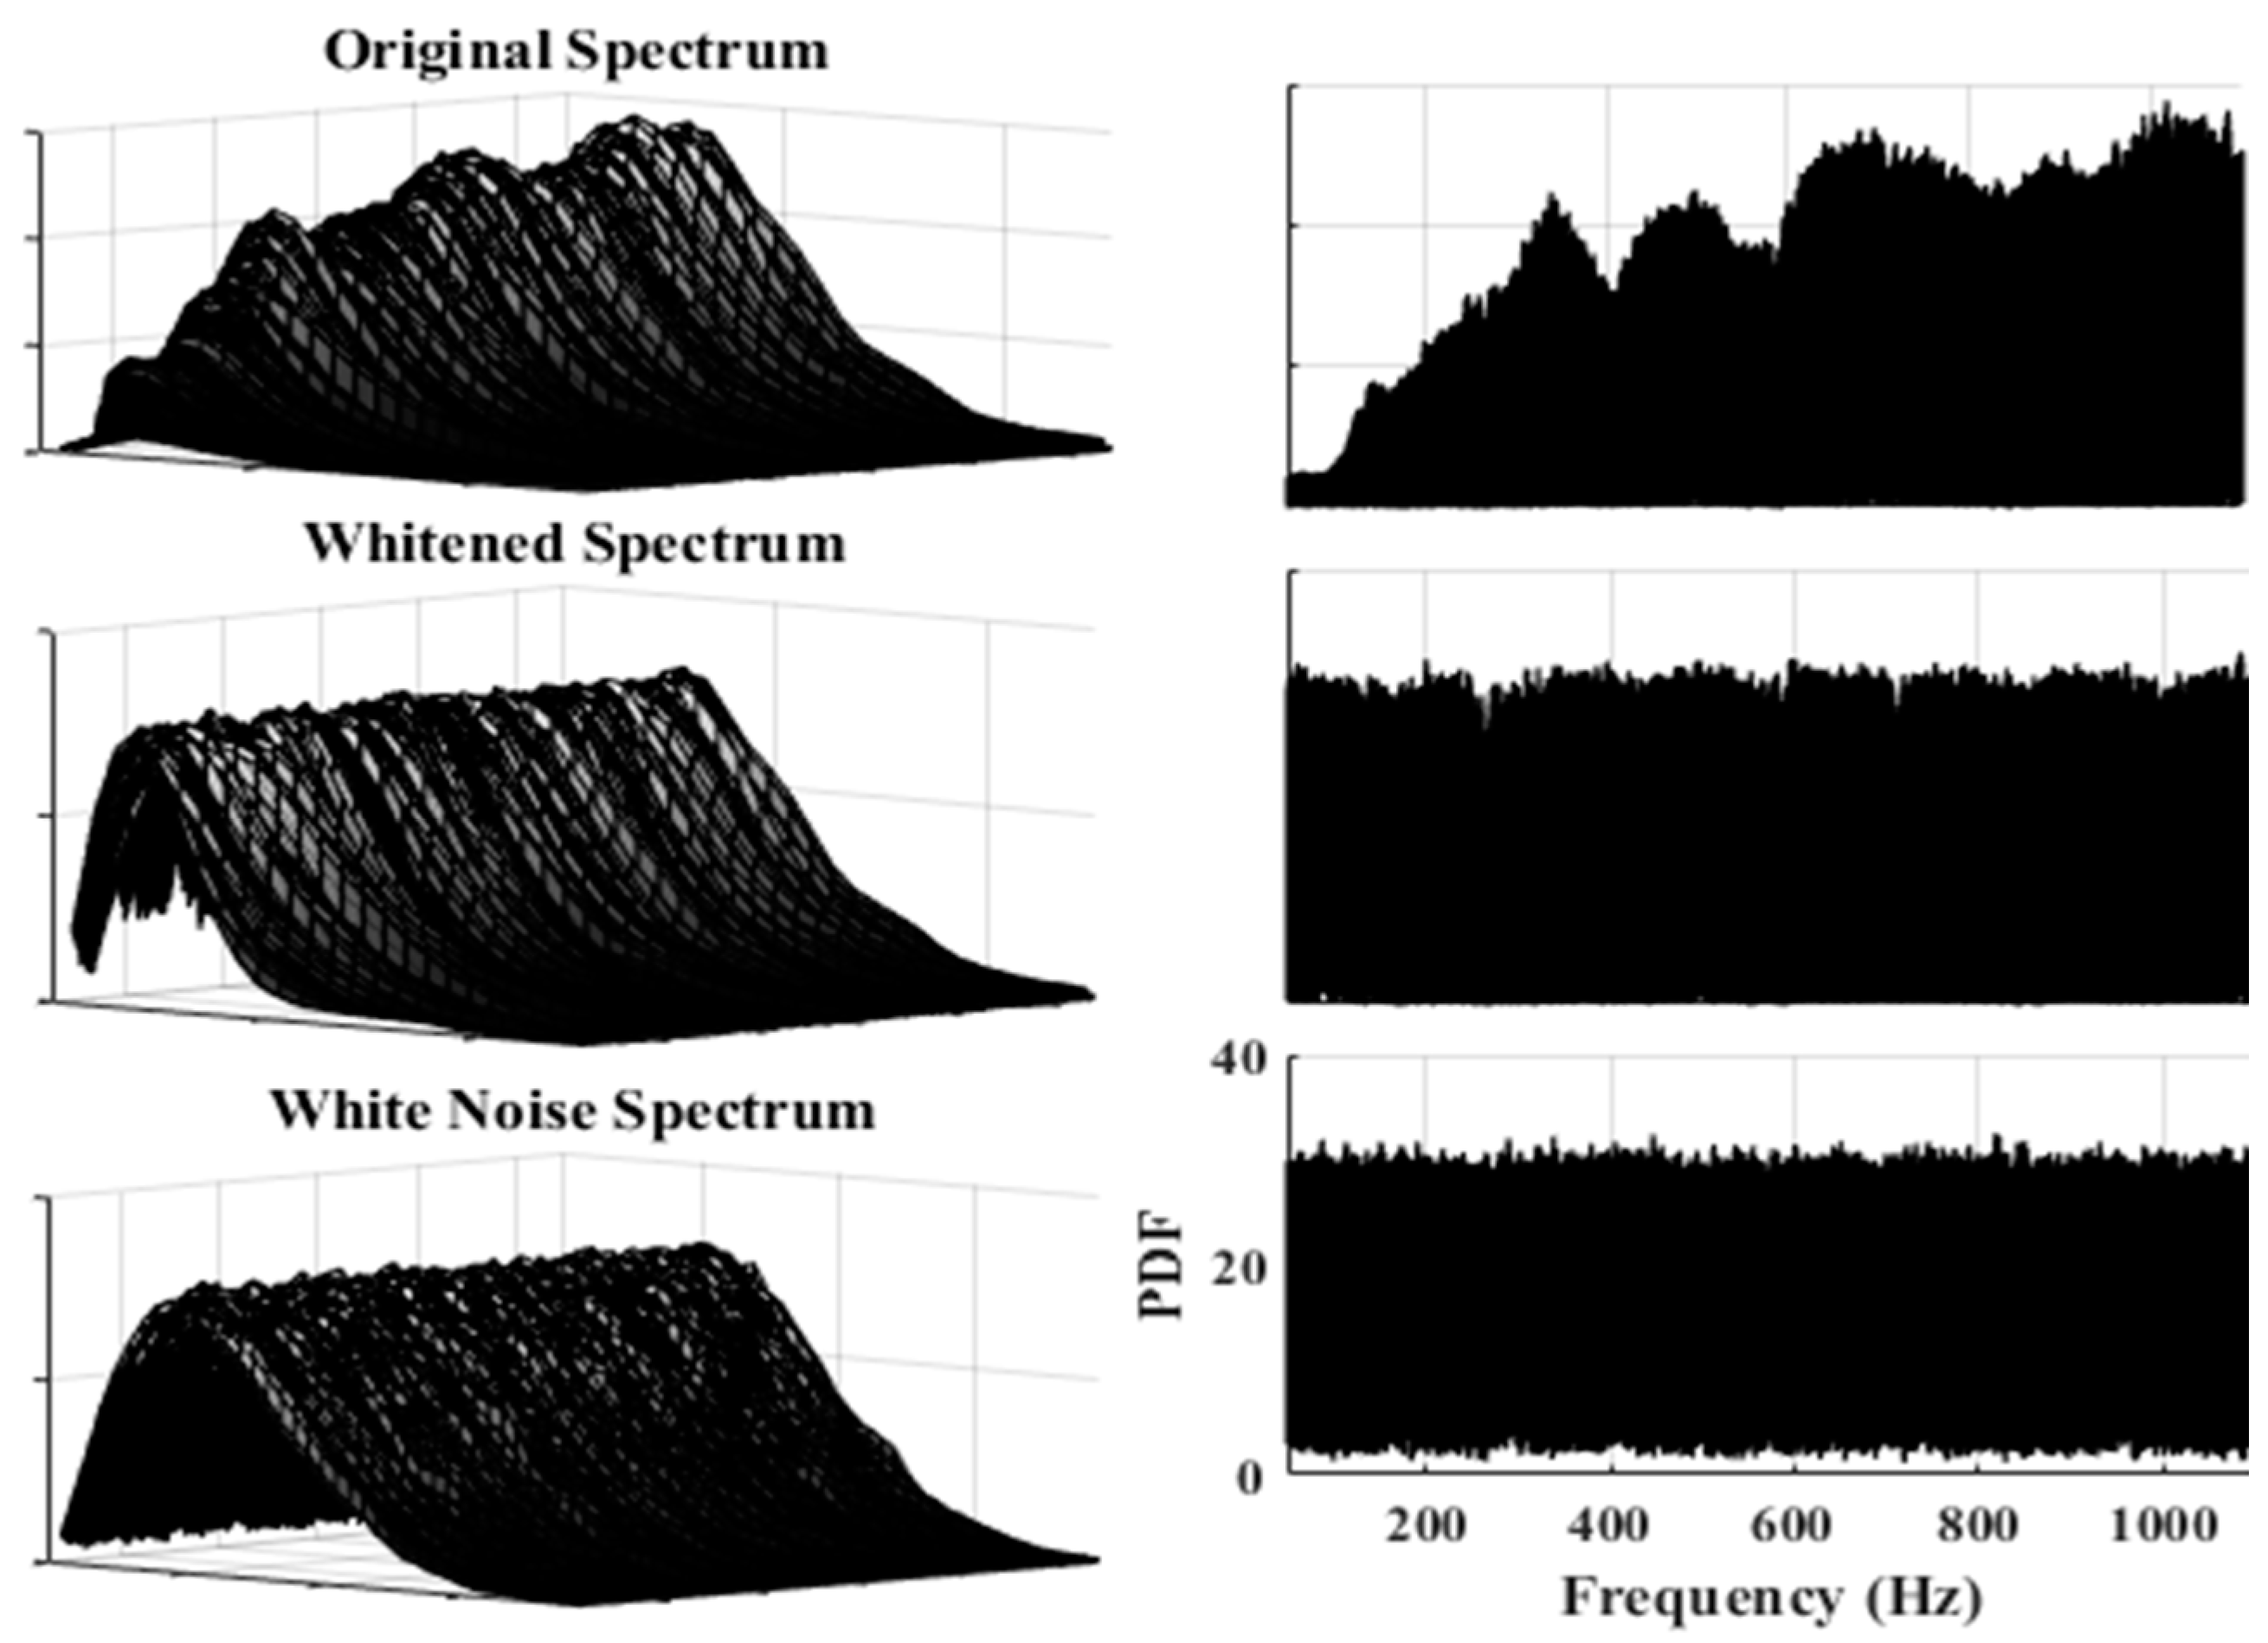
To confirm the validity of the proposed whitening approach, the method is applied to acoustic data taken from a fixed-wing Delta X-8 UAV fitted with 4 microphones during flight operations. Using a single channel recording, probability distributions were calculated from consecutive FFT spectra for the unwhitened and whitened signals, and compared to that of ideal white Gaussian noise. Since the purpose is to evaluate the broadband spectral noise distribution, narrowband self-noise components generated by the aircraft propulsion system were first removed via the referenceless adaptive IIR approach previously proposed by Tan [21,22,23,24]. Since notch filter bandwidth is typically very narrow, the process has little to no effect on the underlying broadband features. To calculate the probability distributions, the FFT was applied to the 1150 s flight recording using 0.5 s rectangular windows with a 50% overlap, producing 4599 windowed points for each frequency bin. Using these observations, the probability density functions (PDFs) for each spectral form (whitened, unwhitened, etc.) were then calculated as a function of frequency. Figure 2 displayed below provides the results obtained using the magnitude spectra for the original, whitened, and Gaussian noise signals. From the plots, it is evident that broadband noise in the original notch filtered signal are not IID since density values vary largely as a function of frequency. In contrast, the whitened signal PDF is nearly identical to the ideal response obtained from Gaussian noise which follows a Rayleigh distribution. Thus, we may conclude that the broadband noise components were effectively whitened to form a group of IID spectral components as desired.

4. Experimental Results & Discussion

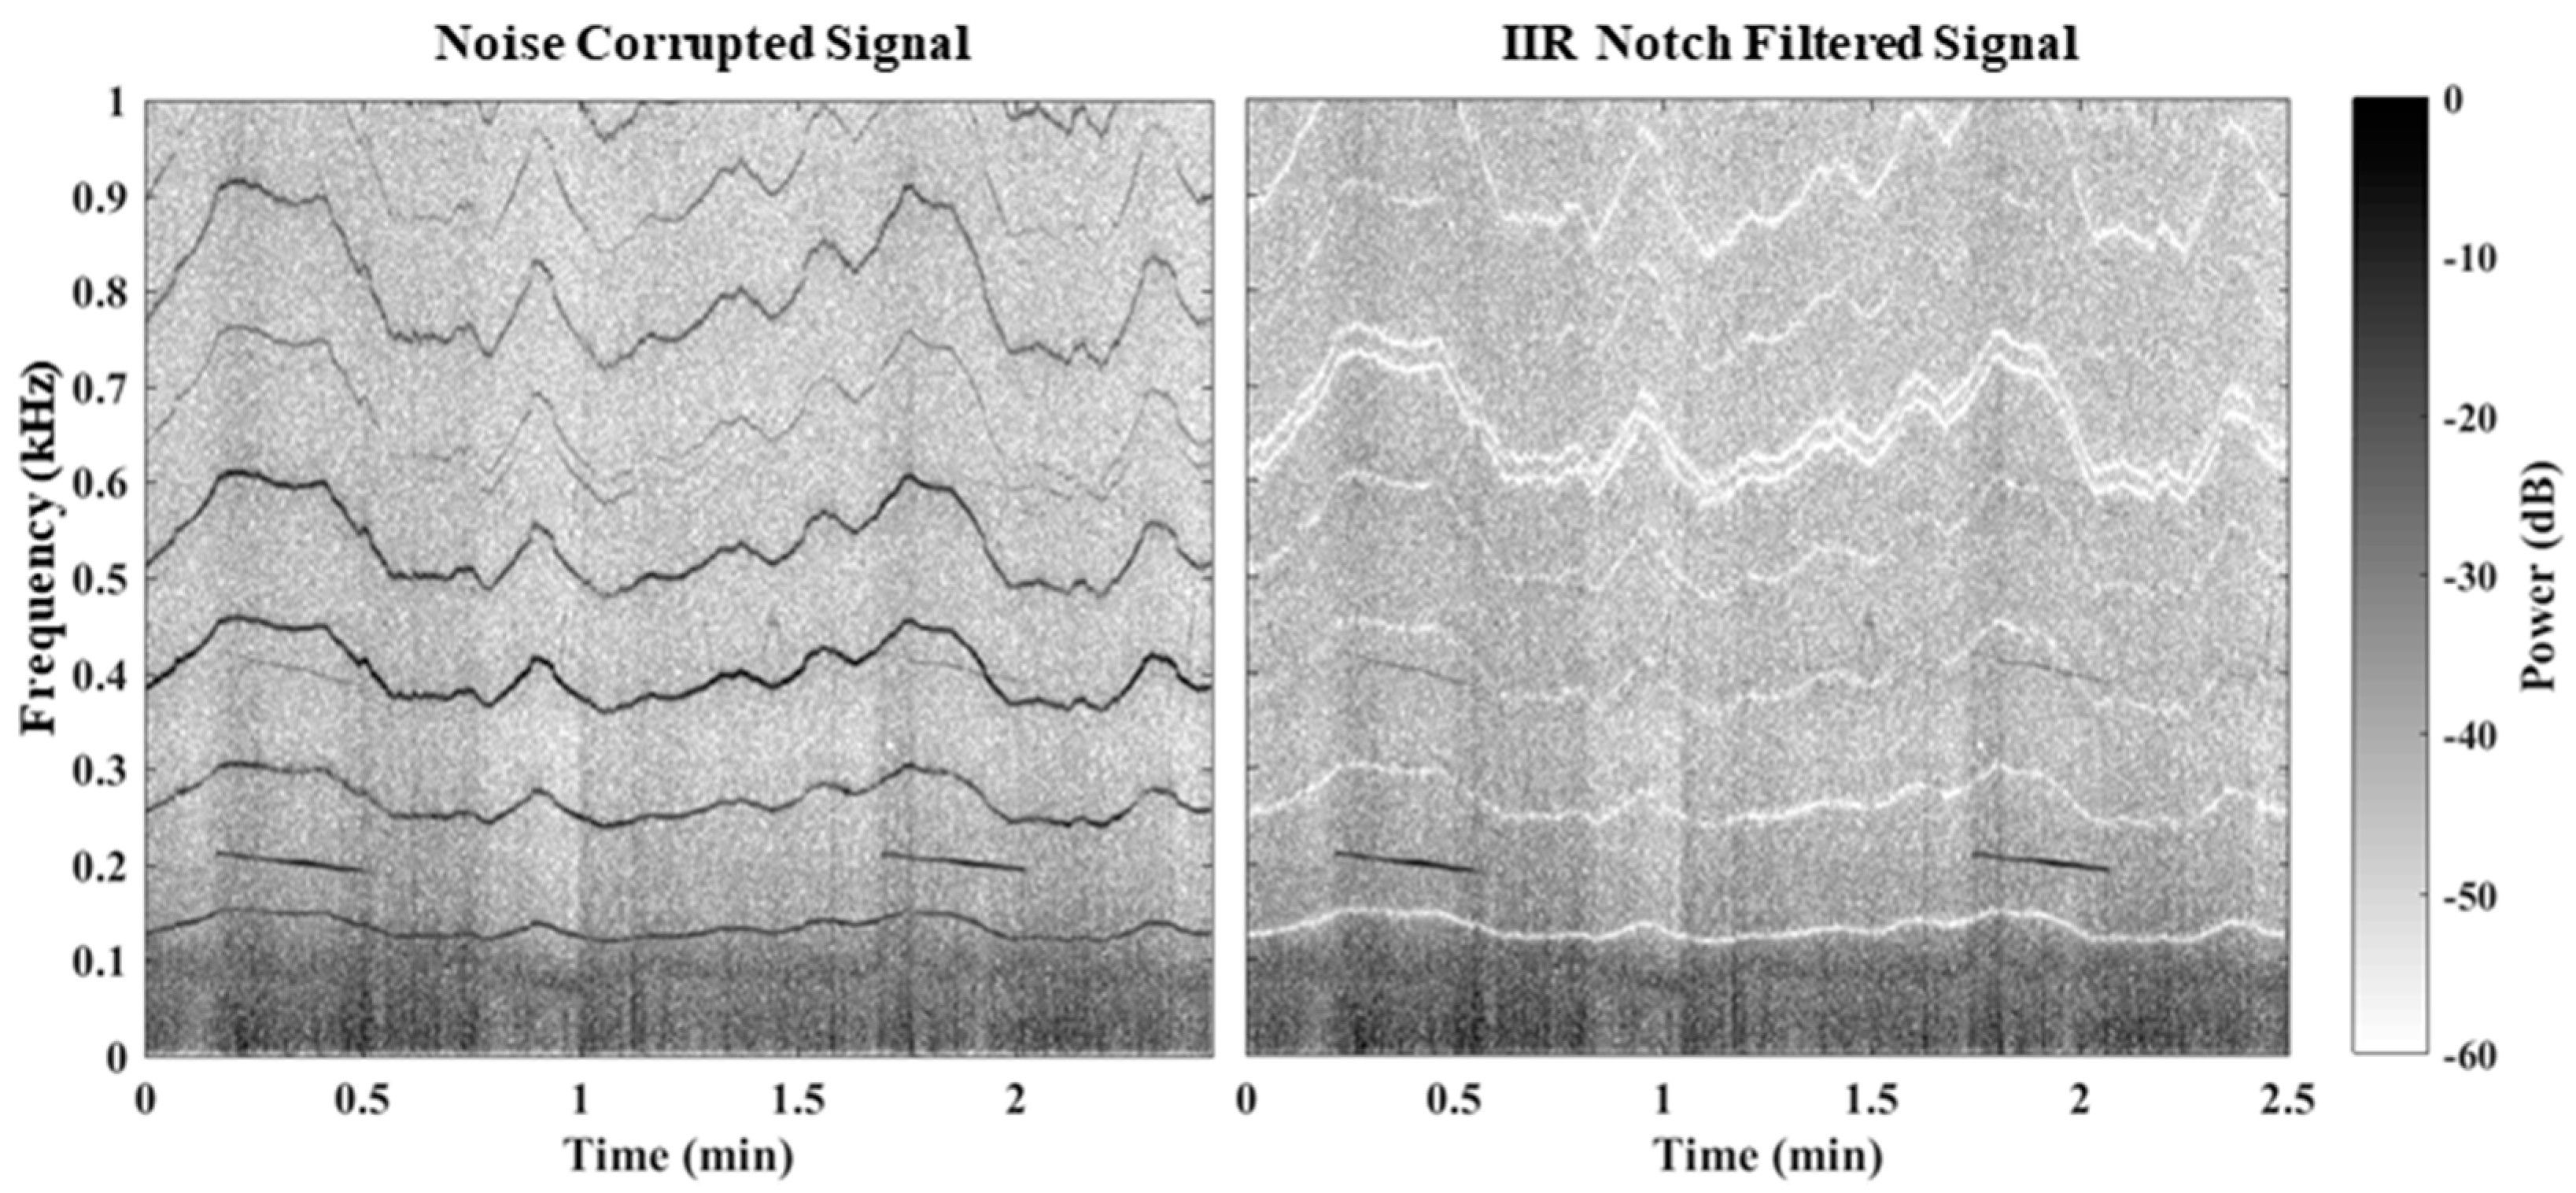
The performance of the proposed CFAR-enhanced whitening approach is now illustrated using experimental data. In brief, the experiment involved flybys of a Delta X-8 aircraft fitted with four microphones at approximately 20 knots overhead a ground-based loudspeaker emitting various pure tone frequencies. Here we examine the separate cases of a 200 Hz and 500 Hz pure tone being emitted. Further details regarding the experimental setup can be found in [10]. Recorded signals were first decimated to reduce data processing requirements since the recorded sampling rate was 48 kHz, but only information to up approximately 1000 Hz was found to be useful. The sample-reduced signals were then notch filtered to remove narrowband self-noise components using the referenceless adaptive IIR approach previously proposed by Tan [21,22,23,24]. Figure 3 provides spectrograms of the original and notch filtered signals for the 200 Hz source case. The filtered signals were then windowed, frequency transformed using the FFT operation, and spectrally whitened via the CFAR-enhanced method. Finally, detection statistics were established using the selective cell distribution-free CFAR detector (SCDF-CFAR) in conjunction with the single trial (ST), binary integration (BI), and robust binary integration (RBI) detection schemes. Details regarding the SCDF-CFAR detector and various detection schemes can be found in [12] and are not discussed here since it is outside the scope of this paper.
Table 1, Table 2 and Table 3 provide the notch filter, FFT, spectral whitening, and SCDF-CFAR parameters used. As previously discussed, the proposed whitening procedure can be effectively employed without reducing the probability of detection by using a threshold value which produces a much higher false alarm rate than that used in the final detection stage. Here, thresholding values are chosen using the values displayed below such that a false alarm rate of P F A = 0.1 is achieved. This is considerably higher than that offered by the SCDF-CFAR detector as indicated in the table ( P F A S C = 0.001 ). Note that SC indicates testing a single cell in the acquired signal FFT spectrum, while ST indicates testing all cells across the frequency band of interest.
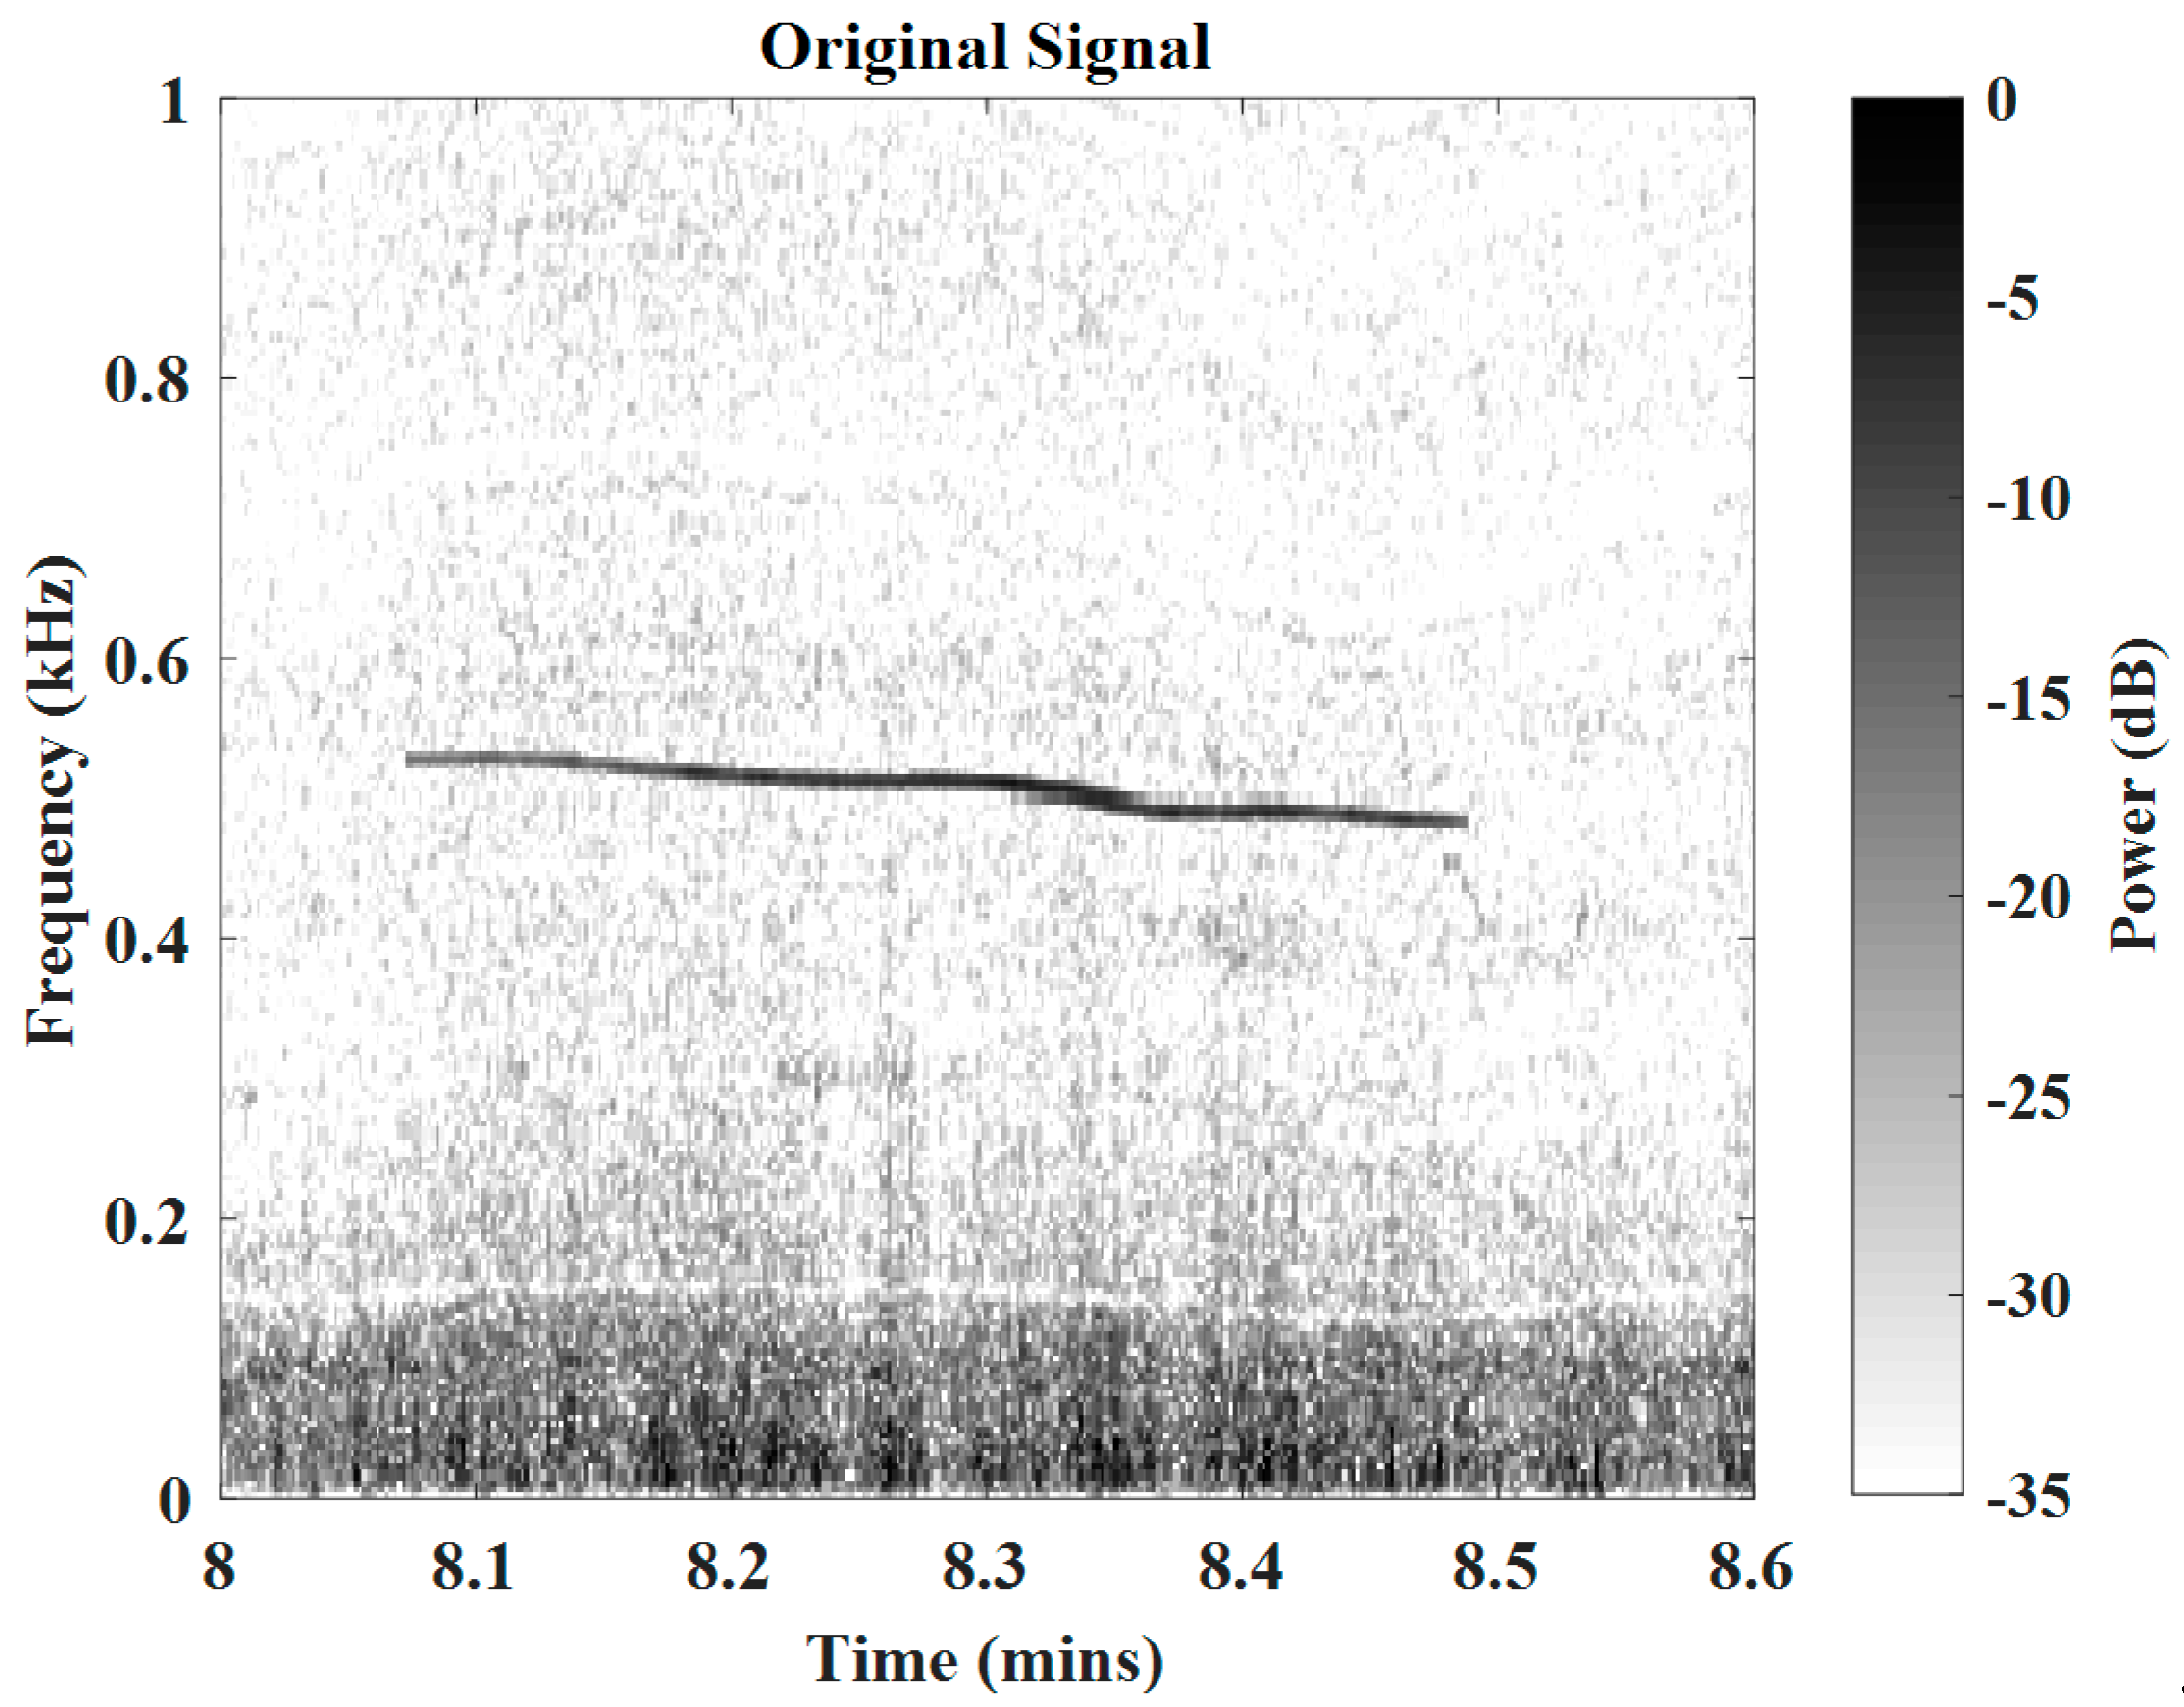
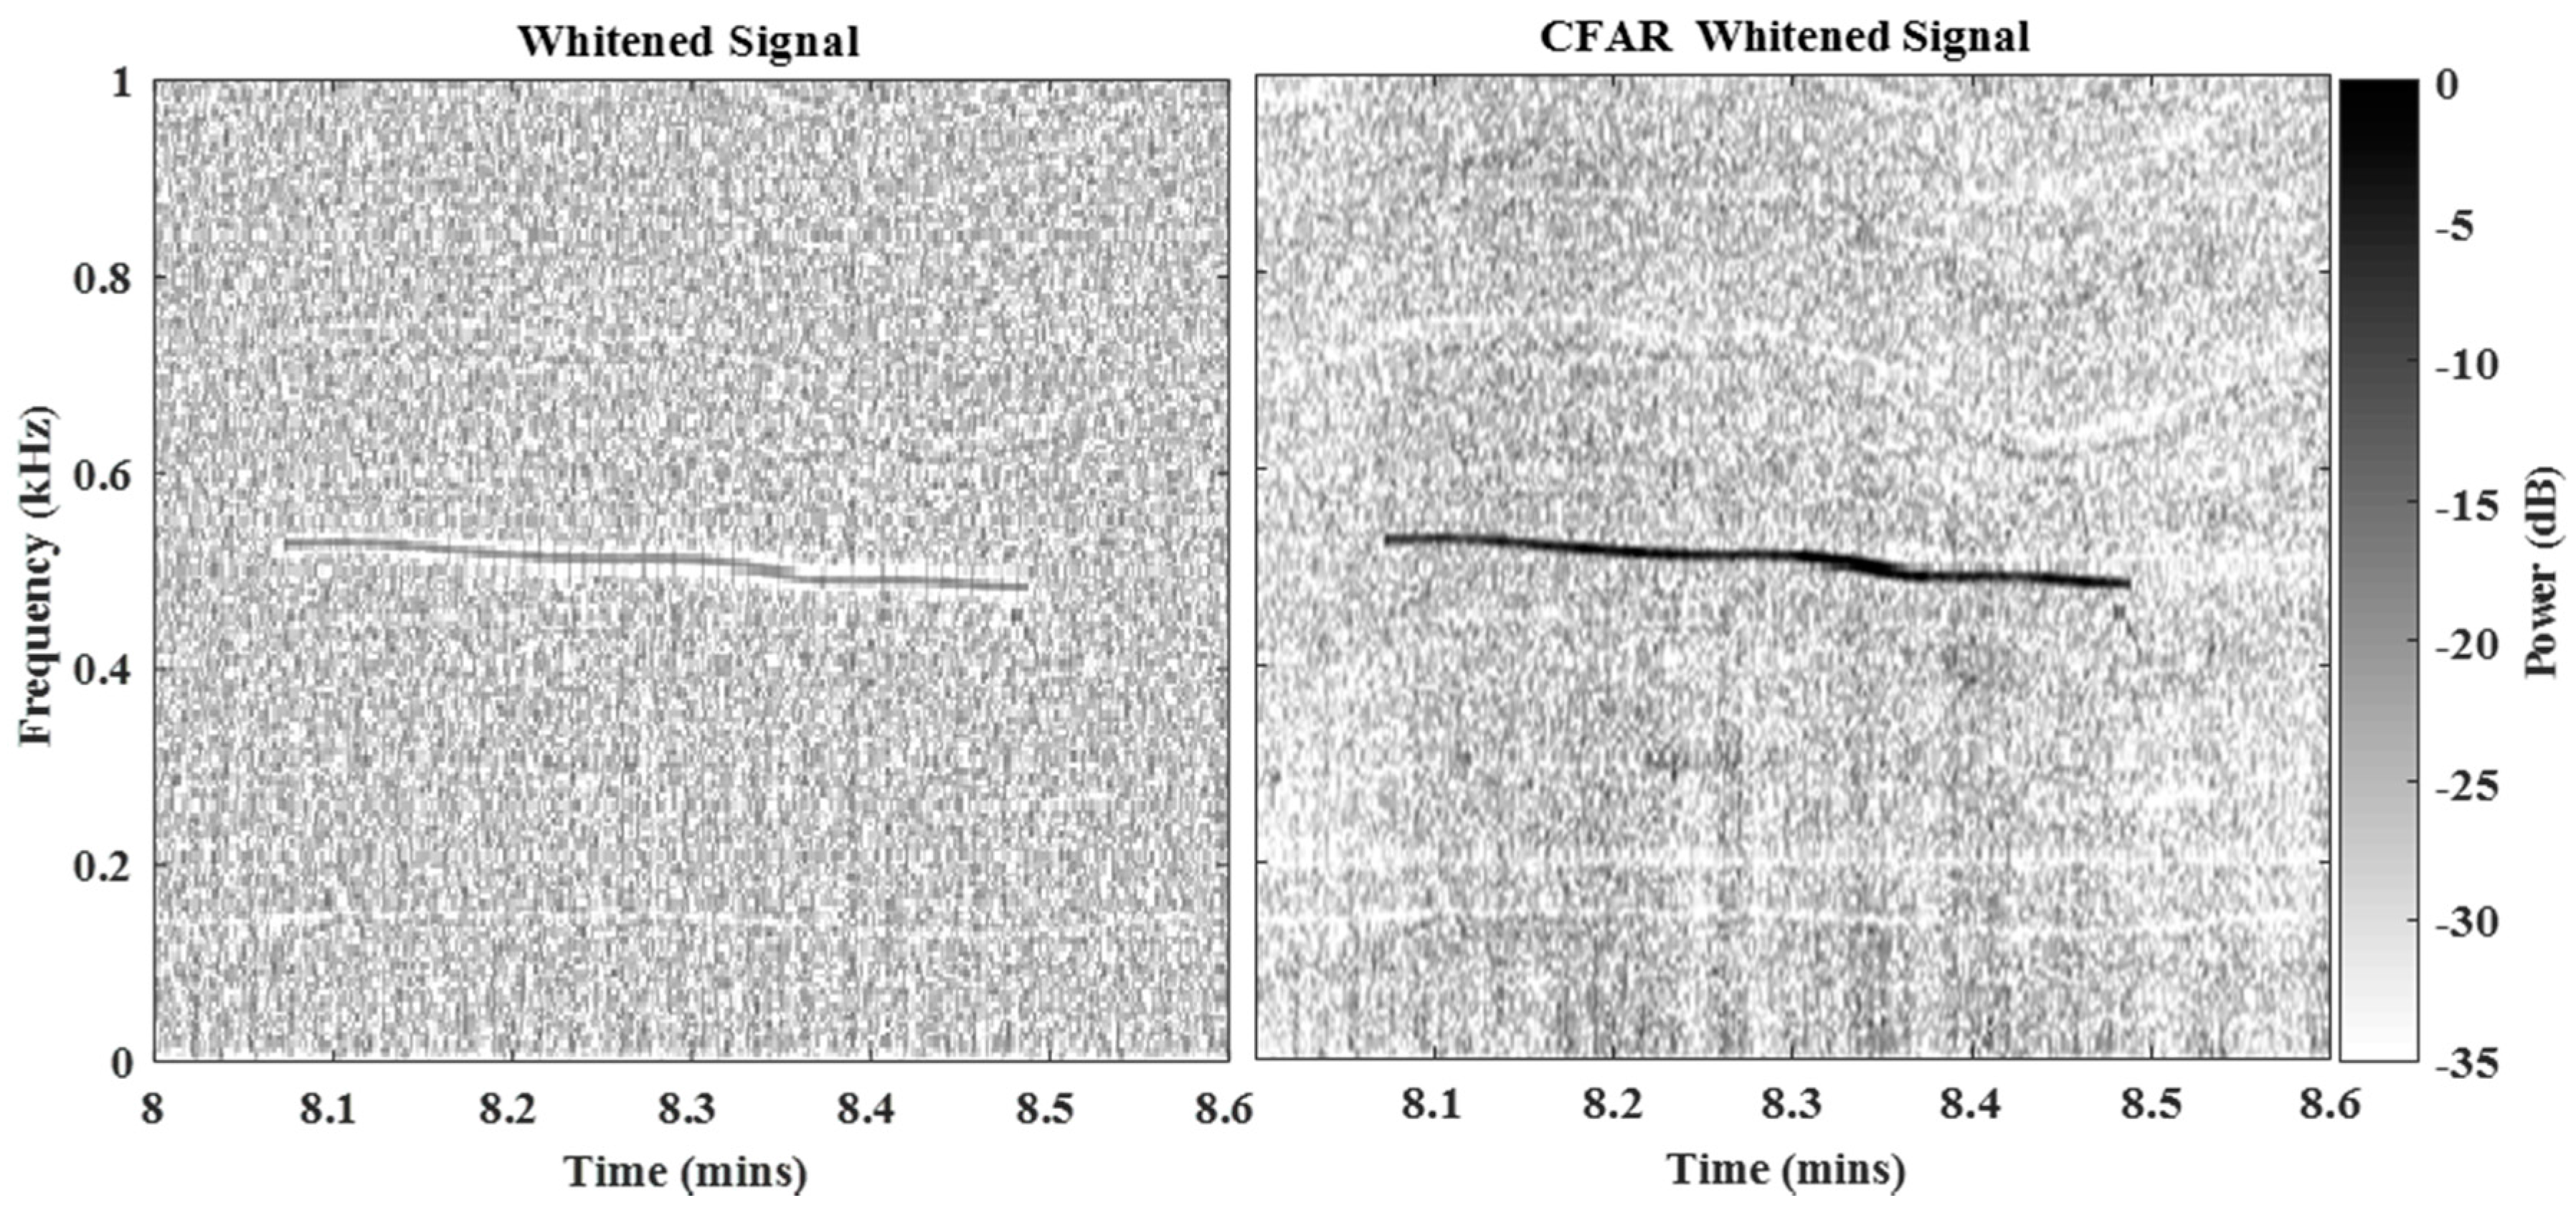
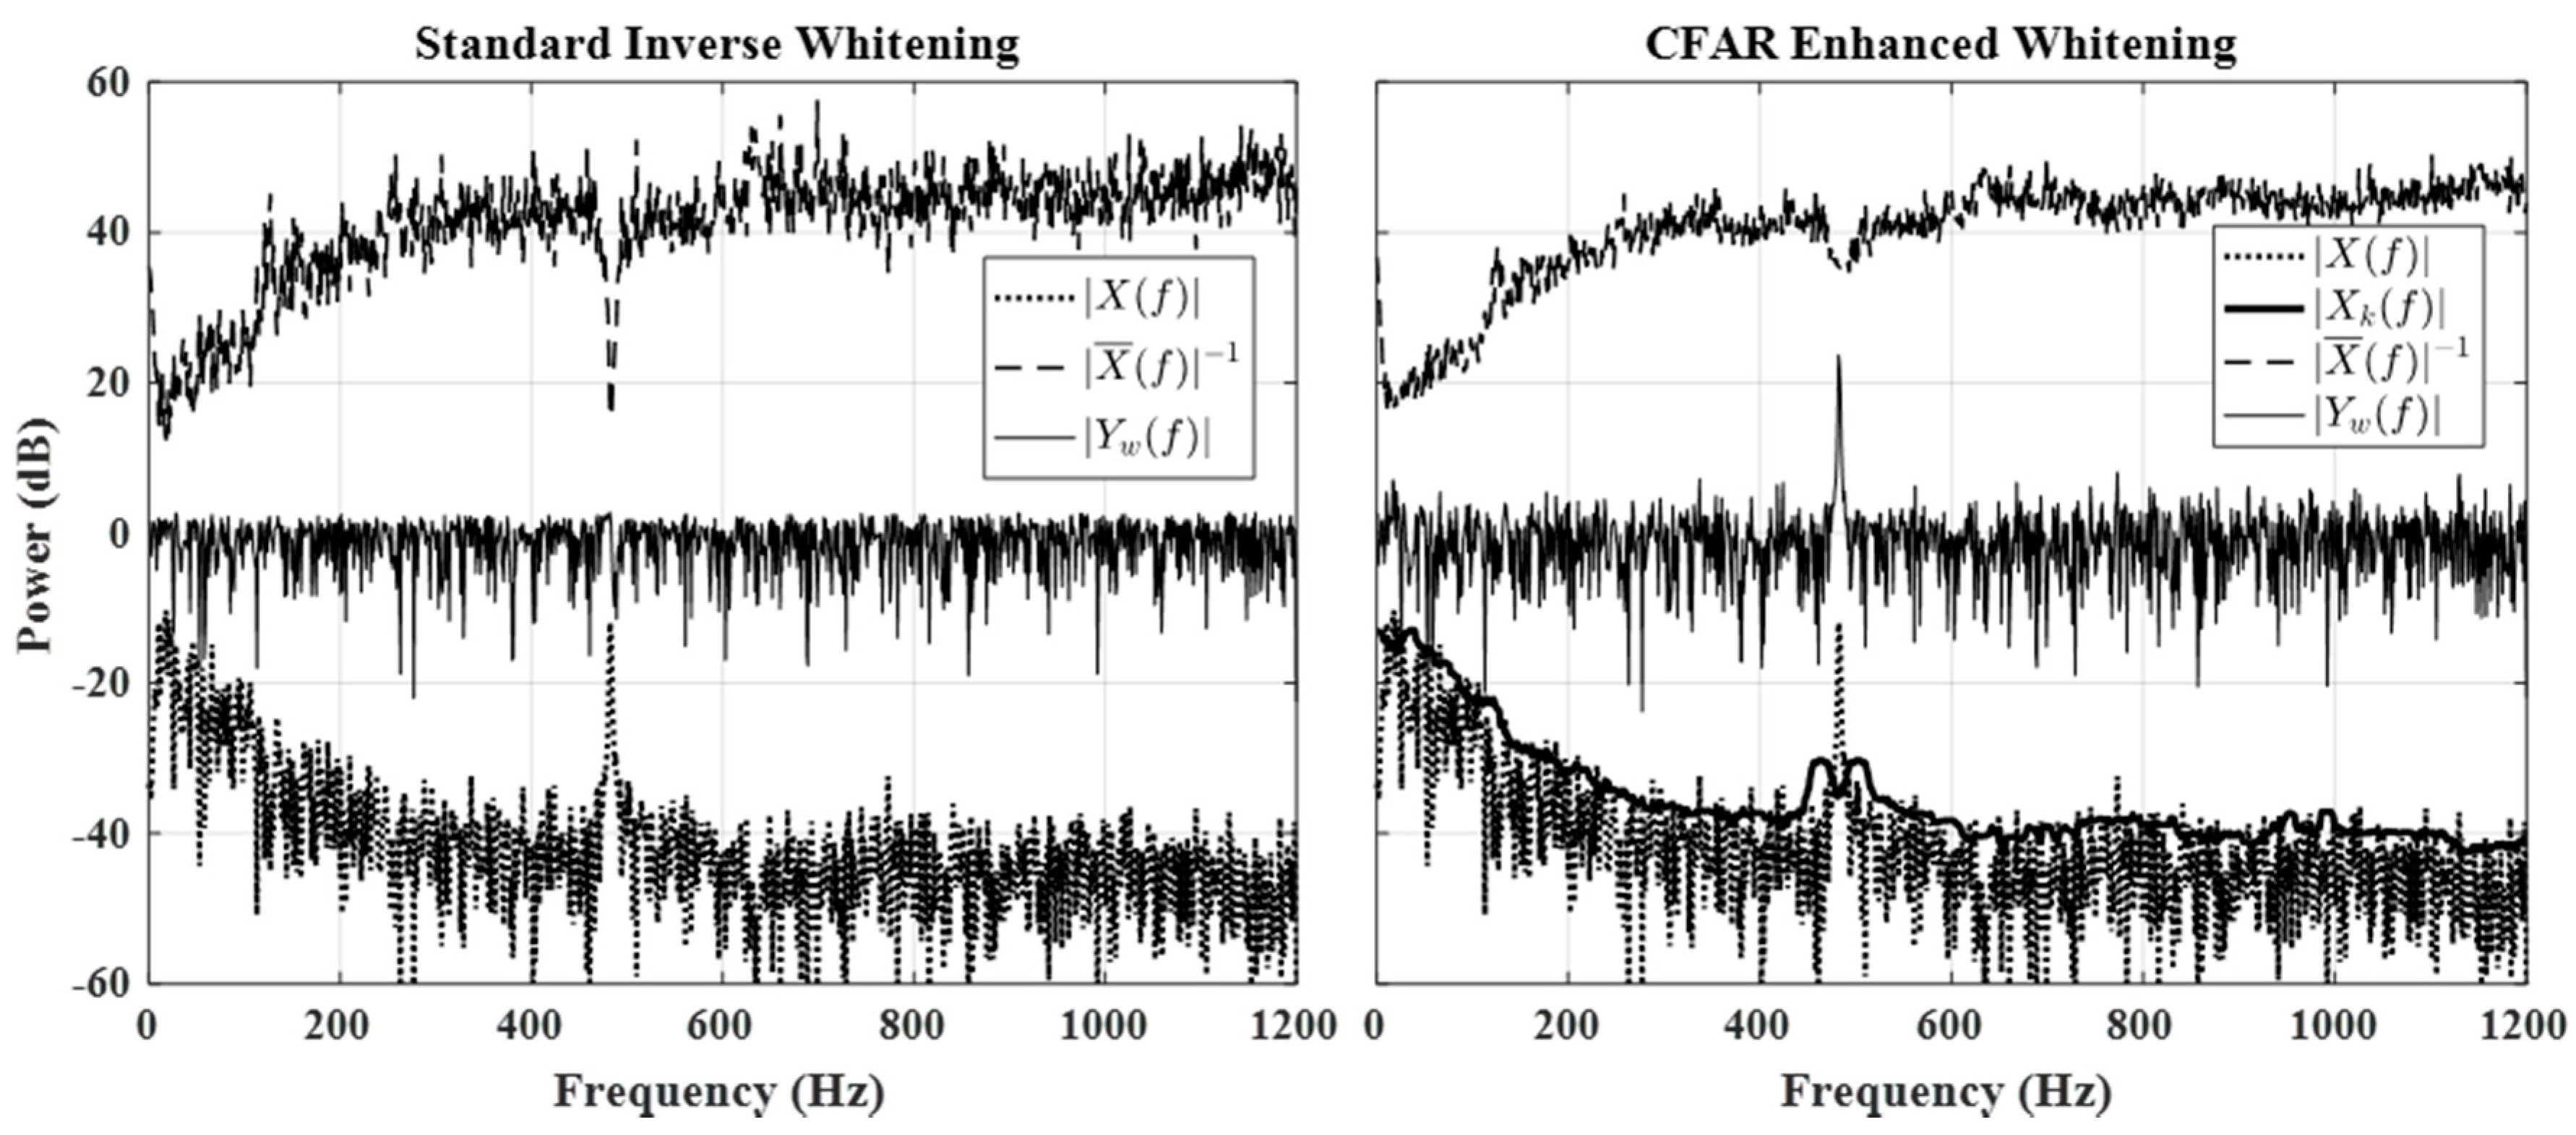
We first illustrate the effectiveness of the proposed whitening approach in avoiding attenuation of source signal components. Figure 4 displayed below provides a spectrogram of the pre-whitened signal with a 500 Hz source component clearly visible, while Figure 5 displays spectrograms for the standard inverse and CFAR-enhanced whitened signals, respectively. The noise approximation was calculated using the recursive mean as previously given by Equation (5) with ξ = 0.5 , and using a flooring scale value of δ = 1 . From observation of the three plots, it is evident that both methods whiten broadband noise components since power levels remain relatively constant across the frequency band. However, the standard approach also greatly attenuates the target source component to near noise-floor levels. It is evident that the proposed CFAR method does not attenuate the source signal, but actually increases the SNR slightly while still maintaining an overall whitened response. This effect can be better visualized by Figure 6, which depicts the whitening process for a single windowed segment taken at 8.4 min into the flight. Here, | X ( f ) | is the orgional unwhitened signal, | X ¯ ( f ) | 1 is the inverse noise approximation, | X k ( f ) | is the CFAR detection threshold used to establish the inverse noise approximation, and | Y w ( f ) | is the whitened signal spectrum.
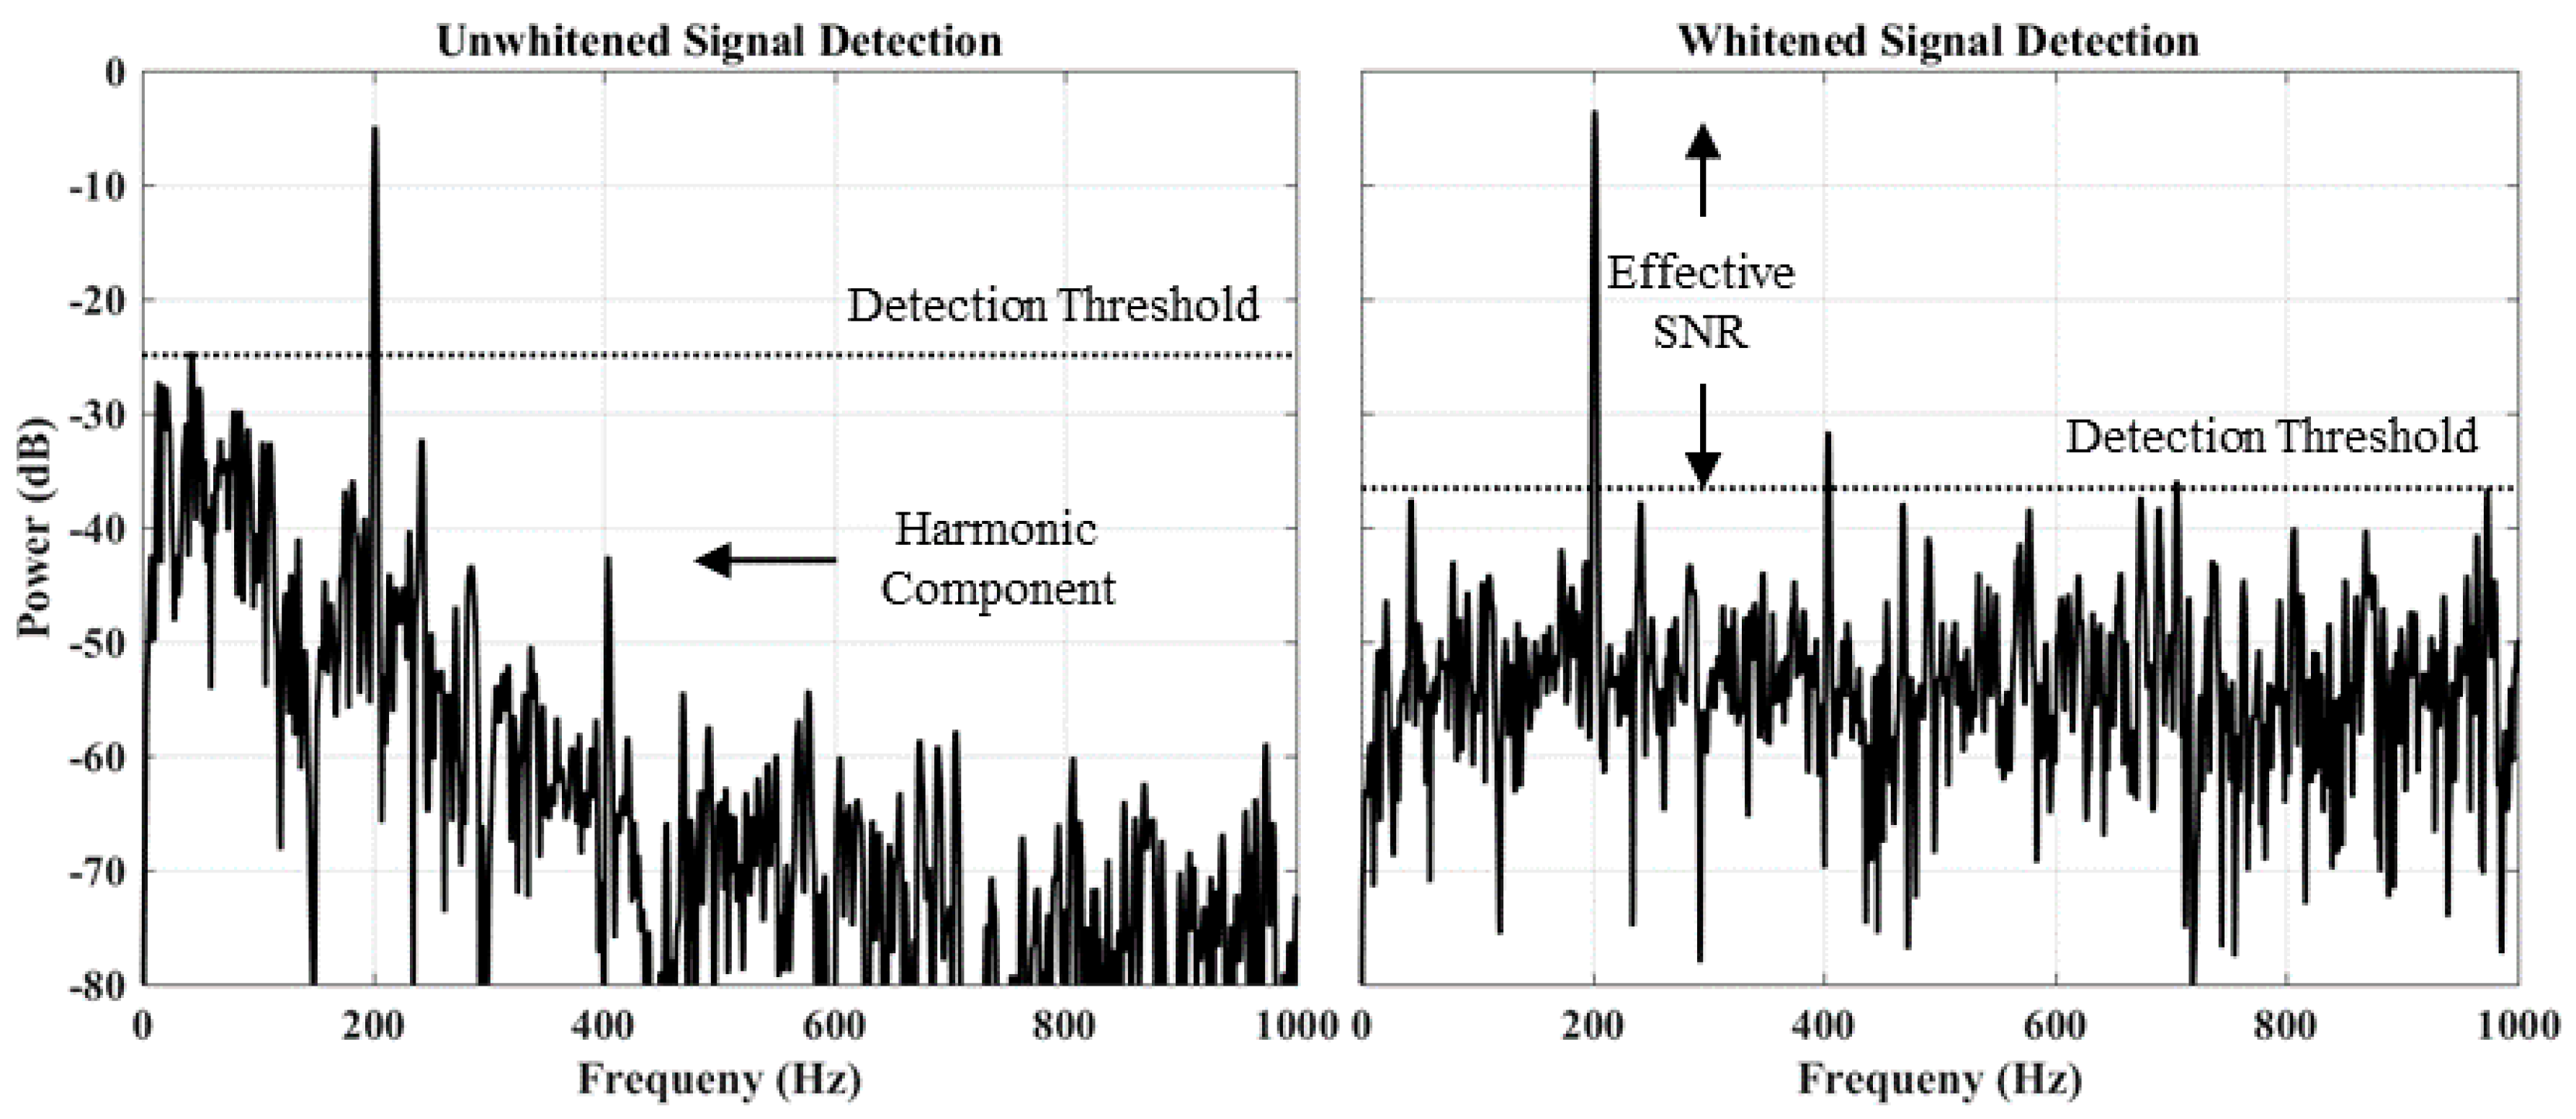
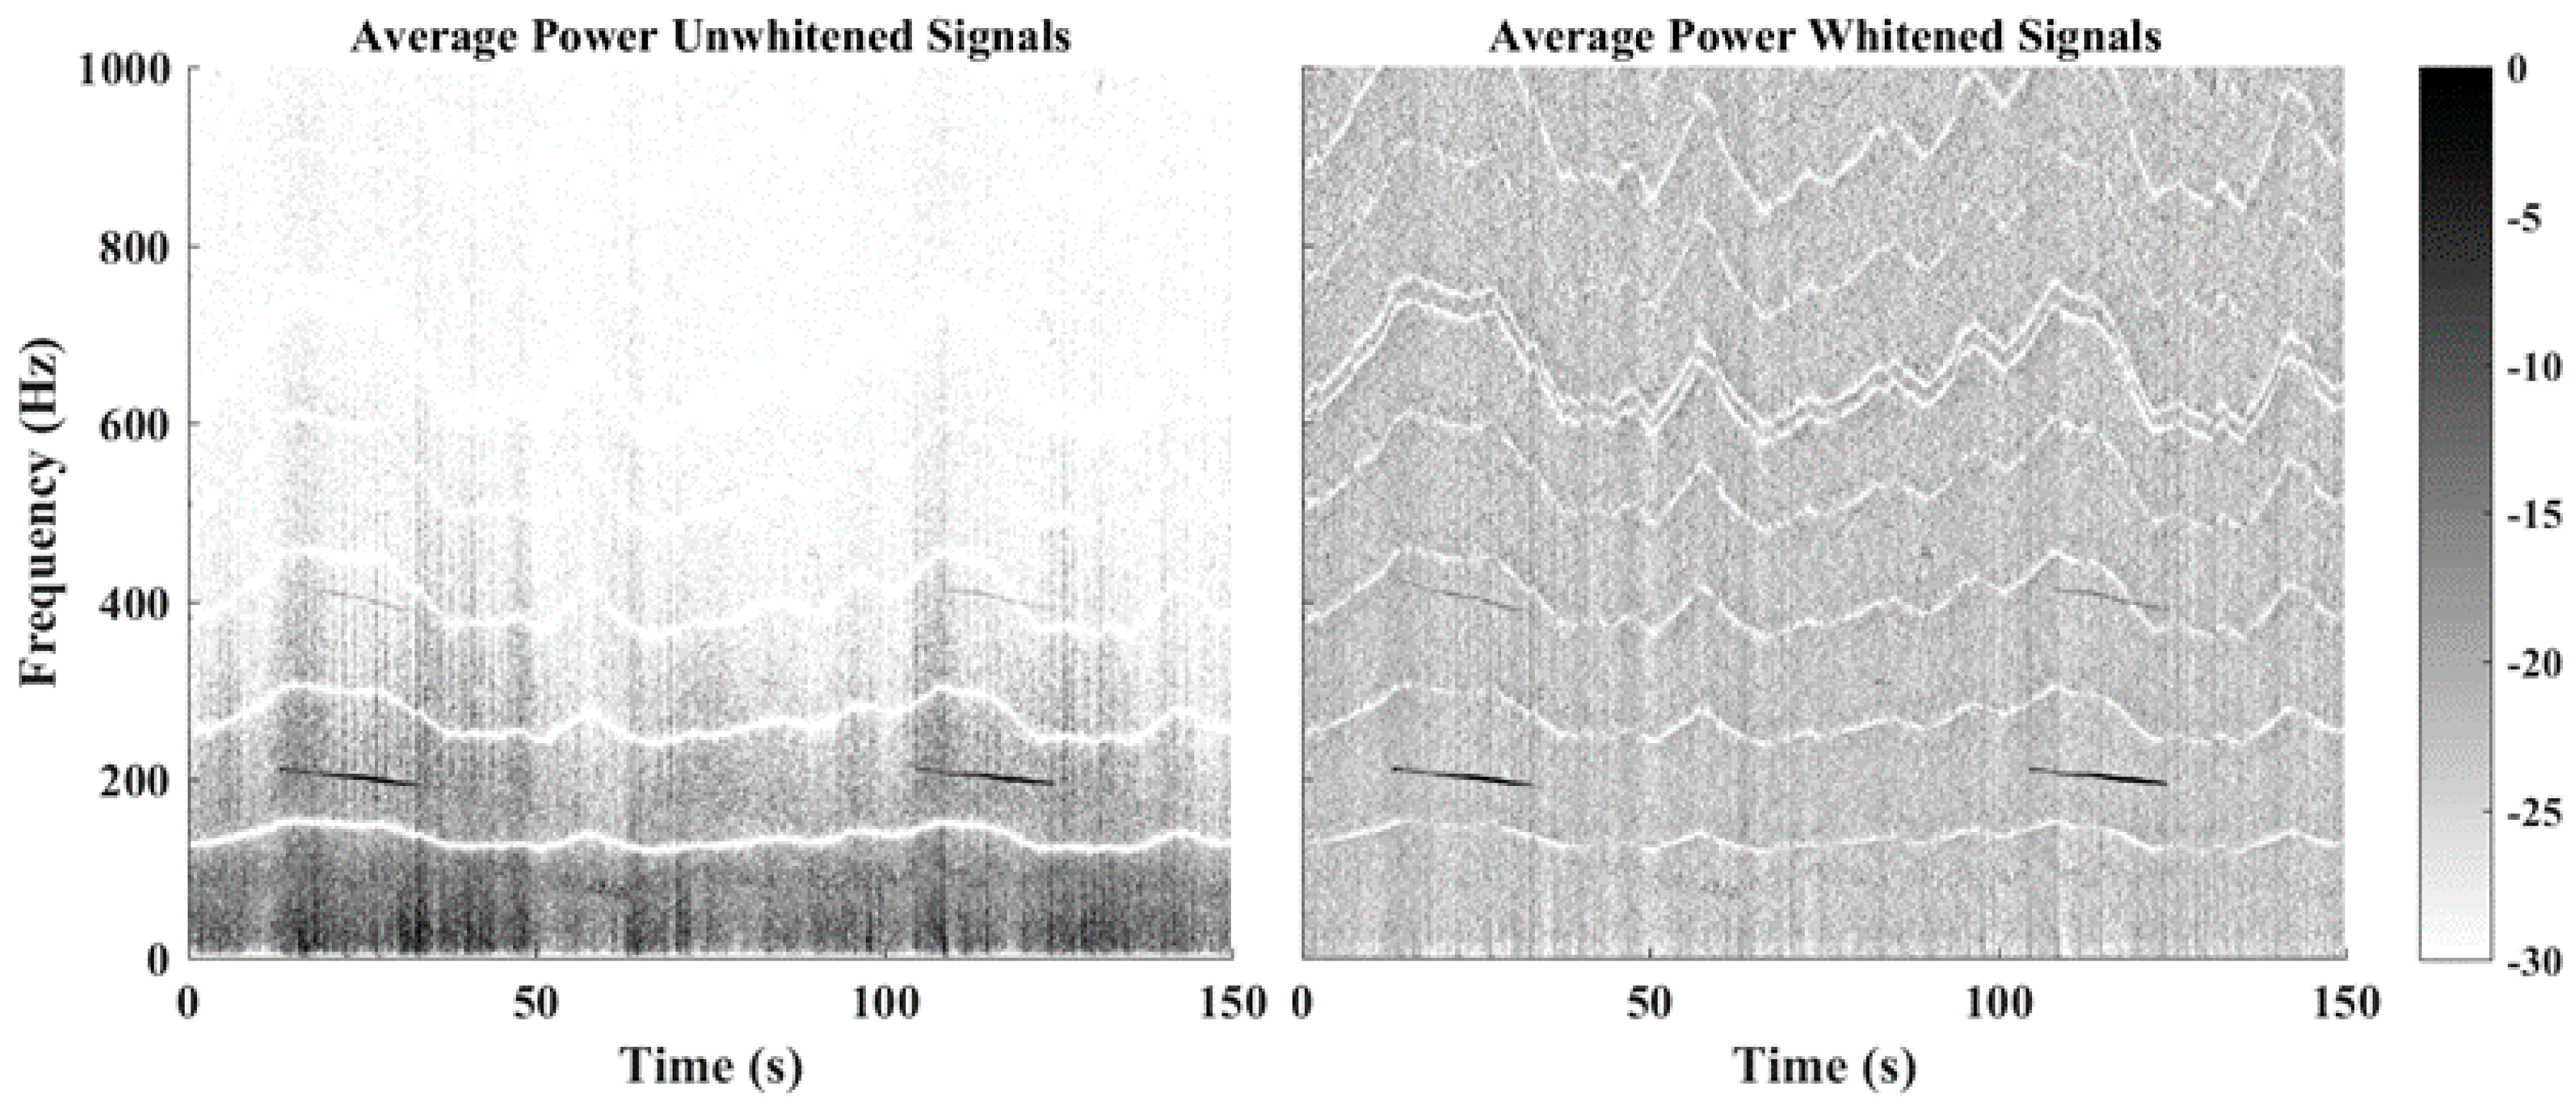
We now provide quantitative results showing the effectiveness of the proposed whitening approach to increase general detection capabilities. Table 4 provides the detection results for the 200 Hz and 500 Hz source signals with a passing altitude of 150 m. For each source frequency, results are provided for the both the whitened and unwhitened signals. It should be noted that the SNR values quoted are not calculated in the manner typical of most signal processing applications. The “effective SNR” was used instead, which closely resembles the spurious free dynamic range. This method provides a more meaningful measure since it compares the peak signal value to the point at which it can no longer be detected (noise floor or detection threshold). It is depicted in the sample spectra displayed in Figure 7. From a comparison of the results obtained, it is apparent that the whitened signals produce significantly better results compared to the standard unwhitened forms; SNR values and detection rates were generally much higher for all of the detection schemes used. In addition to SNR values and overall detection rates, initial detection times were also found to be less for the whitened forms. From a visual inspection of spectrograms displayed in Figure 8 it is apparent that a single harmonic component was present at the 400 Hz location. Although the emitted source contained only a pure 200 Hz tone, the harmonic component was generated by the presence of a reflecting boundary (ground) located directly behind the speaker. However, it is apparent from the power spectra displayed in Figure 8 that this component would not be detectable for the unwhitened signal, since the non-flat power distribution produces an inherently high detection threshold. For the whitened signal, this is not the case and the harmonic component would instead be detected.

5. Conclusions

Based on the results obtained from the analysis provided, it is evident that the proposed CFAR-enhanced spectral whitening method is an effective means to whiten signals in the frequency domain without attenuating potential source components. In addition, the method was also found to transform colored frequency-dependent distributions to a frequency-independent form, thus producing IID variables. This property is considered significant since methods such as the DF-CFAR detector require this feature to accurately predict false alarm rates. The effectiveness of the approach was demonstrated using experimental data, with results confirming the method provides increased detection of narrowband signals when embedded in colored broadband noise.

Acknowledgments

This work was partially funded by the Memorial University of Newfoundland Facility of Engineering & Applied Science, in conjunction with the MRP RAVEN project.

Author Contributions

Harvey performed all experiments, data analysis, and theoretical developments. O’Young facilitated and provided physical support to enable the experiments to be conducted.

Conflicts of Interest

The authors declare no conflict of interest.

References

  1. Farnell, A. Designing Sound; MIT Press: Cambridge, MA, USA, 2010. [Google Scholar]
  2. Thomas, R. (Ed.) Springer Handbook of Acoustics; Springer: New York, NY, USA, 2007; p. 113. [Google Scholar]
  3. Michel, U.; Dobrzynski, W.; Splettstoesser, W.; Delfs, J.; Isermann, U.; Obermeier, F. Aircraft noise. In Handbook of Engineering Acoustics, 1st ed.; Muller, M.M.G., Ed.; Springer Heidelberg: New York, NY, USA, 2013; p. 489. [Google Scholar]
  4. Richards, M.A. Fundamentals of Radar Signal Processing; McGraw-Hill: New York, NY, USA, 2005. [Google Scholar]
  5. Sarma, A.; Tufts, D.W. Robust adaptive threshold for control of false alarms. IEEE Signal Process. Lett. 2001, 8, 261–263. [Google Scholar] [CrossRef]
  6. Ohata, T.; Nakamura, K.; Mizumoto, T.; Taiki, T.; Nakadai, K. Improvement in outdoor sound source detection using a quadrotor-embedded microphone array. In Proceedings of the IEEE/RSJ International Conference on Intelligent Robots and Systems (IROS), Chicago, IL, USA, 14–18 September 2014. [Google Scholar]
  7. Okutani, K.; Yoshida, T.; Nakamura, K.; Nakadai, K. Outdoor auditory scene analysis using a moving microphone array embedded in a quadrocopter. In Proceedings of the IEEE/RSJ International Conference on Intelligent Robots and Systems (IROS), Vilamoura, Portugal, 7–12 October 2012; p. 3288. [Google Scholar]
  8. Ferguson, B.; Wyber, R. Detection and localization of a ground based impulsive sound source using acoustic sensors onboard a tactical unmanned aerial vehicle. In Proceedings of the Battlefield Acoustic Sensing for ISR Applications, Neuilly-sur-Seine, France, 9–10 October 2006; pp. 16-1–16-8. [Google Scholar]
  9. Robertson, D.N.; Pham, T.; Edge, H.; Porter, B.; Shumaker, J.; Cline, D. Acoustic sensing from small-size UAVs. Proc. SPIE 2007, 6562. [Google Scholar] [CrossRef]
  10. Harvey, B.; O’Young, S. Detection of continuous ground-based acoustic sources via unmanned aerial vehicles. J. Unmanned Veh. Syst. 2015, 4, 83–95. [Google Scholar] [CrossRef]
  11. Harvey, B. Signal Processing Methods for the Detection & Localization of Acoustic Sources via Unmanned Aerial Vehicles. Ph.D., Memorial University of Newfoundland, St. John’s, NL, Canada, 2017. [Google Scholar]
  12. Harvey, B.; O’Young, S. Robust distribution-free CFAR detection of nonstationary narrowband signals. Dig. Signal Process. 2017. submitted. [Google Scholar]
  13. Lyons, R.G. Understanding Digital Signal Processing; Prentice Hall: Upper Saddle River, NJ, USA, 2010. [Google Scholar]
  14. Lee, M.W. Spectral Whitening in the Frequency Domain; Open-File Report 86-108; United States Department of the Interior: Denver, CO, USA, 1986.
  15. Blake, S. OS-CFAR theory for multiple targets and nonuniform clutter. IEEE Trans. Aerosp. Electron. Syst. 1988, 24, 785–790. [Google Scholar] [CrossRef]
  16. Finn, H.M.; Johnson, P.S. Adaptive detection mode with threshold control as a function of spatially sampled clutter estimation. RCA Rev. 1968, 29, 414–464. [Google Scholar]
  17. Jalil, A.; Yousaf, H.; Baig, M.I. Analysis of CFAR techniques. In Proceedings of the 2016 13th International Bhurban Conference on Applied Sciences and Technology (IBCAST), Islamabad, Pakistan, 12–16 January 2016. [Google Scholar]
  18. Rohling, H. Radar CFAR thresholding in clutter and multiple target situations. IEEE Trans. Aerosp. Electron. Syst. 1983, AES-19, 608–621. [Google Scholar] [CrossRef]
  19. Ritcey, J.A. Performance analysis of the censored mean-level detector. IEEE Trans. Aerosp. Electron. Syst. 1986, AES-22, 443–454. [Google Scholar] [CrossRef]
  20. Gandhi, P.P.; Kassam, S.A. Analysis of CFAR processors in nonhomogeneous background. IEEE Trans. Aerosp. Electron. Syst. 1988, 24, 427–445. [Google Scholar] [CrossRef]
  21. Tan, L.; Jiang, J. Novel adaptive IIR filter for frequency estimation and tracking [DSP Tips&Tricks]. IEEE Signal Process. Mag. 2009, 26, 186–189. [Google Scholar]
  22. Tan, L.; Jiang, J. Real-time frequency tracking using novel adaptive harmonic IIR notch filter. Technol. Interface J. 2009, 9. [Google Scholar]
  23. Tan, L.; Jiang, J. Simplified gradient adaptive harmonic IIR notch filter for frequency estimation and tracking. Am. J. Signal Process. 2015, 5, 6–12. [Google Scholar]
  24. Tan, L.; Jiang, J.; Wang, L. Adaptive harmonic IIR notch filters for frequency estimation and tracking. In Adaptive Filtering; Garcia, L., Ed.; InTech: Rijeka, Croatia, 2011; p. 313. [Google Scholar]
Figure 1. Power spectra of various aircraft during fly-by.
Drones 02 00001 g001
Figure 2. Plots illustrating spectral whitening.
Drones 02 00001 g002
Figure 3. Spectrograms of noise corrupted and notched filtered signals for the 200 Hz source.
Drones 02 00001 g003
Figure 4. Spectrogram of original unwhitened signal.
Drones 02 00001 g004
Figure 5. Spectrogram of whitened signal using standard and CFAR-enhanced methods.
Drones 02 00001 g005
Figure 6. Comparison of standard and CFAR-enhanced whitening methods.
Drones 02 00001 g006
Figure 7. Power spectra illustrating signal detection for whitened and unwhitened signals.
Drones 02 00001 g007
Figure 8. Spectrograms of whitened and unwhitened signal segments for the 200 Hz source.
Drones 02 00001 g008
Table 1. Signal preprocessing and filter parameters.
Sampling Frequency ( f s )48 kHzNumber of Signals4
Decimation Factor8FFT Window0.5 s
IIR Step Size ( μ )5 × 10⁻⁴Window Overlap50%
Notch Radius ( r )0.995Padded Length ( L f f t )12,000 pts
Harmonics Removed ( R )8Spectral Resolution ( f r )0.5 Hz/bin
Table 2. CFAR-enhanced spectral whitening parameters.
Detector TypeOS-CFARNoise Samples ( N ) 101
Forgetting Factor ( ξ )0.2Order Statistic ( k ) 0.75   N
Flooring Factor ( δ )0.5Guard Cell Band ( G )5.5 Hz
Noise Band ( N )50 HzGuard Cells ( G )12
Table 3. SCDF-CFAR detection parameters.
Noise Sample Band ( N )1–1000 HzConsecutive Detections ( D )2
Test Band ( B )150–550 HzCell Deviation ( Δ )1
Guard Cell Band ( G )10.5 HzMaxima Tested ( M )2
Noise Samples ( N )1998 pts P F A S C 1.0 × 10⁻³
Test Cells ( B )801 pts P F A S T 6.5 × 10⁻¹
Guard Cells (G)22 pts P F A B I 8.2 × 10⁻⁴
Order Statistic ( k ¯ )2 P F A R B I 2.5 × 10⁻³
Consecutive Trials ( T )2
Table 4. Detection results for 150 m passing altitude.
f o = 200 Hz f o = 500 Hz
UnwhitenedWhitenedUnwhitenedWhitened
Detection Rate (ST, BI, RBI)64%, 54%, 55%100%, 97%, 99%69%, 37%, 51%100%, 63%, 83%
Max SNR28 dB38.3 dB26.5 dB47.4 dB
Average SNR12.4 dB19.7 dB8.2 dB32.5 dB
Initial Detection13.25 s13 s11 s10.5 s
Second Detection20.25 s13.25 s12 s10.75 s
Observed Frequency Range 212–190 Hz523–479 Hz