Abstract
In recent decades, heavy metal contamination in soils has caused global concern. Quantitative apportionment of heavy metal sources in the surface soil is a complex task. This study indicated a receptor model to evaluate the heavy metal concentrations of various sources for the soil and the related contamination impacts. In this study, the surface soil at the Cerrito Blanco in San Luis Potosi, Mexico was chosen as the case study location to reveal the potential pollution sources of heavy metals. The research suggested the combined use of the positive matrix factorization (PMF) model for the quantitative assessment of contamination sources as well as the spatial distribution techniques for the estimation of the pollution sources. This approach forms the basis for later soil contamination control and treatment. Throughout the study region, a total of thirty-nine samples of surface soil were collected. However, the mean concentration levels of Co, Cr, Cu, Ni, and Pb in the soils were lower than the permissible standards. It was observed that As and Cd were higher than their permissible standard values by around 5.43 and 1.19 times, respectively. The PMF findings demonstrate that the three main diverse sources of heavy metals in this study area’s soils were natural, past mining activities, and industrialisation, as well as groundwater. The concentrations of heavy metals in surface soils were considerably influenced by natural sources, which were generally the main contributing factor. The spatial distribution of soil contamination for heavy metals was also mapped using the geographic information system (GIS) technique.
1. Introduction
Heavy metal background levels in soils are mostly derived from parent rocks. Heavy metals accumulate in the soil through atmospheric deposition, sedimentation, sewage irrigation, as well as other routes as a result of excessive industrial and agricultural activities [1,2]. However, there are several geological and anthropogenic sources of heavy metal contaminants, including air deposition, industrial discharges, fertiliser application, pesticide usage, etc., that might contribute to their presence in the soil in urban–rural peripheral zones [3,4]. Therefore, it is essential to evaluate heavy metal contamination along with necessary toxicological assessment.
Source apportionment is critical for adequately controlling metal contaminant inputs and determining an acceptable criterion for soil remediation is facilitated by a thorough assessment of heavy metals background concentrations [5,6,7]. There is a common assumption that the two main sources of heavy metals are natural processes and human activities [8]. The geological parent material primarily controls the natural source apportionments of soil heavy metals [9]. Additionally, the anthropogenic sources of soil heavy metals include mining, agriculture, vehicle emissions, ore deposits, industrial emissions, coal burning, atmospheric deposition, etc. [4,8,10]. To determine the source identifications and the spatial variations of heavy metals in soils, multivariate statistics are implemented in combination with geostatistical techniques [11,12]. There are also many receptor models which are used to identify the sources of heavy metals. The most prominent and widely used receptor models are principal component analysis/absolute principal component scores (PCA/APCS), positive matrix factorization (PMF), and UNMIX [4,13,14]. In the early 1990s, source identification of pollutants in the atmosphere was done using positive matrix factorization (PMF) [15]. Additionally, in recent years, it has been used successfully to assign source contributions in sediments, soils, and aquatic systems [8,16]. Therefore, this study used the PMF model to determine the sources of seven heavy metals in the surface soils of Cerrito Blanco, Matehuala, Mexico.
In this study, the source apportionment of arsenic (As), cadmium (Cd), cobalt (Co), chromium (Cr), copper (Cu), nickel (Ni), and lead (Pb) in the surface soil are evaluated using the PMF source identification receptor model. The specific objectives of this study are as follows:
- (i)
- to estimate the heavy metal concentrations in the surface soil around Cerrito Blanco, Matehuala, San Luis Potosi, Mexico;
- (ii)
- to identify the possible pollution sources of the heavy metals using the PMF model;
- (iii)
- to analyse the spatial distribution patterns of source factors of heavy metals.
2. Study Area
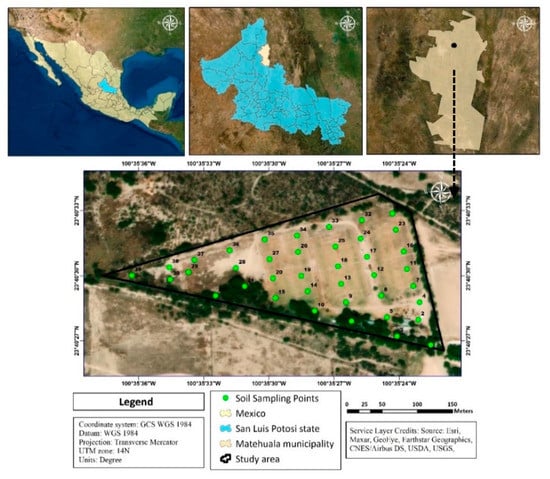
The selected study area is located between 23°40′30″ N latitude and 100°35′27″ W longitude around Joya Verde soccer sports club, a non-cultivated farming area of Cerrito Blanco, Matehuala municipality, San Luis Potosi, Mexico, with a total land area of approx. 4.84 ha (Figure 1). The soccer club is around 14 years old, and it includes three soccer fields. It is surrounded by semi-arid vegetation and underdeveloped agricultural farmland [10,17]. The mean annual temperature in this area is 14° celsius. The rainy season lasts from June to September, with a 300 mm average rainfall [17,18,19].

Figure 1.
The study area map showing the distribution of soil sampling points.
3. Materials and Methods
3.1. Soil Sampling and Chemical Analysis
To evaluate the source apportionment of heavy metals in Cerrito Blanco, Matehuala area, 39 surface soil samples were collected using an auger at the depth of 0–5 cm from soccer fields and scrub areas around the fields. A proportion less than 2 mm was obtained by sieving the soil samples after they were air-dried at room temperature. According to a considerably modified version of ISO 11466:1995, surface soil samples were digested [20,21]. Next, 10 mL of aqua regia (HNO3:HCl, 3:1) was then added to a beaker containing 1.0 gm of soil sample. The total accessible heavy metals in soils may be determined using this digestion process [17,22]. Inductively coupled plasma optical emission spectroscopy (ICP-OES) was used to determine the heavy metal concentrations in the surface soil [17,23]. For each sample site, a Garmin Etrex personal navigator GPS was used to record the location’s coordinates using the WGS-1984 coordinate system.
3.2. Positive Matrix Factorization Model (PMF) Model
PMF is a receptor model that the United States Environmental Protection Agency has recommended to analyse the different types of sources of environmental pollution [8,24,25]. This model was developed by Paatero and Tapper (1994) [15]. A matrix of speciated sample data is divided by the PMF model into two matrices: factor profiles () and factor contributions () [26]. In this research, the PMF 5.0 model was implemented to source identification of heavy metals in the surface soils.
where is a quantitative matrix for the th heavy metal component in samples; denoted a contribution matrix of the th source factor; for the th source factor, represents a source factor of the th heavy metal component, and the residual value for the th metal element over numbers of samples is denoted by the symbol .
where is the difference (i.e., ) between the and the output of , weighted by the uncertainty measurement .
Two input files are needed for the PMF model: soil sample concentration values and soil sample uncertainty values. The following equation was used to estimate the uncertainty values:
where is the concentration values of soil samples, is the species-specific method detection limit, and the error fraction represents the uncertainty measurement percentage.
3.3. Data Processing and Analysis
The descriptive statistical analysis of the soil samples was performed with SPSS Statistics version 28. ESRI’s (Redlands, CA, USA) ArcGIS software was used for spatial distribution mapping of source factors of heavy metals. The source identification of the heavy metals was quantitatively determined using the EPA PMF 5.0 software (United States Environmental Protection Agency - Positive Matrix Factorization (USEPA-PMF), Washington, DC, USA).
4. Results
4.1. Descriptive Statistics of Heavy Metals Concentrations in Soils
Table 1 shows the comprehensive statistical results for seven heavy metals in the surface soil of Cerrito Blanco. The average concentrations of all heavy metals increased in the following sequence: Co < Cd < Cr < Ni < Cu < Pb < As. The concentrations of all heavy metals in the soil are lower than the permissible limit or metal reference values, except As and Cd. The concentration of As in the soil is about 5 times higher than the permissible limit, which means that the level of As contamination in this soil is very high. The permissible limits of heavy metals in the surface soil were As (22 mg/kg) [17], Cd (0.80 mg/kg) [27], Co (40 mg/kg) [28], Cr (100 mg/kg) [27], Cu (36 mg/kg) [21], Ni (35 mg/kg) [27], and Pb (85 mg/kg) [21]. All the permissible limit values given in this study are taken as per the global standard values of different places published in previous studies. The reference values of heavy metals in the surface soils of Mexico were As (22 mg/kg), Cd (37 mg/kg), Co (not regulated), Cr (280 mg/kg), Cu (not regulated), Ni (1600 mg/kg), and Pb (400 mg/kg) [29]. The coefficient of variation (CV) is classified as low (CV < 16), moderate (16 < CV < 36), and high (CV > 36) [25,30]. The CV of As is 91.71, and the degree of variation is very high, which is more than other metals. However, there was greater variation and spatial dispersion in the soil of this study area for heavy metals.

Table 1.
Statistical summary of heavy metal concentrations in soils.
4.2. Source Apportionment of Heavy Metals by PMF
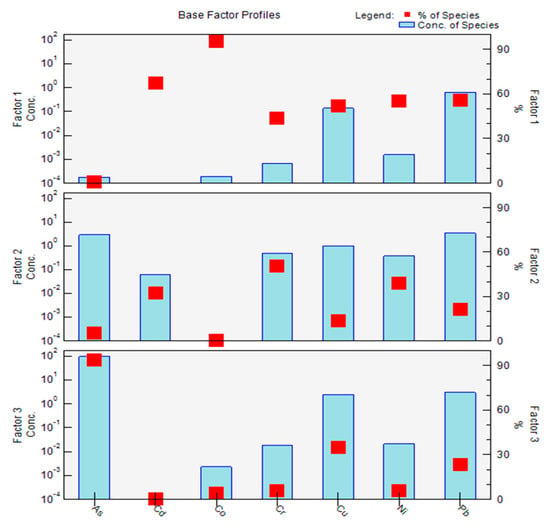
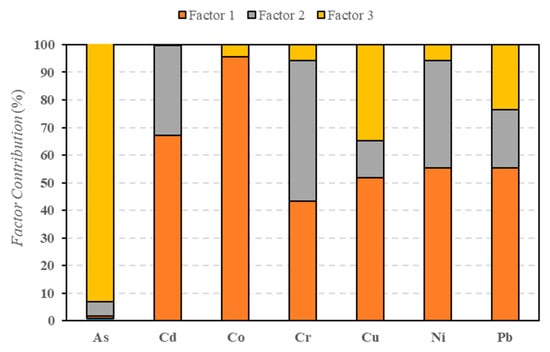
The PMF model was performed to better understand the sources of heavy metals in the soil along the Cerrito Blanco, Matehuala and to evaluate their apportionment to each of the heavy metals (Figure 2). The model was run 20 times with the factors set to 3, 4, and 5. The Q value was the lowest, and the majority of the residual fell between −3 and 3 [24] for the three-factor analysis. The contributions of heavy metals in factor 1 increased in the following order: As < Cr < Cu < Ni < Pb < Cd < Co (Figure 3). The Cr, Ni, and Cd concentrations, which account for 50.76%, 32.44%, and 38.75% of factor 2, respectively, are the major contributions, with limited impact from other metal sources. Factor 3 was dominated by As (94.02%), Cu (34.74%), and Cd (23.46%) (Figure 3).

Figure 2.
Source profiles and source contributions of heavy metals in the soil from PMF.

Figure 3.
Factors fingerprint of each heavy metal contributing to the different pollution sources.
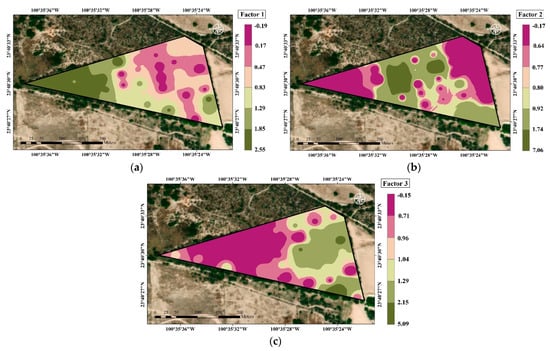
Factor 1 showed a significant positive load of Co, Cd, Ni, Pb, Cu, and Cr in the source contributions and were close or below to the permissible limit standards derived from the surface soil. Therefore, the results were revealing that factor 1 is a significant lithogenic source. The concept of ionic reaction may be able to explicate the clustering characteristic resulting from PMF, since the concentration values and correlations of heavy metals may fluctuate across various parent materials. According to the spatial distribution mapping of factor 1, the study area’s western side which is surrounded by semi-arid vegetation contains the majority of the high-value locations (Figure 4). This result was in line with the concentration–distribution patterns of Co, Cd, Cu, and Ni where significant concentrations of these heavy metals were found close to each other. The average concentrations of Co, Cd, Cu, Ni, and Pb were close to their respective permissible limits; hence, they could be of natural origin. Therefore, factor 1 might be classified as a natural source.

Figure 4.
Spatial distribution of PMF source factors in the surface soil: (a) Factor 1; (b) Factor 2; (c) Factor 3.
Factor 2 was associated with Cr, Ni, and Cd (Figure 3). According to the results, these three metals contributed to this source factor more significantly than the other four metals. Previous research revealed that non-ferrous metal smelting, smelter slags, mining, geochemical exploration, and other industrial operations were the sources of the heavy metal contamination found in Mexican soils [10,31,32]. The major sources of Cd have been identified as of metallurgical origin [8]. Industrial emissions are the only source of Cr and Ni. The spatial distribution of factor 2 shows that the middle portion of the study area of the soccer field has the majority of the high-value locations (Figure 4). As a result, it is possible to confirm that factor 2 represents the mining and industrial sources.
Figure 3. had more significant contributions of As, Cu, and Pb than the other three sources. The As is mostly associated with irrigation water and is observed in a considerable area of soccer fields and the surrounding study area. Studies conducted earlier revealed that the water in the study area had incredibly high quantities of heavy metals, which are caused by the dissolution of metallurgical waste from an abandoned smelter upstream of Matehuala [17,18,19]. Unfortunately, this contaminated water is the main water source for local agriculture [17,20]. Inorganic As, Cu, and Pb chemicals such as sodium arsenate, lead arsenate, calcium arsenate, cattle dung, animal waste, and fertilisers were utilised as herbicides or pesticides in the surrounding farmland, which probably has an impact on the groundwater. The spatial distribution pattern of factor 3 revealed that the soccer field area with high local concentrations is mostly affected by irrigation (Figure 4). Therefore, it might be concluded that factor 3 reflected the groundwater sources.
5. Conclusions
This study measured the contamination risks by descriptive statistical analysis approach, identification of various sources of heavy metals in the surface soil using the PMF model, and observed the spatial distribution patterns of source factors based on an IDW interpolation technique. This study concluded that the mean concentrations of Co, Cr, Cu, Ni, and Pb in the surface soils in Cerrito Blanco were lower than their permissible limits. But the mean concentrations of As and Cd were higher than their permissible limits. The PMF results showed that the identification of source contribution for heavy metals in the surface soil was as follows: 53% for natural sources, 23% for mining activities and industrialization sources, and 24% for irrigational groundwater sources. However, the spatial distribution patterns of source factors and model outcomes revealed that Co, Cd, Cu, Ni, and Pb originated from natural sources; Cr, Cd, and Ni may be obtained from past mining and industrialization; and As and Cu mainly came from groundwater sources. The results of this study are relevant to the growing concern for the human risk of As exposure from the surface soil in recreational and agricultural areas.
Supplementary Materials
The following supporting information can be downloaded at: https://www.mdpi.com/article/10.3390/IECG2022-13746/s1.
Author Contributions
Conceptualization, A.S. and B.S.G.; methodology, A.S. and B.S.G.; software, A.S.; formal analysis, A.S., B.S.G., S.P. and N.M.-V.; investigation, A.S. and B.S.G.; resources, A.S., B.S.G. and S.P.; data curation, B.S.G. and N.M.-V.; writing—original draft preparation, A.S.; writ-ing—review and editing, A.S., B.S.G., S.P. and N.M.-V.; visualization, A.S.; supervision, B.S.G. and S.P.; project administration, B.S.G.; funding acquisition, B.S.G. and N.M.-V. All authors have read and agreed to the published version of the manuscript.
Funding
The project has received funding from the Engineering and Physical Sciences Research Council (EPSRC-IAA), UKRI through Project 748502: Spreading the Chemical Free Arsenic Re-moval Technology to Various Communities in India, Bangladesh, and Mexico.
Data Availability Statement
The data and information cited in the paper can be found in the re-ported literature as references.
Acknowledgments
The authors are thankful to the Institute of Infrastructure and Environment, The School of Energy, Geoscience, Infrastructure and Society (EGIS), Heriot–Watt University, Edin-burgh for providing support and a student bursary to the first author for doctoral research through the James Watt Scholarship. The authors also thank IPICyT, San Luis Potosi, Mexico for providing the necessary data, feedback, and support. We used some heavy metals data and GIS shapefile data while working on this study, and the data has been published previously in the International Journal of Environmental Research and Public Health, MDPI in 2018 and Journal of South American Earth Sciences, Elsevier in 2022 for a different type of study on toxic metal contamination. References to these studies are cited in the inner text.
Conflicts of Interest
The authors declare no conflict of interest.
References
- Shi, T.; Ma, J.; Wu, X.; Ju, T.; Lin, X.; Zhang, Y.; Li, X.; Gong, Y.; Hou, H.; Zhao, L.; et al. Inventories of heavy metal inputs and outputs to and from agricultural soils: A review. Ecotoxicol. Environ. Saf. 2018, 164, 118–124. [Google Scholar] [CrossRef] [PubMed]
- Yang, Q.; Li, Z.; Lu, X.; Duan, Q.; Huang, L.; Bi, J. A review of soil heavy metal pollution from industrial and agricultural regions in China: Pollution and risk assessment. Sci. Total Environ. 2018, 642, 690–700. [Google Scholar] [CrossRef] [PubMed]
- Sun, L.; Carey, M.; Yang, L.; Chen, L.-D.; Li, S.-J.; Zhao, F.-K.; Zhu, Y.-G.; Meharg, C.; Meharg, A.A. Source Identification of Trace Elements in Peri-urban Soils in Eastern China. Expo. Health 2018, 11, 195–207. [Google Scholar] [CrossRef]
- Su, H.; Hu, Y.; Wang, L.; Yu, H.; Li, B.; Liu, J. Source Apportionment and Geographic Distribution of Heavy Metals and as in Soils and Vegetables Using Kriging Interpolation and Positive Matrix Factorization Analysis. Int. J. Environ. Res. Public Health 2022, 19, 485. [Google Scholar] [CrossRef]
- Ha, H.; Olson, J.R.; Bian, L.; Rogerson, P.A. Analysis of Heavy Metal Sources in Soil Using Kriging Interpolation on Principal Components. Environ. Sci. Technol. 2014, 48, 4999–5007. [Google Scholar] [CrossRef]
- Li, Y.; Duan, Z.; Liu, G.; Kalla, P.; Scheidt, D.; Cai, Y. Evaluation of the Possible Sources and Controlling Factors of Toxic Metals/Metalloids in the Florida Everglades and Their Potential Risk of Exposure. Environ. Sci. Technol. 2015, 49, 9714–9723. [Google Scholar] [CrossRef]
- Lv, J.; Liu, Y. An integrated approach to identify quantitative sources and hazardous areas of heavy metals in soils. Sci. Total. Environ. 2018, 646, 19–28. [Google Scholar] [CrossRef]
- Liang, J.; Feng, C.; Zeng, G.; Gao, X.; Zhong, M.; Li, X.; Li, X.; He, X.; Fang, Y. Spatial distribution and source identification of heavy metals in surface soils in a typical coal mine city, Lianyuan, China. Environ. Pollut. 2017, 225, 681–690. [Google Scholar] [CrossRef]
- Liu, J.; Liang, J.; Yuan, X.; Zeng, G.; Yuan, Y.; Wu, H.; Huang, X.; Liu, J.; Hua, S.; Li, F.; et al. An integrated model for assessing heavy metal exposure risk to migratory birds in wetland ecosystem: A case study in Dongting Lake Wetland, China. Chemosphere 2015, 135, 14–19. [Google Scholar] [CrossRef]
- Saha, A.; Gupta, B.S.; Patidar, S.; Martínez-Villegas, N. Spatial distribution based on optimal interpolation techniques and assessment of contamination risk for toxic metals in the surface soil. J. S. Am. Earth Sci. 2022, 115, 103763. [Google Scholar] [CrossRef]
- Wang, Z.; Shen, Q.; Hua, P.; Jiang, S.; Li, R.; Li, Y.; Fan, G.; Zhang, J.; Krebs, P. Characterizing the anthropogenic-induced trace elements in an urban aquatic environment: A source apportionment and risk assessment with uncertainty consideration. J. Environ. Manag. 2020, 275, 111288. [Google Scholar] [CrossRef]
- Agyeman, P.C.; John, K.; Kebonye, N.M.; Borůvka, L.; Vašát, R.; Drábek, O. A geostatistical approach to estimating source apportionment in urban and peri-urban soils using the Czech Republic as an example. Sci. Rep. 2021, 11, 23615. [Google Scholar] [CrossRef] [PubMed]
- Wang, S.; Cai, L.-M.; Wen, H.-H.; Luo, J.; Wang, Q.-S.; Liu, X. Spatial distribution and source apportionment of heavy metals in soil from a typical county-level city of Guangdong Province, China. Sci. Total. Environ. 2018, 655, 92–101. [Google Scholar] [CrossRef] [PubMed]
- Zhang, H.; Yin, A.; Yang, X.; Fan, M.; Shao, S.; Wu, J.; Wu, P.; Zhang, M.; Gao, C. Use of machine-learning and receptor models for prediction and source apportionment of heavy metals in coastal reclaimed soils. Ecol. Indic. 2020, 122, 107233. [Google Scholar] [CrossRef]
- Paatero, P.; Tapper, U. Positive matrix factorization: A non-negative factor model with optimal utilization of error estimates of data values. Environmetrics 1994, 5, 111–126. [Google Scholar] [CrossRef]
- Chen, H.; Teng, Y.; Li, J.; Wu, J.; Wang, J. Source apportionment of trace metals in river sediments: A comparison of three methods. Environ. Pollut. 2016, 211, 28–37. [Google Scholar] [CrossRef]
- Martínez-Villegas, N.; Hernández, A.; Meza-Figueroa, D.; Gupta, B.S. Distribution of Arsenic and Risk Assessment of Activities on Soccer Pitches Irrigated with Arsenic-Contaminated Water. Int. J. Environ. Res. Public Health 2018, 15, 1060. [Google Scholar] [CrossRef]
- Razo, I.; Carrizales, L.; Castro, J.; Barriga, F.D.; Monroy, M. Arsenic and Heavy Metal Pollution of Soil, Water and Sediments in a Semi-Arid Climate Mining Area in Mexico. Water Air Soil Pollut. 2004, 152, 129–152. [Google Scholar] [CrossRef]
- Martínez-Villegas, N.; Briones-Gallardo, R.; Ramos-Leal, J.A.; Avalos-Borja, M.; Castañón-Sandoval, A.D.; Razo-Flores, E.; Villalobos, M. Arsenic mobility controlled by solid calcium arsenates: A case study in Mexico showcasing a potentially widespread environmental problem. Environ. Pollut. 2013, 176, 114–122. [Google Scholar] [CrossRef]
- Ruíz-Huerta, E.A.; Varela, A.D.L.G.; Gómez-Bernal, J.M.; Castillo, F.; Avalos-Borja, M.; SenGupta, B.; Martínez-Villegas, N. Arsenic contamination in irrigation water, agricultural soil and maize crop from an abandoned smelter site in Matehuala, Mexico. J. Hazard. Mater. 2017, 339, 330–339. [Google Scholar] [CrossRef]
- Saha, A.; Gupta, B.S.; Patidar, S.; Martínez-Villegas, N. Evaluation of Potential Ecological Risk Index of Toxic Metals Contamination in the Soils. Chem. Proc. 2022, 10, 59. [Google Scholar] [CrossRef]
- Vercoutere, K.; Fortunati, U.; Muntau, H.; Griepink, B.; Maier, E.A. The certified reference materials CRM 142 R light sandy soil, CRM 143 R sewage sludge amended soil and CRM 145 R sewage sludge for quality control in monitoring environmental and soil pollution. Anal. Bioanal. Chem. 1995, 352, 197–202. [Google Scholar] [CrossRef]
- United States Environmental Protection Agency (USEPA). Method 200.7: Revision 4.4, Determination of Metals and Trace Elements in Water and Wastes by Inductively Coupled Plasma-Atomic Emission Spectrometry; United States Environmental Protection Agency: Cincinnati, OH, USA, 1994. [Google Scholar]
- Guan, Q.; Wang, F.; Xu, C.; Pan, N.; Lin, J.; Zhao, R.; Yang, Y.; Luo, H. Source apportionment of heavy metals in agricultural soil based on PMF: A case study in Hexi Corridor, northwest China. Chemosphere 2018, 193, 189–197. [Google Scholar] [CrossRef] [PubMed]
- Li, Y.; Xu, Z.; Ren, H.; Wang, D.; Wang, J.; Wu, Z.; Cai, P. Spatial Distribution and Source Apportionment of Heavy Metals in the Topsoil of Weifang City, East China. Front. Environ. Sci. 2022, 10, 469. [Google Scholar] [CrossRef]
- Hu, W.; Wang, H.; Dong, L.; Huang, B.; Borggaard, O.K.; Hansen, H.C.B.; He, Y.; Holm, P.E. Source identification of heavy metals in peri-urban agricultural soils of southeast China: An integrated approach. Environ. Pollut. 2018, 237, 650–661. [Google Scholar] [CrossRef] [PubMed]
- Dt, O.; Aa, A.; Oe, O. Heavy Metal Concentrations in Plants and Soil along Heavy Traffic Roads in North Central Nigeria. J. Environ. Anal. Toxicol. 2015, 5, 1. [Google Scholar] [CrossRef]
- Kosiorek, M.; Wyszkowski, M. Remediation of Cobalt-Contaminated Soil Using Manure, Clay, Charcoal, Zeolite, Calcium Oxide, Main Crop (Hordeum vulgare L.), and After-Crop (Synapis alba L.). Minerals 2020, 10, 429. [Google Scholar] [CrossRef]
- Secretaría de Medio Ambiente y Recursos Naturales. Que establece criterios para determinar las concentraciones de remediación de suelos contaminados por arsénico, bario, berilio, cadmio, cromo hexavalente, mercurio, níquel, plata, plomo, selenio, talio y/o vanadio. 2007, pp. 35–96. Available online: https://www.gob.mx/cms/uploads/attachment/file/135331/48.-_NORMA_OFICIAL_MEXICANA_NOM-147-SEMARNAT-SSA1-2004.pdf (accessed on 8 October 2022).
- Wilding, L.P. Spatial variability: Its documentation, accomodation and implication to soil surveys. In Proceedings of the Soil spatial var-iability, Las Vegas, NV, USA, 30 November–1 December 1984; pp. 166–194. [Google Scholar]
- Castro-Larragoitia, J.; Kramar, U.; Puchelt, H. 200 years of mining activities at La Paz/San Luis Potosí/Mexico—Consequences for environment and geochemical exploration. J. Geochem. Explor. 1997, 58, 81–91. [Google Scholar] [CrossRef]
- Manz, M.; Castro, L. The environmental hazard caused by smelter slags from the Sta. Maria de la Paz mining district in Mexico. Environ. Pollut. 1997, 98, 7–13. [Google Scholar] [CrossRef]
Disclaimer/Publisher’s Note: The statements, opinions and data contained in all publications are solely those of the individual author(s) and contributor(s) and not of MDPI and/or the editor(s). MDPI and/or the editor(s) disclaim responsibility for any injury to people or property resulting from any ideas, methods, instructions or products referred to in the content. |
© 2022 by the authors. Licensee MDPI, Basel, Switzerland. This article is an open access article distributed under the terms and conditions of the Creative Commons Attribution (CC BY) license (https://creativecommons.org/licenses/by/4.0/).