1. Introduction
The concept of an archipelagic state is regulated in the third United Nations Convention on the Law of the Sea, 1982 (UNCLOS, 1982). It explains that an archipelagic country consists of one or more islands, and includes a group of islands, the waters of which are made as a natural manifestation of a unified economic and political geography [
1]. Indonesia declared itself to be an archipelago country through the Djuanda Declaration on 13 December 1957. The Indonesian seas became one unit with the territory (land) of the Unitary Republic of Indonesia, including the sea around, between, and within the archipelago. Furthermore, Indonesia is also located in a strategic cross position between two oceans and two continents, so it merits being called an archipelagic country on the maritime axis [
2].
In terms of business, Indonesia is at the crossroads of international trade routes where 90% of world trade is transported using sea transportation and 40% is through the three straits in Indonesia. Furthermore, Indonesia is a world natural tourist destination [
3,
4]. Additionally, in terms of productivity, port security is still a house of cards [
5]. As a member of the International Maritime Organization (IMO) board since 1973, Indonesia has ratified international cooperation conventions in maritime safety and security, including marine environment protection. As an archipelagic country with many back doors that must be secured, transportation security is a major strategic issue; both ports and shipping lanes are essential for multinational investment activities [
6].
Shipping security practices in Indonesia are carried out by the Maritime Port Authority (Directorate General of Sea Transportation-DJPL) according to the International Ship and Port Facility Security Code (ISPS-Code) based on guidance from the IMO and the Safety of Life at Sea (SOLAS) chapter XI-2. Both ships and port facilities have reported a decrease in the number of incidents of theft and accidents in security-restricted areas. In addition, it was reported that there was a significant decline in stowaway cases at US ports in the first six months after the introduction of the ISPS Code [
7]. Meanwhile, the DJPL oversees its implementation and compliance with its implementation in Indonesia. For the Standards of Training, Certification, and Watchkeeping for Seafarers (STCW), seafarers and related security personnel have received the IMO model course training as required.
A conducive climate is needed to create competitive ports so that all activities at the port can run smoothly without interruption. Port security is an important issue and it is the main requirement in determining the location of a business in multinational investment activities [
8]. Furthermore, a port is also required to provide security both from the water and shore sides because any security disturbance can significantly impact port performance and the economy [
9]. This paper aims to determine the impact of sea transportation security at ports, and the expectations of all parties with maritime security interests on Indonesia’s economic growth.
2. Research Methodology
A mixed method (quantitative and qualitative) is used in this study. The data consisted of two kinds: secondary data and primary data. For primary data, this paper uses transcripts of eight informants involved in a Focus Group Discussion (FGD). The quantitative analysis uses Input–-Output analysis techniques, while the qualitative method uses the NVivo tools analysis.
2.1. Input–Output Quantitative Analysis
The Input–Output (IO) analysis shows that the economy contains relationships and interdependencies in the industrial sector. The inputs of one industry are the outputs of other industries, and vice versa. Eventually, the interrelationships between them lead to an equilibrium between supply and demand in the economy. The initial purpose of developing this model is to determine the interdependence between industries. Today, the basic concepts created by Leontief are critical components of many types of economic analysis. The main objective of Leontief’s Input-Output model, which was developed in the 1930s, is to study the interdependence of various sectors in the economy [
10]. Several previous researchers have conducted studies using the I–O model with several variations. For example, Sener’s research (2013) combining the I–O model with time-series regression states that the integrated I–O model can also be extended to include other indexes modeled with a time-series approach, such as sector indexes. For example, one can analyze changes in the NASDAQ or the DOW stock market indexes on the economy [
11].
According to Firmansyah et al. (2018), the huge potency of fisheries and the fish manufacturing industry has been made significant by the Indonesian government by employing the Input-Output analysis approach [
12]. The article aimed to elaborate on and evaluate the role of the sea transportation sector to support other sectors with an up-to-date I–O RAS matrix.
The novelty of this research is the combination of sectoral Input–Output with the up-to-date Input–Output RAS matrix in the transportation sector, and the improvement of stakeholder expectation with the NVivo method.
As a quantitative model, the I–O table will provide a comprehensive picture of: (i) The structure of the national/regional economy, which includes the output structure and added value of each sector; (ii) The structure of intermediate inputs, namely the use of various goods and services by the production sectors; (iii) The structure of the supply of goods and services, both in the form of domestic production and goods originating from imports; and (iv) The structure of demand for goods and services, both intermediate demand by the production sectors and final demand for consumption, investment, and exports [
13].
Sectors within the production system are called endogenous variables, while variables outside the production system, namely those in the second, third, and fourth quadrants, are called exogenous variables. Thus, it can be clearly seen that the I–O model differentiates endogenous variables from exogenous variables. I–O is also used outside the production system in the form of final requests. The I–O result table consists of input coefficient variables called the input coefficient matrix, a variable or multiplier matrix, an attractiveness index variable, a driving force index, various supporting variables, and other analytical variables depending on the breadth of the field to be discussed. The I–O table format can be seen in
Table 1 below [
14].
Table 1 represents the distribution of output, both from domestic and abroad. At the same time, when viewed vertically, these figures are also the composition of inputs of a sector obtained from other sectors.
Table 1 also shows the arrangement of numbers in the form of a matrix between the sectors in an economy. There are interrelated relationships among several sectors. Sector 1, the output of which is Z1, is allocated in a row, namely Z11, Z12, and Z13, respectively, to sectors 1,2,3 as an intermediate demand of F1 to meet the final demand. In general, the I–O equation is formulated below (1).
where
i is 1, 2, 3, … ,
n;
Zij is the number of sectors
i outputs used as sector
j inputs;
Fj is the final demand for the transportation sector (
i);
Xj is the total output of sector
i. The general equation that expresses the relationship between the columns is denoted in Equation (2).
where
j is 1, 2, 3, … ,
n;
Zij is the number of sectors
i outputs used as sector
j inputs;
Vj is the final demand for the transportation sector (
j);
Xj is the total output of sector
i.
2.2. Input–Output Linkage Analysis
Linkage analysis can provide an overview of inter-sectoral linkages. Linkage consists of forwarding linkage and backward linkage directly or indirectly. The forward linkage itself provides information on the degree of linkage between sectors that produce outputs used as inputs from other sectors. In comparison, the backward linkage is used to see the linkage of a sector that supplies inputs to the sector under study [
13].
2.3. Impact Analysis of Input–Output Spread
The direct and indirect linkages forward and backward are not sufficient to be used as a basis for selecting key sectors. These indicators cannot be compared between sectors because the role of final demand for each sector is not the same. Therefore, it must be normalized by comparing the average impact of all sectors. This analysis is the impact of the spread that can determine whether a sector can grow its upstream or downstream sector.
2.4. Input–Output Multiplier Analysis
Multiplier analysis is one type of I–O analysis, and there are two types of multipliers, namely, Type I Multipliers and Type II Multipliers. The Type I Multiplier is obtained from further processing of the open Leontief inverse matrix, while the Type II Multiplier is obtained from the closed Leontief inverse matrix. The Type I Multiplier and the Type II Multiplier result from an impact mechanism process consisting of an initial effect, a first-round effect, an indirect impact (industrial support effect), and a consumption-induced effect. Based on the Leontief inverse matrix for both the open and closed model, the values of the output multiplier can be determined.
2.5. RAS Method Input–Output Matrix Update
The creation of an I–O table for this region cannot be achieved every year. Each region can only compile I–O tables with a very long interval period of up to 10 years. To overcome the problem of creating regional I–O matrices, we can use various approaches to update the data. The non-survey method for compiling or updating the regional I–O matrix can use the RAS method [
13].
2.6. Qualitative Analysis (NVivo)
The NVivo method is used as an analytical model because a standard systematic data analysis process is used in this study, namely coding analysis. The qualitative data management process in NVivo can assist researchers in better and more efficient data management. The most important thing to note in its use is the existence of coding and nodes. The coding process is filling the nodes with information related to the categories of concepts (codes) that have been formed in the node system. Before carrying out data processing and analysis, it is necessary to understand the flow of qualitative research analysis by Jozef Raco in Kalambo et al. (2019) [
15].
Interview data was captured by conducting interviews with eight informants who were grouped into three groups, namely those who act as regulators (policymakers), operators (service users), and observers of maritime transportation. The research data obtained from interviews were then processed using the Nvivo 12 Plus software tools. The NVivo 12 Plus software is used in coding from data from interviews with selected sources. The primary purpose of coding is to form main categories based on various data sources that researchers have collected.
3. Research Result and Discussion
3.1. Indonesian Input–Output Analysis
Based on Indonesia’s I–O 2019 table of 53 sectors, the highest contribution of each sector to final demand are: (i) Building sector at 22.55%; (ii) Food and Beverage Industry sector at 12.73%; (iii) Wholesale and Retail Trade sector and Non-Cars and Motorcycles with 8.16%; and (iv) The Sea Transportation and Port Security sector was 0.47%. The contribution of the above sectors to the 2019 National GDP were: (i) The building sector by 11.00%; (ii) The Wholesale and Retail Trade sector, and Non-Cars and Motorcycles by 10.72%; (iii) The Food and Beverage Industry sector by 6.56%; and (iv) The Sea Transportation and Port Security by 0.34%.
3.2. Sector Forward and Backward Linkage Analysis
The value of the direct forward linkage of the Sea Transportation and Port Security sector is 0.129. The indirect is 1.576, which means if there is an increase in final demand of one million rupiahs. The Sea Transportation and Port Security sector’s output is directly allocated to other sectors, including the construction sector itself, which will experience an increase of IDR 129,000. Meanwhile, the value of the forward linkage directly means that if there is an increase in final demand by one million rupiahs, the construction sector’s output is sold or allocated either directly or indirectly to other sectors, including the construction sector itself, which will increase by IDR 1,576,000.
The value of the direct backward linkage of the Sea Transportation and Port Security sector is 0.154 and the indirectly backward is 1.734. The value of this direct backward linkage can be interpreted as if there is an increase in final demand by one million rupiahs, the construction sector will directly increase demand for other sectors, including the construction sector itself, by IDR 154,000. As for the value of direct and indirect backward linkages, if there is an increase in the final demand of one million rupiahs, the construction sector will increase its input demand to other sectors, either directly or indirectly by IDR 1,576,000.
3.3. Multiplier Impact Analysis
Multiplier impact analysis of the Sea Transportation and Port Security sector output was 1.734, the labor multiplier value was 0.067, and the income value was 0.001. It can be interpreted that if there is an increase in the final demand for the sea transportation sector by one million rupiahs, then the average output in other sectors will increase by IDR 1,734,000.00; labor increase by one person, and income increases by IDR 10,000.
3.4. Maritime Security Policy Linkages with Other Sectors
The relationship between Maritime Security Policies mostly relates to the Port Security sector with other sectors based on the analysis results. The Maritime Security Policy outputs through the Port Security sector, the building sector, the shipping industry sector, and the metal, computer, electronic, optical, and electrical goods industrial sector, which are directly sold or allocated to other sectors, including the sector itself worth IDR 1.28 trillion. The Maritime Security Policy outputs through the Port Security sector, the building sector, the shipping industry sector, and the metal, computer, electronic, optical, and electrical goods industrial sector, which are not directly sold or allocated to other sectors, including the sector itself, amounting to IDR 3.33 trillion.
The requests for Maritime Security Policy input through the Port Security sector, the building sector, the shipping industry sector, and the metal, computer, electronic, optical, and electrical goods industry sector, which are directly sold or allocated to other sectors, including the sector itself to the amount of IDR 12.38 trillion. The requests for Maritime Security Policy input through the Port Security sector, the building sector, the shipping industry sector, and the metal, computer, electronic, optical, and electrical goods industry sector, which are indirectly sold or allocated to other sectors, including the sector itself in the amount of IDR 142.02 trillion.
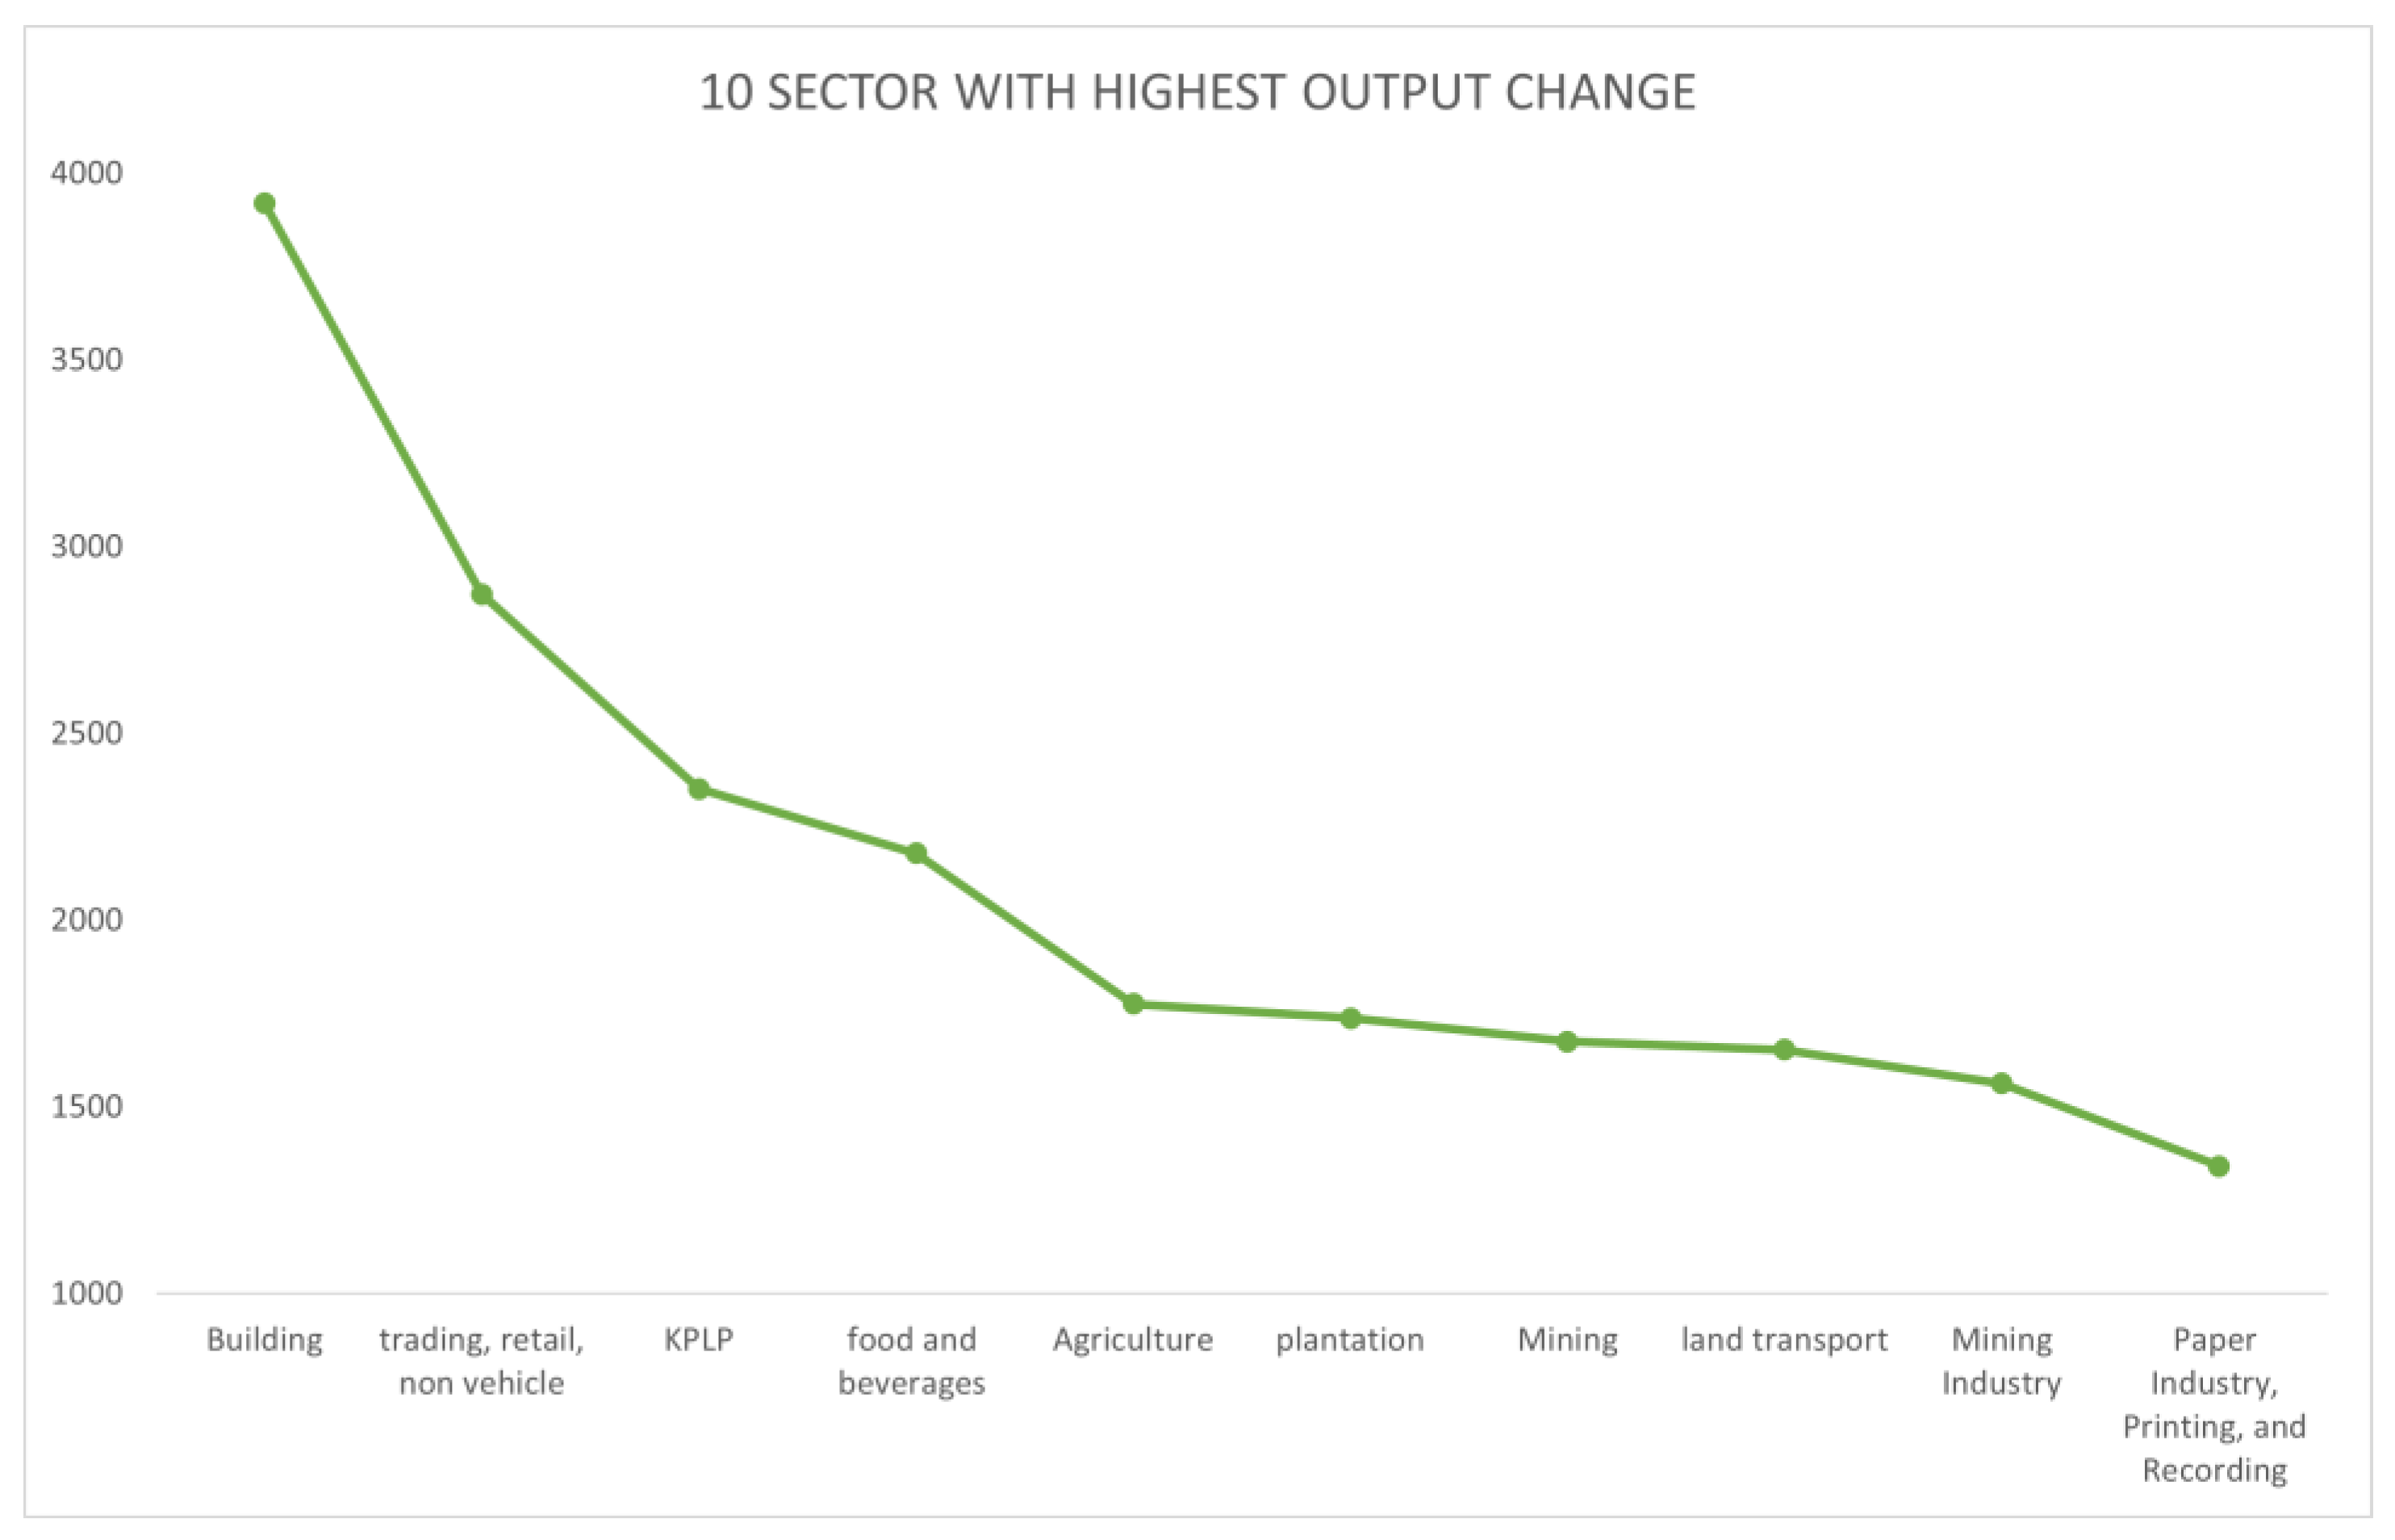
The Maritime Security Policy in 2019, through the Port Security Sector, impacted other sectors. The most significant change is the output in the building sector of IDR 3.92 trillion, the Wholesale and Retail Trade sector, Non-Cars and Motorcycles of IDR 2.87 trillion, and the Port Security sector itself amounted to IDR 2.35 trillion as seen in
Figure 1.
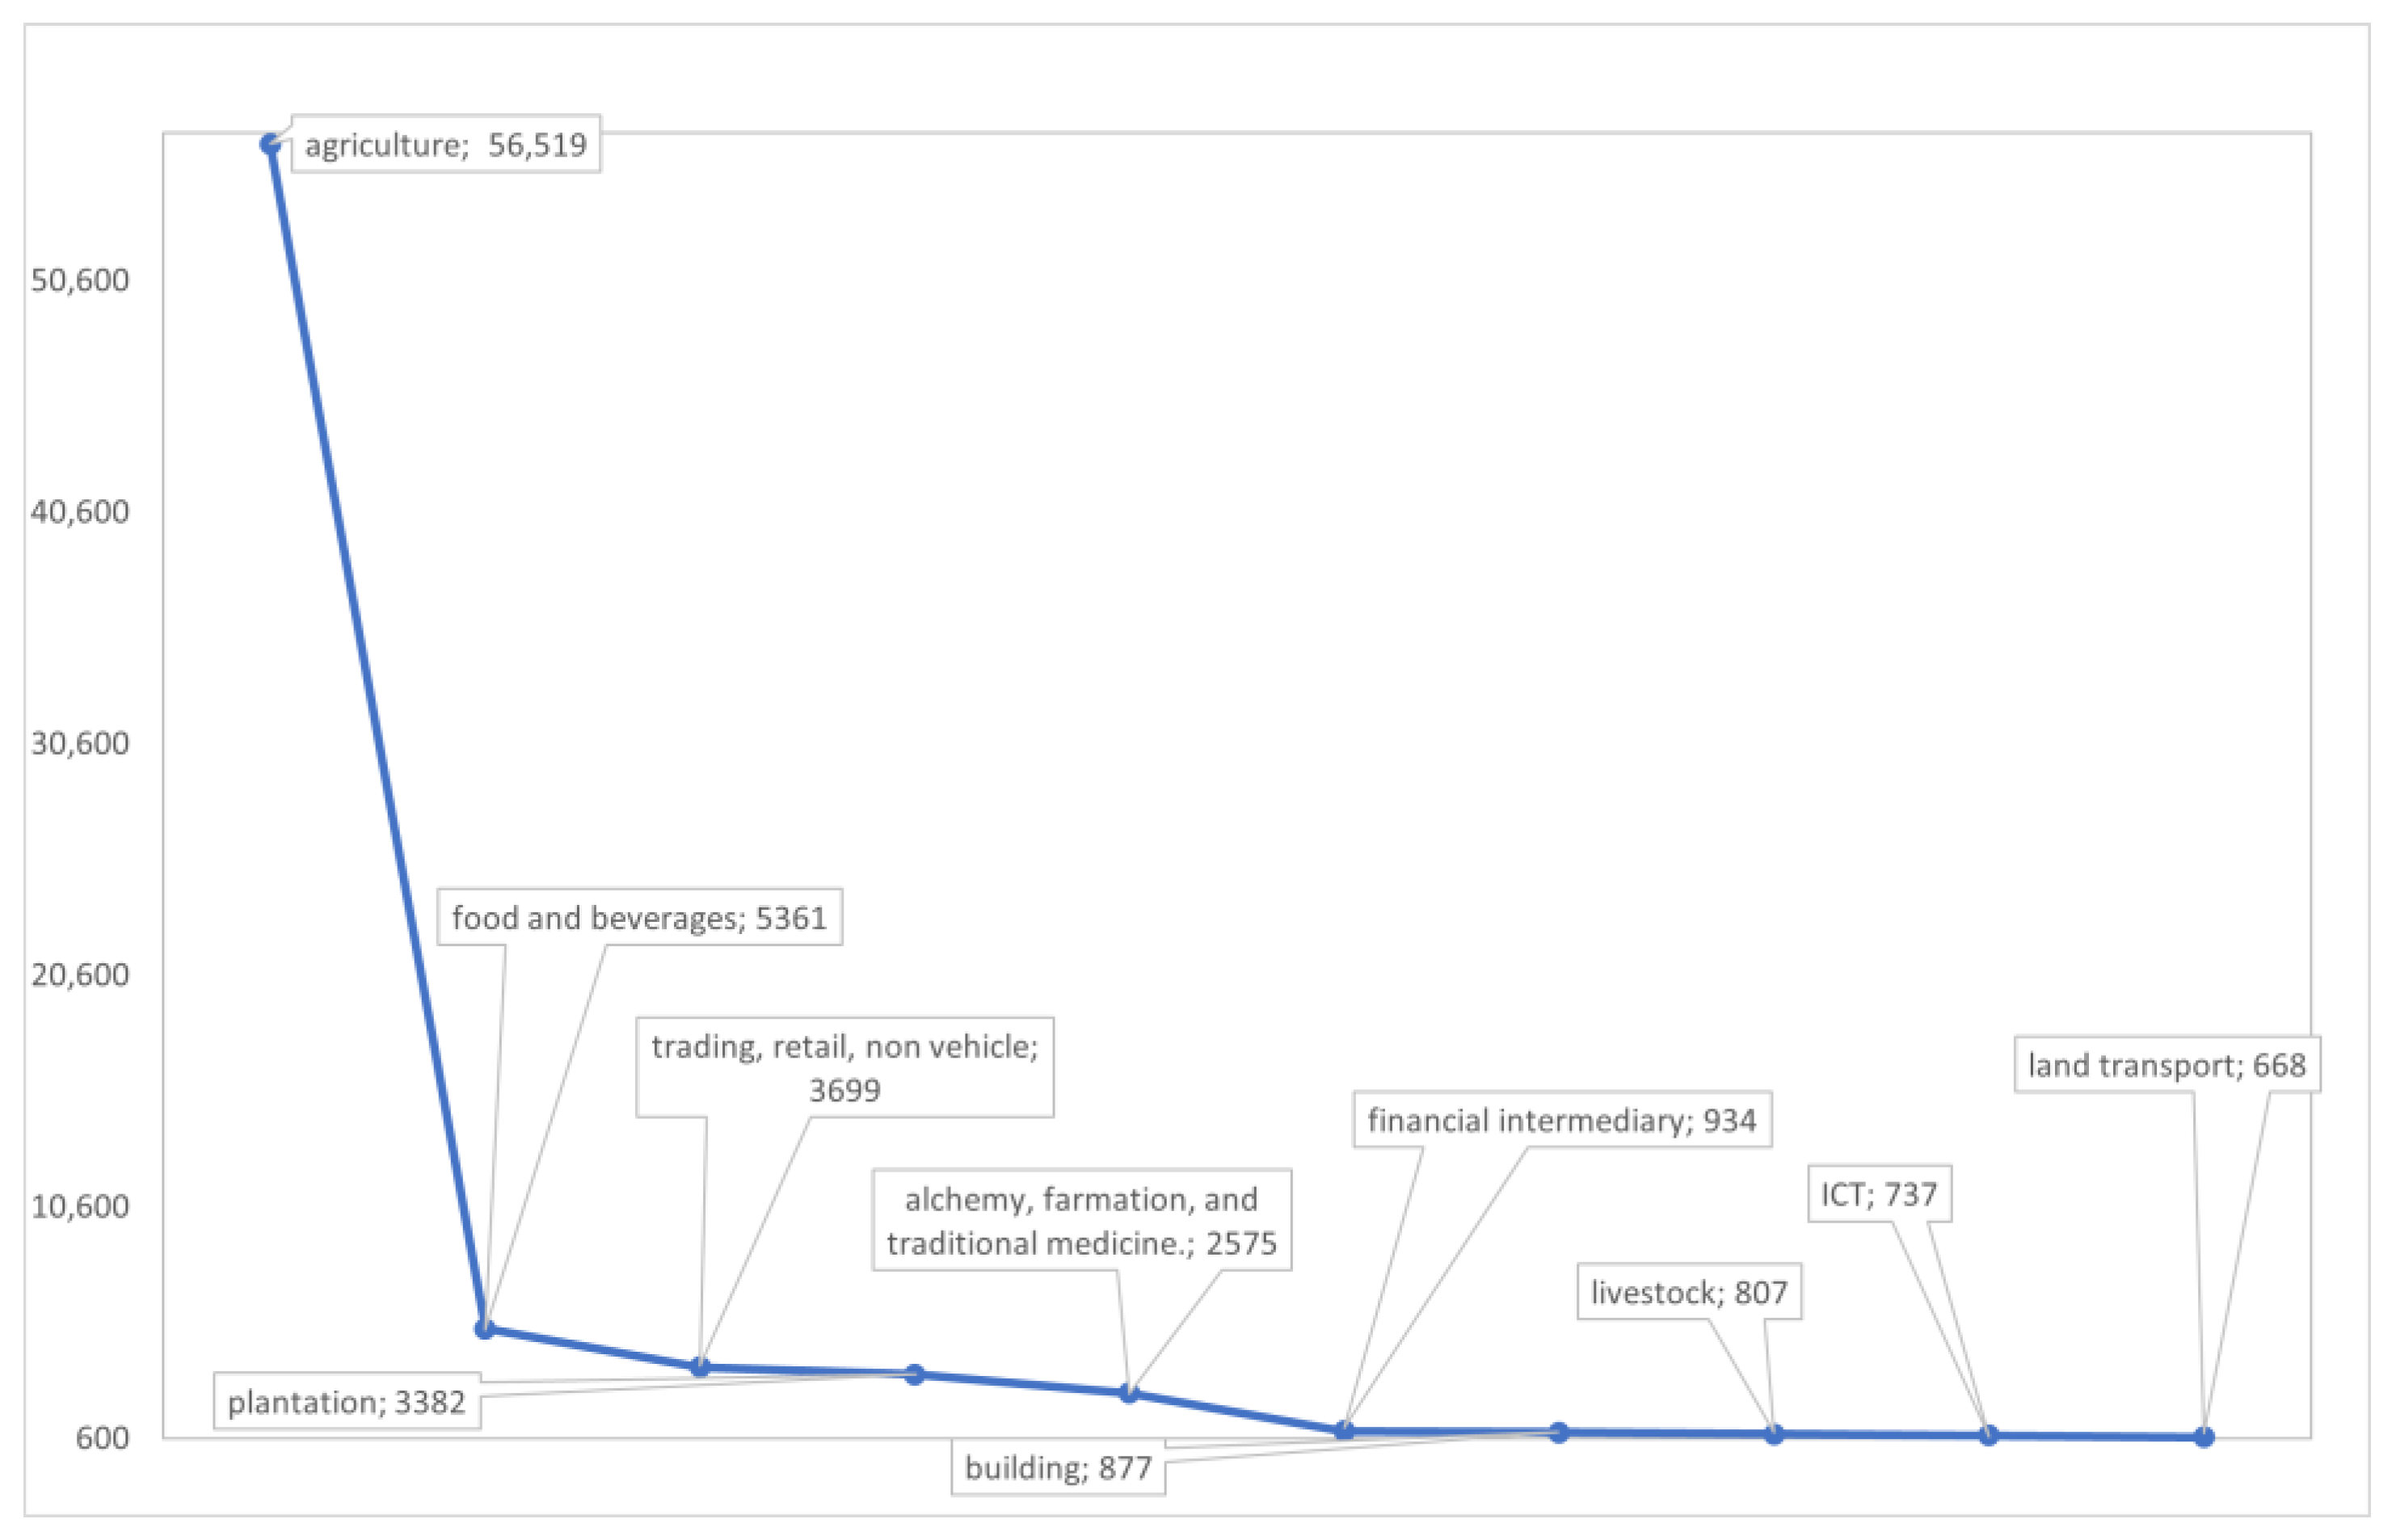
The most extensive labor absorption is in the food crop agriculture sector with as many as 56,519 people, the Food and Beverage Industry sector with 5361 people, the Plantation sector with 3382 people, and the Chemical, Pharmaceutical, and Drug Industry with 2575 people as seen in
Figure 2. Meanwhile, in labor income, the food crop agriculture sector was IDR 614.93 billion, the Food and Beverage industry sector was IDR 58.32 billion, and the Wholesale and Retail Trade sector was IDR 40.24 billion.
3.5. Impact of Maritime Security Policy Implementation on Economic Growth
In 2019, the Ministry of Transportation allocated a budget of IDR 5.75 trillion to implement maritime security policies, especially the implementation of the ISPS Code in Indonesia. This simulation is to determine the economic impact of maritime security policies, especially the implementation of the ISPS Code worth IDR 5.75 trillion in 2019. The results obtained are a change in output of IDR 39.52 trillion, an increase in GDP of IDR 21.99 billion, and an increase in worker income of IDR 860 billion. The number of workers absorbed is 79,084.
3.6. NVivo Qualitative Analysis
The results of the FGD underlined several items as being part of the Maritime Security Policy Implementation, namely: Stakeholder Synergy, Shipping Safety and Security, Maritime Environment Protection, Connectivity, Dangerous Goods and Solid Bulk Handling, Role of Surveyors, Verification and Technical Investigation, HR Competence, Information and Communication Technology, Maritime Concepts, Data Integration, Dangerous Goods and Solid Bulk, ISPS Code, Data Compliance, Maritime Sector Potential, Implementation Commitments, Information Technology and Port Infrastructure.
After grouping, several references are obtained in the aggregate (20 nodes) as seen in
Table 2, which have the most significant contribution to the overall hierarchy. It is indicated, as a whole (3 categories of informants); both implicitly and explicitly, alluding to the issue of stakeholder synergy. In this case, the stakeholder synergy nodes contain statements of informants from all categories that discuss the need for stakeholder involvement in marine resource management, HR competence, shipping administration, sailing safety and security, logistics business performance, etc.
After discussions between experts, six categories of nodes were deemed to be in poor condition and required more attention, namely: the protection of the maritime environment, connectivity, handling of dangerous goods and solid bulk, the role of surveyors, understanding of maritime concepts, and implementation commitments.
4. Conclusions
The linkage of Maritime Security Policy implementation with other sectors in the Indonesian Economy, namely, the Output of Maritime Security Policy implementation through sectors: KPLP, building sector, shipping industry sector, industrial sector of metal goods, computers, electronics, optical and electrical equipment directly sold or allocated to other sectors including the sector itself is 0.007% of the total national final demand. Meanwhile, what was not directly sold or allocated to other sectors, including the sector itself, was 0.019% of the total national final demand. The requests for input for the implementation of the Maritime Security Policy through the following sectors: KPLP, the building sector, the shipping industry sector, the metal goods industry, computers, electronic goods, optics, and electrical equipment which are directly sold or allocated to other sectors including the sector itself are of 0.042% of the total national input. Meanwhile, indirectly sold or allocated to other sectors, including the sector itself, amounted to 0.48% of the total national input.
The implementation of the Maritime Security Policy in 2019 through the KPLP sector was IDR 5.75 trillion. It impacts other sectors, where the largest is in the building sector, which is 0.013% of the total national output, then the Wholesale and Retail Trade sector, the Non-car and Motorcycle sector by 0.01%, and the KPLP sector itself by 0.008%. The most significant employment absorption of the national workforce is in the Food Crop Agriculture sector, which is 0.043%; Next are the Food and Beverage Industry sector (0.004%), the Wholesale and Retail Trade, the Non-car and Motorcycle sectors (0.003%), and the Plantation sector (0.003%).
Meanwhile, in labor income, the largest sector was the Food Crop Agriculture sector (0.001%), followed by the Food and Beverage Industry sector (0.006%), and Wholesale and Retail Trade sector (0.006%). The impact of implementing the Maritime Security Policy in 2019 on the increase in GDP is 0.14% of the National GDP. This increase absorbs the workforce by 0.06% of the total national workforce, and increases workers’ income in all sectors by 0.014% of the national workforce income.
The stakeholder expectations for the implementation of Maritime Security policies on a priority scale were: (i) 13% of stakeholders expect Synergy between Stakeholders; (ii) 12% expect the realization of Shipping Safety and Security; (iii) 9% expect the realization of Maritime Environment Protection; (iv) 7% expect the creation of Connectivity, and (v) 6% expect the implementation of the Handling of Dangerous Goods and Solid Bulk.


