Proceeding Paper

Monolein Aqueous Dispersions as a Tool to Increase Flavonoid Solubility: A Preliminary Study †

by
Maddalena Sguizzato
1,
Elisabetta Esposito
1,
Markus Drechsler
2,
Supandeep Singh Hallan
1 and
Rita Cortesi
1,*
1
Chemical, Pharmaceutical and Agricultural Science Department, Ferrara University, 44121 Ferrara, Italy
2
BIMF/Soft Matter Electronmicroscopy, University of Bayreuth, 95447 Bayreuth, Germany
*
Author to whom correspondence should be addressed.
Presented at the 1st International Electronic Conference on Pharmaceutics, 1–15 December 2020; Available online: https://iecp2020.sciforum.net/.
Proceedings 2021, 78(1), 25; https://doi.org/10.3390/IECP2020-08664
Published: 1 December 2020
(This article belongs to the Proceedings of The 1st International Electronic Conference on Pharmaceutics)

Abstract

:
Topical application of flavonoids has recently received increased attention, however their use is limited due to a low aqueous solubility and related low in vivo absorption. Monolein emulsified in water leads to aqueous nanostructured dispersions of complex lyotropic liquid crystalline phases able to carry lipophilic molecules. These monoolein aqueous dispersions (MADs) were investigated on two model flavonoids, namely quercetin and rutin. MADs were produced by emulsifying monoolein in water in the presence of sodium cholate. MAD size, morphology and drug content were characterized using PCS, SdFFF, cryo-TEM and UV spectroscopy. In vitro studies on drug release and antioxidant activity were also conducted. MAD size was found around 300 nm. Cryo-TEM showed that sodium cholate content influences the morphological aspect of MAD. Concerning drug content, MAD increased at least 80-fold quercetin solubility, while the same was not found for rutin. Experiments on antioxidant activity demonstrated the two-fold power of quercetin as compared to rutin while in vitro Franz cell experiments showed that MAD are suitable for cutaneous application. In conclusion MAD can be potentially proposed for the delivery of the antioxidant molecule quercetin, whilst many studies have to be performed for finding a way to deliver rutin.

1. Introduction

Topical application of flavonoids has recently received increased attention, however their use is limited due to their low aqueous solubility and related low in vivo absorption. Unsaturated long-chain monoglycerides emulsified in water, such as monoolein, lead to aqueous nanostructured dispersions of complex lyotropic liquid crystalline phases (lamellar, hexagonal, and cubic structure) able to carry lipophilic molecules [1,2]. To potentially solve solubility problems of these molecules, and possibly to facilitate a topical application, the use of monoolein aqueous dispersions (MAD) was investigated on two model flavonoids, namely quercetin (QT) and rutin (RU), a quercetin glycoside [3].

2. Experiments

2.1. Materials

Glyceryl monooleate RYLO MG 19 (monoolein) was from Danisco Cultor (Grindsted, Denmark). Sodium cholate (Na cholate, 3α,7α,12α-trihydroxy-5β-cholan-24-oic acid sodium salt), quercetin (QT) and rutin (RU) were purchased from Sigma Chemical Company (St Louis, MO, USA). HPLC grade solvents and all other chemicals were from Sigma-Aldrich (Milano, Italy).

2.2. MAD Preparation and Characterization

MAD were produced by emulsifying monoolein in water in the presence of sodium cholate used either at 0.15% and 0.25% by weight with respect to the total weight of the formulation [1,4]. Briefly, after dispersing monooleine and sodium cholate in water the dispersion was homogenized (15,000 rev min1, Ultra Turrax, Janke & Kunkel, Ika-Werk, Sardo, Italy) at 60 °C for 1 min, then cooled and maintained at room temperature in glass vials. In addition concentrations of flavonoids corresponding to 0.025% w/w with respect to the dispersion were tested by dissolving them to the molten monoolein/emulsifier mixture [5].
Submicron particle size analysis was performed using a Zetasizer Nano Series, Nano SP90 (Malvern Instruments, Malvern, UK) equipped with a 5 mW helium neon laser with a wavelength output of 633 nm. Glassware was cleaned of dust by washing with detergent and rinsing twice with water for injections. Measurements were made at 25 °C at an angle of 90°. Data were interpreted using the CONTIN method [6].
A sedimentation field flow fractionation (SdFFF) analysis system (Model S101, FFFractionation, Inc., Salt Lake City, UT, USA) was employed to determine the size distribution of particles by converting the fractograms [7]. Fifty microliter samples were injected through a 50 μL Rheodyne loop valve. As mobile phase demineralized water pumped at 2.0 mL/min was used. Fractions of 3 mL each were automatically collected by a Model 2110 fraction collector (Bio Rad Laboratories, Segrate, Italy).
Samples vitrified as previously described [8] were transferred to a Zeiss EM922 Omega transmission electron microscope for imaging using a cryoholder (CT3500, Gatan, Munich, Germany). Throughout the examination, the sample temperature was kept below −175 °C. Specimens were examined with doses of about 1000–2000 e/nm2 at 200 kV. Images recorded by a CCD digital camera (Ultrascan 1000, Gatan), were analysed using a GMS 1.8 software (Gatan).

2.3. Drug Content in MAD

The encapsulation efficiency (EE) of QT and RU in MAD was determined as previously described [4]. 100-μL of each MAD batch was loaded in a centrifugal filter (Microcon centrifugal filter unit YM-10 membrane, NMWCO 10 kDa, Sigma Aldrich, St Louis, MO, USA) and centrifuged (SpectrafugeTM 24D Digital Microcentrifuge, Labnet, Woodbridge, NJ, USA) at 8000 rpm for 20 min. The amount of drug in the lipid phase was determined by UV analyses as below reported. The encapsulation parameter was determined as follows
EE = LD/TD × 100
where LD is the amount of drug encapsulated in MAD and TD is the total weight of QT or RU for the MAD preparation. QT and RU determination was performed using a double-ray UV/Vis spectrometer (Lambda 19UV/VIS/NIR Spectrometer, Perkin Elmer, Waltham, MA, USA) operating at 375 nm for both QT and RU in 1 mL quartz cuvettes. To calculate the drug concentration within each sample a calibration curve was previously achieved and used as reference.

2.4. In Vitro Studies: Drug Release and Antioxidant Activity

In vitro release was studied using a Franz type cells associated to nylon membrane (0.45 μm pore size, Millipore-Sigma, Darmstadt, Germany) [5]. One mL of each formulation was placed on the membrane surface then the donor compartment was sealed to avoid evaporation. The 5 mL of receptor phase was a mixture of phosphate buffer 60 mM pH 7.4 and methanol (70:30, v/v) magnetically stirred at 500 rpm by mean of a bar and thermostated at 32 ± 1 °C. 150 μL of receptor phase were withdrawn at predetermined times comprised between 1 and 24 h and drug content was measured by UV. Measures were conducted thrice and the mean values ± standard deviations were plotted as a function of time.
The ability of the QT and RU to scavenge DPPH free radicals was assessed by the standard method [9,10]. DPPH test allows measure of the reducing activity of antioxidant molecules against the DPPH radical by a colorimetric reaction. Indeed DPPH (red-purple coloured) decolorizes in the presence of an antioxidant agent. This assay is able to detect compounds acting for transfer of hydrogen or electrons (radical quenching) and such ability is evaluated by measuring the decrease of absorbance at 517 nm of the solution after the radical reaction with the products to be tested. The percentage of radical scavenging capacity was calculated using Equation (2):
DPPH radical−scavenging capacity (%) = [1−(A1−A2)/A0] × 100
where A0 is the absorbance of the control (without QT or RU), A1 is the absorbance in the presence of the QT or RU, and A2 is the absorbance without DPPH. To a methanol solution of DPPH (1.5 mL) 0.750 mL of QT or RU solution at different concentration were added. The absorbance at 517 nm was measured by a UV-VIS spectrophotometer (DU®530, Life Science UV/VIS spectrophotometer, Single Cell Module, Beckman CoulterTM, Brea, CA, USA) according to a described procedure [11]. Results were expressed as μmol Trolox equivalent/g of compounds.
An oxygen radical absorbance capacity (ORAC) assay was used to determine qualitatively the antioxidant activity of QT and RU containing MAD [12]. Loaded MAD (25 μL) were placed in 96-well tissue culture plates. 150 μL of fluorescein (FL) (10 nM) was used as the probe to assess the antioxidant activity. 25 μL of water-soluble azo-compound AAPH (100 mM) was used as a radical initiator to generate free radicals at a constant rate. A positive control (FL solution containing AAPH), a negative control (FL solution containing no AAPH), QT and RU solution at the concentration used in MAD, MAD015_QT/RU and MAD025_QT/RU were run simultaneously in phosphate-buffered saline (PBS). A timer was started upon introduction of the free radical generator and the plate was stored in the dark at 37 °C. At each specified time point the fluorescence of the solution was measured (excitation 485 nm, emission 528 nm) using a Wallac 1420 Victor 3 96-well plate reader fluorimeter (Perkin Elmer) and plotted as a function of time with Origin®7 software (Origin Lab Corporation, Northampton, MA, USA).

3. Results and Discussion

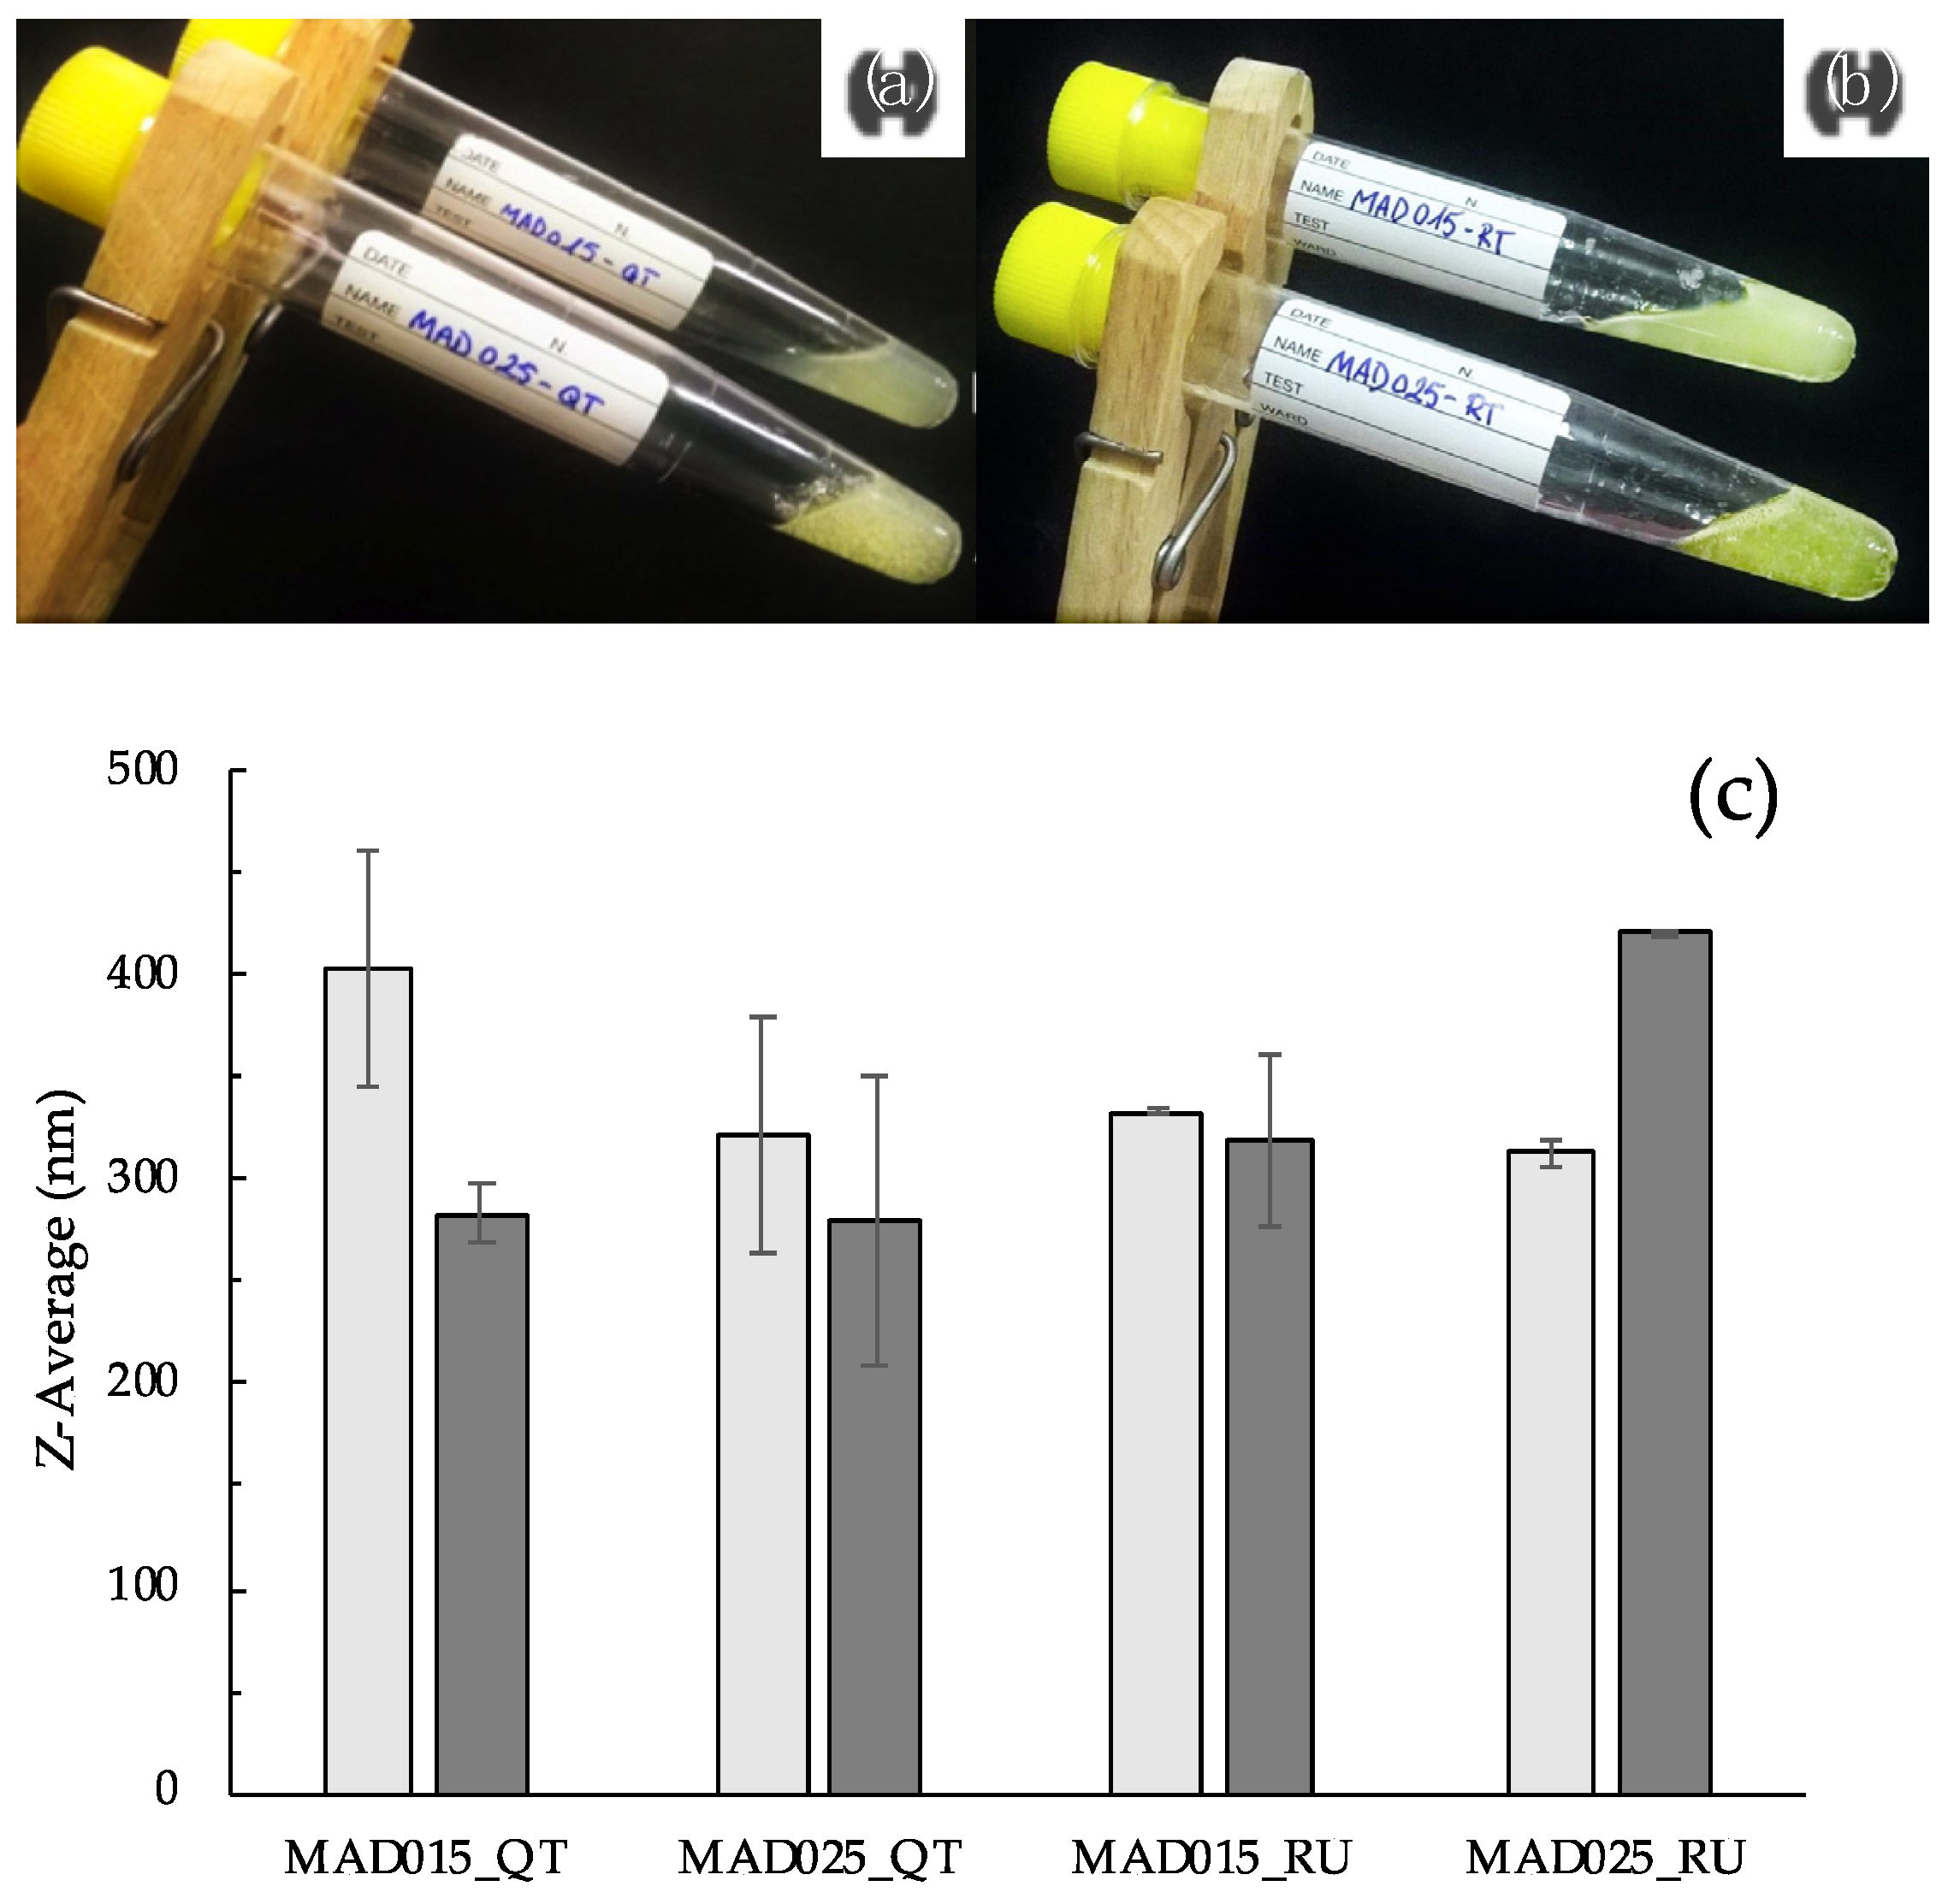
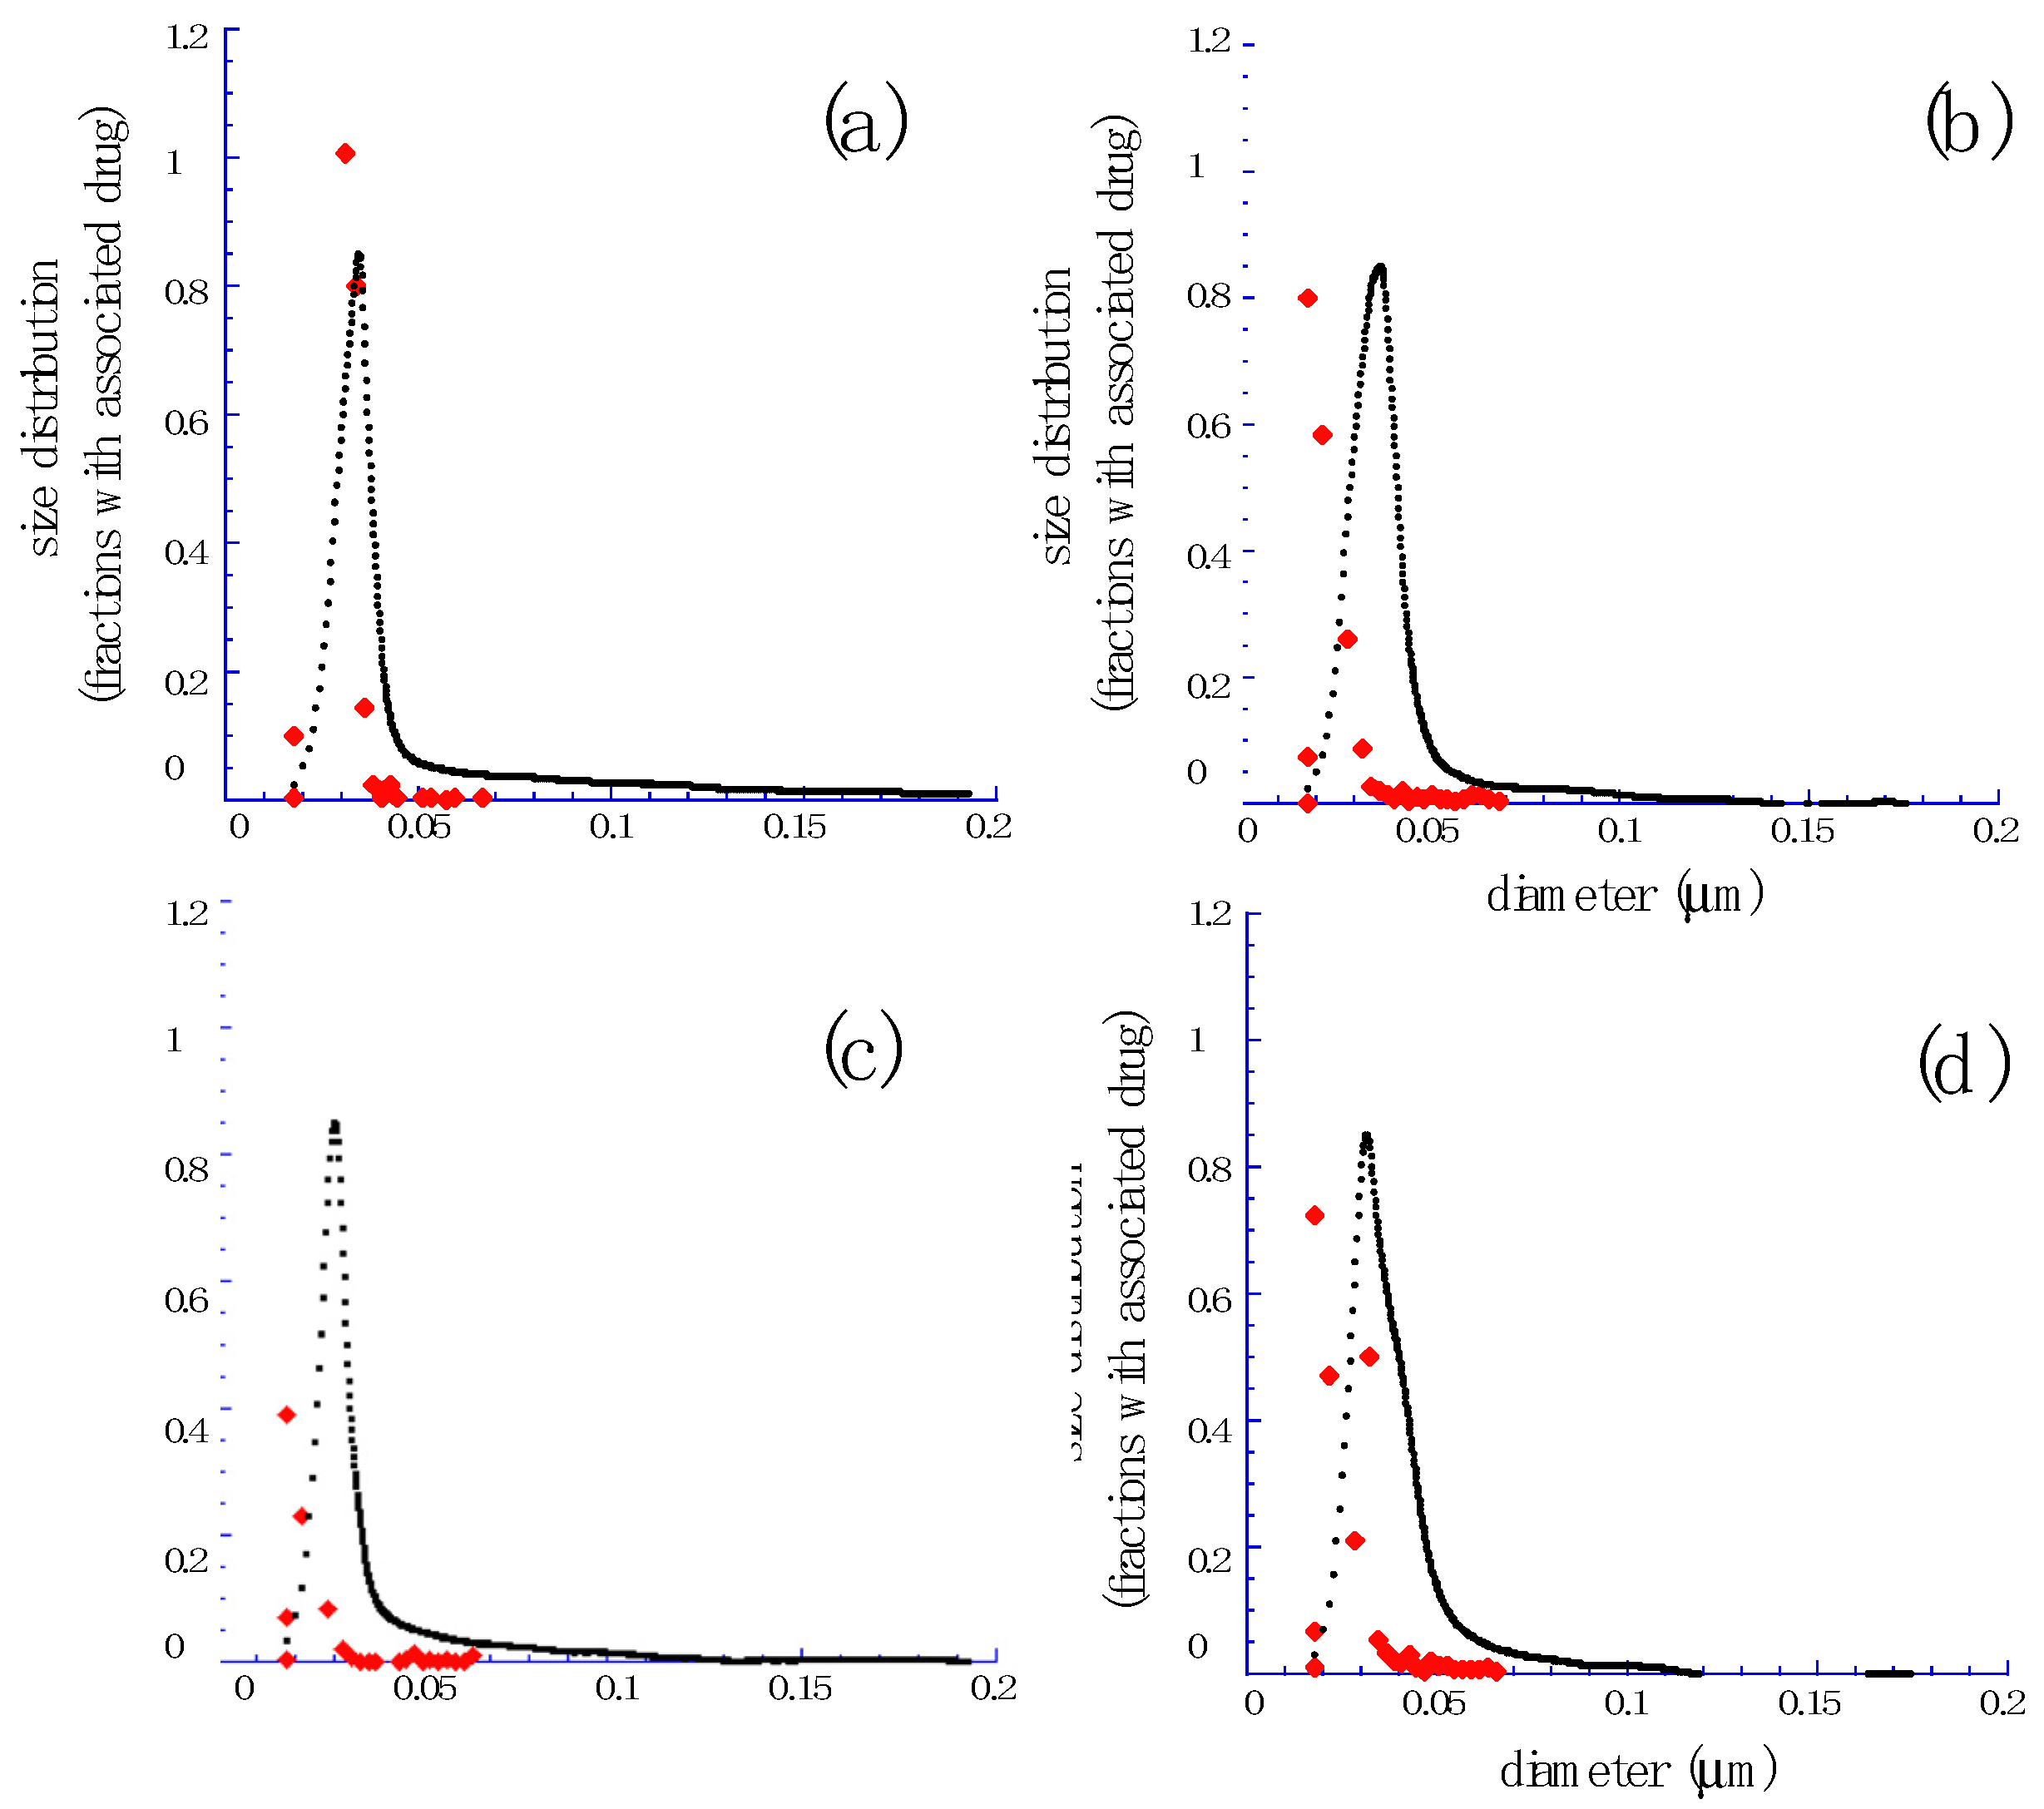
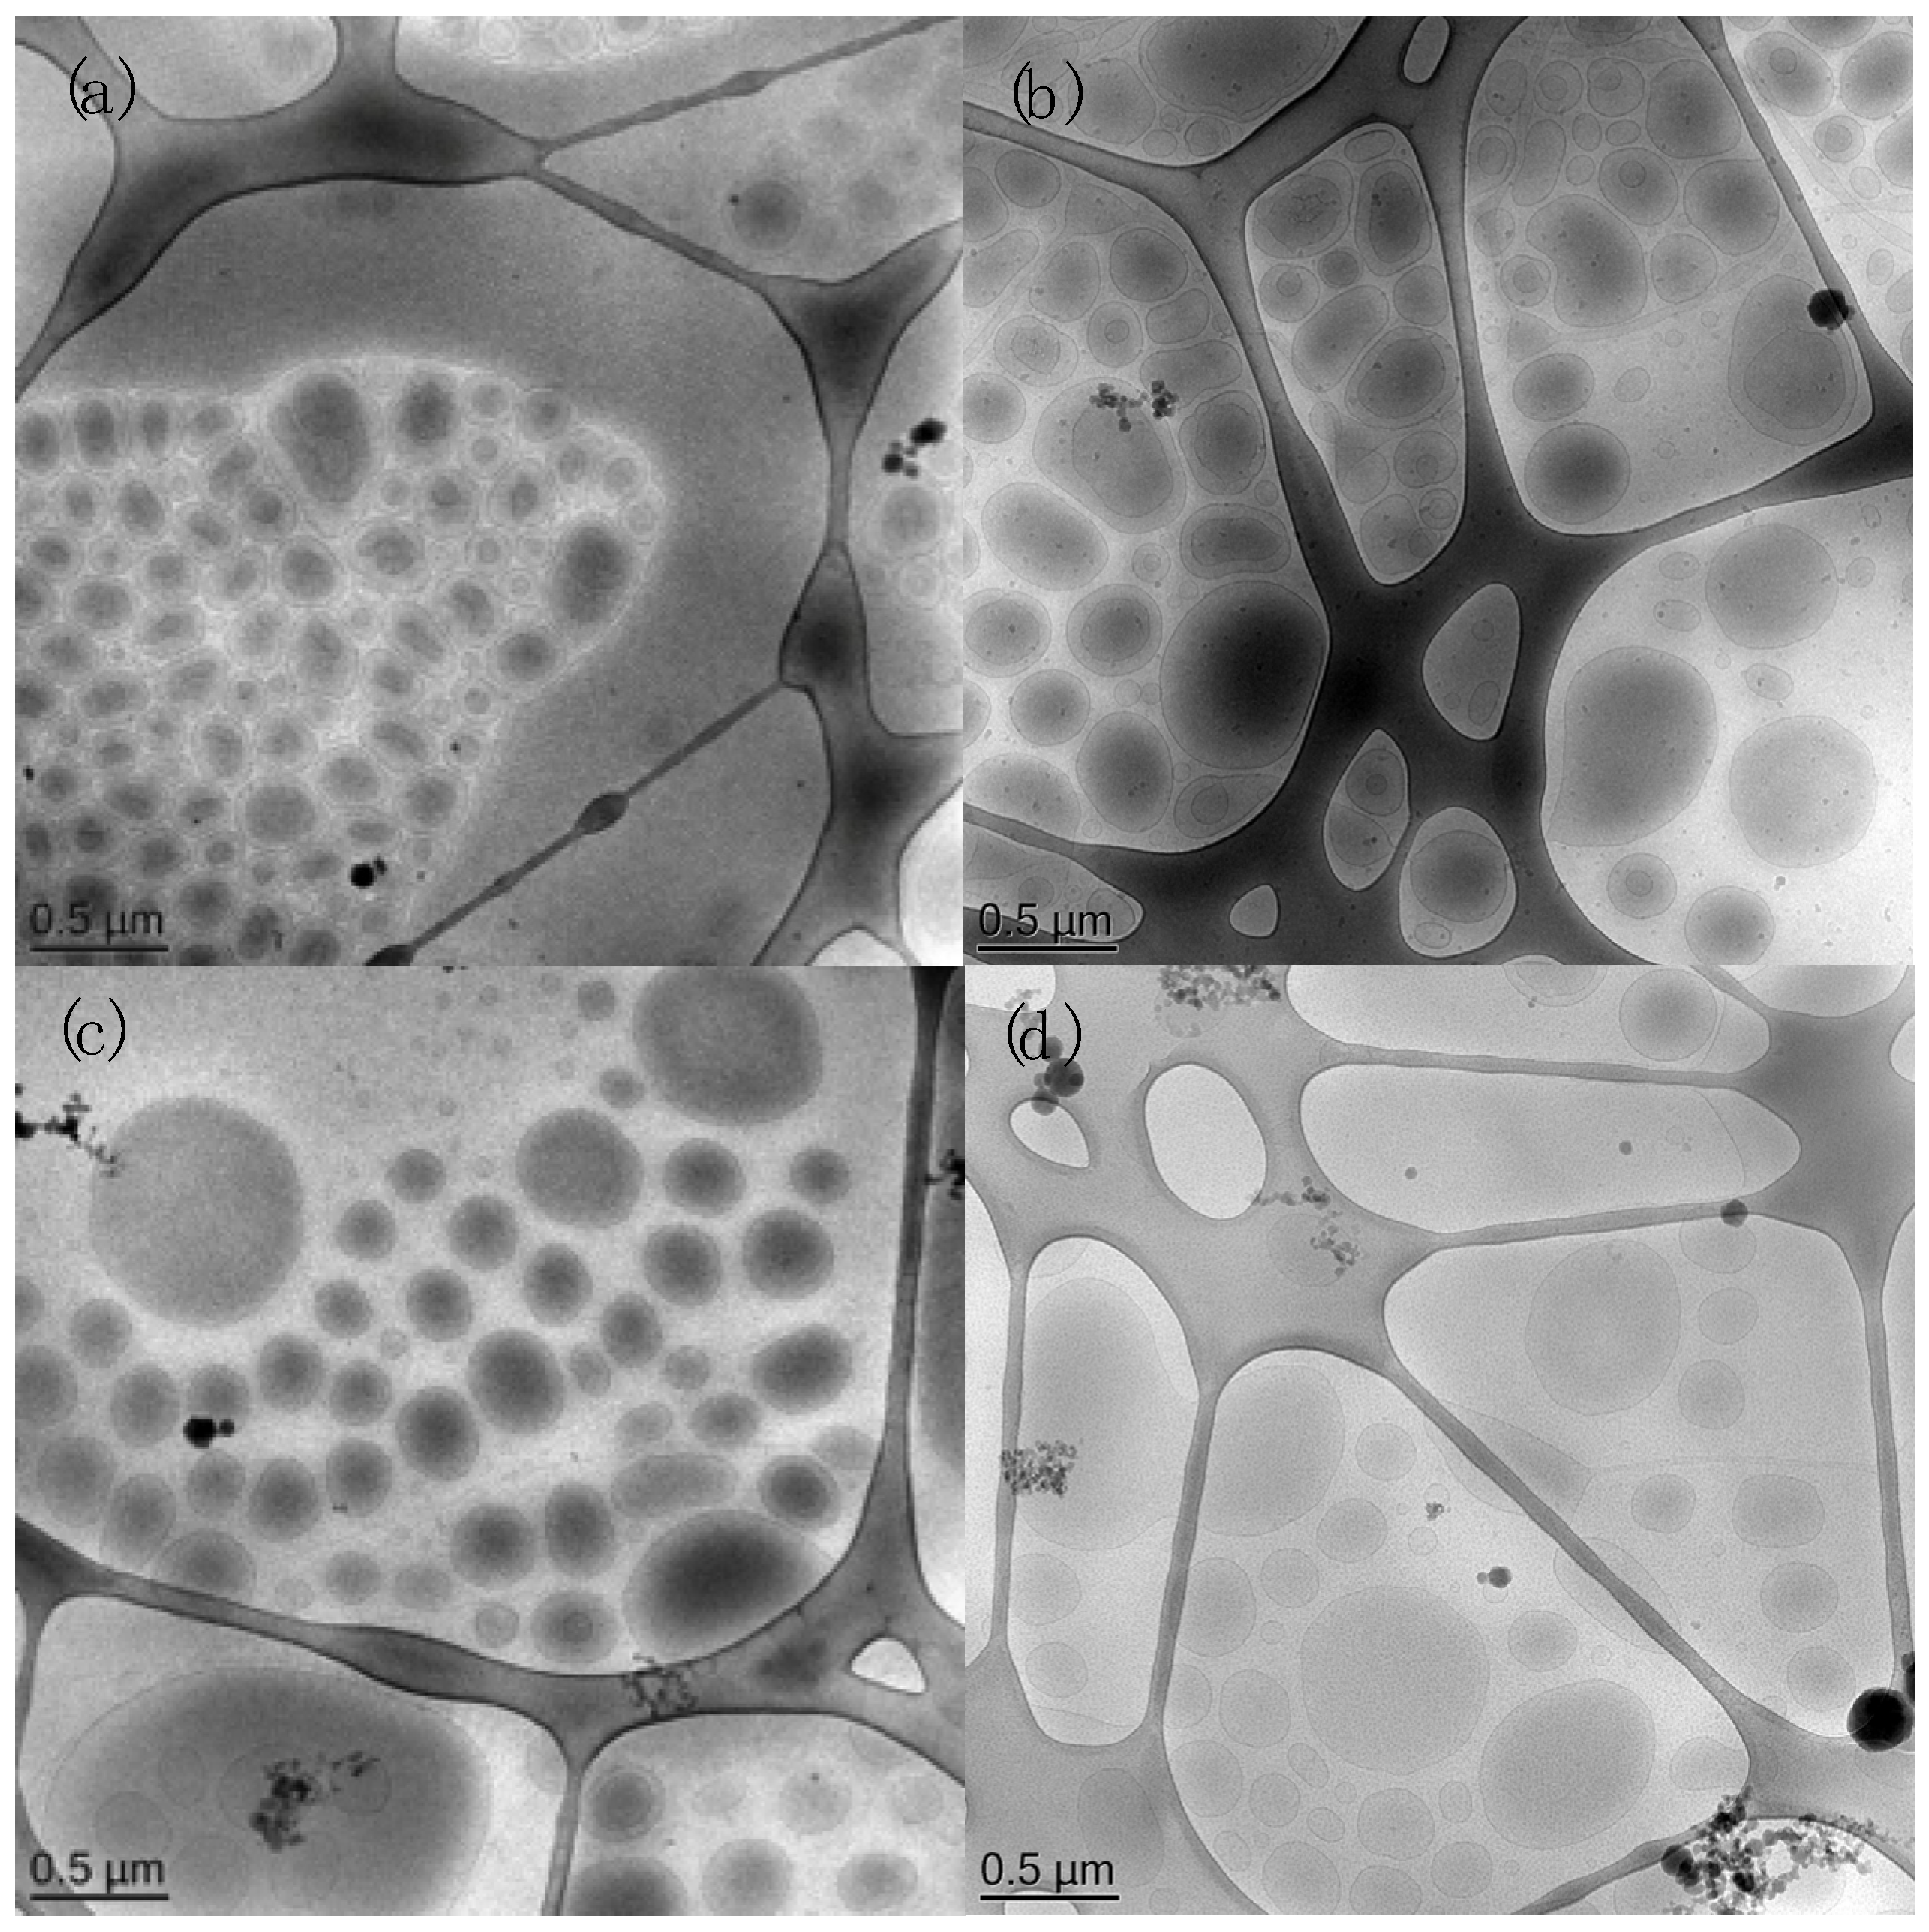
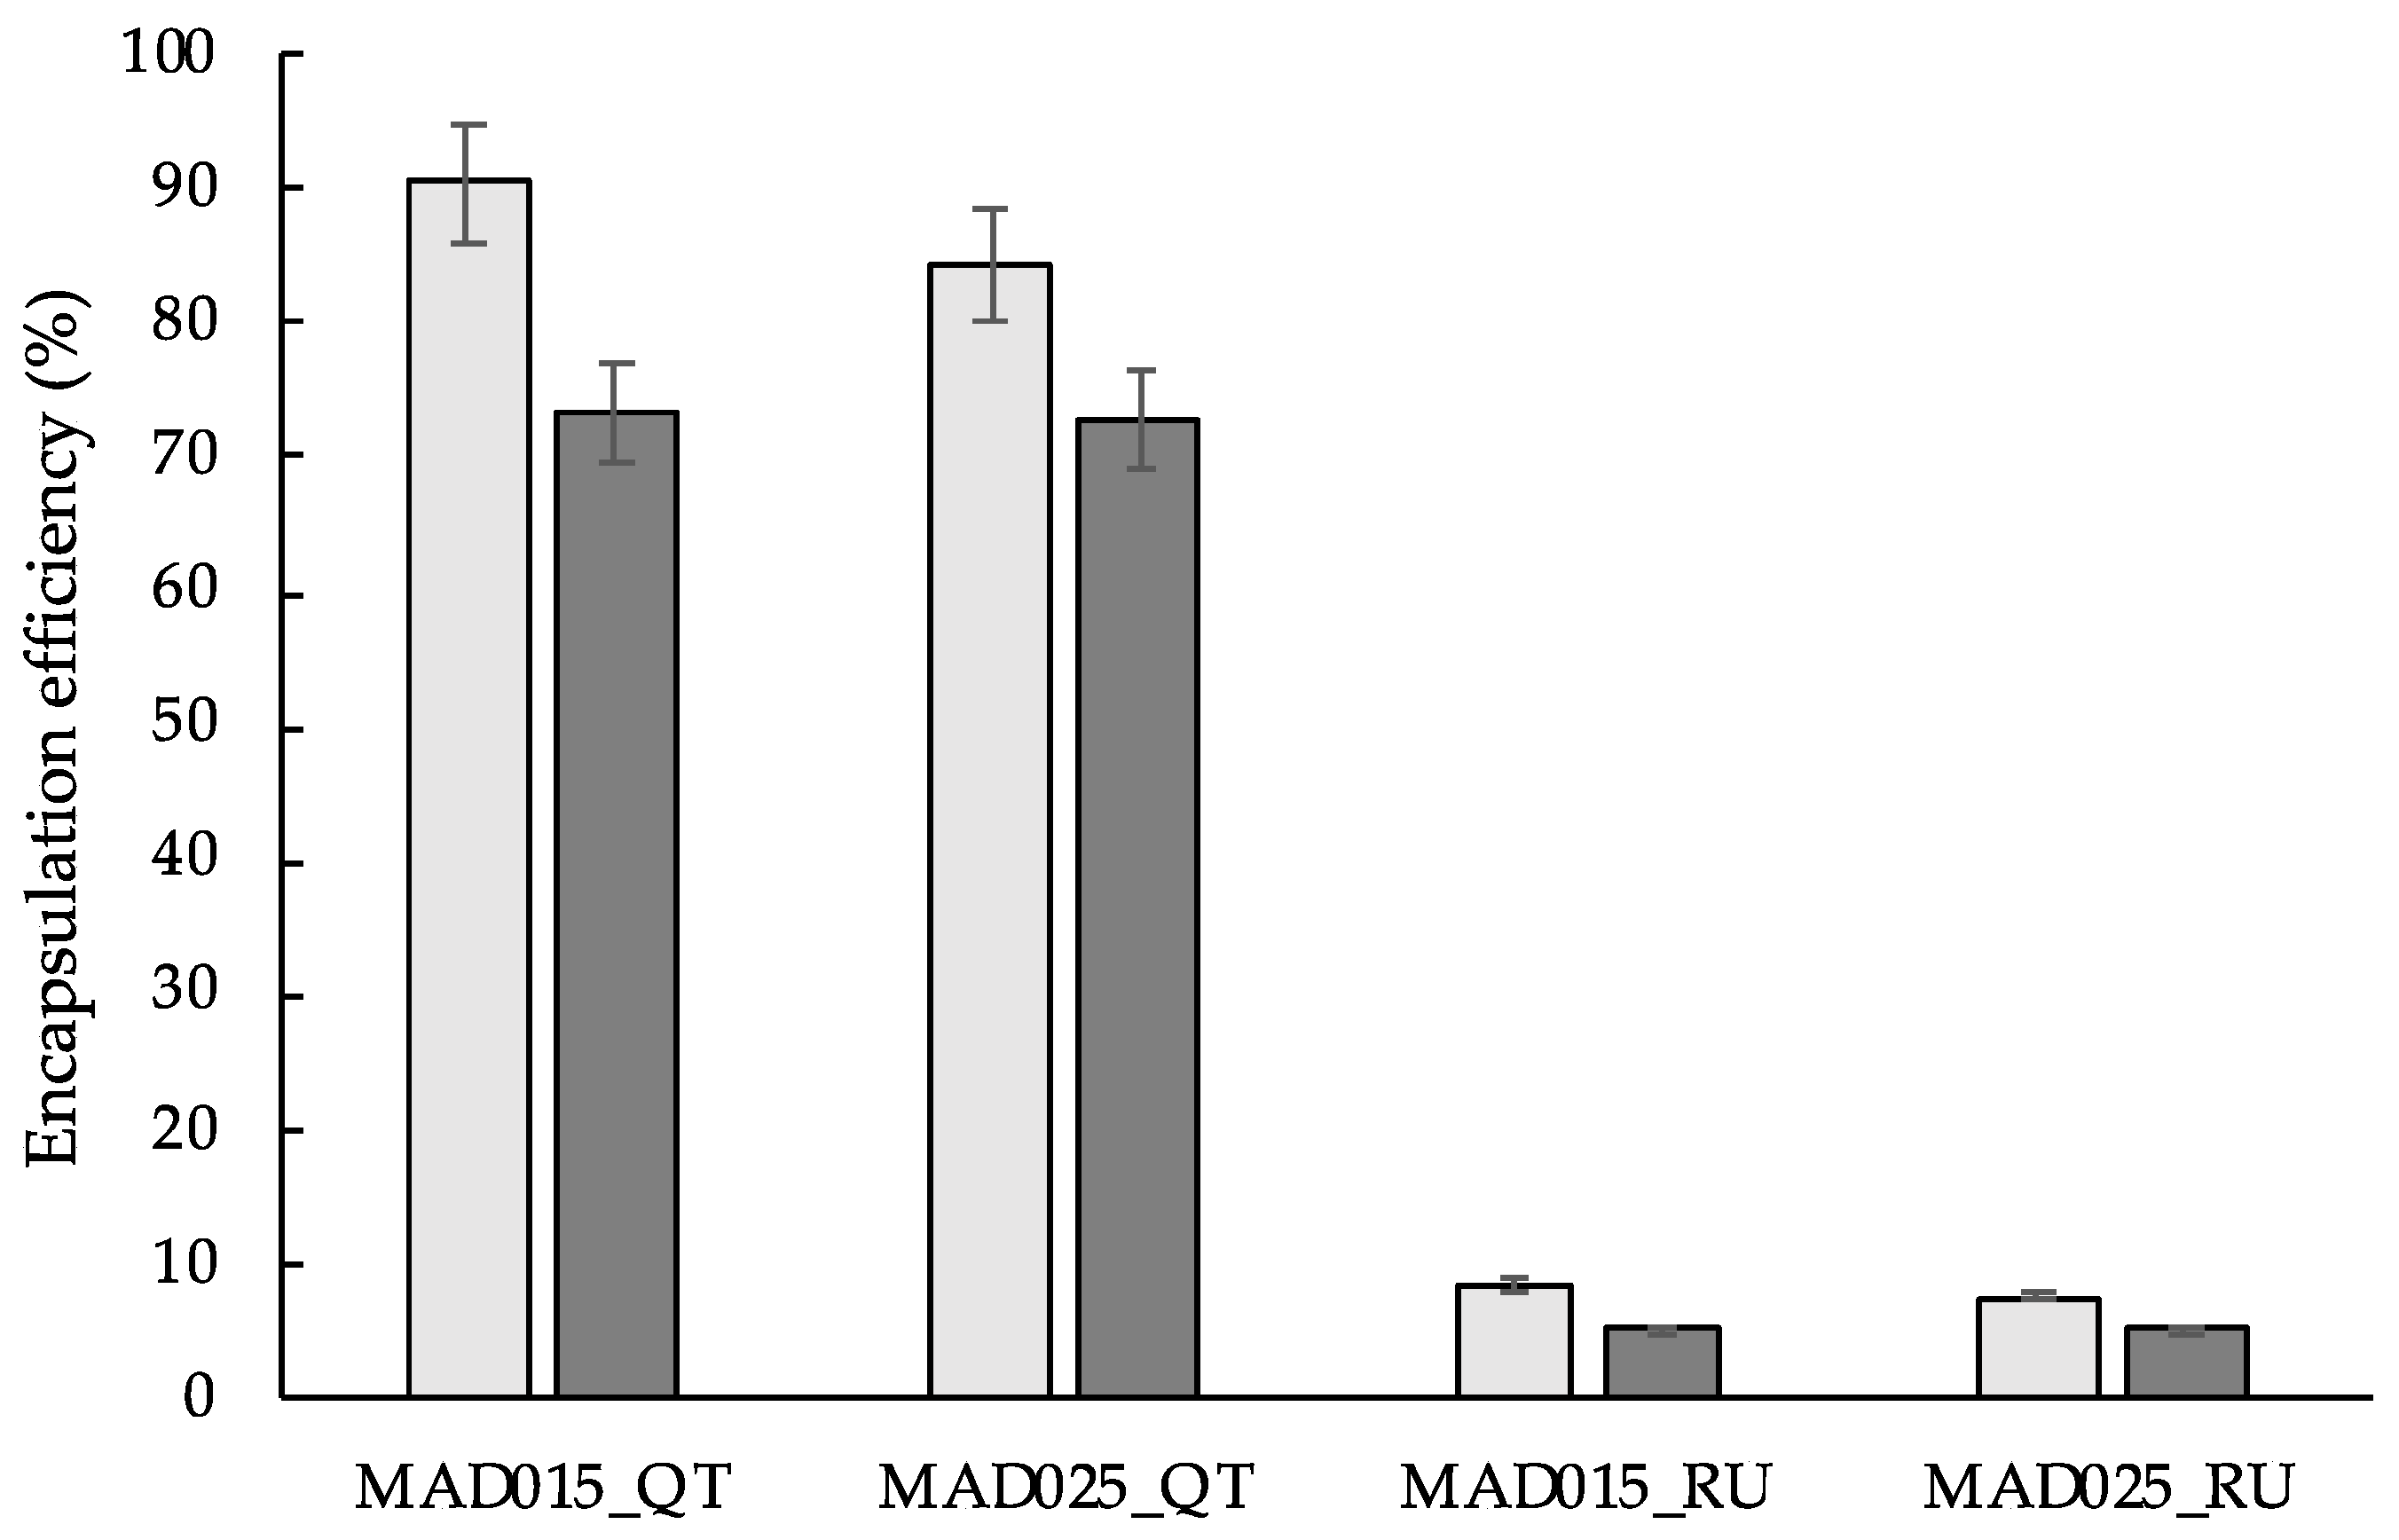
3.1. Preparation and Characterization of QT and RU Containing MAD

MAD composed as reported in Table 1, were prepared as above described [5]. Particularly, two different concentrations of surfactant, namely sodium cholate, have been selected in order to investigate the effect of MAD formulation on drug encapsulation. The use of sodium cholate as emulsifier is largely considered in liposomes production, thanks to its biocompatible nature, and its effect on the lipid structure and on the solubility of low aqueous drugs contributes to stabilize MAD formulation [1]. Afterwards, the same amount of QT or RU has been considered for their encapsulation in both compositions.
After production, the macrosopic aspect of QT and RU containing MAD appears translucent, as shown Figure 1. Particularly, both QT and RU confer a yellow color to the dispersion, more brilliant in case of RU, with no appreciable differences releated to the loaded drug. Conversely, the concentration of sodium cholate in the formulation influences the viscosity of the dispersion. Indeed, the higher the percentage of surfactant the higher the viscorsity of the system.
The MAD dimensions, measured by PCS after production and expressed by the Z-Average, are reported in Table 2. MAD025 show smaller dimensions in both formulations, even more evidenced in the case of QT loading. This reduction could be releated to the higher amount of surfactant able to stabilize the dispersion giving slightly smaller sizes. Moreover, the polydispersity indexes suggest a monomodal distribution, confirming the homogeneous appearance of the MAD. Overall, the nature of the encapsulated drug does not influence the dimension of the final formulation, allowing to obtain homogeneous dispersions.
In order to evaluate the physical stability of MAD015 and MAD025, the size has been analyzed 30 days after production and the results are reported in Figure 1. It was found that the formulations tend to decrease the dimensions in time, even if a slight instability characterizes MAD025_RU. Indeed, in this formulation the size increses of about 100 nm in 30 days possibly due to the chemical interaction between the surfactant and the bulky nature of RU. The dimensional distribution was investigated also by SdFFF method. Particularly, an observed retention time is directly related by theory to the mass of the eluting particles and transformed into a size and the UV signal into a mass frequency function. The obtained fractograms are thus converted into PSD plots according to well-proven equations [7,8]. Figure 2 shows the PSD plots of MAD015 and MAD025 containing QT and RU. The single narrow peak represented in each panel, confirm the monomodal distribution of the MAD as evidenced by the polydispersity indexes obtained by the PCS analysis. As previously reported [5], PCS and SdFFF are based on different principles, thus the complementary evaluation of the dimensional distribution allows a more accurate evidence of size, leading in this case to superimposable data. In addition, SdFFF was employed to obtain information about the encapsulation of active compounds and concerning drug content the analysis showed that the encapsulated amount of QT and RU were completely associated to the MAD lipid phase.
In order to shed light on the internal structure obtained with the different composition of MAD, Cryo-TEM analysis has been performed. As clearly reported in Figure 3, sodium cholate content influences the morphological aspect of MAD. Indeed, MAD015 (left coloumn) appear as a mixture of vesicles and cubic structures, whilst MAD025 (right coloumn) are mainly characterized by unilamellar vesicular structures. Paricularly, as previously described [1,13], the presence of sodium cholate at higher concentration in MAD formulation limits the formation of cubic or different liquid crystalline phases promoting unilamellar structures.
Furthermore, no significant differences are noticeable between QT or RU-loaded MAD suggesting that the chemical structure of the QT and its derivative RU does not influence the aspect of the formulation.
The encapsulation of QT and RU into MAD015 and MAD025, expressed as percentage of the total amount used for the formulation, has been evaluated by UV spectroscopy and the stability of the drug content has been monitored 30 days after production, as displayed in Figure 4.
In the case of QT, the EE was 90.5% and 84.4% respectively in MAD015 and MAD025, showing a slight decrese up to 73% after 30 days. Unfortunately, in the case of RU, the EE was only 8.3% and 7.5% respectively in MAD015 and MAD025, halving the content after 30 days. For the analysis of these data, it can be underlined that both formulations are able to increase at least 80-fold QT solubility [14] and preserve its encapsulation in time, while the same was not verified for RU.

3.2. In Vitro Experiments

Franz-cell associated to nylon membrane was used to evaluate the release of QT and RU from MAD. Nylon membrane was used to retain MAD and allow the transfer of the drug to the receiving buffer. Since the QT and RU are poorly soluble in water, a non-physiological receiving phase added with ethanol (30% v/v) was used to establish the sink conditions [5]. The obtained results indicated that the two types of MAD behave similarly in releasing of QT and RU (data not shown) [5].
The antioxidant activity of QT and RU was assayed using two different methods, namely DPPH and ORAC test. The DPPH analysis revealed the EC50 values of QT and RU of 0.64 mg/mL and 1.40 mg/mL respectively, suggesting that a minor concentration of QT is able to decrease DPPH free radicals with respect to RU. Thus, experiments on antioxidant activity demonstrated the two-fold power of QT as compared to RU.
Afterwards, the antioxidant capacity of MAD015_QT/RU and MAD025_QT/RU analyzed by ORAC assay demonstrated a similar activity for QT and RU when the floavonoids are encapsulated into MAD. The data reported in Table 3 indicate similar antioxidant behaviour of the formulations and the antioxidant activity of QT and RU is maintained when they are associated to MAD. Nonetheless, an additional analysis on empty MAD015 and MAD025 could elucidate the possible contribution of sodium cholate on the antioxidant activity.

4. Conclusions

MAD can be proposed as a potential solution for the delivery of the antioxidant molecule QT, whilst many studies have to be performed for finding a way to deliver RU. Thus, this formulation represents a promising tool to solubilize lipophilic molecules in a water-based system overcoming their low aqueous solubility.

Author Contributions

R.C. and E.E. conceived and designed the experiments; M.S., S.S.H. and M.D. performed the experiments; R.C. and M.S. analyzed the data; R.C. and M.S. wrote the paper. All authors have read and agreed to the published version of the manuscript.

Institutional Review Board Statement

Not applicable.

Informed Consent Statement

please exclude this statement.

Data Availability Statement

please exclude this statement.

Acknowledgments

This study was funded by Unife FIR2018, FAR2020.

Conflicts of Interest

The authors declare no conflict of interest.

Abbreviations

The following abbreviations are used in this manuscript:
MADMonoolein aqueous dispersions
cryo-TEMCryogenic transmission electron microscopy
PCSPhoton correlation spectroscopy
SdFFFSedimentation field flow fractionation

References

  1. Esposito, E.; Ravani, L.; Mariani, P.; Contado, C.; Drechsler, M.; Puglia, C.; Cortesi, R. Curcumin containing monoolein aqueous dispersions: A preformulative study. Mater. Sci. Eng. C 2013, 33, 4923–4934. [Google Scholar] [CrossRef] [PubMed]
  2. Esposito, E.; Mariani, P.; Ravani, L.; Contado, C.; Volta, M.; Bido, S.; Drechsler, M.; Mazzoni, S.; Menegatti, E.; Morari, M.; et al. Nanoparticulate lipid dispersions for bromocriptine delivery: Characterization and in vivo study. Eur. J. Pharm. Biopharm. 2012, 80, 306–314. [Google Scholar] [CrossRef] [PubMed]
  3. Ganeshpurkar, A.; Saluja, A.K. The Pharmacological Potential of Rutin. Saudi Pharm. J. 2017, 25, 149–164. [Google Scholar] [CrossRef] [PubMed]
  4. Puglia, C.; Cardile, V.; Panico, A.M.; Crascì, L.; Offerta, A.; Caggia, S.; Drechsler, M.; Mariani, P.; Cortesi, R.; Esposito, E. Evaluation of Monooleine Aqueous Dispersions as Tools for Topical Administration of Curcumin: Characterization, in Vitro and Ex-Vivo Studies. J. Pharm. Sci. 2013, 102, 2349–2361. [Google Scholar] [CrossRef] [PubMed]
  5. Cortesi, R.; Cappellozza, E.; Drechsler, M.; Contado, C.; Baldisserotto, A.; Mariani, P.; Carducci, F.; Pecorelli, A.; Esposito, E.; Valacchi, G. Monoolein aqueous dispersions as a delivery system for quercetin. Biomed. Microdevices 2017, 19, 41. [Google Scholar] [CrossRef] [PubMed]
  6. Pecora, R. Dynamic Light Scattering Measurement of Nanometer Particles in Liquids. J. Nanoparticle Res. 2000, 2, 123–131. [Google Scholar] [CrossRef]
  7. Contado, C.; Blo, G.; Fagioli, F.; Dondi, F.; Beckett, R. Characterisation of River Po particles by sedimentation field-flow fractionation coupled to GFAAS and ICP-MS. Colloids Surf. A Physicochem. Eng. Asp. 1997, 120, 47–59. [Google Scholar] [CrossRef]
  8. Esposito, E.; Fantin, M.; Marti, M.; Drechsler, M.; Paccamiccio, L.; Mariani, P.; Sivieri, E.; Lain, F.; Menegatti, E.; Morari, M.; et al. Solid Lipid Nanoparticles as Delivery Systems for Bromocriptine. Pharm. Res. 2008, 25, 1521–1530. [Google Scholar] [CrossRef]
  9. Takao, T.; Kitatani, F.; Watanabe, N.; Yagi, A.; Sakata, K. A Simple Screening Method for Antioxidants and Isolation of Several Antioxidants Produced by Marine Bacteria from Fish and Shellfish. Biosci. Biotechnol. Biochem. 1994, 58, 1780–1783. [Google Scholar] [CrossRef]
  10. Kumarasamy, Y.; Byres, M.; Cox, P.J.; Jaspars, M.; Nahar, L.; Sarker, S.D. Screening seeds of some Scottish plants for free radical scavenging activity. Phytother. Res. 2007, 21, 615–621. [Google Scholar] [CrossRef] [PubMed]
  11. Wang, M.; Li, J.; Rangarajan, M.; Shao, Y.; LaVoie, E.J.; Huang, T.-C.; Ho, C.-T. Antioxidative Phenolic Compounds from Sage (Salvia officinalis). J. Agric. Food Chem. 1998, 46, 4869–4873. [Google Scholar] [CrossRef]
  12. Merrell, J.G.; McLaughlin, S.W.; Tie, L.; Laurencin, C.T.; Chen, A.F.; Nair, L.S. Curcumin-loaded poly(ε-caprolactone) nanofibres: Diabetic wound dressing with anti-oxidant and anti-inflammatory properties. Clin. Exp. Pharmacol. Physiol. 2009, 36, 1149–1156. [Google Scholar] [CrossRef] [PubMed]
  13. Esposito, E.; Drechsler, M.; Mariani, P.; Panico, A.M.; Cardile, V.; Crascì, L.; Carducci, F.; Graziano, A.C.E.; Cortesi, R.; Puglia, C. Nanostructured lipid dispersions for topical administration of crocin, a potent antioxidant from saffron (Crocus sativus L.). Mater. Sci. Eng. C 2017, 71, 669–677. [Google Scholar] [CrossRef] [PubMed]
  14. Gao, L.; Liu, G.; Wang, X.; Liu, F.; Xu, Y.; Ma, J. Preparation of a chemically stable quercetin formulation using nanosuspension technology. Int. J. Pharm. 2011, 404, 231–237. [Google Scholar] [CrossRef] [PubMed]
Figure 1. Macroscopic aspect (a,b) and size variation at 1 (light grey) and 30 (dark grey) days after production (c) of MAD015_QT, MAD025_QT, MAD015_RU and MAD025_RU.
Proceedings 78 00025 g001
Figure 2. Size distribution plots of MAD015_QT (a), MAD025_QT (b), MAD015_RU (c) and MAD025_RU (d) elaborated from the SdFFF fractograms. Dots indicate the fractions containining QT or RU.
Proceedings 78 00025 g002
Figure 3. Cryo-TEM images of MAD015 (left column) and MAD025 (right column) referring to MAD015_QT (a) and MAD025_QT (b) and to MAD015_RU (c) and MAD025_RU (d).
Proceedings 78 00025 g003
Figure 4. Variation of QT and RU content into MAD015 and MAD025 evaluated at 1 (light grey) and 30 (dark grey) days after production.
Proceedings 78 00025 g004
Table 1. Composition by weight of the prepared MAD.
Component
(% w/w)
MAD015MAD025
Monoolein4.505.00
Sodium cholate0.150.25
Water 95.3594.75
QT or RU0.0250.025
Table 2. Dimensional size distribution of QT or RU containing MAD after production.
MAD015_QTMAD025_QTMAD015_RUMAD025_RU
Z-Average (nm)402.3 ± 57.9 *321.6 ± 57.3 *333.1 ± 0.7313.2 ± 7.0
Polidispersity index0.34 ± 0.110.25 ± 0.110.23 ± 0.050.32 ± 0.01
* data reported in literature [5].
Table 3. Antioxidant activity of QT and RU containing MAD as determined by ORAC assay.
Antioxidant TestMAD015_QTMAD025_QTMAD015_RUMAD025_RU
ORAC a27.50 ± 2.0231.07 ± 1.0938.52 ± 1.4039.07 ± 3.00
a unit (µmol T/g).
Publisher’s Note: MDPI stays neutral with regard to jurisdictional claims in published maps and institutional affiliations.

