Proceeding Paper

Pharmacokinetic Appraisal of Carprofen Delivery from Intra-Articular Nanoparticles: A Population Modeling Approach in Rabbits †

by
Alexander Parra-Coca
1,2,
Antonio Boix-Montañés
1,*,
Ana C. Calpena
1,3 and
Helena Colom
1
1
Department of Pharmacy and Pharmaceutical Technology and Physical-Chemistry, Faculty of Pharmacy and Food Sciences, University of Barcelona, 08007 Barcelona, Spain
2
Department of Veterinary Medicine and Zootechnic, Faculty of Agricultural Sciences, University of Applied and Environmental Sciences (U.D.C.A.), Bogotá 111166, Colombia
3
Institute of Nanoscience and Nanotechnology (IN2UB), Faculty of Pharmacy and Food Sciences, University of Barcelona, 08028 Barcelona, Spain
*
Author to whom correspondence should be addressed.
Presented at the 1st International Electronic Conference on Pharmaceutics, 1–15 December 2020; Available online: https://iecp2020.sciforum.net/.
Proceedings 2021, 78(1), 11; https://doi.org/10.3390/IECP2020-08677
Published: 1 December 2020
(This article belongs to the Proceedings of The 1st International Electronic Conference on Pharmaceutics)

Abstract

:
Osteoarthritis is frequently treated in veterinary settings with non-steroidal anti-inflammatory drugs (NSAID) such as carprofen (CP). Its action over the articular cartilage can be enhanced by increasing drug uptake into the cartilage, alongside its site of action, and anticipating its rapid distribution towards the bloodstream. A pharmacokinetic study to evaluate carprofen nanoparticles (NP) after intraarticular administration (IA) in rabbits was performed through a modeling allometric approach. The pharmacokinetic analysis of plasma profiles showed a rapid CP distribution outwards the synovial chamber but mainly remaining in plasma (Vc = 0.14 L/5 Kg), according to its high protein-binding. The absorption data modeling showed the occurrence of two different release–absorption rate processes after nanoparticle administration in the synovial space, i.e., a fast rate process causing a burst effect and involving the 59.5% of the total CP absorbed amount and a slow rate process, involving 40.5%. Interestingly, the CP burst effect inside the joint space enhances its diffusion towards cartilage resulting in CP accumulation in about three times higher concentrations than in plasma. In line with these results, the normalized-by-dose area under the concentration vs. time curve (AUC) values after IA were 80% lower than those observed after the intravenous. Moreover, the slower slope of the concentration–time terminal phase after IA administration vs. intravenous (IV) suggested a flip-flop phenomenon (0.35 h-1 vs. 0.19 h-1). Notably, CP clearances are predictive of the pharmacokinetic (PK) profile of CP in healthy humans (0.14 L/h/5 kg vs. 2.92 L/h/70 kg) although an over-estimation has been detected for cats or dogs (10 times and 4 times, respectively). This fact could probably be attributed to inter-species metabolic differences. In summary, despite the limited number of animals used, this study shows that the rabbit model could be suitable for a predictive evaluation of the release enhancement of CP-NP towards the biophase in arthritic diseases not due to sterical retention of the formulation.

1. Introduction

Osteoarthritis is managed with COX or fosfolipase A2 inhibitors to decrease prostaglandin mediators. Carprofen (CP) is an anti-inflammatory, analgesic and antipyretic propionic acid-derivative, used in veterinary medicine [1] as an alternative to corticosteroidic management of local inflammations [2]. Intraarticular administration (IA), improves local action and reduces systemic effects. Drug delivery to synovial fluid lining with the biophase, i.e., articular cartilage surface [3] improves the quality of life of animals with inflammatory arthropaties [4]. Drug uptake to the cartilage requires high synovial fluid concentrations, anticipating its rapid distribution towards bloodstream [5] due to the thin layer of specialized cells of the synovial cavity that facilitates the drug diffusion through. Indeed, a rapid equilibrium is achieved between synovial fluid and plasma [5]. Nanoparticle formulations, using biocompatible [6] Poly lactic-co-glycolic acid (PLGA) polymers, are promising [7,8,9,10] to extend the drug residence times, bioavailability and duration of effects [4]. The aim of the current study is the in vivo evaluation of CP nanoparticles for IA administration through a modelling approach, in rabbits.

2. Experiments

2.1. Reagents and Substances and Assay Solutions

Carprofen was purchased from Sigma-Aldrich. KH2PO4, Na2HPO4.2H2O, acetonitrile, methanol, ortophosphoric acid 85%, sodium acetate trihydrate and ammonium acetate were purchased from Panreac (Barcelona, Spain). Deionized water (>10 MΩ.cm) was obtained on-site. Buffers were prepared as described elsewhere [11]. Poly Lactic-co-Glycolic Acid (Resomer® RG 753 S) was purchased from SigmaAldrich and Ethylene-Propylene Oxides Block Copolymer (Lutrol F68®P188) was a gift sample from Basf (Barcelona, Spain). All other reagents were also of analytical grade.

2.2. Animals and Drug Administration

Study protocol was approved (Ref.2015_089) by the animal welfare committee (Department of Agriculture, Livestock and Fisheries, 1997). Three 7-month-old white New-Zealand healthy male rabbits (Harlan, Barcelona, Spain) weighing 3.76–3.94 kg housed under standard conditions receiving food and water ad libitum were used. After anesthesia with xylazine (Rompun® 20 mg/mL, BayerHispania, Spain) and ketamine (Imalgene® 100 mg/mL, Merial, Spain), a dilution of CP Rimadyl® 50 mg/mL (Zoetis, Spain) in physiologic saline (1:1 v/v) was administered through the right ear vein at 4 mg/kg. Secondly, CP nanoparticles 4.5 mg/mL were administered intraarticularly at 0.5 mg/kg through the right knee joint according to a cross-over design with 7 days wash-out. The left ear vein was catheterized (22G × 1.00in., Henry Schein, Hong Kong, China) and Vacutainer® tube K2E was used for sampling (Beckton&Dickinson, Madrid, Spain).

2.3. Sampling Procedures

Ethylenediaminetetraacetic blood samples (1.3 mL) were always collected at 0, 0.25, 0.5, 1, 2, 4, 6, 8, 24, 48, 72 and 96 h and cooled on ice (30 min). After centrifugation (5000 rpm/10 min), plasma was stored at −80 °C until analysis. A total of 96 h after IA administration, animals were sacrificed with pentobarbital (Dolethal® 200 mg/mL, Vetoquinol, Alcobendas, Spain) through the auricular vein. Knees (lateral and contralateral) of one animal were excised to obtain synovial liquid, femoral articular cartilage (both condyles) and meniscus tissue. Samples were weighted in glass vials and frozen at −80 °C until analysis.

2.4. Analysis of CP in Plasma and Knee Samples

CP Solid-phase extraction in plasma samples was performed with Discovery® DSC-18 cartridges and Visiprep DL® vacuum manifold (Supelco) followed by HPLC-UV as described by Parton et al. [12]. Knee samples were analyzed as described by [13] and expressed in µg/g. The HPLC method was acceptably linear within the calibration range (0.51–103.50 µg/mL). The lower limit of quantification (LLOQ) was 0.51 µg/mL.

2.5. Data Analysis. Non-Compartmental/Compartmental Pharmacokinetic/Deconvolution Analysis

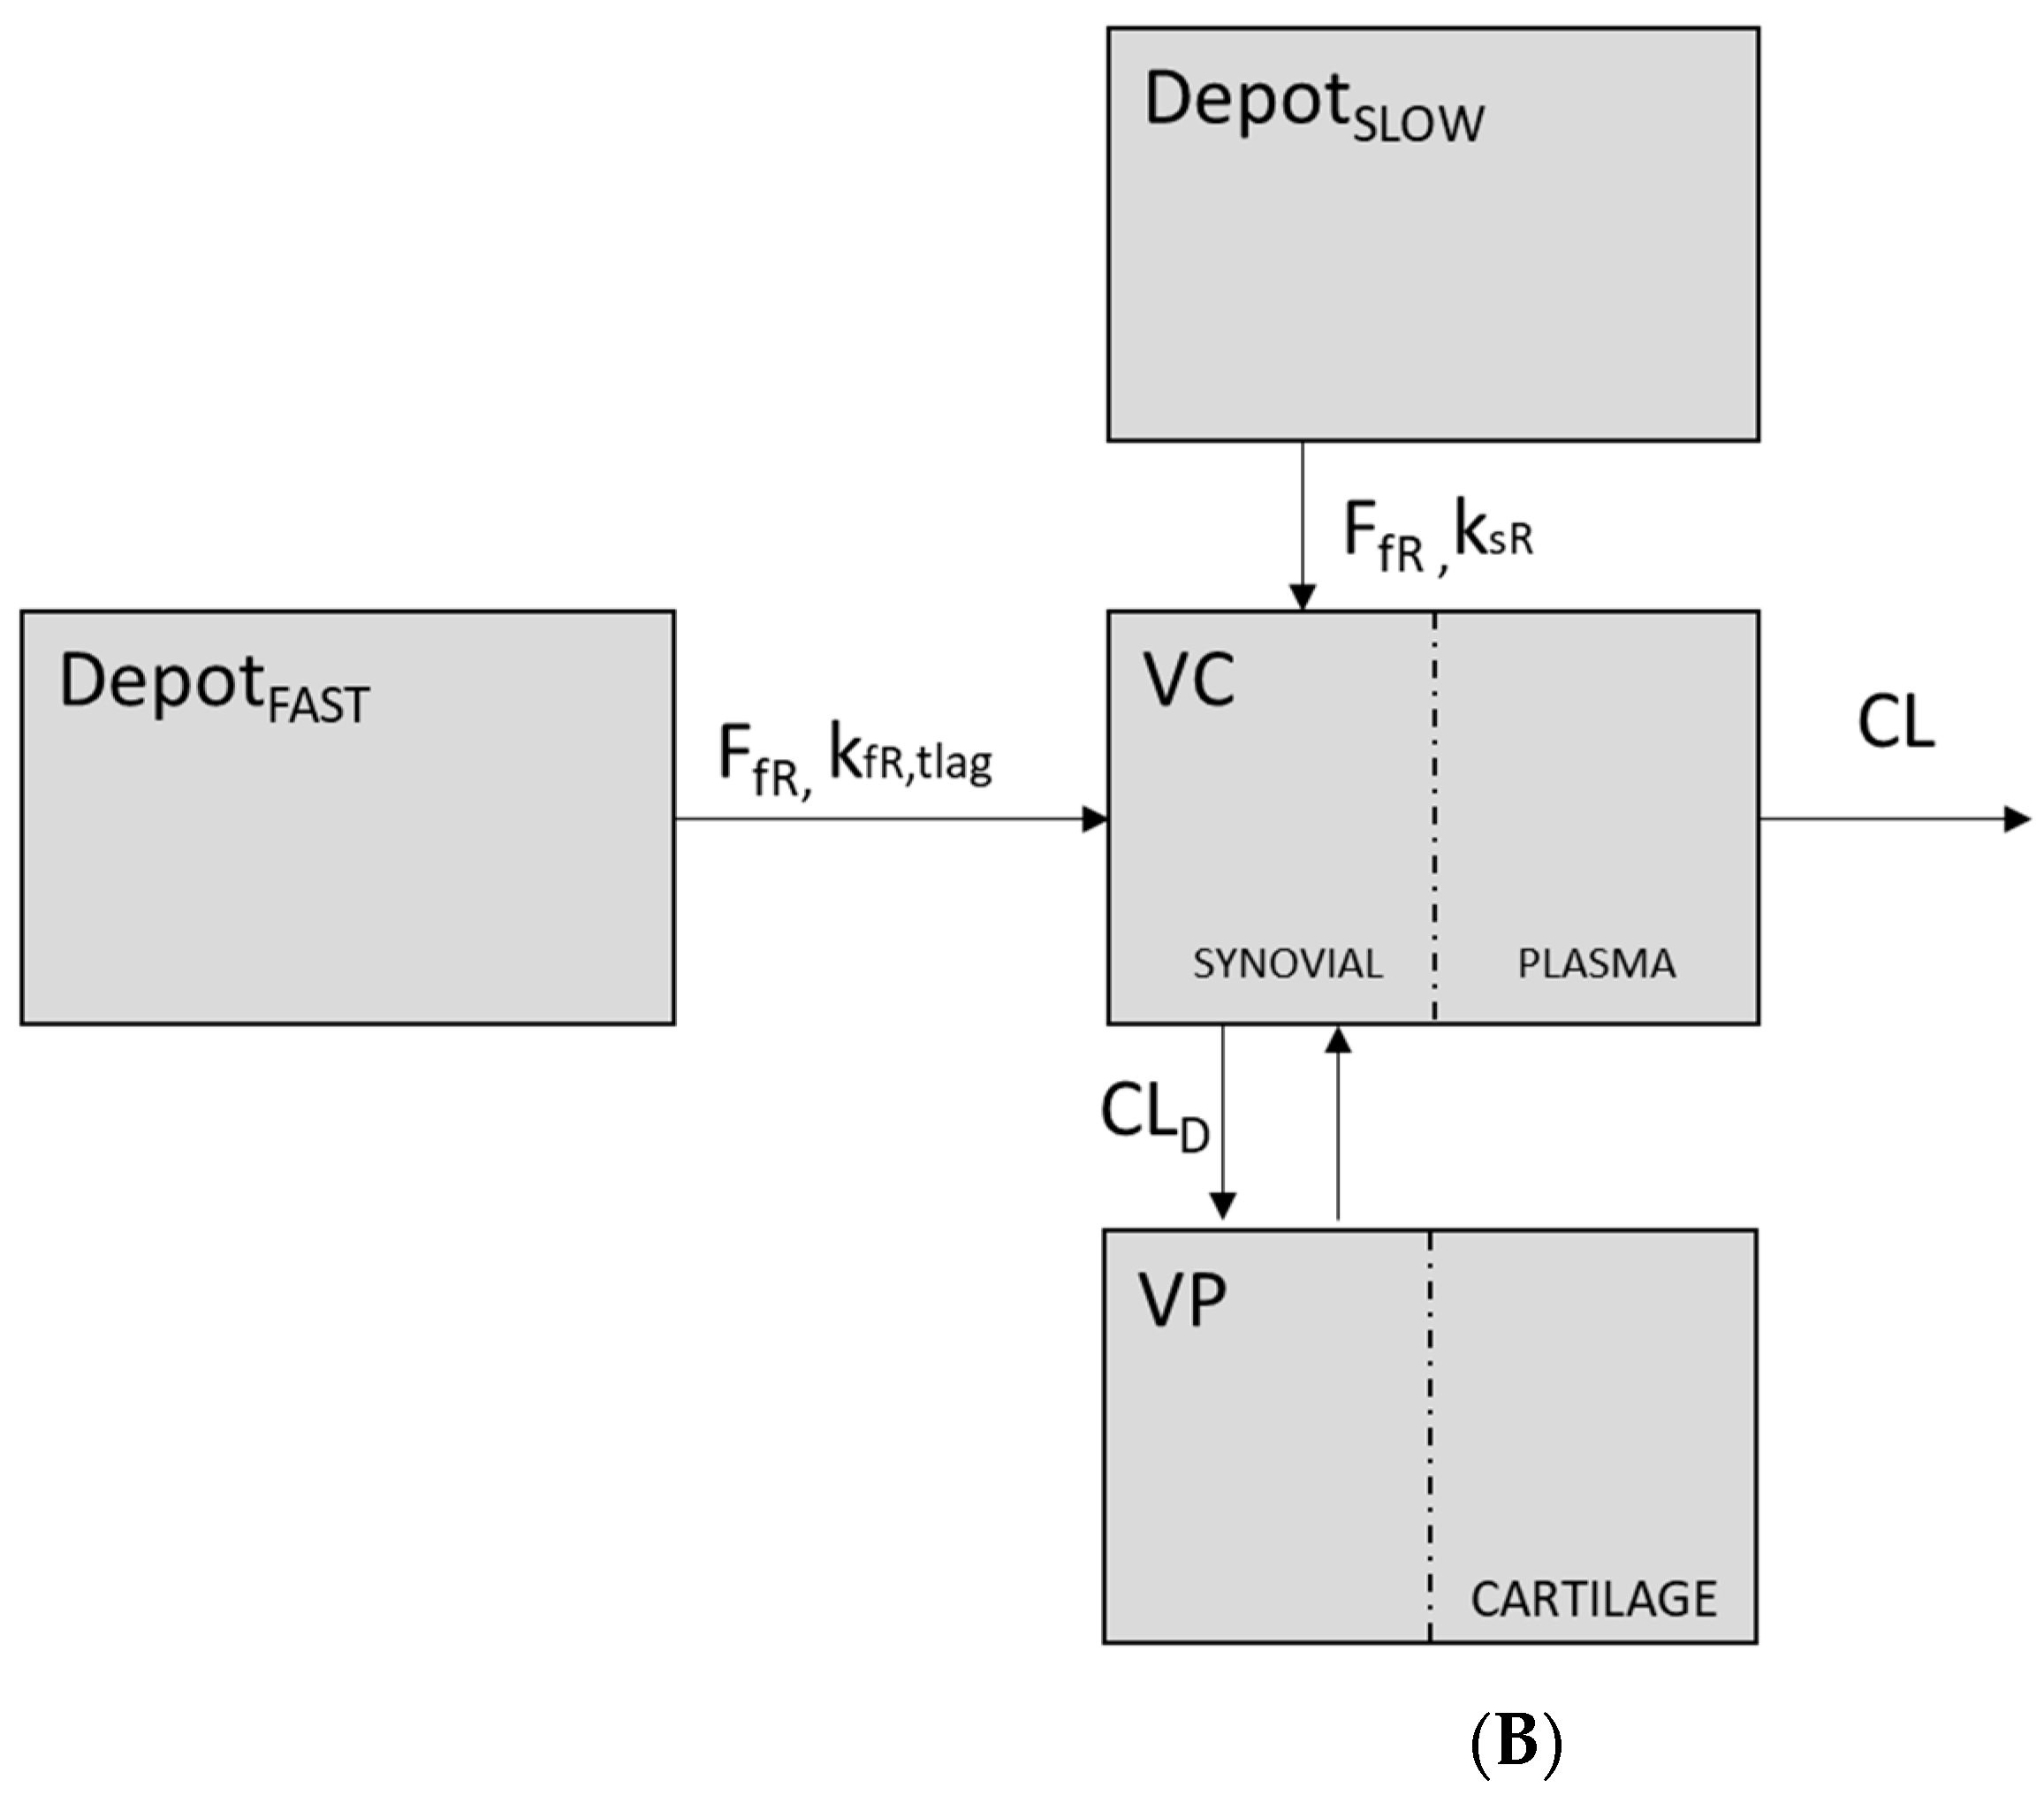
Individual pharmacokinetic parameters [14] were estimated using non-compartmental analysis. The in vivo CP input rate from the nanoformulation I(t) was calculated by numerical deconvolution [15] with Phoenix-WinNonlin® 64.8.2 Certara Inc. All CP plasma concentrations (IV and IA) were simultaneously analyzed with a population approach using NONMEM ver 7.4 [16] and Xpose R package v4.2.1, as diagnostic tool. The first-order-conditional estimation method (FOCEI) with interaction was used for parameter estimation [17]. Inter-individual variability (IIV) exponentially modeled was evaluated for each pharmacokinetic parameter. Additive and combined error models were tested for residual variability. Model selection was based on: decrease in the minimum objective function (MOFV; −2xlog likelihood); parameter precision and visual inspection of goodness-of-fit plots (Gofs). A decrease in MOFV of 7.879 between nested models was statistically significant (p < 0.005). For non-hierarchical models, the model with lowest Akaike criterion (AIC) was selected [18]. One- and two-open-compartment models with linear elimination parameterized as distributional clearance (CLD), apparent distribution volumes (V), and elimination clearance (CL) were fitted to the data. Allometric weight scaling was a priori added to all disposition parameters standardized to 70 kg body weight [19,20,21]. The power parameter was 0.75 for clearances and 1.0 for distribution volumes [22]. Table 1 and Figure 1 summarize tentatives of description of CP release/absorption from nanoparticles. The descriptive/predictive capability of the final model was evaluated through Gofs and a visual predictive check (VPC) [23].

3. Results

3.1. Carprofen Concentrations

Mean ± SD plasma concentrations are displayed in Figure 2. Table 2 summarizes the comparative CP concentrations in knee tissues at 9 h post-IA-administration.

3.2. Pharmacokinetic Analysis

Table 3 summarizes the main non-compartmental disposition/absorption parameters. Caution should be taken because the high extrapolation percentage after IA administration (>20%) suggests that release/absorption process and bioavailability (51.4%) could not be accurately characterized.
A total of 47 CP plasma concentrations were analyzed by the population approach. Concentrations below the LLOQ (23.4%) were replaced by LOQ/2. CP disposition was best described by a two-compartment model. IIV was only associated with CL. The CP release/absorption from nanoparticles consisted of two first-order processes (KfR: fast and KsR: slow). Thus, the IA dose was partitioned into fast (FfR·F1·DoseIA) and slow (FsR·F1·DoseIA) absorption compartments, where FfR refers to the fraction of the administered dose for the fast absorption and FsR to the slow absorption (FsR = 1 − FfR). F1 and DoseIA the absolute bioavailabilty and the input from the IA CP dose at time of administration, respectively. The VPC (Figure 3) confirmed the descriptive/predictive model capability. The circles represent the observed data. Dashed lines depict the 2.5th and 97.5th percentiles of the simulated concentrations. The solid line corresponds to the 50th percentiles of the simulated concentrations. VPC showed that most of the data fell within the 90% prediction interval and were symmetrically distributed around the median both after iv and IA administrations. The final population pharmacokinetic parameters are shown in Table 4.
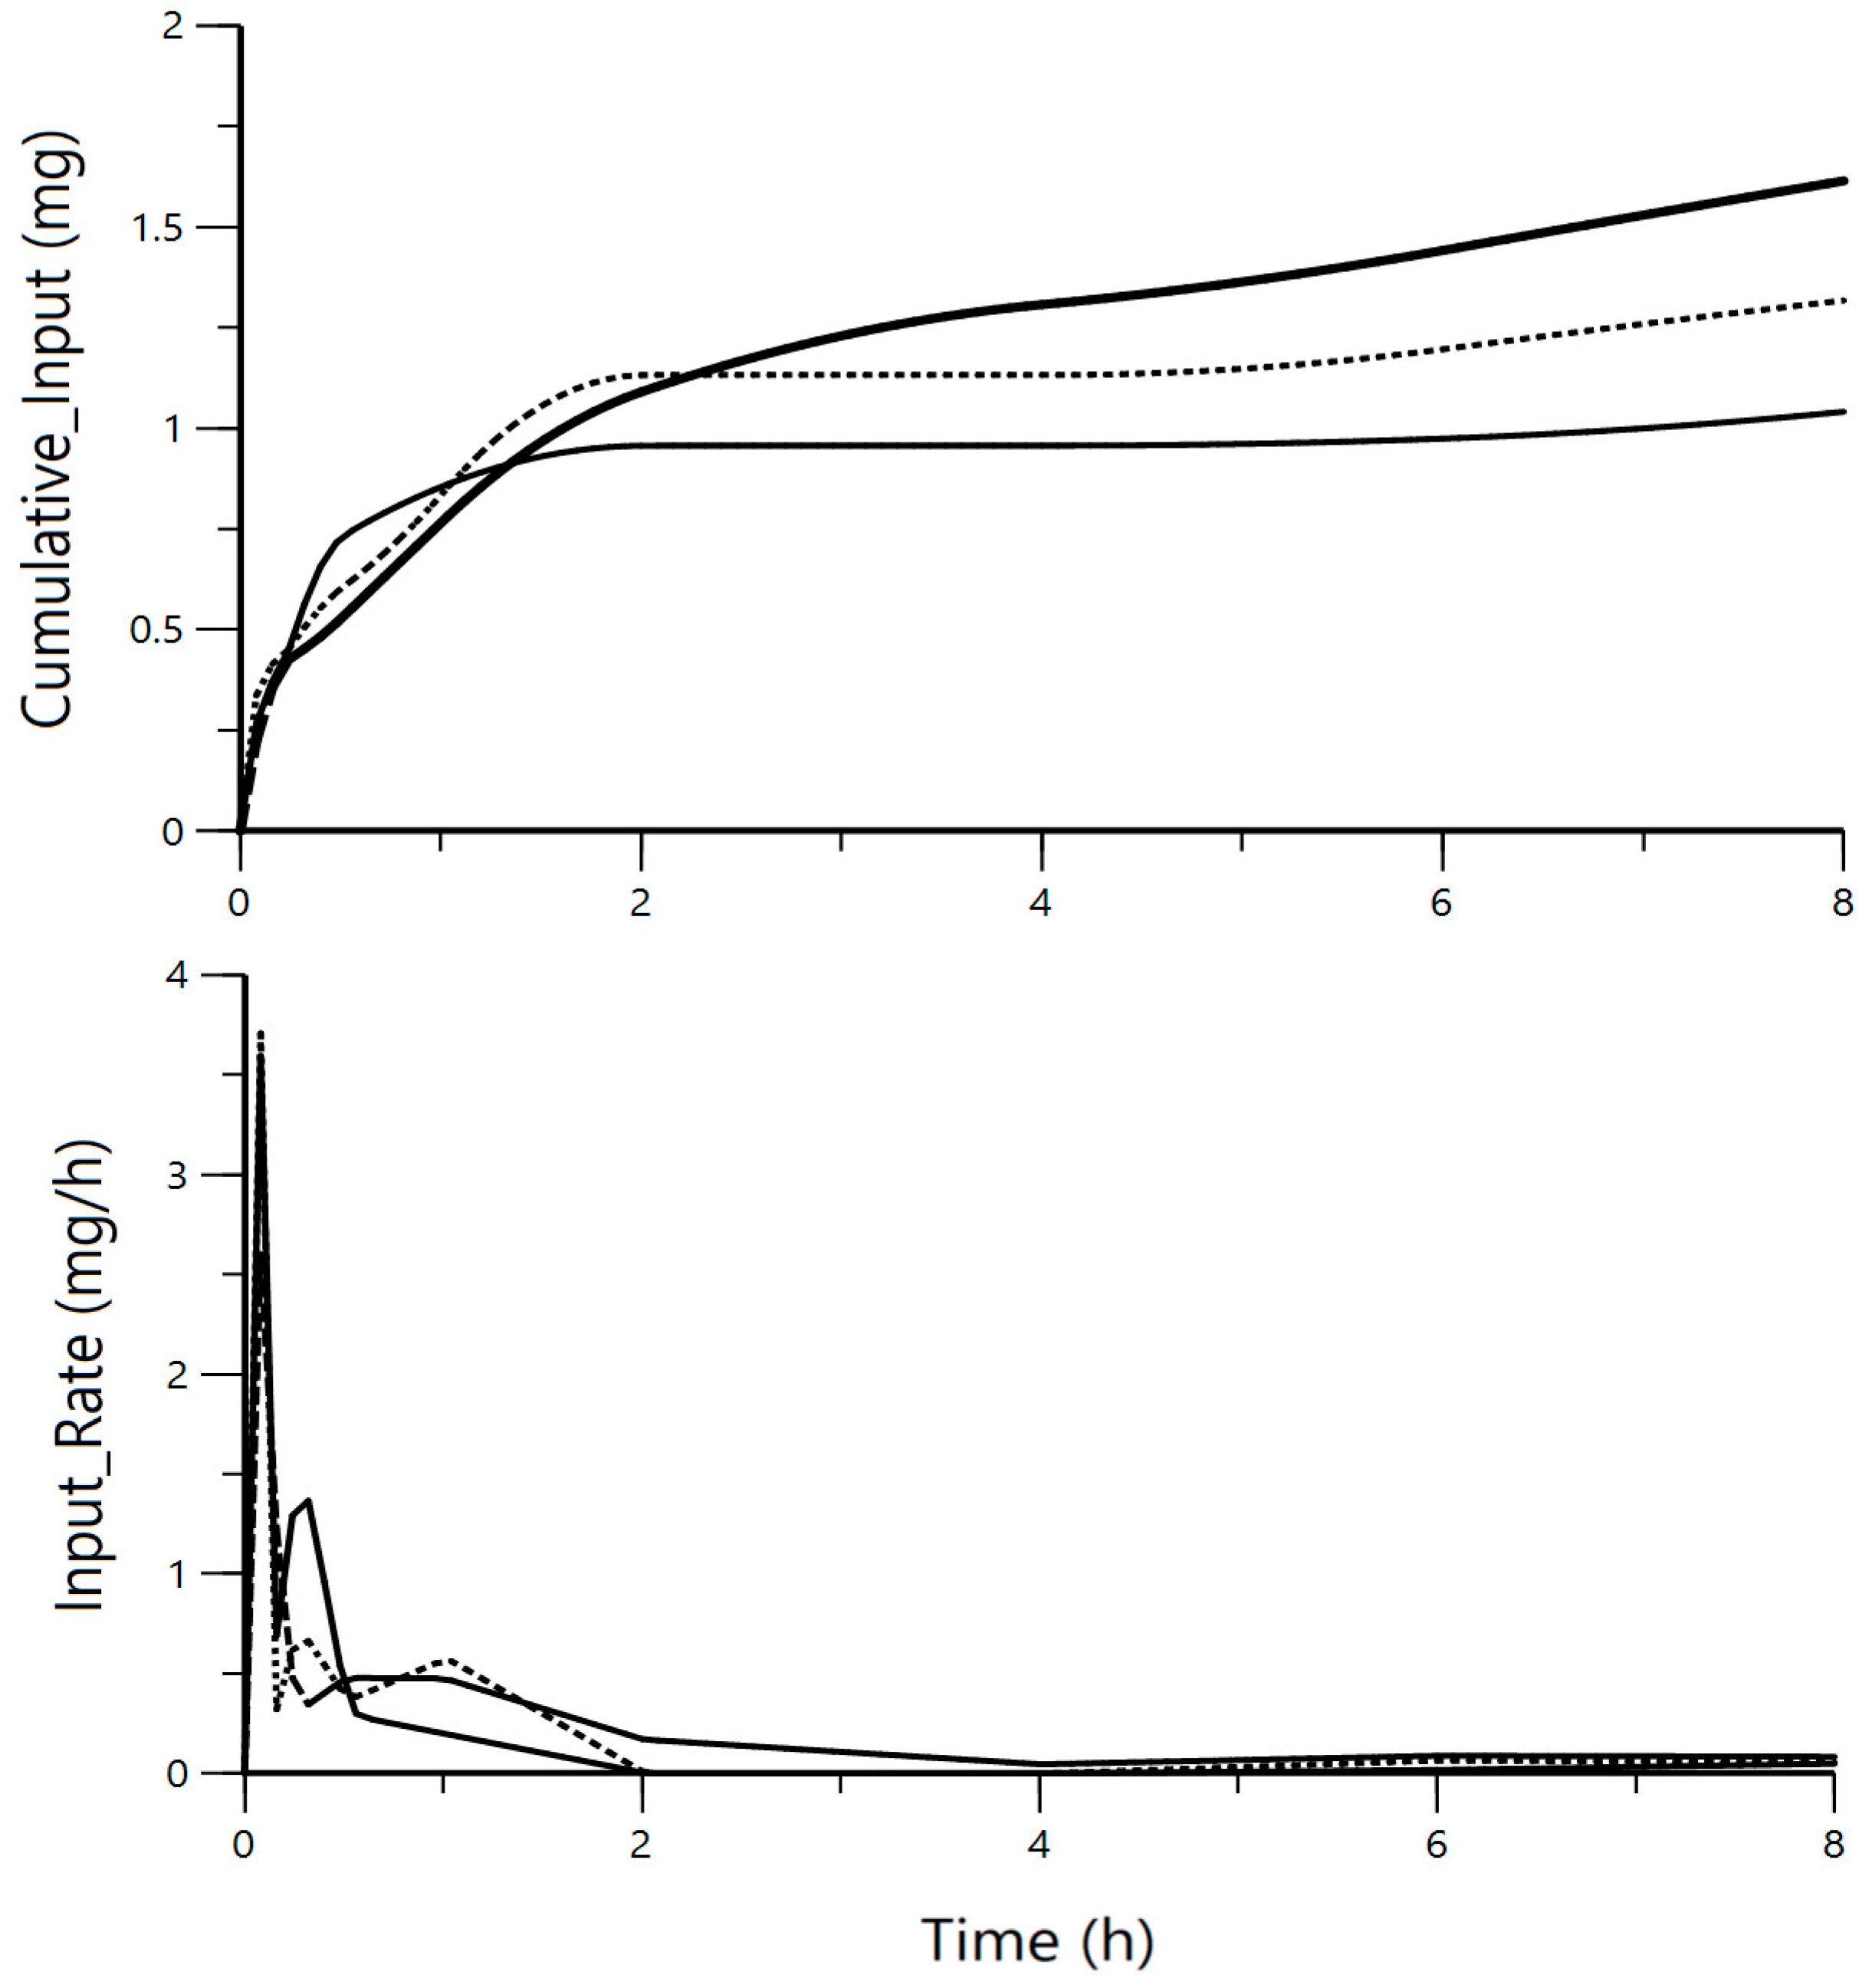
Individual in vivo cumulate release/absorption and input rate I(t) profiles from the assayed IA nanoformulation are shown in Figure 4. An initial first-order kinetics burst effect was followed by a more sustained release.

4. Discussion

Anatomical similarities of rabbits with other species (dog, cat) suggest the extrapolation of in vivo CP release/absorption to these species. As previously reported [12,24,25], CP disposition was best described by a two-compartment model. The steady-state distribution volume (Vss = 0.1126 L/kg mean live bodyweight) was in line with other results in rabbits [26], dogs 0.1192 L/kg [24] or cats (0.1506 L/kg) [27]. Considering a total body-water of 0.61 L/kg in live rabbits [28], the low Vss values suggest that carprofen is mainly confined to plasma according to its high protein-binding [29] as other NSAIDs [2].
Predicted CP clearance (1.99 L/h/70 kg) was in agreement with results in healthy volunteers [29] (100 mg IV: 2.916 L/h). However, somewhat higher CL was predicted for 7.1–15.8 kg dogs (0.0447 vs. 0.01487 L/h·kg) and for 1.9–6.0 kg cats (0.058 vs. 0.006 L/h/kg). Prediction failure of the allometric CP model is probably due to large interspecies differences in metabolic patterns [22]. The metabolic pathway is only known in dogs, cat and humans [30] but not in rabbits.
The CP bioavailability from the nanoparticles (51.4%) was lower than expected, since the IA route obviates first-pass effects. Analytical limitations preventing the complete characterization of the release/absorption profile (extrapolated areas >20%), or a higher iv variability than anticipated probably due to the low number of animals can be the cause. The flip-flop phenomenon of IA nanoparticles support a longer residence time than conventional formulations. The CP release/absorption profile was best described by an initial burst effect (fast release component) due to the rapid release/absorption of the unencapsulated fraction into central compartment with a rate constant of 7.38 h−1 (KfR), resulting in a high concentration gradient between synovial fluid and plasma at initial times. Afterwards, a sequential second process with a slower first order release rate constant (KsR = 0.0667 h−1) of microencapsulated CP occurred. The fast process contributed to the 60% of total CP reaching the systemic circulation while the slow release prevented CP from leaving the joint space rapidly. Poorly-optimized inclusion of the non-ionic surfactant beneath the PLGA matrix [31] could have contributed to such an undesirable initial burst effect, so improvement of the formulation would be required to extend the CP residence time in the synovial cavity. Additionally, the reduced intraarticular volume in rabbits has demanded the injection of a minimal volume (0.4 mL) that, although being highly concentrated to migrate towards the cartilage, does not allow the build-up of a relevant drug reservoir for a significant modified release. In any case, CP plasma levels resulted to be higher than the half maximal inhibitory concentration (IC50) for Cox2 [32] both after IV and IA administrations. The lower albumin concentrations in synovial fluid (60%) in rabbits compared to plasma resulted in higher total plasma CP concentrations than in synovial cavity once the distribution equilibrium reached, as also reported in sheep [25] and in horse [2].
The cumulative input profile predicted by deconvolution was useful to optimize previous in vitro evaluation tests. Indeed, inadequate in vitro release profiles [33] have been due to, probably, an inappropriate membrane type.

5. Conclusions

In vivo characterization of a new CP nanoformulation for IA administration has been performed in rabbits. The pharmacokinetic profile was scalable to other species. The CP burst effect inside the joint space enhances its diffusion towards cartilage and plasma. Although a limited number of animals, the rabbit model seems suitable for a predictive evaluation of the release enhancement of CP (not due to sterical retention of the formulation) towards the biophase of arthritic diseases.

Author Contributions

A.P.-C. and H.C. conceived and designed the experiments; A.P.-C. performed the experiments; H.C. and A.C.C. analyzed the data; A.B.-M. and H.C. contributed to discuss the results; A.P.-C. and A.B.-M. wrote the paper. All authors have read and agreed to the published version of the manuscript.

Institutional Review Board Statement

Approval of the study protocol is 2015_089.

Informed Consent Statement

Not applicable.

Data Availability Statement

The data presented in this study are available on request from the corresponding author.

Acknowledgments

Gimeno for providing technical assistance in stable facilities. The authors would like to thank Paola Bustos Salgado for her assistance in the management of the animals used in the experiments.

Conflicts of Interest

None of the authors had any financial or personal relationships that could inappropriately influence or bias the content of the paper. All are members of the Faculty of Pharmacy and Food Sciences of the University of Barcelona excepting Alexander Parra, currently Associate professor at the Universtiy of Bogotá. The institution played no role in the study design nor in the decision to submit the manuscript for publication. The authors are freely responsible of collection, analysis and interpretation of data.

Abbreviations

The following abbreviations are used in this manuscript:
CPCarprofen
CLDDistributional clearance
IAIntraarterial
NSAIDNon-steroidal anti-inflammatory drug

References

  1. Lees, P.; Aliabadi, F.S.; Landoni, M.F. Pharmacodynamics and Enantioselective Pharmacokinetics of Racemic Carprofen in the Horse. J. Vet. Pharmacol. Ther. 2002, 25, 433–448. [Google Scholar] [CrossRef] [PubMed]
  2. Lipscomb, V.; AliAbadi, F.; Lees, P.; Pead, M.; Muir, P. Clinical Efficacy and Pharmacokinetics of Carprofen in the Treatment of Dogs with Osteoarthritis. Vet. Rec. 2002, 22, 684–689. [Google Scholar] [CrossRef] [PubMed]
  3. Skjodt, N.; Davies, N. Clinical Pharmacokinetics and Pharmacodynamics of Bromfenac. Clin. Pharmacokinet. 1999, 36, 399–408. [Google Scholar] [CrossRef]
  4. Zhang, Z.; Huang, G. Intra-Articular Lornoxicam Loaded PLGA Microspheres: Enhanced Therapeutic Efficiency and Decreased Systemic Toxicity in the Treatment of Osteoarthritis. Drug Deliv. 2012, 19, 255–263. [Google Scholar] [CrossRef]
  5. Edwards, S.H.R. Intra-Articular Drug Delivery: The Challenge to Extend Drug Residence Time within the Joint. Vet. J. 2011, 190, 15–21. [Google Scholar] [CrossRef] [PubMed]
  6. Tunçay, M.; Çaliş, S.; Kaş, H.S.; Ercan, M.T.; Peksoy, I.; Hincal, A.A. Diclofenac Sodium Incorporated PLGA (50:50) Microspheres: Formulation Considerations and in Vitro/in Vivo Evaluation. Int. J. Pharm. 2000, 195, 179–188. [Google Scholar] [CrossRef]
  7. Weissig, V.; Pettinger, T.K.; Murdock, N. Nanopharmaceuticals (Part 1): Products on the Market. Int. J. Nanomed. 2014, 9, 4357–4373. [Google Scholar] [CrossRef]
  8. Jiang, D.; Zou, J.; Huang, L.; Shi, Q.; Zhu, X.; Wang, G.; Yang, H. Efficacy of Intra-Articular Injection of Celecoxib in a Rabbit Model of Osteoarthritis. Int. J. Mol. Sci. 2010, 11, 4106–4113. [Google Scholar] [CrossRef]
  9. Horisawa, E.; Kubota, K.; Tuboi, I.; Sato, K.; Yamamoto, H.; Takeuchi, H.; Kawashima, Y. Size-Dependency of DL-Lactide/Glycolide Copolymer Particulates for Intra-Articular Delivery System on Phagocytosis in Rat Synovium. Pharm. Res. 2002, 19, 132–139. [Google Scholar] [CrossRef]
  10. Horisawa, E.; Hirota, T.; Kawazoe, S.; Yamada, J.; Yamamoto, H.; Takeuchi, H.; Kawashima, Y. Prolonged Anti-Inflammatory Action of DL-Lactide/Glycolide Copolymer Nanospheres Containing Betamethasone Sodium Phosphate for an Intra-Articular Delivery System in Antigen-Induced Arthritic Rabbit. Pharm. Res. 2002, 19, 403–410. [Google Scholar] [CrossRef]
  11. Lentner, C. Geigy Scientific Tables, 8th ed.; Journal of the Royal Society of Medicine: Basel, Switzerland, 1981. [Google Scholar]
  12. Parton, K.; Balmer, T.V.; Boyle, J.; Whittem, T.; Machon, R. The Pharmacokinetics and Effects of Intravenously Administered Carprofen and Salicylate on Gastrointestinal Mucose and Selected Biochemical Measurements in Healthy Cats. J. Vet. Pharmacol. Ther. 2000, 23, 73–79. [Google Scholar] [CrossRef] [PubMed]
  13. Parra, A.; Clares, B.; Rosselló, A.; Garduño-Ramírez, M.L.; Abrego, G.; García, M.L.; Calpena, A.C. Ex Vivo Permeation of Carprofen from Nanoparticles: A Comprehensive Study through Human, Porcine and Bovine Skin as Anti-Inflammatory Agent. Int. J. Pharm. 2016, 501, 10–17. [Google Scholar] [CrossRef]
  14. Gibaldi, M.; Perrier, D. Farmacocinética; Reverté: Barcelona, Spain, 1982. [Google Scholar]
  15. Veng-Pedersen, P. Linear and Nonlinear System Approaches in Pharmacokinetics: How Much Do They Have to Offer? I General Considerations. J. Pharmacokinet. Biopharm. 1988, 16, 413–472. [Google Scholar] [CrossRef] [PubMed]
  16. Bauer, R. Nonmem Users Guide Introduction to Nonmem 7.2.0. J. Chem. Inf. Model. 2011, 53, 1689–1699. [Google Scholar]
  17. Hooker, A.C.; Staatz, C.E.; Karlsson, M.O. Conditional Weighted Residuals (CWRES): A Model Diagnostic for the FOCE Method. Pharm. Res. 2007, 24, 2187–2197. [Google Scholar] [CrossRef]
  18. Yamaoka, T.; Nakagawa, T.; Uno, T. Application of Akaike’s Information Criterion (AIC) in the Evaluation of Linear Pharmacokinetics Equations. J. Pharmacokinet. Biopharm. 1978, 6, 165–175. [Google Scholar] [CrossRef]
  19. Holford, N. The Visual Predictive Check Superiority to Standard Diagnostic (Rorschach) Plots. In Proceedings of the PAGE 2005, Pamplona, Spain, 16–17 June 2005; Population Approach Group Europe (PAGE): London, UK. [Google Scholar]
  20. Anderson, B.J.; Holford, N.H.G. Mechanism-Based Concepts of Size and Maturity in Pharmacokinetics. Annu. Rev. Pharmacol. Toxicol. 2008, 48, 303–332. [Google Scholar] [CrossRef]
  21. Anderson, B.J.; Holford, N.H.G. Mechanistic Basis of Using Body Size and Maturation to Predict Clearance in Humans. Drug Metab. Pharmacokinet. 2009, 24, 25–36. [Google Scholar] [CrossRef]
  22. Mahmood, I. Misconceptions and Issues Regarding Allometric Scaling during the Drug Development Process. Expert Opin. Drug Metab. Toxicol. 2018, 14, 843–854. [Google Scholar] [CrossRef]
  23. Bergstrand, M.; Hooker, A.C.; Wallin, J.E.; Karlsson, M.O. Prediction-Corrected Visual Predictive Checks for Diagnosing Nonlinear Mixed-Effects Models. AAPS J. 2011, 13, 143–151. [Google Scholar] [CrossRef]
  24. Messenger, K.M.; Wofford, J.A.; Papich, M.G. Carprofen Pharmacokinetics in Plasma and in Control and Inflamed Canine Tissue Fluid Using in vivo Ultrafiltration. J. Vet. Pharmacol. Ther. 2016, 39, 32–39. [Google Scholar] [CrossRef]
  25. Sidler, M.; Fouché, N.; Meth, I.; von Hahn, F.; von Rechenberg, B.; Kronen, P.W. Preliminary Study on Carprofen Concentration Measurements after Transcutaneous Treatment with Vetdrop® in a Microfracture Joint Defect Model in Sheep. BMC Vet. Res. 2014, 10, 268. [Google Scholar] [CrossRef]
  26. Hawkins, M.G.; Taylor, I.T.; Craigmill, A.L.; Tell, L.A. Enantioselective Pharmacokinetics of Racemic Carprofen in New Zealand White Rabbits. J. Vet. Pharmacol. Ther. 2008, 31, 423–430. [Google Scholar] [CrossRef]
  27. Taylor, P.M.; Delatour, P.; Landoni, F.M.; Deal, C.; Pickett, C.; Aliabadi, R.S.; Foot, P.; Lees, P. Pharmacodynamics and Enantioselective Pharmacokinetics of Carprofen in the Cat. Res. Vet. Sci. 1996, 60, 144–151. [Google Scholar] [CrossRef]
  28. Panaretto, B.A. Body Composition In Vivo. I. The Estimation of Total Body Water with Antipyrine and the Relation of Total Body Water to Total Body Fat in Rabbits. Aust. J. Agric. Res. 1963, 14, 594–601. [Google Scholar] [CrossRef]
  29. Crevoisier, C. Pharmacokinetic Properties of Carprofen in Humans. Eur. J. Rheumatol. Inflamm. 1982, 5, 492–502. [Google Scholar] [PubMed]
  30. Ray, J.E.; Wade, D. The Pharmacokinetics and Metabolism of 14C-Carprofen in Man. Biopharm. Drug Dispos. 1982, 3, 29–38. [Google Scholar] [CrossRef]
  31. Morille, M.; Van-Thanh, T.; Garric, X.; Cayon, J.; Coudane, J.; Noël, D.; Venier-Julienne, M.C.; Montero-Menei, C.N. New PLGA-P188-PLGA Matrix Enhances TGF-Β3 Release from Pharmacologically Active Microcarriers and Promotes Chondrogenesis of Mesenchymal Stem Cells. J. Control. Release 2013, 170, 99–110. [Google Scholar] [CrossRef]
  32. Miciletta, M.; Cuniberti, B.; Barbero, R.; Re, G. In Vitro Enantioselective Pharmacodynamics of Carprofen and Flunixin-Meglumine in Feedlot Cattle. J. Vet. Pharmacol. Ther. 2014, 37, 43–52. [Google Scholar] [CrossRef]
  33. Parra, A.; Mallandrich, M.; Clares, B.; Egea, M.A.; Espina, M.; García, M.L.; Calpena, A.C. Design and Elaboration of Freeze-Dried PLGA Nanoparticles for the Transcorneal Permeation of Carprofen: Ocular Anti-Inflammatory Applications. Colloids Surfaces B Biointerfaces 2015, 136, 935–943. [Google Scholar] [CrossRef]
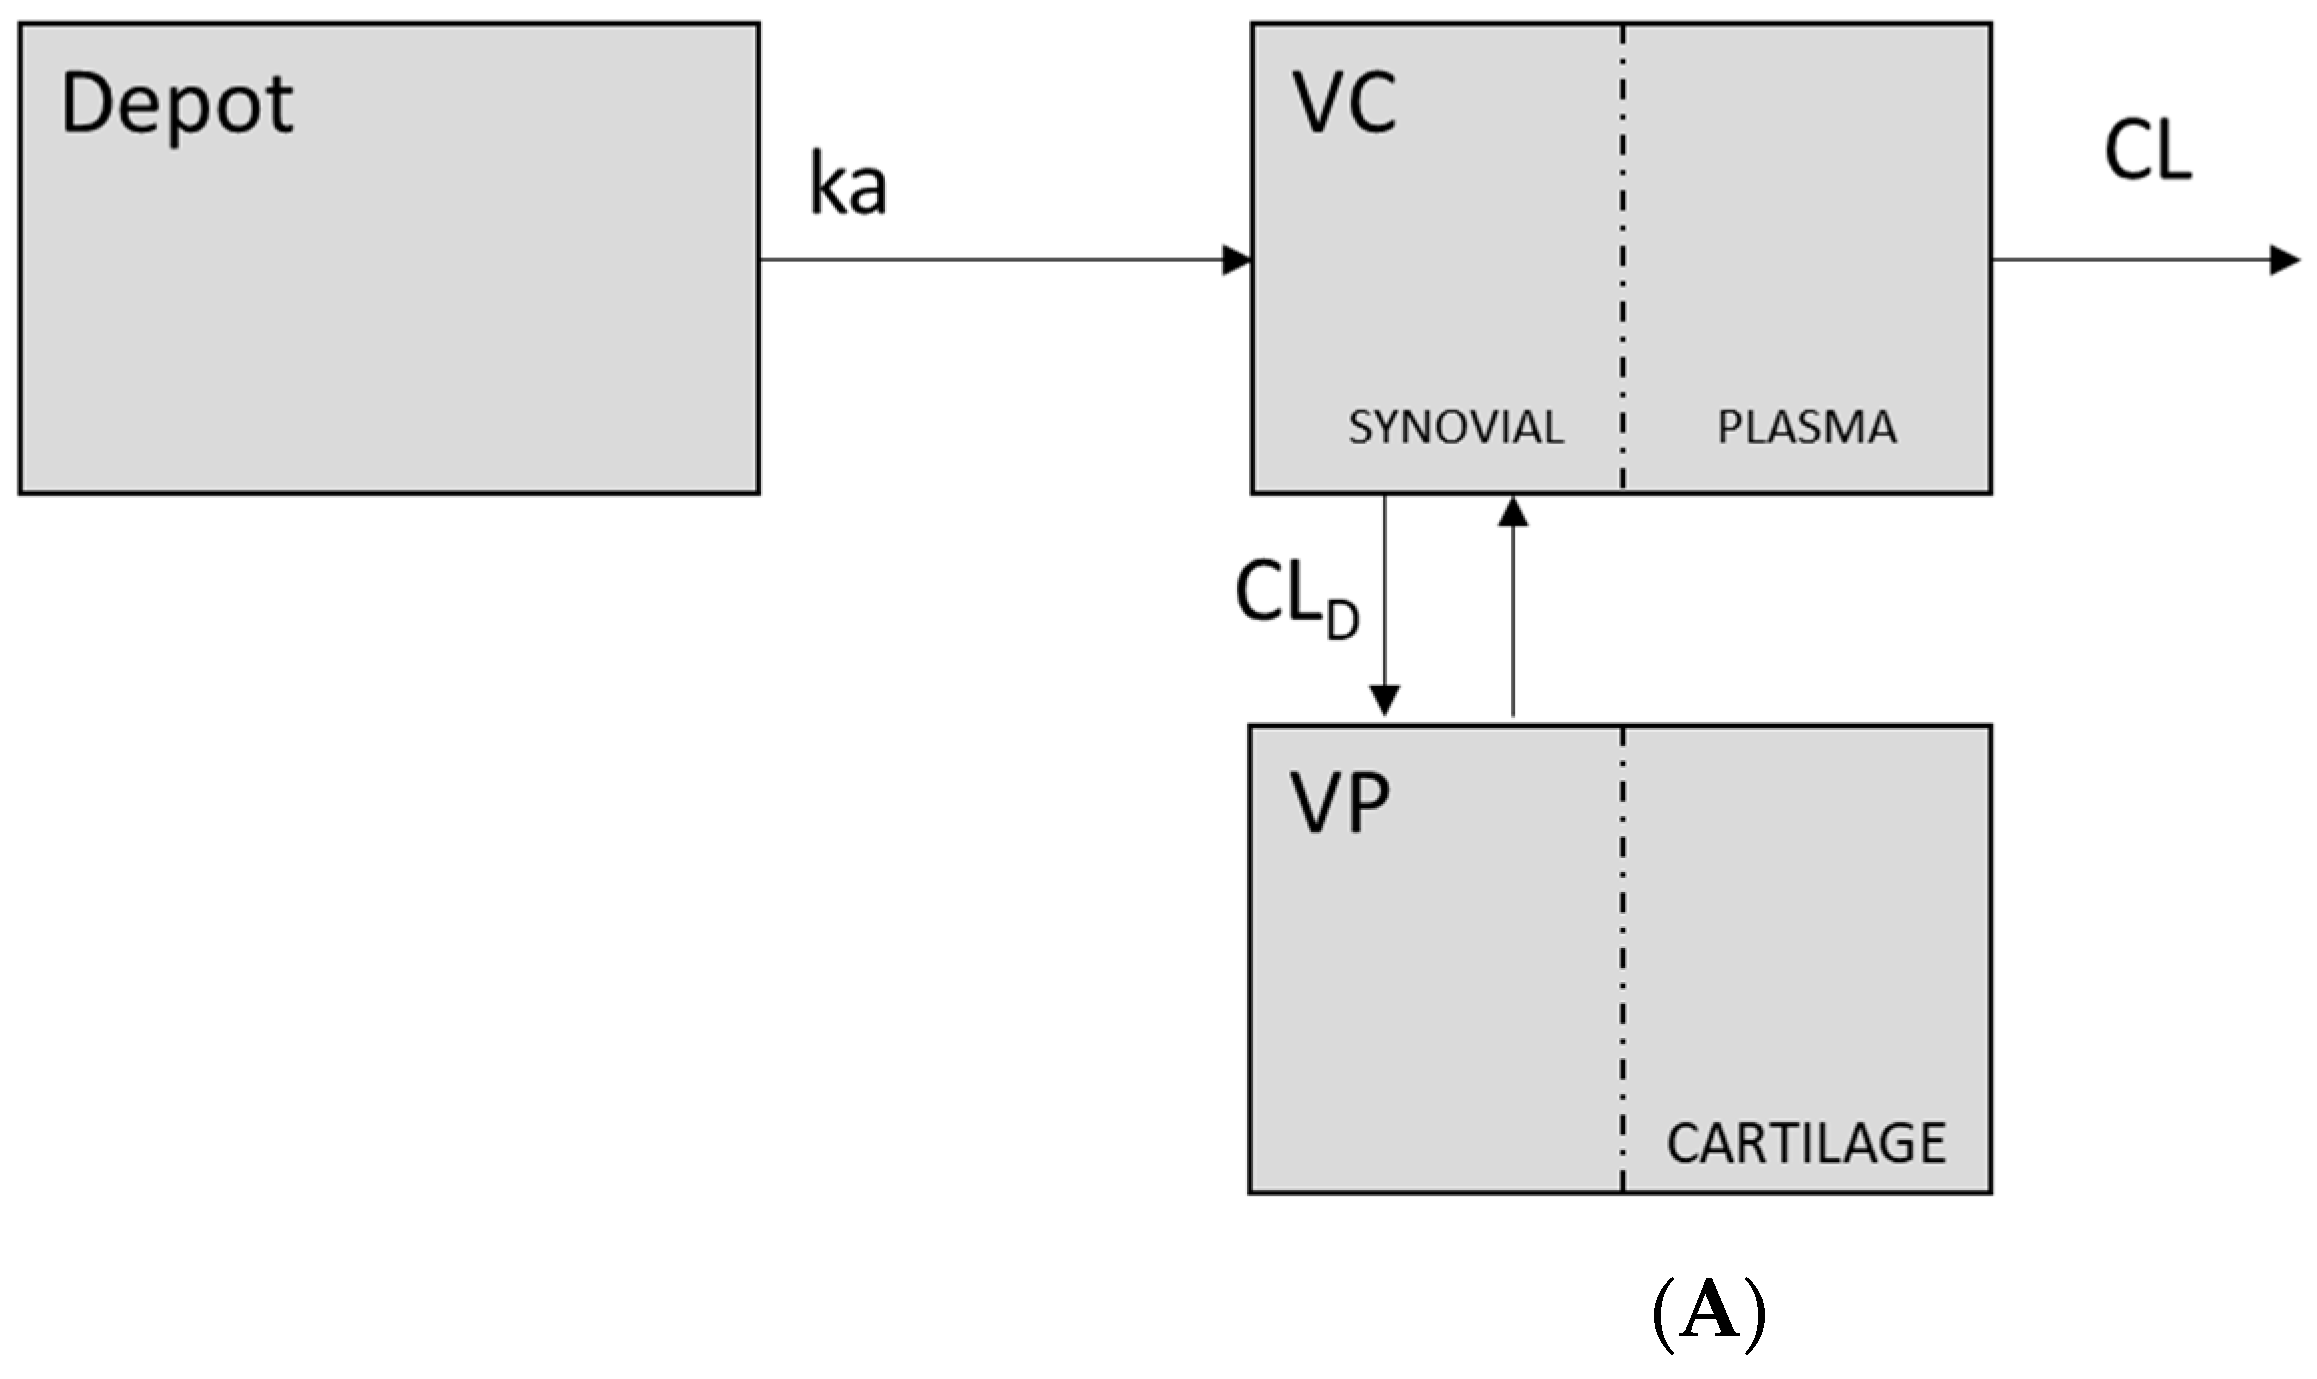
Figure 1. Schematic of the pharmacokinetic models fitted to carprofen (CP) concentrations achieved after IV and intraarticular administration (IA) administrations. (A) (top): One depot release/absorption models with first or zero order rate constants (ka). (B) (bottom): Two depots release/absorption models CL = plasma clearance; CLD = intercompartmental clearance between central and peripheral compartments; VC: central Distribution volume, VP: peripheral Distribution volume. KFR: first order initial rapid release rate constant; KSR: slow release rate constant. FFR: fraction of drug released during the initial fast phase; FSR: fraction of drug released during the slow phase; TlagSR: lag-time of the slow release phase.
Proceedings 78 00011 g001aProceedings 78 00011 g001b
Figure 2. Overlayed mean ± SD CP plasma concentration (mg/L) vs. time (hr) profiles observed following intravenous (solid line) and intra-articular (doted-line) administration at the doses of 4mg/kg and 1.98 mg, respectively in rabbits.
Proceedings 78 00011 g002
Figure 3. Predictive check of the pharmacokinetic model for CP after the IV and IA administrations. The visual predictive checks (VPCs) were constructed from the fixed and random estimates obtained from the final selected model. One thousand concentration–time profiles were simulated using Monte Carlo simulations after each administration route and their non -parametric 95% confidence intervals (the 2.5th and 97.5th percentiles) were calculated and represented together with the observed data for visual inspection.
Proceedings 78 00011 g003
Figure 4. Individual in vivo cumulate release/absorption (up) and input rate I(t) (down) profiles of CP from the assayed IA nanoformulation. These profiles were in agreement with in vivo release/absorption pattern described by the final model. This profile resulted to be different than that observed in the in vivo evaluation assay designed for this nanoformulation, which resulted very useful to optimize the conditions of in vitro evaluation.
Proceedings 78 00011 g004
Table 1. Tentative models for description of CP release/absorption from nanoparticles. Models are depicted in Figure 1A (models 1–2) and Figure 1B (models 3–6).
ModelKinetics of the Release/Absorption ProcessSequential vs. ParallelNumber of Depots
11st order absorption (ka)-one
2Zero order absorption (ka)-one
3Two 1st order absorption processes (kfr, ksr)Paralleltwo
41st order (kfr) and zero order absorption processes (ksr)Paralleltwo
51st order (kfr) and zero order absorption processes (ksr)Sequentialtwo
6Two 1st order absorption processes (kfr, ksr)Sequentialtwo
Table 2. Femoral cartilage (both condyles), synovial fluid, meniscus and plasma CP concentrations at 9 h after IA administration at the dose of 1.98 mg.
TissueConcentration (µg/g) *
Cartilage0.997
Meniscus0.099
Synovial fluid0.049
Plasma0.3
* Once the distribution equilibrium was reached, the highest concentrations occurred in cartilage followed by meniscus, plasma and then synovial fluid.
Table 3. Mean ± SD values of the main pharmacokinetic parameters estimated by the non-compartmental approach, after IV and IA administration of CP to rabbits at 4 mg/kg and 1.98 mg, respectively.
ParameterIntravenous AdministrationIntra-Articular Administration
λz (h−1)0.3565 ± 0.15460.1892 ± 0.0436
t1/2λz (h)2.16 ± 0.763.78 ± 0.78
AUC (mg/L)·h65.03 ± 20.906.73 ± 0.38
AUC/D 4.24 ± 1.363.40 ± 0.19
AUCextrap (%)4.18 ± 4.0628.29 ± 2.92
CL (L/h)0.2533 ± 0.0831-
Vi (L)0.2058 ± 0.0273-
Vss (L)0.4403 ± 0.0758-
Vdarea (L)0.7963 ± 0.414-
Cmax (mg/L)75.67 ± 12.401.84 ± 0.19
Cmax/D4.93 ± 0.810.93 ± 0.96
Tmax (h)-0.25 (0.08–0.5)
F (%)-94.48 ± 27.83
λz: apparent elimination rate constant; t1/2λz: elimination half life; AUC: area under the concentration vs. time curve; D: dose in mg/kg.; AUCextrap: percentage of extrapolated area; CL: plasma clearance; Vi: initial distribution volume; Vdarea: distribution volume associated to the terminal phase; Vss: distribution volume at steady-state; Cmax; peak concentrations; Tmax; time to peak concentration after IA administration (median and range); F: bioavailability after IA administration, estimated as the ratio of dose normalized AUC values after IA administration to dose normalized AUC values after IV administration. Peak concentrations after the intraarticular administration were rapidly achieved (median Tmax = 0.25 h). The higher apparent half-life after IA compared to IV, suggested a flip-flop phenomenon from nanoparticles, providing a slower release/absorption rate than elimination process.
Table 4. Mean (relative standard error (RSE%)) values of the disposition and absorption pharmacokinetic parameters estimated by the final model.
ParameterUnitsFinal Model
Parameter Estimate (RSE%)
Disposition parameters
CLL/h·70 kg2.00 (8.25)
VCL/70 kg3.60 (9.36)
CLDL/h·70 kg3.08 (4.90)
VPL/70 kg4.28 (14.21)
Release/Absorption parameters
F%51.4 (9.82)
KaFRh−17.38 (9.17)
KaSRh−10.0667 (15.59)
FFR%0.595 (1.20)
FSR%0.405
TlagSRh0.5 (0.11)
Inter-individual variability
IIVCL%19.21 (62.6)
Residual variability
Proportional%25.51 (29.34)
CL = plasma clearance; VC and VP = volumes of distribution for central and peripheral compartments; CLD = intercompartmental clearance between central and peripheral compartments; IIV and residual variability given as coefficient of variation (%). KaFR: initial rapid release rate constant; KaSR: slow release rate constant. F: Bioavailability; FFR: fraction of drug released during the initial faster phase; FSR: fraction of drug released during the slow phase; TlagSR: lag-time of the slow phase release. All final parameter estimates are shown with the relative standard error (RSE) indicated by italic numbers in parentheses, demonstrating an acceptable precision.
Publisher’s Note: MDPI stays neutral with regard to jurisdictional claims in published maps and institutional affiliations.