Proceeding Paper

Chromosome-Level Genome Assemblies: Expanded Capabilities for Conservation Biology Research †

1
Department of Biology, Saint Petersburg State University, 7/9 Universitetskaya Emb., 199034 St Petersburg, Russia
2
Leibniz Institute for Zoo and Wildlife Research (IZW), 17 Alfred Kowalke Straße, 10315 Berlin, Germany
3
The Center for Genome Architecture, Baylor College of Medicine, 1 Baylor Plaza, Houston, TX 77030, USA
4
Smithsonian-Mason School of Conservation, 1500 Remount Road, Front Royal, VA 22630, USA
5
Smithsonian Conservation Biology Institute, Center for Species Survival, National Zoological Park, 3001 Connecticut Ave NW, Washington, DC 20008, USA
6
Institute of Molecular and Cellular Biology SB RAS, 8/2 Acad. Lavrentiev Ave. 8/2, 630090 Novosibirsk, Russia
*
Author to whom correspondence should be addressed.
Presented at the First International Electronic Conference on Genes: Theoretical and Applied Genomics, 2–30 November 2020; Available online: https://iecge.sciforum.net/.
Proceedings 2021, 76(1), 10; https://doi.org/10.3390/IECGE-07149
Published: 2 November 2020

Abstract

:
Genome assemblies are becoming increasingly important for understanding genetic diversity in threatened species. However, due to limited budgets in the area of conservation biology, genome assemblies, when available, tend to be highly fragmented with tens of thousands of scaffolds. The recent advent of high throughput chromosome conformation capture (Hi-C) makes it possible to generate more contiguous assemblies containing scaffolds that are length of entire chromosomes. Such assemblies greatly facilitate analyses and visualization of genome-wide features. We compared genetic diversity in seven threatened species that had both draft genome assemblies and newer chromosome-level assemblies available. Chromosome-level assemblies allowed better estimation of genetic diversity, localization, and, especially, visualization of low heterozygosity regions in the genomes.

Published: 2 November 2020

1. Introduction

Conservation biology aims to maintain, protect, and restore biodiversity across genetic, species, and ecosystem levels, and thereby prevent extinction. One of the most important aspects of species conservation is genetic diversity, which is affected by demographic history and essential for ensuring adaptive potential. Reduction in sequencing costs have facilitated the estimation of genetic diversity in multiple species and their populations using whole genome resequencing approaches. However, analyses of whole genome resequencing data requires the generation of a reference genome assembly from either the same species or a closely related species. The current trend is to use chromosome-level assemblies, which offer a set of useful advantages. Conservation biology deals with a huge number of non-model species, but corresponding genomic studies usually have significantly smaller budgets than in biomedical or agricultural sciences, thereby resulting in a continuous trade off between quality of generated data and its cost. Recently, a USD 1,000 approach for generation of chromosome-level assemblies from one short-insert Illumina paired end library and an in situ high-throughput chromosome conformation capture (Hi-C) library was proposed [1], which might provide a temporary solution to this problem for the next several years. Here, we compared genetic diversity in seven threatened mammalian species for which previous highly fragmented scaffold assemblies and recently generated chromosome-level assemblies (including those generated by the USD 1000 approach) were available. We show that the newer, more contiguous assemblies allowed better estimation of genetic diversity, localization, and visualization of low heterozygosity regions in the genomes.

2. Methods

2.1. Quality Control and Filtration of the Data

Draft and chromosome-level assemblies of seven threatened species were downloaded from the NCBI Genome and DNA Zoo databases (Table 1) [1,2,3,4,5,6]. Raw short read libraries with the following IDs were obtained from the NCBI SRA (Sequence Read Archive): SRR2712398, SRR2712418, SRR2737521, SRR2737520, SRR2737519, SRR12437584, SRR5768052, SRR11431910, SRR11286173, SRR8588180, SRR12437584 [1,2,4,5,6,7,8]. Raw data quality control was performed using FastQC [9] and KrATER [10]. Adapter trimming and filtration by read quality was performed in two stages with initial kmer-based trimming of large adapter fragments using Cookiecutter [11] followed by additional small fragment trimming and quality filtration using Trimmomatic v0.36 [12].

2.2. Alignment and Variant Calling

Alignment of the filtered reads to the corresponding reference genome assemblies was performed using the Burrows-Wheeler Alignment tool [13]. Read duplicates were marked with Samtools package v1.9 [14]. Variant calling was performed using Bcftools v1.10 [15] with following parameters: “-d 250 -q 30 -Q 30 -adjust-MQ 50 -a AD, INFO/AD, ADF, INFO/ADF, ADR, INFO/ADR, DP, SP, SCR, INFO/SCR” for bcftools mpileup and “-m -v -f GQ, GP” for bcftools call. Low quality variants (‘QUAL < 20.0 || FORMAT/SP > 60.0 || FORMAT/DP < 5.0 || FORMAT/GQ < 20.0’) were removed using the bcftools filter.

2.3. Heterozygosity Visualization

Filtered genetic variants were split into single nucleotide polymorphism (SNP) and insertion-deletion (indel) categories. All subsequent analyses were based on SNPs only. Indels were not used due to the low quality calls of these from short reads. Counts of heterozygous SNPs were calculated in non-overlapping windows of 100 kbp and 1 Mbp and scaled to SNPs per kbp. Heatmaps and boxplots were drawn using custom scripts based on the Matplotlib 2 library [16].

3. Results and Discussion

3.1. Evaluation of Genome Assemblies

This study involved analysis of genomes from seven threatened species representing three different IUCN (International Union for Conservation of Nature) Red List categories (NT—Near threatened, VU—Vulnerable, EN—Endangered): sea otter (Enhydra lutris), cheetah (Acinonyx jubatus), clouded leopard (Neofelis nebulosa), giant otter (Pteronura brasiliensis), red panda (Ailurus fulgens), Asian small-clawed otter (Aonyx cinereus), and American bison (Bison bison) (Table 1). Each species was represented by two genome assemblies: the initial draft assembly and a chromosome-level assembly generated from the draft using Hi-C scaffolding. The draft assemblies were generated using different sequencing and assembly approaches, resulting in assemblies with differing contiguity and integrity. The scaffold N50 of the draft assemblies ranged from 0.10 Mbp for A. cinereus to 38.75 Mbp for E. lutris. Total gap lengths also varied considerably among the assemblies, from 1.4 Mbp in P. brasiliensis to 195.77 in B. bison. With Hi-C scaffolding, total gap length did not significantly increase in absolute values (maximum 14.15 Mbp were added in case of A. cinereus), and for E. lutris it even decreased, probably due to extensive correction of missassemblies preceding scaffolding stage. The chromosome-level assemblies included large-sized scaffolds that corresponded to the haploid chromosome number (1n) of the species along with a high number of smaller scaffolds. The difference in length between these categories differed by orders of magnitude (1–2 decimal orders). Chromosome-length scaffolds were ordered according to length, from longest to shortest, without assignment to species-specific karyotype. As included assemblies were generated from both male and female individuals, we excluded sex chromosomes from further analysis.

3.2. Heterozygosity Estimations and Visualization

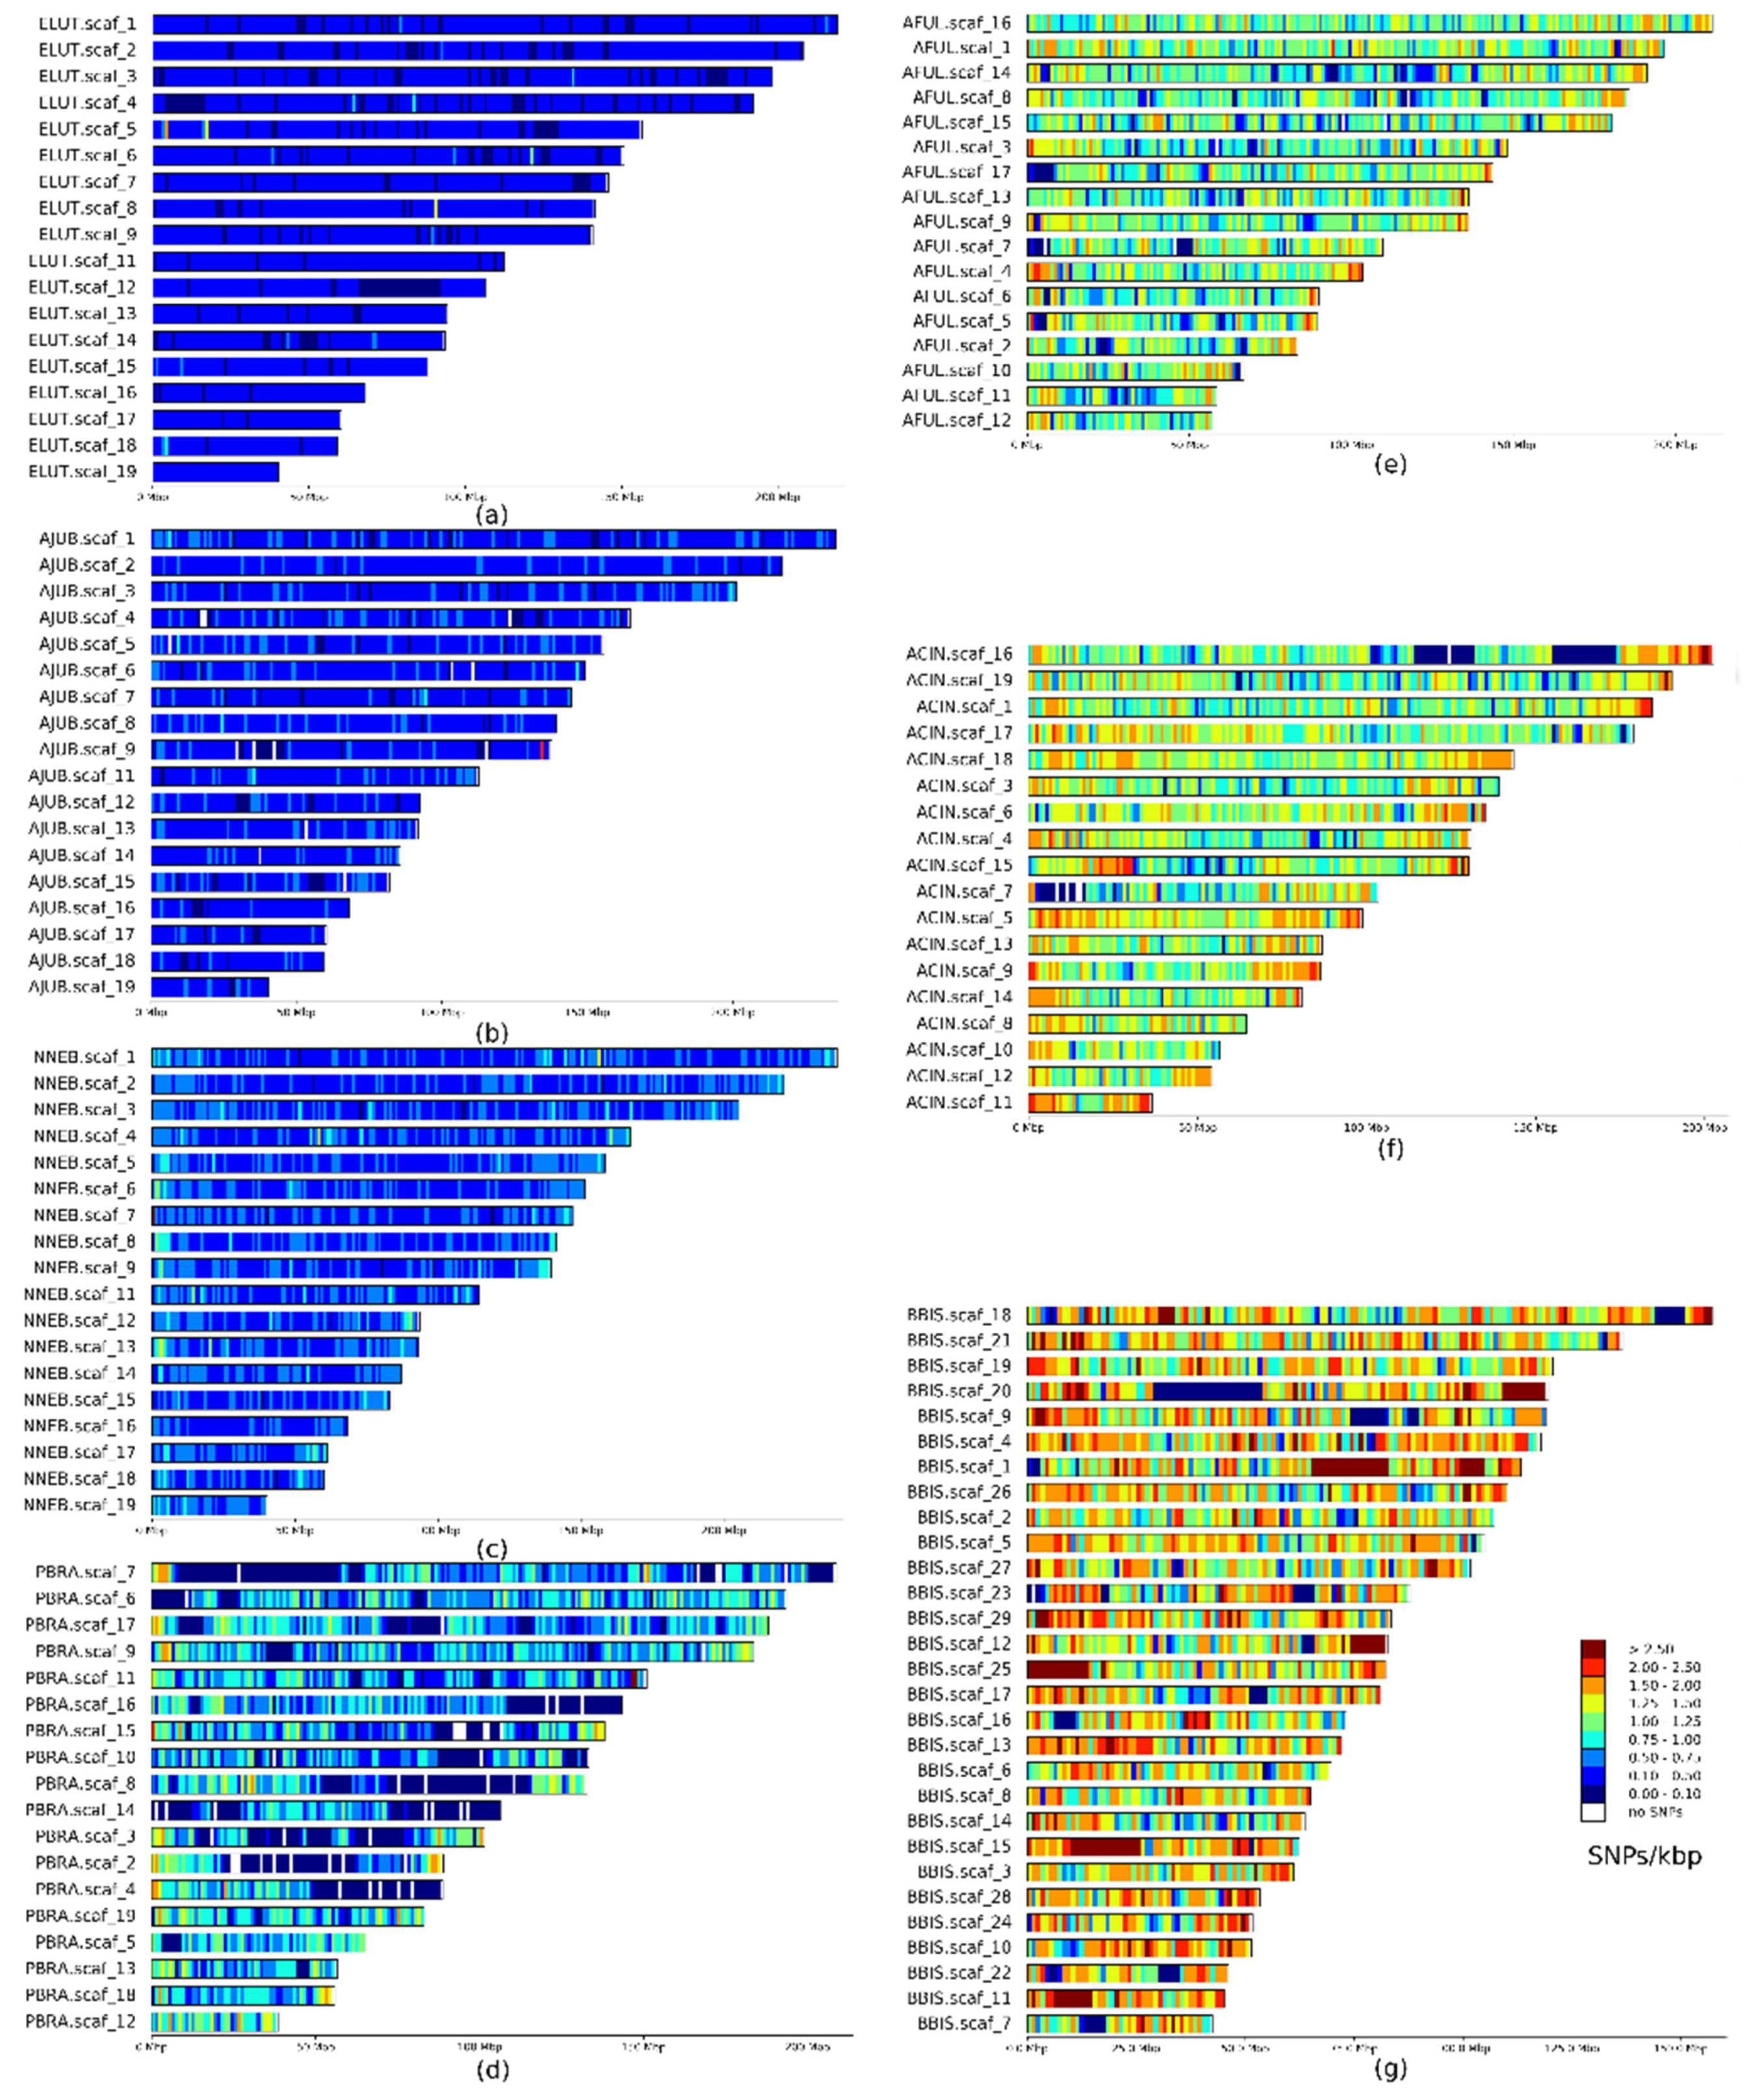
Genome-wide genetic diversity is usually estimated as heterozygosity – the proportion of sites that contain heterozygous single nucleotide variants across the genome. This yields a single numerical value but does not reveal how variant sites are distributed across the genome, which may be critical for identifying hotspots and cold spots of genetic diversity. A more informative way includes calculation of mean or median heterozygosity in overlapping windows of fixed size. The size of the window is a matter of choice depending on the integrity of the assembly and planned analysis and visualization, but commonly used sizes fall in the 50 to 5000 kbp range. A significant part of the genome must be presented in windows to make heterozygosity estimates reliable. Among the studied species, P. brasiliensis and A. cinereus with N50 of 0.17 and 0.1 Mbp, respectively, (Table 1) had the most fragmented draft assemblies, which significantly affected the number of 1 Mbp and even 100 kbp windows (Table 2) and the assessment of heterozygosity distribution (Figure 1). At the lower boundary, window size is limited by the number of heterozygous SNPs present in the most of windows, thereby limiting the number of windows that could be used for heterozygosity estimation and visualization. In the case of mammalian genomes with a typical size of 2.5–3.0 Gbp, the number of 100 kbp windows exceeds >200,000 for assemblies of high contiguity. For a window size of 1 Mbp, the number of windows used is 10-fold less, which allows for easy visualization of SNP density and heterozygosity on chromosomal scaffolds (Figure 2). Such plots are impossible for draft assemblies due to the high number of scaffolds. However, we note that variant counts between draft and chromosome-level assemblies are similar.
The species we analyzed include those well known for extremely low levels of heterozygosity such as the sea otter (Figure 2a) and cheetah (Figure 2b) and species with higher genetic diversity but considered to be threatened too: American bison, Asian small-clawed otter, and red panda (Figure 2e–g). Despite significant differences in mean heterozygosity (Figure 1) all genomes showed regions with very low diversity (blue and dark blue regions on Figure 2). The most striking difference in heterozygosity between different regions of the genome was found in the giant otter. Having ~2.5 times higher mean heterozygosity, the giant otter assembly showed long homozygous stretches (dark blue on Figure 2d) on more than half its chromosomes.

4. Conclusions

Chromosome-level genome assemblies provide a more informative way to directly visualize genome-wide genetic diversity. Such assemblies could be generated using various sequencing technologies (long-read and short read) but because of the limited budgets of many researchers, short read drafts followed by Hi-C scaffolding offers a relatively inexpensive approach for many species of conservation concern in the near future.

Funding

The reported study was funded by the Russian Foundation for Basic Research, project number 20-04-00808.

Institutional Review Board Statement

Not applicable.

Informed Consent Statement

Not applicable.

Data Availability Statement

Data sharing not applicable.

References

  1. Dudchenko, O.; Shamim, M.S.; Batra, S.S.; Durand, N.C.; Musial, N.T.; Mostofa, R.; Pham, M.; Glenn St Hilaire, B.; Yao, W.; Stamenova, E.; et al. The Juicebox Assembly Tools module facilitates de novo assembly of mammalian genomes with chromosome-length scaffolds for under $1000. bioRxiv 2018. [Google Scholar] [CrossRef]
  2. Dobrynin, P.; Liu, S.; Tamazian, G.; Xiong, Z.; Yurchenko, A.A.; Krasheninnikova, K.; Kliver, S.; Schmidt-Küntzel, A.; Koepfli, K.-P.; Johnson, W.; et al. Genomic legacy of the African cheetah, Acinonyx jubatus. Genome Biol. 2015, 16, 277. [Google Scholar] [CrossRef]
  3. Dobson, L.K. Sequencing the Genome of the North American Bison. Ph.D. Thesis, Texas A&M University, College Station, TX, USA, 2015. [Google Scholar]
  4. Hu, Y.; Wu, Q.; Ma, S.; Ma, T.; Shan, L.; Wang, X.; Nie, Y.; Ning, Z.; Yan, L.; Xiu, Y.; et al. Comparative genomics reveals convergent evolution between the bamboo-eating giant and red pandas. Proc. Natl. Acad. Sci. USA 2017, 114, 1081–1086. [Google Scholar] [CrossRef] [PubMed]
  5. Jones, S.J.; Haulena, M.; Taylor, G.A.; Chan, S.; Bilobram, S.; Warren, R.L.; Hammond, S.A.; Mungall, K.L.; Choo, C.; Kirk, H.; et al. The Genome of the Northern Sea Otter (Enhydra lutris kenyoni). Genes 2017, 8, 379. [Google Scholar] [CrossRef] [PubMed]
  6. de Manuel, M.; Barnett, R.; Sandoval-Velasco, M.; Yamaguchi, N.; Garrett Vieira, F.; Zepeda Mendoza, M.L.; Liu, S.; Martin, M.D.; Sinding, M.-H.S.; Mak, S.S.T.; et al. The evolutionary history of extinct and living lions. Proc. Natl. Acad. Sci. USA 2020, 117, 10927–10934. [Google Scholar] [CrossRef] [PubMed]
  7. Beichman, A.C.; Koepfli, K.-P.; Li, G.; Murphy, W.; Dobrynin, P.; Kliver, S.; Tinker, M.T.; Murray, M.J.; Johnson, J.; Lindblad-Toh, K.; et al. Aquatic Adaptation and Depleted Diversity: A Deep Dive into the Genomes of the Sea Otter and Giant Otter. Mol. Biol. Evol. 2019, msz101. [Google Scholar] [CrossRef] [PubMed]
  8. Hoff, J.L.; Decker, J.E.; Schnabel, R.D.; Taylor, J.F. Candidate lethal haplotypes and causal mutations in Angus cattle. BMC Genom. 2017, 18, 799. [Google Scholar] [CrossRef] [PubMed]
  9. Andrews, S. FastQC: A Quality Control Tool for High Throughput Sequence Data; Babraham Bioinformatics, Babraham Institute: Cambridge, UK, 2010. [Google Scholar]
  10. Kliver, S. KrATER: K-mer Analysis Tool Easy to Run. 2017. Available online: https://github.com/mahajrod/KrATER (accessed on 10 September 2020).
  11. Starostina, E.; Tamazian, G.; Dobrynin, P.; O’Brien, S.; Komissarov, A. Cookiecutter: A tool for kmer-based read filtering and extraction. Bioinformatics 2015. [CrossRef]
  12. Bolger, A.M.; Lohse, M.; Usadel, B. Trimmomatic: A flexible trimmer for Illumina sequence data. Bioinformatics 2014, 30, 2114–2120. [Google Scholar] [CrossRef] [PubMed]
  13. Li, H.; Durbin, R. Fast and accurate short read alignment with Burrows-Wheeler transform. Bioinformatics 2009, 25, 1754–1760. [Google Scholar] [CrossRef] [PubMed]
  14. Li, H.; Handsaker, B.; Wysoker, A.; Fennell, T.; Ruan, J.; Homer, N.; Marth, G.; Abecasis, G.; Durbin, R. 1000 Genome Project Data Processing Subgroup. The Sequence Alignment/Map format and SAMtools. Bioinforma. Oxf. Engl. 2009, 25, 2078–2079. [Google Scholar] [CrossRef] [PubMed]
  15. Li, H. A statistical framework for SNP calling, mutation discovery, association mapping and population genetical parameter estimation from sequencing data. Bioinformatics 2011, 27, 2987–2993. [Google Scholar] [CrossRef] [PubMed]
  16. Hunter, J.D. Matplotlib: A 2D Graphics Environment. Comput. Sci. Eng. 2007, 9, 90–95. [Google Scholar] [CrossRef]
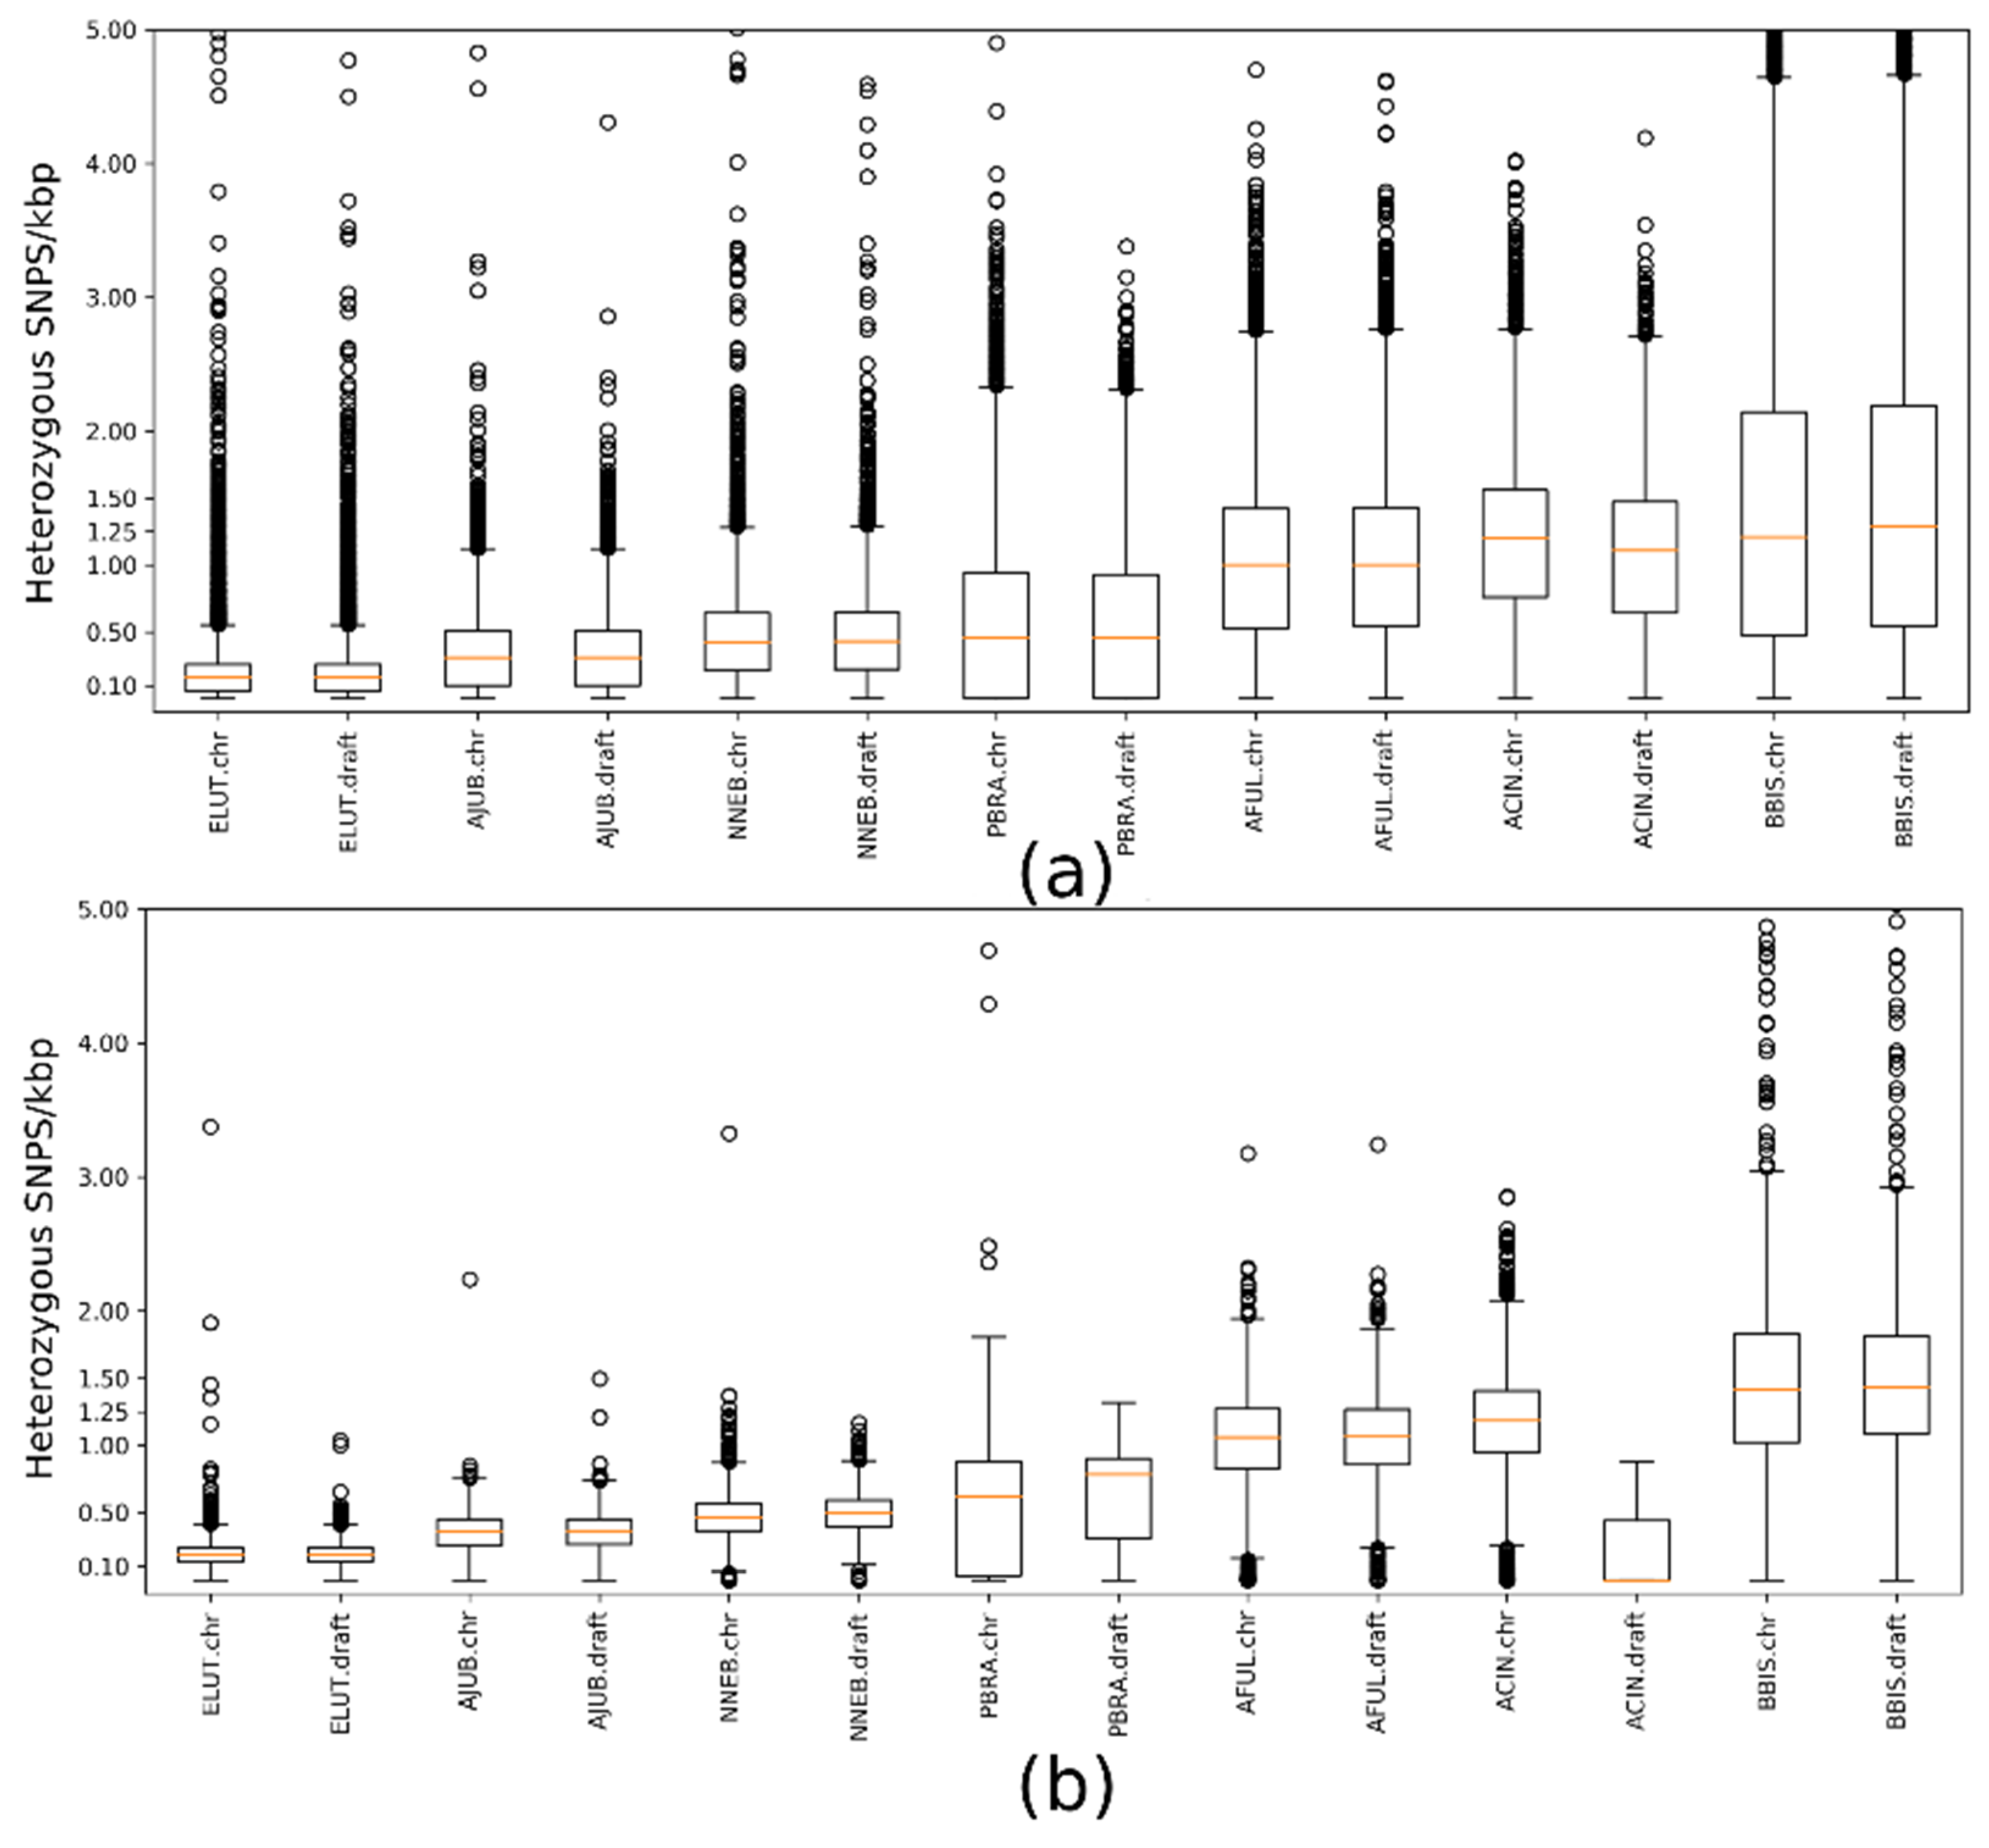
Figure 1. Comparison of distribution of mean heterozygosity in windows of 100 kb (a) and 1 Mbp (b) for draft and chromosome level assemblies.
Proceedings 76 00010 g001
Figure 2. Heatmaps of heterozygous SNP densities for analyzed species based on chromosome-level assemblies (sex chromosomes were excluded). Heterozygous SNPs were counted in 1 Mbp windows and scaled to SNP/kbp. (a)—sea otter, (b)—cheetah, (c)—clouded leopard, (d)—giant otter, (e)—red panda, (f)—Asian small-clawed otter, (g)—American bison.
Proceedings 76 00010 g002
Table 1. Mammalian species and corresponding genome assemblies used in this study.
Latin NameIUCN Red List Category 1Common NameAssembly Source or IDAssembly Type 2Length, GbpNs, MbpN50, Mbp
Enhydra lutrisENSea otterDNA ZooChr2.4528.94145.94
GCA_002288905.2Draft2.4629.6838.75
Acinonyx jubatusVUCheetahDNA ZooChr2.3742.86144.64
GCA_001443585.1Draft2.3742.063.12
Neofelis nebulosaVUClouded leopardDNA ZooChr2.427.94147.11
DNAzoo draftDraft2.415.891.38
Pteronura brasiliensisENGiant otterDNA ZooChr2.4611.89133.38
DNAzoo draftDraft2.451.400.17
Ailurus fulgensENRed pandaDNA ZooChr2.3434.41143.80
GCA_002007465.1Draft2.3434.042.98
Aonyx cinereusVUAsian small-clawed otterDNA ZooChr2.4415.50130.94
DNAzoo draftDraft2.421.350.10
Bison bisonNTAmerican bisonDNA ZooChr2.83199.31101.69
GCF_000754665.1Draft2.83195.777.19
1 EN—Endangered, VU—Vulnerable, NT—Near threatened. 2 Assembly types: Draft—initial fragmented scaffold assembly, Chr—chromosome-level assembly based on the Draft.
Table 2. Counts of single nucleotide polymorphisms (SNPs) and windows for draft and chromosome-level assemblies of the analyzed genomes. Two species with the lowest window counts are in bold.
SpeciesNumber of SNPsNumber of 100 kbp Windows Number of 1 Mbp Windows
DraftChrDraftChrDraftChr
Enhydra lutris648,954648,01724,14624,16523372396
Acinonyx jubatus1,147,7941,147,40922,86123,60917572350
Neofelis nebulosa1,449,4901,449,36522,00423,93111942387
Pteronura brasiliensis2,362,7252,362,12613,58922,819322262
Ailurus fulgens2,779,5012,779,13322,08323,13915732298
Aonyx cinereus3,233,8773,233,911977722,18332204
Bison bison6,515,1756,515,06824,28626,21321812604
Publisher’s Note: MDPI stays neutral with regard to jurisdictional claims in published maps and institutional affiliations.