Proceeding Paper

Fat Fraction Qualitative Characteristics for Oat-Based Products †

by
Agata Górska
*,
Rita Brzezińska
,
Klaudia Chojnacka
,
Joanna Bryś
,
Ewa Ostrowska-Ligęza
,
Magdalena Wirkowska-Wojdyła
and
Karolina Dolatowska-Żebrowska
Department of Chemistry, Institute of Food Sciences, Warsaw University of Life Sciences (WULS-SGGW), 02-776 Warsaw, Poland
*
Author to whom correspondence should be addressed.
Presented at the 1st International Electronic Conference on Food Science and Functional Foods, 10–25 November 2020; Available online: https://foods_2020.sciforum.net/.
Proceedings 2021, 70(1), 93; https://doi.org/10.3390/foods_2020-07707
Published: 10 November 2020

Abstract

:
Oat-based products are characterized by high fat content with a favorable fatty acid composition. It is of great importance to control the quality of fat fraction as an important indicator of food product safety. The aim of this study was to analyze fat isolated from whole grain oatmeal, mountain oatmeal, and instant oatmeal. We determined the composition of fatty acids and the distribution of fatty acids in triacylglycerol positions using gas chromatography. The oxidative stability of the tested fat was evaluated using pressure differential scanning calorimetry. Melting profiles were determined by differential scanning calorimetry. It was found that fat isolated from oat products is a rich source of unsaturated fatty acids. In the sn-2 position of triacylglycerols, the highest share of oleic acid was found. The fat was characterized by the highest proportion of linoleic acid in the sn-1,3 positions of the triacylglycerols. It was observed that the induction time of oxidation process of fat reached the values of 28.79 min–39.07 min in a test conducted at 120 °C and 5.84 min–7.37 min at 140 °C. The analyzed melting profiles showed the presence of peaks indicating the presence of low-melting triacylglycerols containing mainly unsaturated fatty acids.

1. Introduction

Cereal products are an important part of the human diet. Oatmeal products are often chosen by people leading a healthy lifestyle for their health-promoting properties [1,2,3]. The chemical composition and health-promoting nutrients of oats contribute to the increasing use of this grain in food production [4]. Oats and products made from oats are characterized by a higher content of fat with a favorable fatty acid composition compared to other cereals. They contain essential fatty acids not synthesized in the human body and should be supplied with food. Fat in products containing large amounts of this ingredient and in products characterized by a low level of lipids undergoes many changes in natural conditions and during technological processes. These transformations can be considered as desired or undesirable. The first have many modifications, whereas the second causes unfavorable changes in fats, which worsen the product’s nutritional value. These transformations include hydrolysis and autooxidation. Hydrolysis of fats is associated with the breakdown of ester bonds in triacylglycerol molecules under the influence of water. This process leads to the formation of diacylglycerols, monoacylglycerols, and free fatty acids, as well as glycerol in extreme cases. The acids released as a result of hydrolysis may undergo further secondary changes of an oxidative nature. This seems to be an important problem and should be monitored, as such processes often limit or even prevent the use and further storage of food products. Taking the above into consideration, the purpose of the study was to find the qualitative characteristics of fat fraction isolated from oat products, such as whole grain oatmeal, mountain oatmeal, and instant oatmeal.

2. Materials and Methods

2.1. Materials

The research material consisted of fat samples isolated from oat-based products, such as whole grain oatmeal, mountain oatmeal, and instant oatmeal, which were purchased at a local store. The studied oat products did not contain any additional ingredients and were within the expiry date. The best before date was 25 November 2020 in the case of whole grain oatmeal; 15 December 2020 in the case of mountain oatmeal; and 2 January 2021 in the case of instant oatmeal.

2.2. Methods

2.2.1. Extraction of Fat from Oat-based Products

Fat was extracted from silver skin, according to the procedure described by Reder et al. [5]. The samples were ground and extracted with hexane after 30 min of shaking. Then, the mixture was filtered and dried with magnesium sulfate. After filtering off the drying agent, the solvent was removed by the rotary evaporator at 40 °C. The sample was additionally dried under nitrogen atmosphere to remove residual hexane.

2.2.2. Gas Chromatography

Gas chromatography was used to determine the composition of fatty acids in fat samples. Fatty acids were converted into volatile methyl esters using a methanolic potassium hydroxide (KOH) solution according to PN-EN ISO 5509:2001. We used a YL6100 gas chromatograph (GC) apparatus, equipped with a flame ionization detector and a 30 m long BPX 70 capillary column filled with stationary phase, with an inner diameter of 0.22 mm and a film thickness of 0.25 μm. The carrier gas was nitrogen. Fatty acids were identified based on the retention time compared to the standard. For the quantitative analysis of fatty acids, the area of the peak in the chromatogram was determined and the percentage of a given fatty acid was calculated.

2.2.3. Enzymatic Hydrolysis of Triacylglycerols

The sample of fat was mixed with 1 cm3 of (Tris(Hydroxymethyl)aminomethane hydrochloride TRIS-HCl solution with a concentration of 1 mol/dm3 and pH = 8; 0.1 cm3 CaCl2; and 0.25 cm3 aqueous solution of bile salts (0.05%). After 30 s of mixing, 20 mg of pancreatic lipase was added. The samples were placed in a water bath for 3 min at 40 °C. After incubation, the reaction was stopped after adding 1 mL of 6 M hydrochloric acid and 4 mL of diethyl ether. The products were separated by preparative thin layer chromatography. The isolated sn-2 monoacylglycerols were removed from the plate with silica gel. The fatty acid composition of the sn-2 monoacylglycerol molecules was determined using gas chromatography, according to the procedure described above for fatty acids composition.

2.2.4. Pressure Differential Scanning Calorimetry (PDSC)

PDSC experiments were carried out using a DSC Q20 TA Instruments. Fat samples of 3–4 mg were weighed in an aluminum pan and placed in the sample chamber under oxygen atmosphere with an initial pressure of 1400 kPa. The maximum PDSC oxidation time (induction time) was determined based on the maximum rate of oxidation (maximum rate of heat flow). The isothermal temperature for each sample was 120 °C and 140 °C.

2.2.5. Differential Scanning Calorimetry

DSC measurements of melting characteristics were carried out with a Q200 DSC (TA Instruments, New Castle, DE, USA). Samples of 3–4 mg were placed into aluminum pans with a lid and were non-hermetically sealed. An empty sealed aluminum pan was used as a reference and the experiments were performed under a nitrogen flow rate of 50 mL/min at normal pressure. Melted samples were heated to 80 °C and held for 10 min, then cooled to −80 °C at 10 °C/min and maintained at −80 °C for 30 min. Then, the melting profiles were obtained by heating the samples to 80 °C at a heating rate of 15 °C/min. The temperature measurements were performed using the functions of the Universal Analysis Software (TA Instruments).

2.2.6. Statistical Analysis

Each measurement was in triplicate. The data were reported at the means ± standard deviation. One-way ANOVA was conducted using Statgraphics Plus for Windows program, version 4.1. (Statistical Graphics Corporation, Warrenton, VA, USA). Differences were considered to be significant at a p-value of 0.05, according to Tukey’s multiple range test.

3. Results

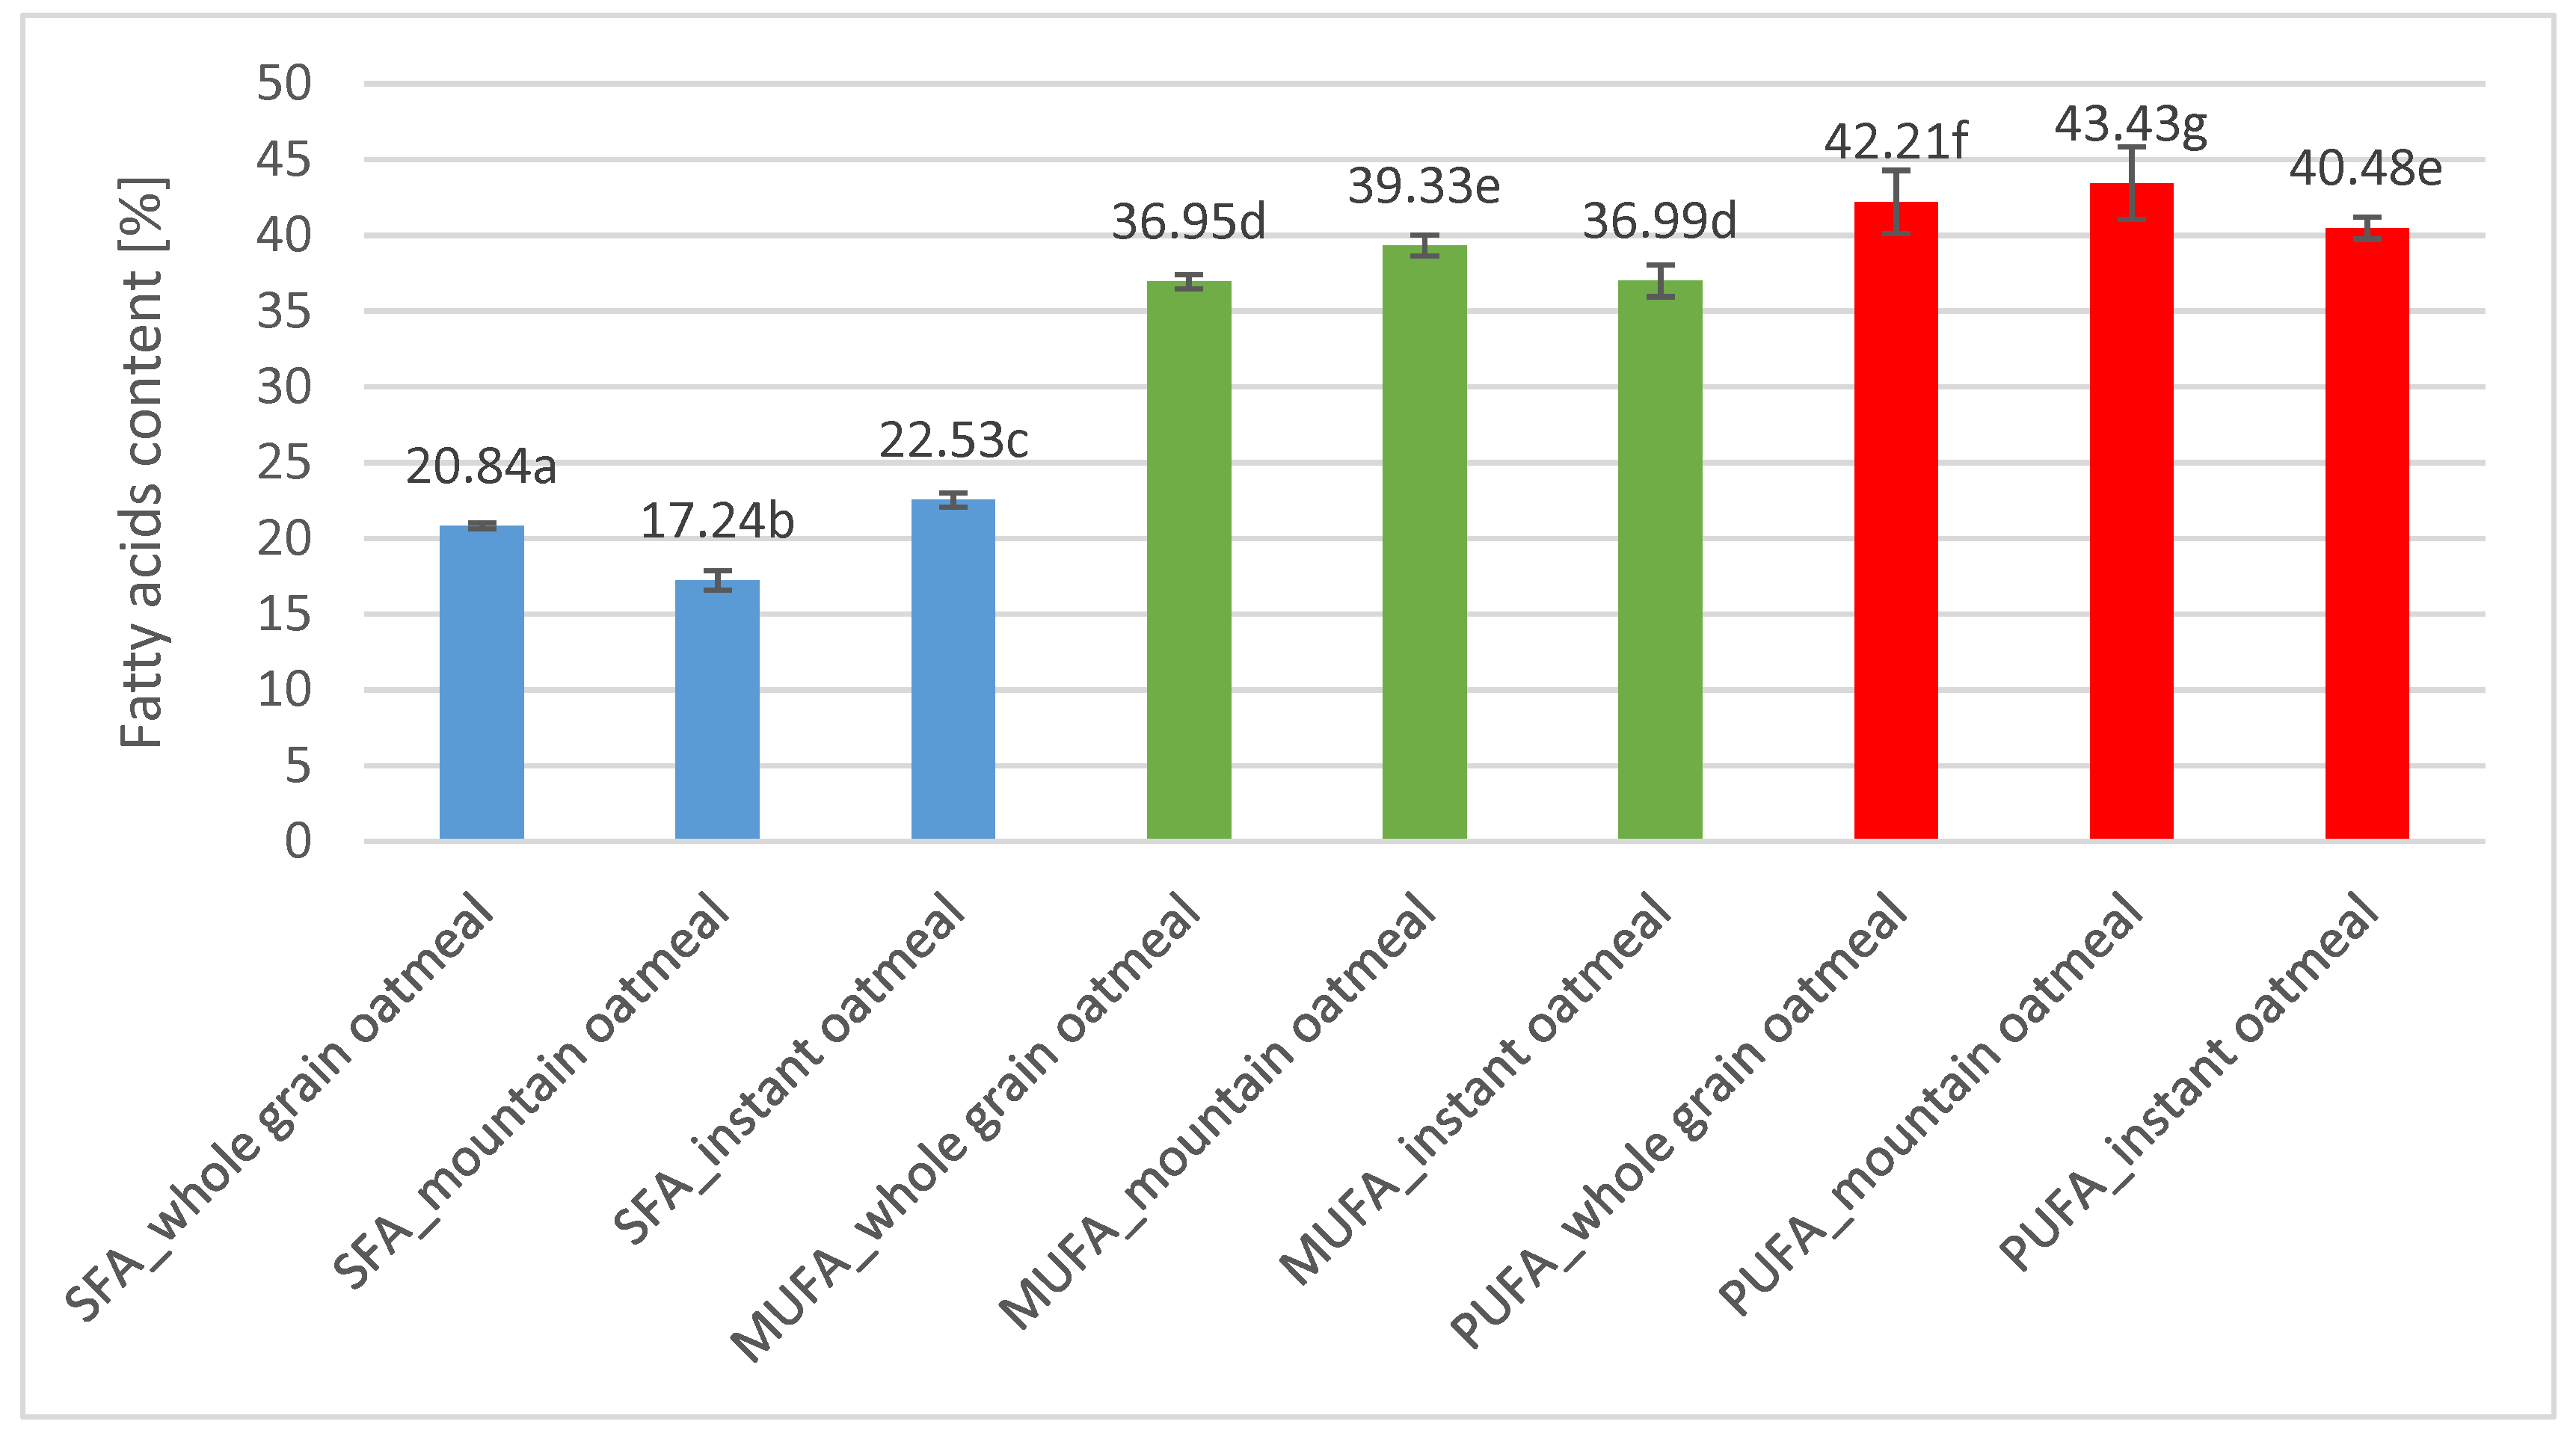
3.1. Fatty Acids Composition and Distribution in Triacylglycerols

The results shown in Figure 1 present the content of saturated, mono-, and polyunsaturated fatty acids. Fat isolated from mountain oatmeal turned out to be the richest source of unsaturated fatty acids (82.76%) with high content of mono- and polyunsaturated fatty acids. In fat extracted from instant oatmeal the highest content of saturated fatty acids (22.53%) was determined in comparison to other studied samples. The fat was also characterized by the lowest content of unsaturated fatty acids.
Table 1, Table 2 and Table 3 present the composition of chosen fatty acids in triacylglycerols (TAG) and their distribution in sn-2 and sn-1,3 positions of triacylglycerols in fat extracted from whole grain oatmeal, mountain oatmeal, and instant oatmeal.
Table 1 presents the composition of selected fatty acids in internal and external positions of triacylglycerol structure of fat isolated from whole grain oatmeal. Oleic acid (C 18:1 n-9) is the most abundant fatty acid in the sn-2 position with a share in this position enriching to 46.12%. Palmitic acid (C 16:0) was in a dominant amount of external positions. It is worth mentioning that the share of palmitic acid (C 16:0) in sn-2 position was the lowest, i.e., 6.30%.
Similar results were obtained in the case of fat isolated from mountain oatmeal, which is shown in Table 2. Oleic acid (C 18:1 n-9) is the most abundant fatty acid in sn-2 position with the highest share in this position at a level of 42.83%. Based on the results, it can be stated that linoleic acid (C 18:2 n-6) dominated in external positions. Stearic acid (C 18:0) was found at the lowest content in sn-2 position, but it should be noted that palmitic acid (C 16:00) is the fatty acid with the lowest share in the internal position.
In the case of fat isolated from instant oatmeal the obtained results presented in Table 3 demonstrated that oleic acid (C 18:1 n-9), similarly to previously presented results, dominated in sn-2 position with a highest share of 45.41% in this position. Stearic acid (C 18:0) was detected at the lowest level in sn-2 position, whereas in the case of palmitic acid (C 16:00) the lowest share in internal position was defined.

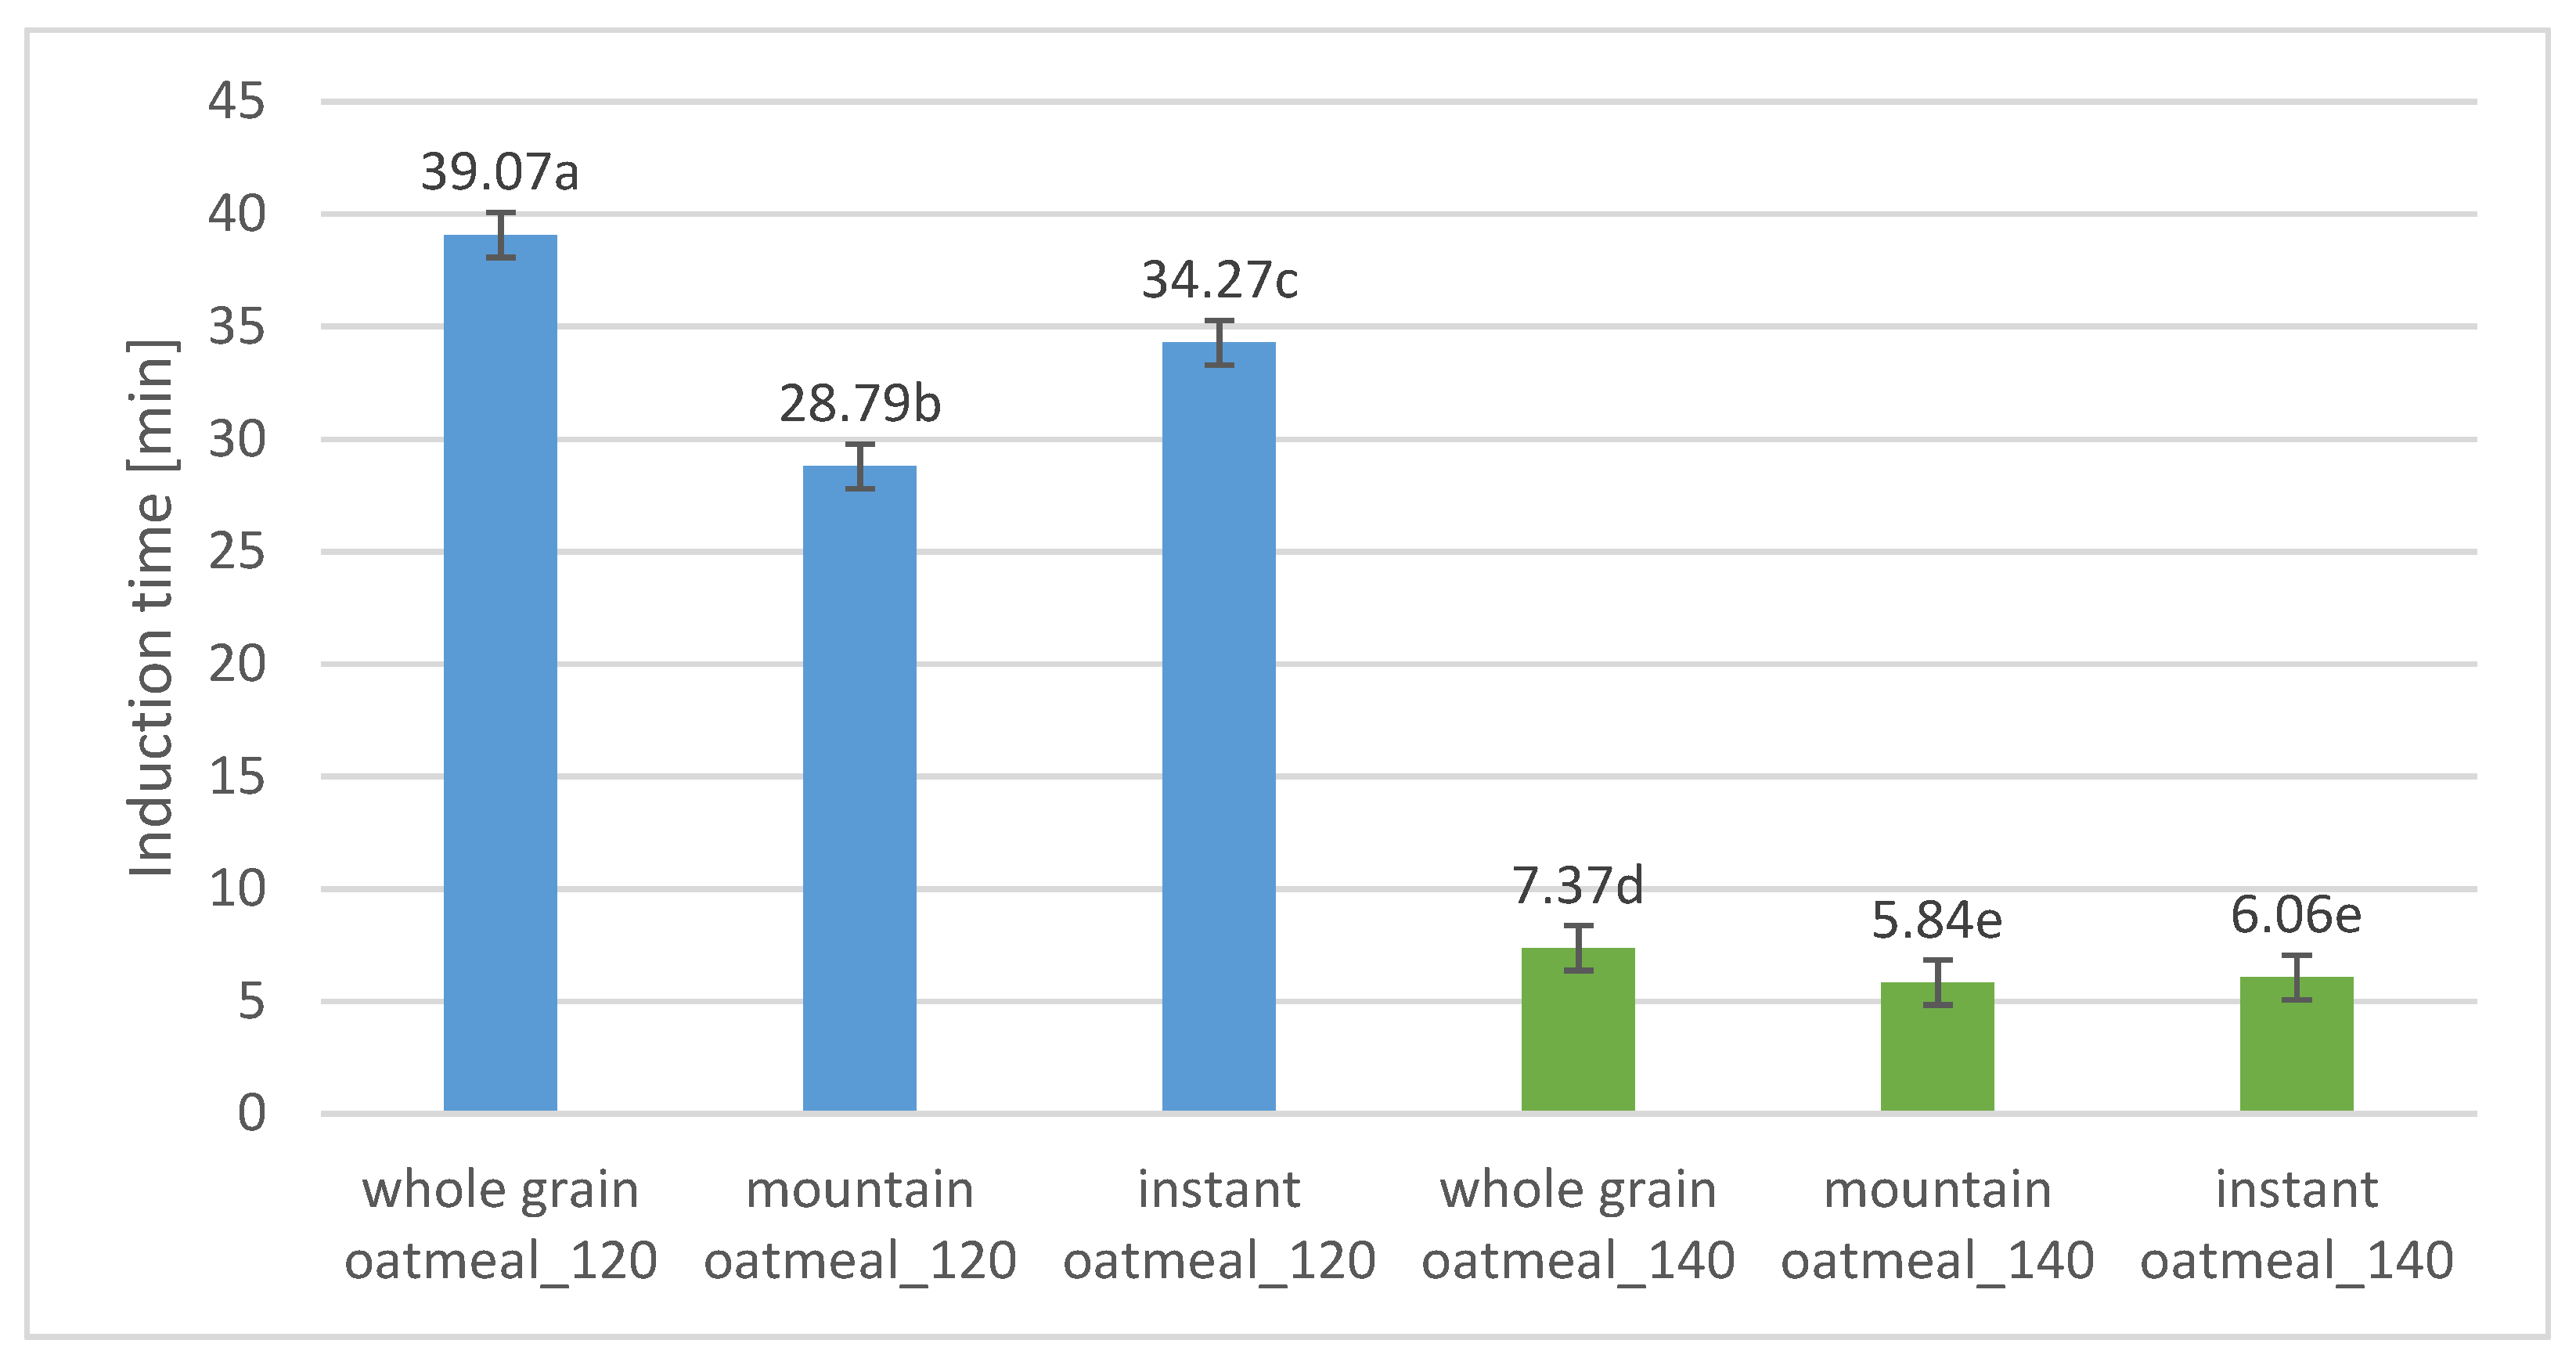
3.2. Oxidative Stability of Fats

The induction time of fat oxidation is presented in Figure 2. When analyzing the obtained results, it can be observed that fat isolated from whole grain oatmeal is mostly stable when the oxidation time reaches 39.07 min and 7.37 min at 120 °C and 140 °C, respectively. Fat extracted from mountain oatmeal turned out to be of the lowest oxidative stability. In the case of fat from mountain oatmeal, the induction time of oxidation reached the value of 28.79 min at 120 °C and 5.84 min at 140 °C.

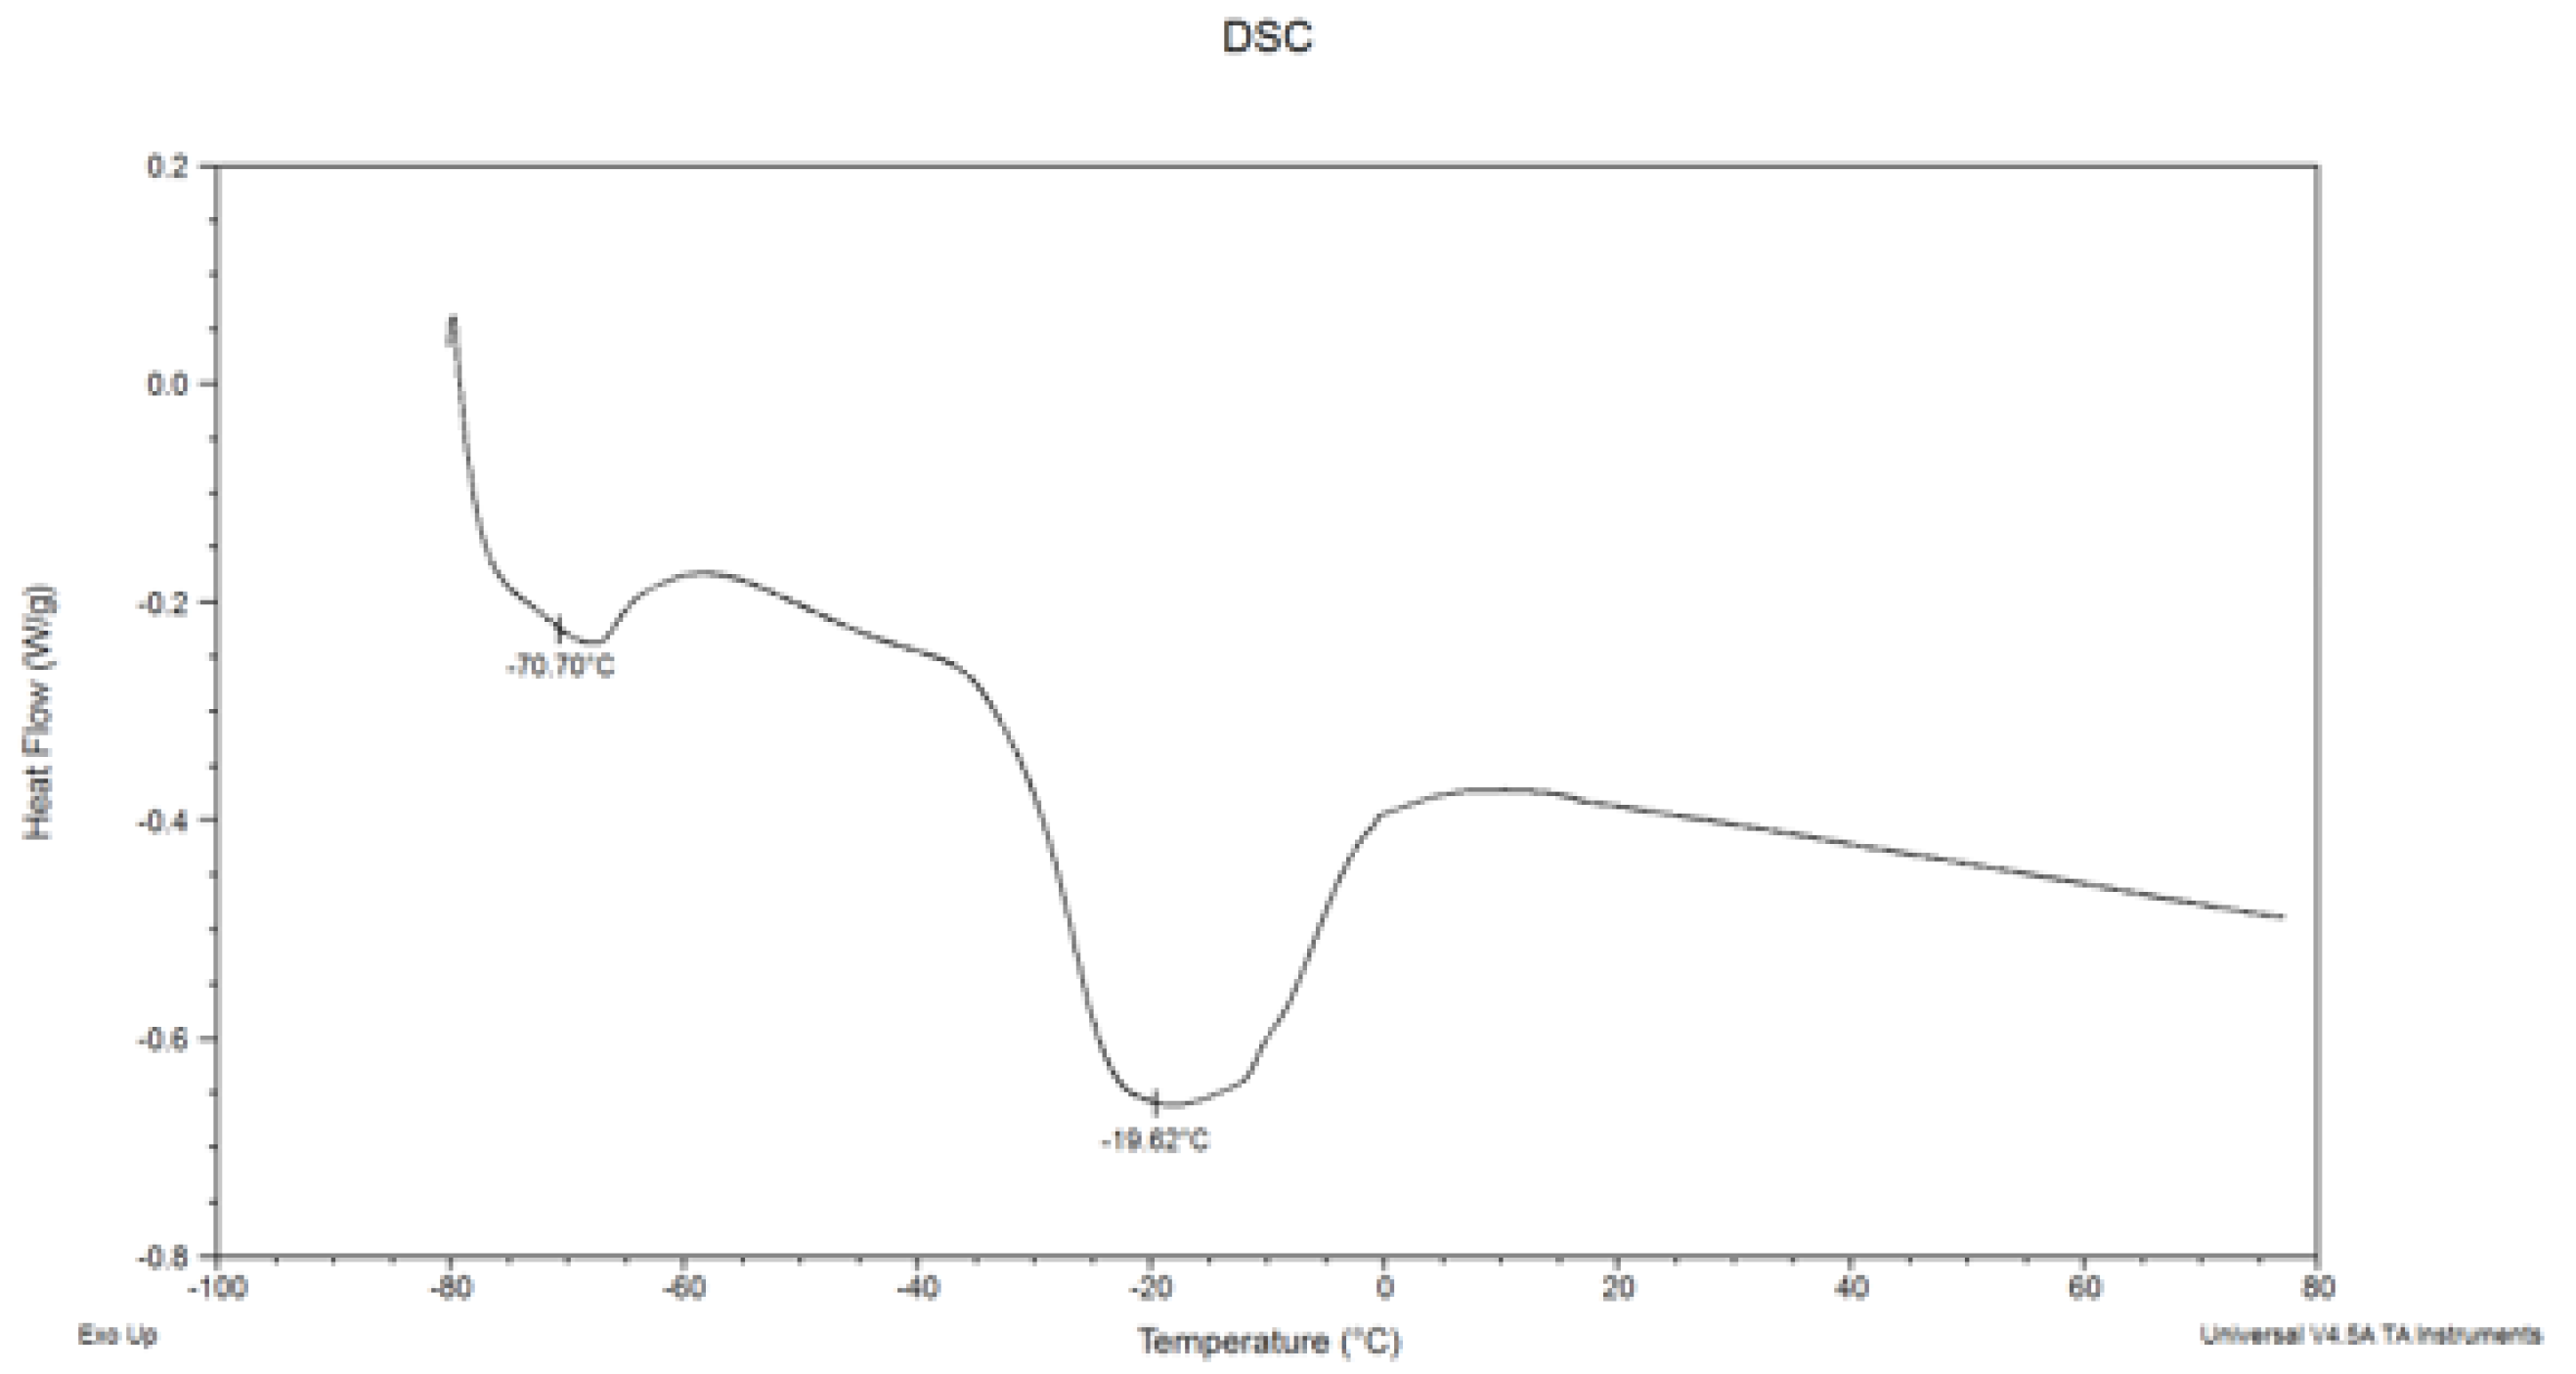
3.3. Melting Characteristics of Fat

An example of the fat isolated melting curve from the studied oatmeal products is presented in Figure 3. Over the course of the curve, two endothermic transitions can be observed. The first mild peak was detected in the region from −70.70 °C in the case of fat isolated from whole grain oatmeal to −68.68 °C for fat from mountain oatmeal. The second intensive event can be observed at −19.62 °C for whole grain oatmeal, −19.77 °C for mountain oatmeal, and −24.10 °C for instant oatmeal. The presence of such transitions on the course of melting curve indicates the presence of low-melting triacylglycerols containing mainly unsaturated fatty acids.

4. Discussion and Conclusions

The obtained results were in agreement with research conducted by Lange et al. [6], especially with regard to which oatmeal oil is a source of unsaturated fatty acid. A high content of linoleic acid reached 26–53% and oleic acid reached 19–48%. It also contains α-linolenic acid at a level of 0.5–5.0%. In our study, sn-2 position of triacylglycerol was occupied mainly by oleic acid. Oleic acid was also the fatty acid with the highest share in the sn-2 position. External positions were occupied mainly by linoleic acid. In the sn-1,3 positions, there was a high amount of palmitic acid. According to Arcos et al. [7], plant oils containing common fatty acids residues were characterized by a selective placement of unsaturated fatty acids in the sn-2 position. This phenomenon was also observed in our study. According to Hunter et al. [8], one of the consequences of saturated fatty acids in external positions is the formation of insoluble calcium salts, which can lead to calcium deficiencies in the human body. Comparing the oxidative stability to other studies [9,10], fat isolated from oat-based products is characterized by similar oxidative stability to extra virgin oil and hazelnut oil, yet it is much less stable than rapeseed oil. Melting profiles are of typical course for products rich in unsaturated fatty acids. These results are in agreement with those presented by Knothe et al. [11]. To our best knowledge, this is the first study with detailed characteristics of fat isolated from oat products. Herein, we presented the fatty acid composition and distribution in triacylglycerol structure, oxidative stability, and melting characteristics of fat.

Author Contributions

Conceptualization, A.G.; methodology, A.G., E.O.-L., J.B., and M.W.-W.; software, A.G. and R.B.; validation, A.G., R.B., and E.O.-L.; formal analysis, K.C.; investigation, A.G., K.C., and K.D.-Ż.; resources, A.G. and K.C.; data curation, A.G.; writing—original draft preparation, A.G. and K.C.; writing—review and editing, A.G., K.C., and R.B.; visualization, K.C.; supervision, A.G.; project administration, A.G.; funding acquisition, A.G. All authors have read and agreed to the published version of the manuscript.

Funding

This research received no external funding.

Institutional Review Board Statement

Not applicable.

Informed Consent Statement

Not applicable.

Data Availability Statement

The data presented in the study are available in article.

Conflicts of Interest

The authors declare no conflict of interest. The funders had no role in the design of the study; in the collection, analyses, or interpretation of data; in the writing of the manuscript, or in the decision to publish the results.

References

  1. Butt, M.S.; Tahir-Nadeem, M.; Khan, M.K.I.; Shabir, R.; Butt, M.S. Oat: Unique among the cereals. Eur. J. Nutr. 2008, 47, 68–79. [Google Scholar] [CrossRef] [PubMed]
  2. Lásztity, R. Oat grain—A wonderful reservoir of natural nutrients and biologically active substances. Food Rev. Int. 1998, 14, 99–119. [Google Scholar] [CrossRef]
  3. Sangwan, S.; Singh, R.; Tomar, S.K. Nutritional and functional properties of oats: An update. J. Innov. Biol. 2014, 1, 3–14. [Google Scholar]
  4. Rasane, P.; Jha, A.; Sabikhi, L.; Kumar, A.; Unnikrishnan, V.S. Nutritional advantages of oats and opportunities for its processing as value added foods—A review. J. Food Sci. Technol. 2015, 52, 662–675. [Google Scholar] [CrossRef] [PubMed]
  5. Reder, M.; Koczoń, P.; Wirkowska-Wojdyła, M.; Sujka, K.; Ciemniewska-Żytkiewicz, H. The Application of FT-MIR Spectroscopy for the Evaluation of Energy Value, Fat Content, and Fatty Acid Composition in Selected Organic Oat Products. Food Anal. Methods 2014, 7, 547–554. [Google Scholar] [CrossRef]
  6. Lange, E. Oat products as a functional food. ŻNTJ 2010, 17, 7–24. [Google Scholar]
  7. Arcos, J.A.; Garcia, H.; Hill, C.G. Regioselective analysis of the fatty acid composition of triacylglycerols with conventional high-performance liquid chromatography. J. Am. Oil Chem. Soc. 2000, 77, 507–512. [Google Scholar] [CrossRef]
  8. Hunter, J.E. Studies on effects of dietary fatty acids as related to their position on triglycerides. Lipids 2001, 36, 655–668. [Google Scholar] [CrossRef]
  9. Kowalski, B.; Gruczyńska, E.; Maciaszek, K. Kinetics of rapeseed oil oxidation by pressure differential scanning calorimetry measurements. Eur. J. Lipid Sci. Technol. 2000, 102, 337–341. [Google Scholar] [CrossRef]
  10. Ciemniewska-Żytkiewicz, H.; Ratusz, K.; Bryś, J.; Reder, M.; Koczoń, P. Determination of the oxidative stability of hazelnut oils by PDSC and Rancimat methods. J. Therm. Anal. Calorim. 2014, 118, 875–881. [Google Scholar] [CrossRef]
  11. Knothe, G.; Dunn, R.O. A Comprehensive Evaluation of the Melting Points of Fatty Acids and Esters Determined by Differential Scanning Calorimetry. J. Am. Oil Chem. Soc. 2009, 86, 843–856. [Google Scholar] [CrossRef]
Figure 1. Content of fatty acids groups in fat isolated from oat-based products (SFA—saturated fatty acids; MUFA—monounsaturated fatty acids; PUFA—polyunsaturated fatty acids). The different lower case letters (a–g) indicate significantly different values (p < 0.05).
Proceedings 70 00093 g001
Figure 2. Induction time of oxidation [min] of fat isolated from oat-based products measured at 120 °C and 140 °C. The different lower case letters (a–e) indicate significantly different values (p < 0.05).
Proceedings 70 00093 g002
Figure 3. Differential scanning calorimetry (DSC) curve of melting of fat isolated from whole grain oatmeal.
Proceedings 70 00093 g003
Table 1. Composition of chosen fatty acids in sn-2 and sn-1,3 positions of triacylglycerol in fat extracted from whole grain oatmeal and a share of fatty acids in internal position.
Fatty AcidFatty Acid Composition in TAG (%)Fatty Acid Composition in PositionsFatty Acid Share in sn-2 Position (%)
sn-2sn-1,3
C 16:018.02 ± 1.093.41 ± 0.725.33 ± 2.446.30 ± 1.15
C 18:01.87 ± 0.180.51 ± 0.092.56 ± 0.539.00 ± 0.85
C 18:1 n-935.12 ± 2.7548.59 ± 2.2128.39 ± 1.9746.12 ± 2.45
C 18:2 n-639.83 ± 1.5444.73 ± 3.1137.39 ± 1.6537.44 ± 1.63
C 18:3 n-31.71 ± 0.281.66 ± 0.141.73 ± 0.2332.36 ± 2.04
Table 2. Composition of chosen fatty acids in sn-2 and sn-1,3 positions of triacylglycerols in fat extracted from mountain oatmeal and a share of fatty acids in internal position.
Fatty AcidFatty Acid Composition in TAG (%)Fatty Acid Composition in PositionsFatty Acid Share in sn-2 Position (%)
sn-2sn-1,3
C 16:016.13 ± 1.454.14 ± 0.1822.12 ± 1.748.56 ± 1.48
C 18:01.28 ± 0.070.67 ± 0.071.59 ± 0.1217.33 ± 1.37
C 18:1 n-937.57 ± 2.0548.28 ± 2.7832.23 ± 2.0642.83 ± 3.71
C 18:2 n-641.57 ± 3.1444.08 ± 1.9340.32 ± 3.0735.35 ± 2.85
C 18:3 n-30.61 ± 0.081.57 ± 0.040.13 ± 0.0535.51 ± 2.43
Table 3. Composition of chosen fatty acids in sn-2 and sn-1,3 positions of triacylglycerols in fat extracted from instant oatmeal and a share of fatty acids in internal position.
Fatty AcidFatty Acid Composition in TAG (%)Fatty Acid Composition in PositionsFatty Acid Share in sn-2 Position (%)
sn-2sn-1,3
C 16:018.81 ± 1.754.45 ± 0.8625.99 ± 2.647.88 ± 0.83
C 18:02.27 ± 0.040.81 ± 0.063.00 ± 0.0611.85 ± 1.95
C 18:1 n-935.32 ± 2.0448.11 ± 2.1428.93 ± 1.6345.41 ± 2.38
C 18:2 n-638.35 ± 2.1443.64 ± 2.8535.71 ± 2.3637.94 ± 2.15
C 18:3 n-31.49 ± 0.051.46 ± 0.071.51 ± 0.0832.66 ± 1.97
Publisher’s Note: MDPI stays neutral with regard to jurisdictional claims in published maps and institutional affiliations.

