Nutritional and Physicochemical Characterization of Vegetable Fibres in Order to Obtain Gelled Products †


Abstract
:1. Introduction
2. Materials and Methods
2.1. Raw Materials
2.2. Physicochemical Analysis
2.3. Hydration Properties
2.4. Antioxidant Capacity and Phenolic Compounds
2.5. Mineral Analysis
2.6. Gel Preparation
2.7. Gel Analysis: pH, Colour and Texture
2.8. Statistical Analysis
3. Results and Discussion
Author Contributions
Funding
Institutional Review Board Statement
Informed Consent Statement
Data Availability Statement
Acknowledgments
Conflicts of Interest
References
- Aschemann-Witzel, J.; Varela, P.; Peschel, A.O. Consumers’ categorization of food ingredients: Do consumers perceive them as ‘clean label’producers expect? An exploration with projective mapping. Food Qual. Prefer. 2019, 71, 117–128. [Google Scholar] [CrossRef]
- Li, J.M.; Nie, S.P. The functional and nutritional aspects of hydrocolloids in foods. Food Hydrocoll. 2016, 53, 46–61. [Google Scholar] [CrossRef]
- De Moraes Crizel, T.; Jablonski, A.; de Oliveira Rios, A.; Rech, R.; Flôres, S.H. Dietary fiber from orange byproducts as a potential fat replacer. LWT 2013, 53, 9–14. [Google Scholar] [CrossRef]
- Lu, W.; Nishinari, K.; Matsukawa, S.; Fang, Y. The future trends of food hydrocolloids. Food Hydrocoll. 2020, 103, 105713. [Google Scholar] [CrossRef]
- Cai, Y.Z.; Corke, H. Production and properties of spray-dried Amaranthus betacyanin pigments. J. Food Sci. 2000, 65, 1248–1252. [Google Scholar] [CrossRef]
- Agudelo, C.; Igual, M.; Camacho, M.M.; Martínez-Navarrete, N. Effect of process technology on the nutritional, functional, and physical quality of grapefruit powder. Food Sci. Technol. Int. 2017, 23, 61–74. [Google Scholar] [CrossRef] [PubMed]
- Raghavendra, S.N.; Rastogi, N.K.; Raghavarao, K.S.M.S.; Tharanathan, R.N. Dietary fiber from coconut residue: Effects of different treatments and particle size on the hydration properties. Eur. Food Res. Technol. 2004, 218, 563–567. [Google Scholar] [CrossRef]
- Chantaro, P.; Devahastin, S.; Chiewchan, N. Production of antioxidant high dietary fiber powder from carrot peels. LWT 2008, 41, 1987–1994. [Google Scholar] [CrossRef]
- Navarro-González, I.; García-Valverde, V.; García-Alonso, J.; Periago, M.J. Chemical profile, functional and antioxidant properties of tomato peel fiber. Food Res. Int. 2011, 44, 1528–1535. [Google Scholar] [CrossRef]
- Mahdavi, S.A.; Jafari, S.M.; Assadpour, E.; Ghorbani, M. Storage stability of encapsulated barberry’s anthocyanin and its application in jelly formulation. J. Food Eng. 2016, 181, 59–66. [Google Scholar] [CrossRef]
- Igual, M.; García-Martínez, E.; Camacho, M.M.; Martínez-Navarrete, N. Stability of micronutrients and phytochemicals of grapefruit jam as affected by the obtention process. Food Sci. Technol. Int. 2016, 22, 203–212. [Google Scholar] [CrossRef] [PubMed]
- García-Segovia, P.; Igual, M.; Noguerol, A.T.; Martinez-Monzo, J. Use of insects and pea powder as alternative protein and mineral sources in extruded snacks. Eur. Food Res. Technol. 2020, 246, 703–712. [Google Scholar] [CrossRef]
- Cevoli, C.; Balestra, F.; Ragni, L.; Fabbri, A. Rheological characterisation of selected food hydrocolloids by traditional and simplified techniques. Food Hydrocoll. 2013, 33, 142–150. [Google Scholar] [CrossRef]
- Lan, G.; Chen, H.; Chen, S.; Tian, J. Chemical composition and physicochemical properties of dietary fiber from Polygonatum odoratum as affected by different processing methods. Food Res. Int. 2012, 49, 406–410. [Google Scholar] [CrossRef]
- Ma, M.M.; Mu, T.H. Effects of extraction methods and particle size distribution on the structural, physicochemical, and functional properties of dietary fiber from deoiled cumin. Food Chem. 2016, 194, 237–246. [Google Scholar] [CrossRef] [PubMed]


| Mix of Vegetable Fibres | ||
|---|---|---|
| FBPC | FPESB | |
| Moisture (%) | 6.676 ± 0.104 a | 5.7 ± 0.3 b |
| Water activity (aw) | 0.3590 ± 0.0012 a | 0.342 ± 0.002 b |
| Hg (g water/100 g dry solid) | 26.7 ± 0.7 a | 27.3 ± 0.2 a |
| Bulk density (g/L) | 489 ± 17 a | 354 ± 10 b |
| Porosity | 69.22 ± 0.95 b | 77.51 ± 0.12 a |
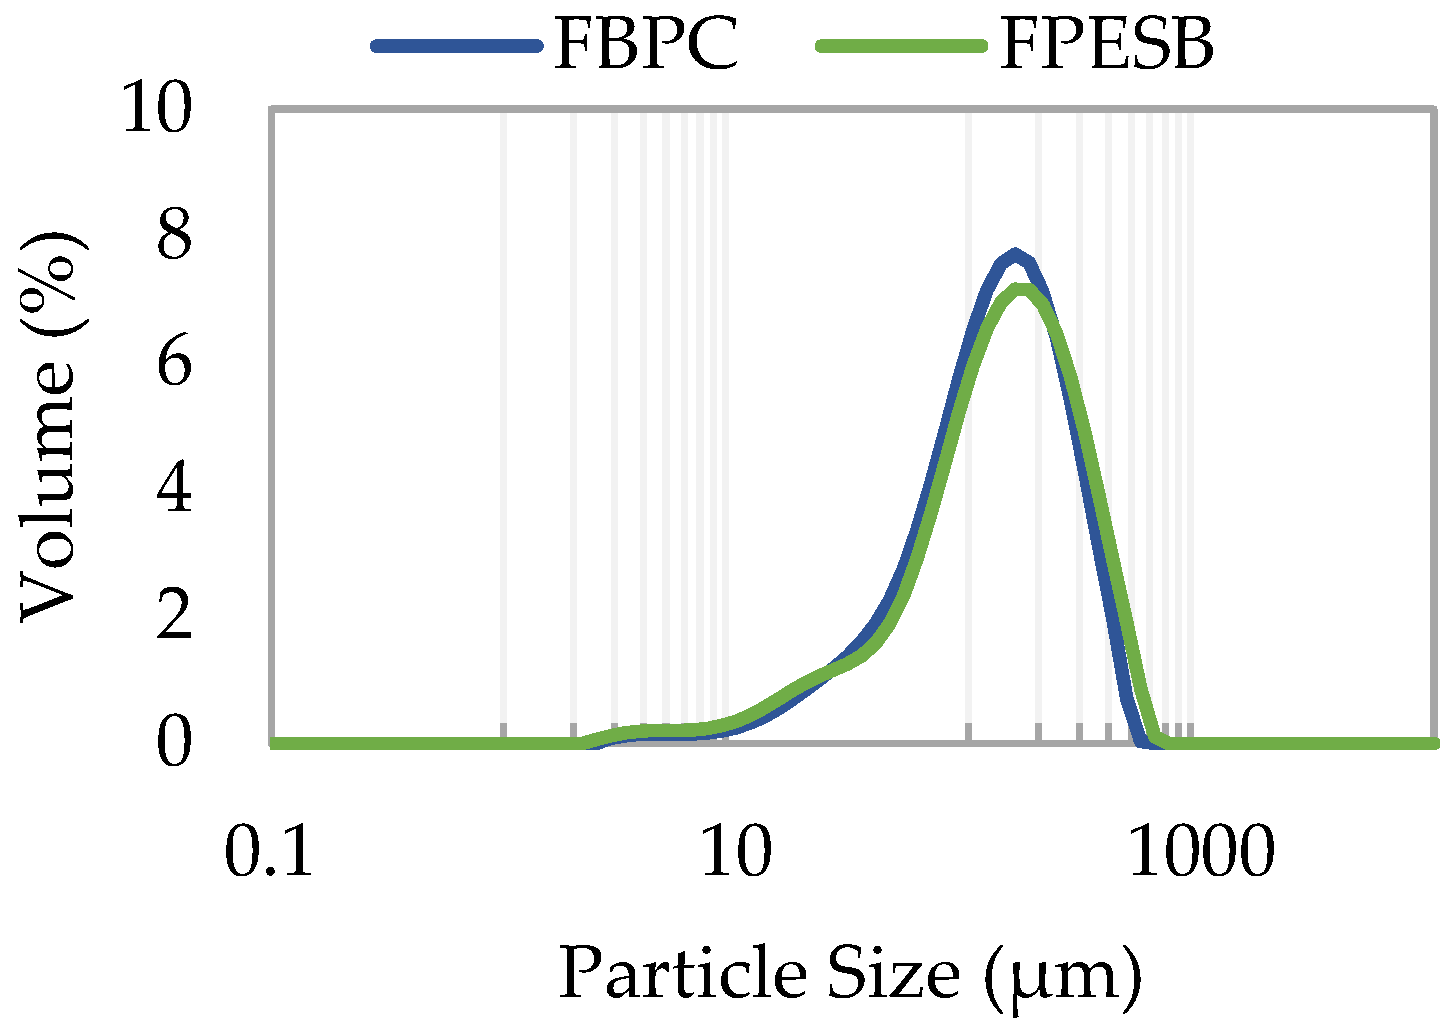
| D[4,3] (μm) | 142.6 ± 0.3 b | 156 ± 2 a |
| WHC (g water/g sample) | 21.197 ± 0.097 a | 6.18 ± 1.03 b |
| WRC (g water/g sample) | 8.7 ± 0.8 a | 4.9 ± 0.3 b |
| SWC (mL water/g sample) | 8 ± 2 a | 9.2 ± 0.8 a |
| FAC (g oil/g sample) | 1.44 ± 0.03 b | 1.91 ± 0.03 a |
| WSI (%) | 19.4 ± 0.2 a | 6.28 ± 0.02 b |
| PC (mg gallic/100 g sample) | 52.6 ± 0.7 b | 64 ± 7 a |
| AOA (mg trolox/100 g sample) | 12.4 ± 0.8 b | 19.7 ± 0.7 a |
| Mix of Vegetable Fibres | ||
|---|---|---|
| FBPC | FPESB | |
| P | 7.9 ± 0.7 b | 32.9 ± 1.4 a |
| K | 167 ± 14 a | 141 ± 7 b |
| Ca | 96 ± 3 b | 340 ± 16 a |
| Na | 40 ± 4 b | 60 ± 3 a |
| Mg | 3.706 ± 1.002 b | 107 ± 4 a |
| Zn | − b | 0.58 ± 0.03 a |
| Fe | 1.6 ± 0.3b | 4.2 ± 0.5 a |
| Mn | − b | 0.75 ± 0.06 a |
| Sample | C (%) | pH | L* | a* | b* | Consistency (Ns) | Firmness (N) | Viscosity (Ns) | Cohesiveness (N) |
|---|---|---|---|---|---|---|---|---|---|
| FBPC | 1 | 6.90 ± 0.02 a,B | 11 ± 2 I,I | −0.16 ± 0.05 g,h,i,D,E | −0.9 ± 0.3 g,J | 1.006 ± 0.013 h,F | 0.187 ± 0.003 h,F | 0.054 ± 0.002 g,G | 0.143 ± 0.007 g,H |
| 2 | 6.7 ± 0.3 c,D | 13.4 ± 0.7 h,G | −0.13 ± 0.04 g,h,C,D | 0.47 ± 0.13 f,G | 1.02 ± 0.02 h,F | 0.1912 ± 0.0103 h,F | 0.057 ± 0.005 g,G | 0.158 ± 0.012 g,H | |
| 3 | 6.22 ± 0.03 e,F | 14 ± 0.5 g,h,G | −0.23 ± 0.02 i,F | −0.470 ± 0.098 g,H | 1.884 ± 0.102 g,h,F | 0.377 ± 0.019 g,h,F | 0.221 ± 0.014 f,g,G | 0.30 ± 0.04 g,H | |
| 4 | 6.09 ± 0.06 f,G | 17.0 ± 0.2 f,F | −0.21 ± 0.03 h,i,E,F | 0.43 ± 0.08 f,G | 6.5 ± 0.5 f,E,F | 1.267 ± 0.106 f,g,E,F | 0.71 ± 0.05 e,F | 1.05 ± 0.04 f,G | |
| 5 | 5.98 ± 0.02 g,I | 20.3 ± 0.4 e,E | −0.118 ± 0.009 g,C,D | 0.77 ± 0.12 f,F | 12.4 ± 1.5 e,E | 2.2 ± 0.3 e,f,E | 1.33 ± 0.07 d,E | 1.911 ± 0.096 e,F | |
| 6 | 5.99 ± 0.07 g,I | 26.7 ± 0.5 c,B | 0.10 ± 0.05 f,B | 2.78 ± 0.13 e,C | 27 ± 3 c,D | 4.7 ± 0.4 c,D | 2.26 ± 0.15 c,D | 3.22 ± 0.13 d,E | |
| 7 | 5.9 ± 0.5 i,J | 28.0 ± 0.4 b,c,A | 0.19 ± 0.03 e,A | 3.43 ± 0.15 c,d,A | 42 ± 8 a,C | 8 ± 2 a,C | 3.6 ± 0.5 b,C | 5.5 ± 0.7 b,C | |
| 65FBPC | 1 | 7.16 ± 0.02 z,A | 12 ± 2 q,H,I | −0.16 ± 0.05 v,D,E | −0.8 ± 0.2 s,I,J | 1.05 ± 0.02 s,F | 0.1902 ± 0.0112 s,F | 0.054 ± 0.003 t,G | 0.149 ± 0.002 t,H |
| 2 | 6.8 ± 0.3 y,C | 13 ± 2 r,q,G,H | −0.15 ± 0.06 v,D | −0.4 ± 0.2 s,H | 2.28 ± 0.18 s,F | 0.73 ± 0.03 t,s,F | 0.149 ± 0.015 t,G | 0.2200 ± 0.0115 t,H | |
| 3 | 6.28 ± 0.03 v,F | 13.5 ± 0.5 r,G | −0.26 ± 0.03 u,F | −0.54 ± 0.13 s,H,I | 9.6 ± 0.3 t,s,E,F | 1.800 ± 0.110 t,s,E,F | 0.70 ± 0.03 u,F | 1.00 ± 0.07 u,G | |
| 4 | 6.05 ± 0.05 u,G | 21.51 ± 1.18 v,u,E | −0.11 ± 0.04 v,C,D | 1.6 ± 0.4 u,E | 24 ± 2 u,D | 4.5 ± 0.6 v,D | 1.3 ± 0.2 v,E | 2.21 ± 0.16 v,F | |
| 5 | 5.97 ± 0.02 t,I | 23.0 ± 0.7 v,D | −0.08 ± 0.07 v,C | 2.2 ± 0.3 v,D | 39 ± 6 v,C | 7 ± 2 w,C | 2.20 ± 0.17 w,D | 4.0 ± 0.4 w,D | |
| 6 | 5.97 ± 0.06 t,s,I | 25.3 ± 0.2 w,C | 0.06 ± 0.02 w,B | 3.1 ± 0.2 w,B | 75 ± 13 x,B | 14 ± 2 y,B | 4.3 ± 0.5 x,B | 8.0 ± 0.9 y,B | |
| 7 | 5.9 ± 0.5 r,J | 28.1 ± 0.3 y,x,A | 0.1060 ± 0.0114 w,B | 3.53 ± 0.13 w,A | 107 ± 21 z,A | 20 ± 4 z,A | 6.0 ± 0.6 y,A | 10.4 ± 1.3 z,A | |
| FPESB | 1 | 6.8 ± 0.2 b,Z | 9 ± 3 j,S | 0.226 ± 0.104 e,V | 0.8 ± 0.6 f,S | 0.97 ± 0.03 h,T | 0.176 ± 0.007 h,T | 0.052 ± 0.007 g,U | 0.1486 ± 0.0115 g,U |
| 2 | 6.33 ± 0.04 d,X | 15 ± 2 g,U | 0.64 ± 0.14 c,Y | 3.1 ± 0.6 d,e,U | 0.99 ± 0.03 h,T | 0.171 ± 0.006 h,T | 0.052 ± 0.008 g,U | 0.142 ± 0.008 g,U | |
| 3 | 6.10 ± 0.08 f,W | 22.2 ± 0.3 d,W | 0.66 ± 0.05 c,Y | 3.7 ± 0.3 c,V | 1.23 ± 0.12 h,U,T | 0.47 ± 0.17 g,h,T | 0.057 ± 0.003 g,U | 0.1548 ± 0.0105 g,U | |
| 4 | 5.93 ± 0.02 h,V | 22.1 ± 0.8 d,W | 0.45 ± 0.04 d,X | 3.23 ± 0.08 d,V,U | 5.7 ± 0.7 f,g,V,U | 1.274 ± 0.103 f,g,U,T | 0.49 ± 0.06 e,f,V | 0.92 ± 0.19 f,V | |
| 5 | 5.76 ± 0.02 j,T | 27.2 ± 0.4 c,X | 0.67 ± 0.07 c,Y | 4.6 ± 0.3 b,X,W | 14 ± 6 d,e,W | 2.5 ± 0.8 d,e,V | 1.3 ± 0.2 d,W | 2.1 ± 0.4 e,W | |
| 6 | 5.67 ± 0.02 k,R | 29.2 ± 0.5 a,b,Y | 0.81 ± 0.09 b,Z | 5.0 ± 0.3 a,Y,X | 16.9 ± 0.7 d,W | 3.204 ± 0.115 d,W,V | 2.4 ± 0.2 c,X | 3.73 ± 0.14 c,X | |
| 7 | 5.65 ± 0.02 k,R | 30.6 ± 0.2 a,Z,Y | 0.89 ± 0.03 a,Z | 5.2 ± 0.3 a,Y | 36 ± 6 b,X | 6.6 ± 1.5 b,X | 4.2 ± 0.6 a,Y | 6.2 ± 0.6 a,Y | |
| 65FPESB | 1 | 6.7 ± 0.2 x,Y | 13 ± 2 r,q,T | −0.13 ± 0.08 v,T | 0.5 ± 0.3 t,S | 0.99 ± 0.02 s,T | 0.177 ± 0.006 s,T | 0.054 ± 0.004 t,U | 0.145 ± 0.012 t,U |
| 2 | 6.32 ± 0.04 w,X | 17 ± 2 s,U | 0.10 ± 0.05 w,U | 2.1 ± 0.7 v,T | 1.5 ± 0.3 s,U,T | 0.43 ± 0.07 s,T | 0.070 ± 0.004 t,U | 0.161 ± 0.007 t,U | |
| 3 | 6.08 ± 0.05 u,W | 19 ± 2 t,V | 0.4 ± 0.2 x,X,W | 2.5 ± 0.5 v,T | 8.2 ± 0.8 s,V | 2.32 ± 0.19 u,t,V,U | 0.80 ± 0.06 u,V | 1.0 ± 0.2 u,V | |
| 4 | 5.93 ± 0.03 s,V | 20.2 ± 0.7 u,t,V | 0.33 ± 0.05 x,W | 2.5 ± 0.3 v,T | 18 ± 2 u,t,W | 3.7 ± 0.4 v,u,W | 1.24 ± 0.18 v,W | 1.8 ± 0.3 v,W | |
| 5 | 5.85 ± 0.04 q,U | 26.7 ± 0.4 x,w,X | 0.60 ± 0.03 y,Y | 4.28 ± 0.07 x,W | 38 ± 5 v,X | 7.01 ± 1.04 w,X | 2.4 ± 0.3 w,X | 3.8 ± 0.4 w,X | |
| 6 | 5.77 ± 0.02 p,T | 29.1 ± 0.4 y,Y | 0.81 ± 0.05 z,Z | 5.0 ± 0.2 y,Y,X | 63 ± 3 w,Y | 12.08 ± 1.12 x,Y | 4.5 ± 0.9 x,Y | 6.4 ± 0.3 x,Y | |
| 7 | 5.72 ± 0.02 o,S | 31.6 ± 0.5 z,Z | 0.88 ± 0.06 z,Z | 5.8 ± 0.2 z,Z | 94 ± 9 y,Z | 19 ± 2 z,Z | 7.3 ± 0.4 z,Z | 10.1 ± 0.4 z,Z |
Publisher’s Note: MDPI stays neutral with regard to jurisdictional claims in published maps and institutional affiliations. |
© 2020 by the authors. Licensee MDPI, Basel, Switzerland. This article is an open access article distributed under the terms and conditions of the Creative Commons Attribution (CC BY) license (https://creativecommons.org/licenses/by/4.0/).
Share and Cite
Noguerol, A.T.; Igual, M.; Pagán-Moreno, M.J. Nutritional and Physicochemical Characterization of Vegetable Fibres in Order to Obtain Gelled Products. Proceedings 2021, 70, 23. https://doi.org/10.3390/foods_2020-07686
Noguerol AT, Igual M, Pagán-Moreno MJ. Nutritional and Physicochemical Characterization of Vegetable Fibres in Order to Obtain Gelled Products. Proceedings. 2021; 70(1):23. https://doi.org/10.3390/foods_2020-07686
Chicago/Turabian StyleNoguerol, Ana Teresa, Marta Igual, and Mª Jesús Pagán-Moreno. 2021. "Nutritional and Physicochemical Characterization of Vegetable Fibres in Order to Obtain Gelled Products" Proceedings 70, no. 1: 23. https://doi.org/10.3390/foods_2020-07686
APA StyleNoguerol, A. T., Igual, M., & Pagán-Moreno, M. J. (2021). Nutritional and Physicochemical Characterization of Vegetable Fibres in Order to Obtain Gelled Products. Proceedings, 70(1), 23. https://doi.org/10.3390/foods_2020-07686