Proceeding Paper

Analysis of the Losses Due to Flood and Waterlogging Disasters in China during 2006 to 2017 †

1
State Key Laboratory of Simulation and Regulation of Water Cycle in River Basin, China Institute of Water Resources and Hydropower Research, Beijing 100038, China
2
School of Urban Planning and Environmental Science, Liaoning Normal University, Dalian 116029, China
*
Author to whom correspondence should be addressed.
Presented at the 3rd International Electronic Conference on Water Sciences, 15–30 November 2018; Available online: https://ecws-3.sciforum.net.
Proceedings 2019, 7(1), 25; https://doi.org/10.3390/ECWS-3-05820
Published: 15 November 2018
(This article belongs to the Proceedings of ECWS-3)

Abstract

:
China is in a period of rapid urbanization. Due to the high concentration of population and industries, the loss due to flood and waterlogging is becoming more and more serious. Therefore, it is of great significance to strengthen the analysis and evaluation of the losses due to flood and waterlogging disasters in China for the recent years. This study analyzed the losses caused by flood and waterlogging disasters in China from 2006 to 2017. The results showed that the most serious year affected by floods and waterlogging was 2010. However, the relationship between rainfall and flood disaster losses was not significant, which may be because the occurrence of flood disasters is caused by many factors. The spatial distribution showed that the eastern and southern parts of China suffered greater losses from the flood and waterlogging disasters because these areas are more vulnerable to floods and waterlogging disasters under the impact of both monsoons and typhoons. This study hopes to provide some reference for flood disaster control and disaster mitigation in the future.

1. Introduction

Flood and waterlogging disasters have been one of the greatest threats to human survival and social development since ancient times. In terms of the space–time scope of a disaster’s occurrence and the intensity of disasters, floods rank first among all kinds of natural disasters. In the 20th century, the global average annual economic losses caused by floods amounted to 3.0 × 10¹⁰ USD, accounting for about one-third of the total economic losses caused by various natural disasters, and the death toll from floods was only less than that of plagues and droughts. In recent decades, especially since the 1990s, with the enhancement of human activities and economic development, the frequency and intensity of floods and waterlogging have increased [1]. China is one of the few countries worldwide that suffer from frequent losses due to floods. Typically, flood-prone areas are often the areas where the population, economy, and social factors are relatively concentrated [2]. In recent years, with the rapid development of urbanization in China, impervious pavements have become widespread along with buildings, which have changed the state of the underlying surface of the region and also affected local climate [3]. The construction of water conservancy projects and drainage facilities in cities have intensified social and economic factors. Taking the Yangtze River Delta as an example, in 2016, the region suffered severe rainfall in some areas, which led to some river silting, road traffic interruption, casualties, and serious economic losses. Taking the Pearl River Delta as an example, typhoons and tropical storms often bring heavy rains and storm surges to offshore areas, which cause floods and waterlogging disasters. This renders urban agglomerations vulnerable to flooding disasters, with a wide range, large intensity, and long duration. Thus, the frequent occurrence of floods and waterlogging disasters has a serious impact on China’s social security and economic development. Therefore, it is of practical significance to analyze the loss due to floods and waterlogging disasters in China for an understanding of the situation of flood disasters; these insights would help future flood control and disaster relief.

2. Data and Method

This study collected data on flood and waterlogging disasters in China from 2006 to 2017, mainly based on the data of the China Flood and Drought Disaster Bulletins from the State Flood Control and Drought Relief Command and the Ministry of Water Resources in China. This study did not consider data from Hong Kong, Macao, and Taiwan. Based on the statistics of flood data in China, this paper analyzed the trend of flood disasters in the past 12 years using correlation analysis and trend analysis methods. In addition, the relationship between precipitation and flood disasters was analyzed, and the distribution of flood disasters among the provinces during these years in China was discussed.

3. Results and Discussion

3.1. Trend of Flood and Waterlogging Disasters in China

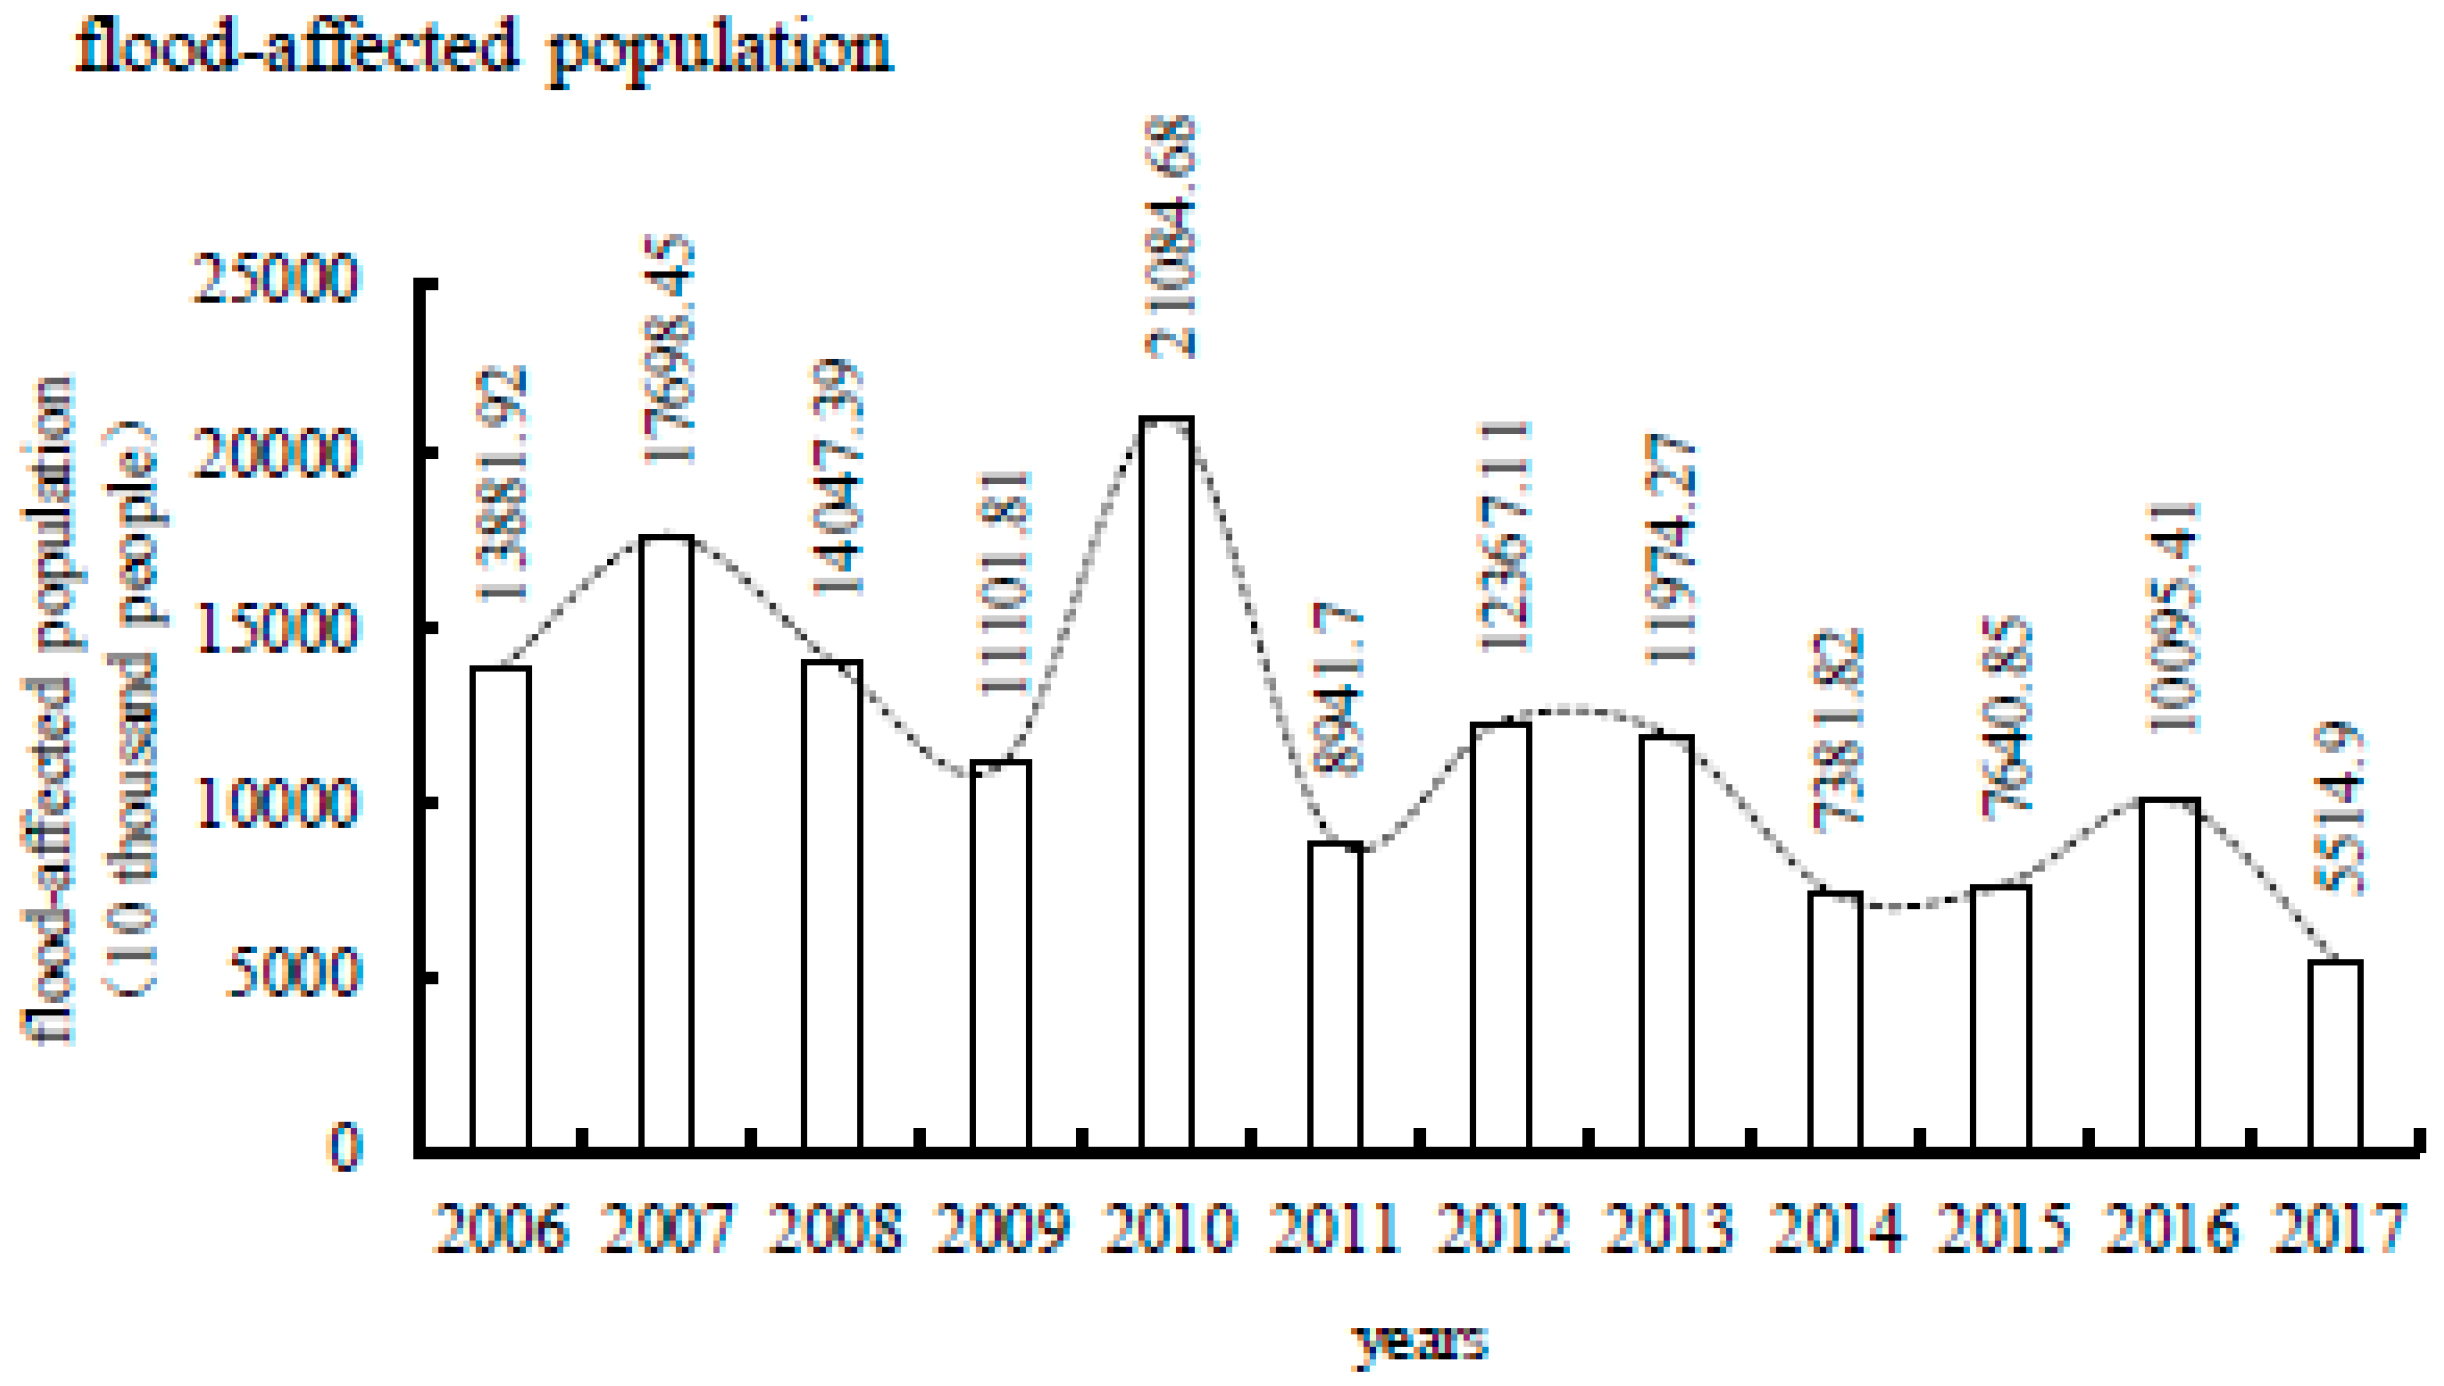
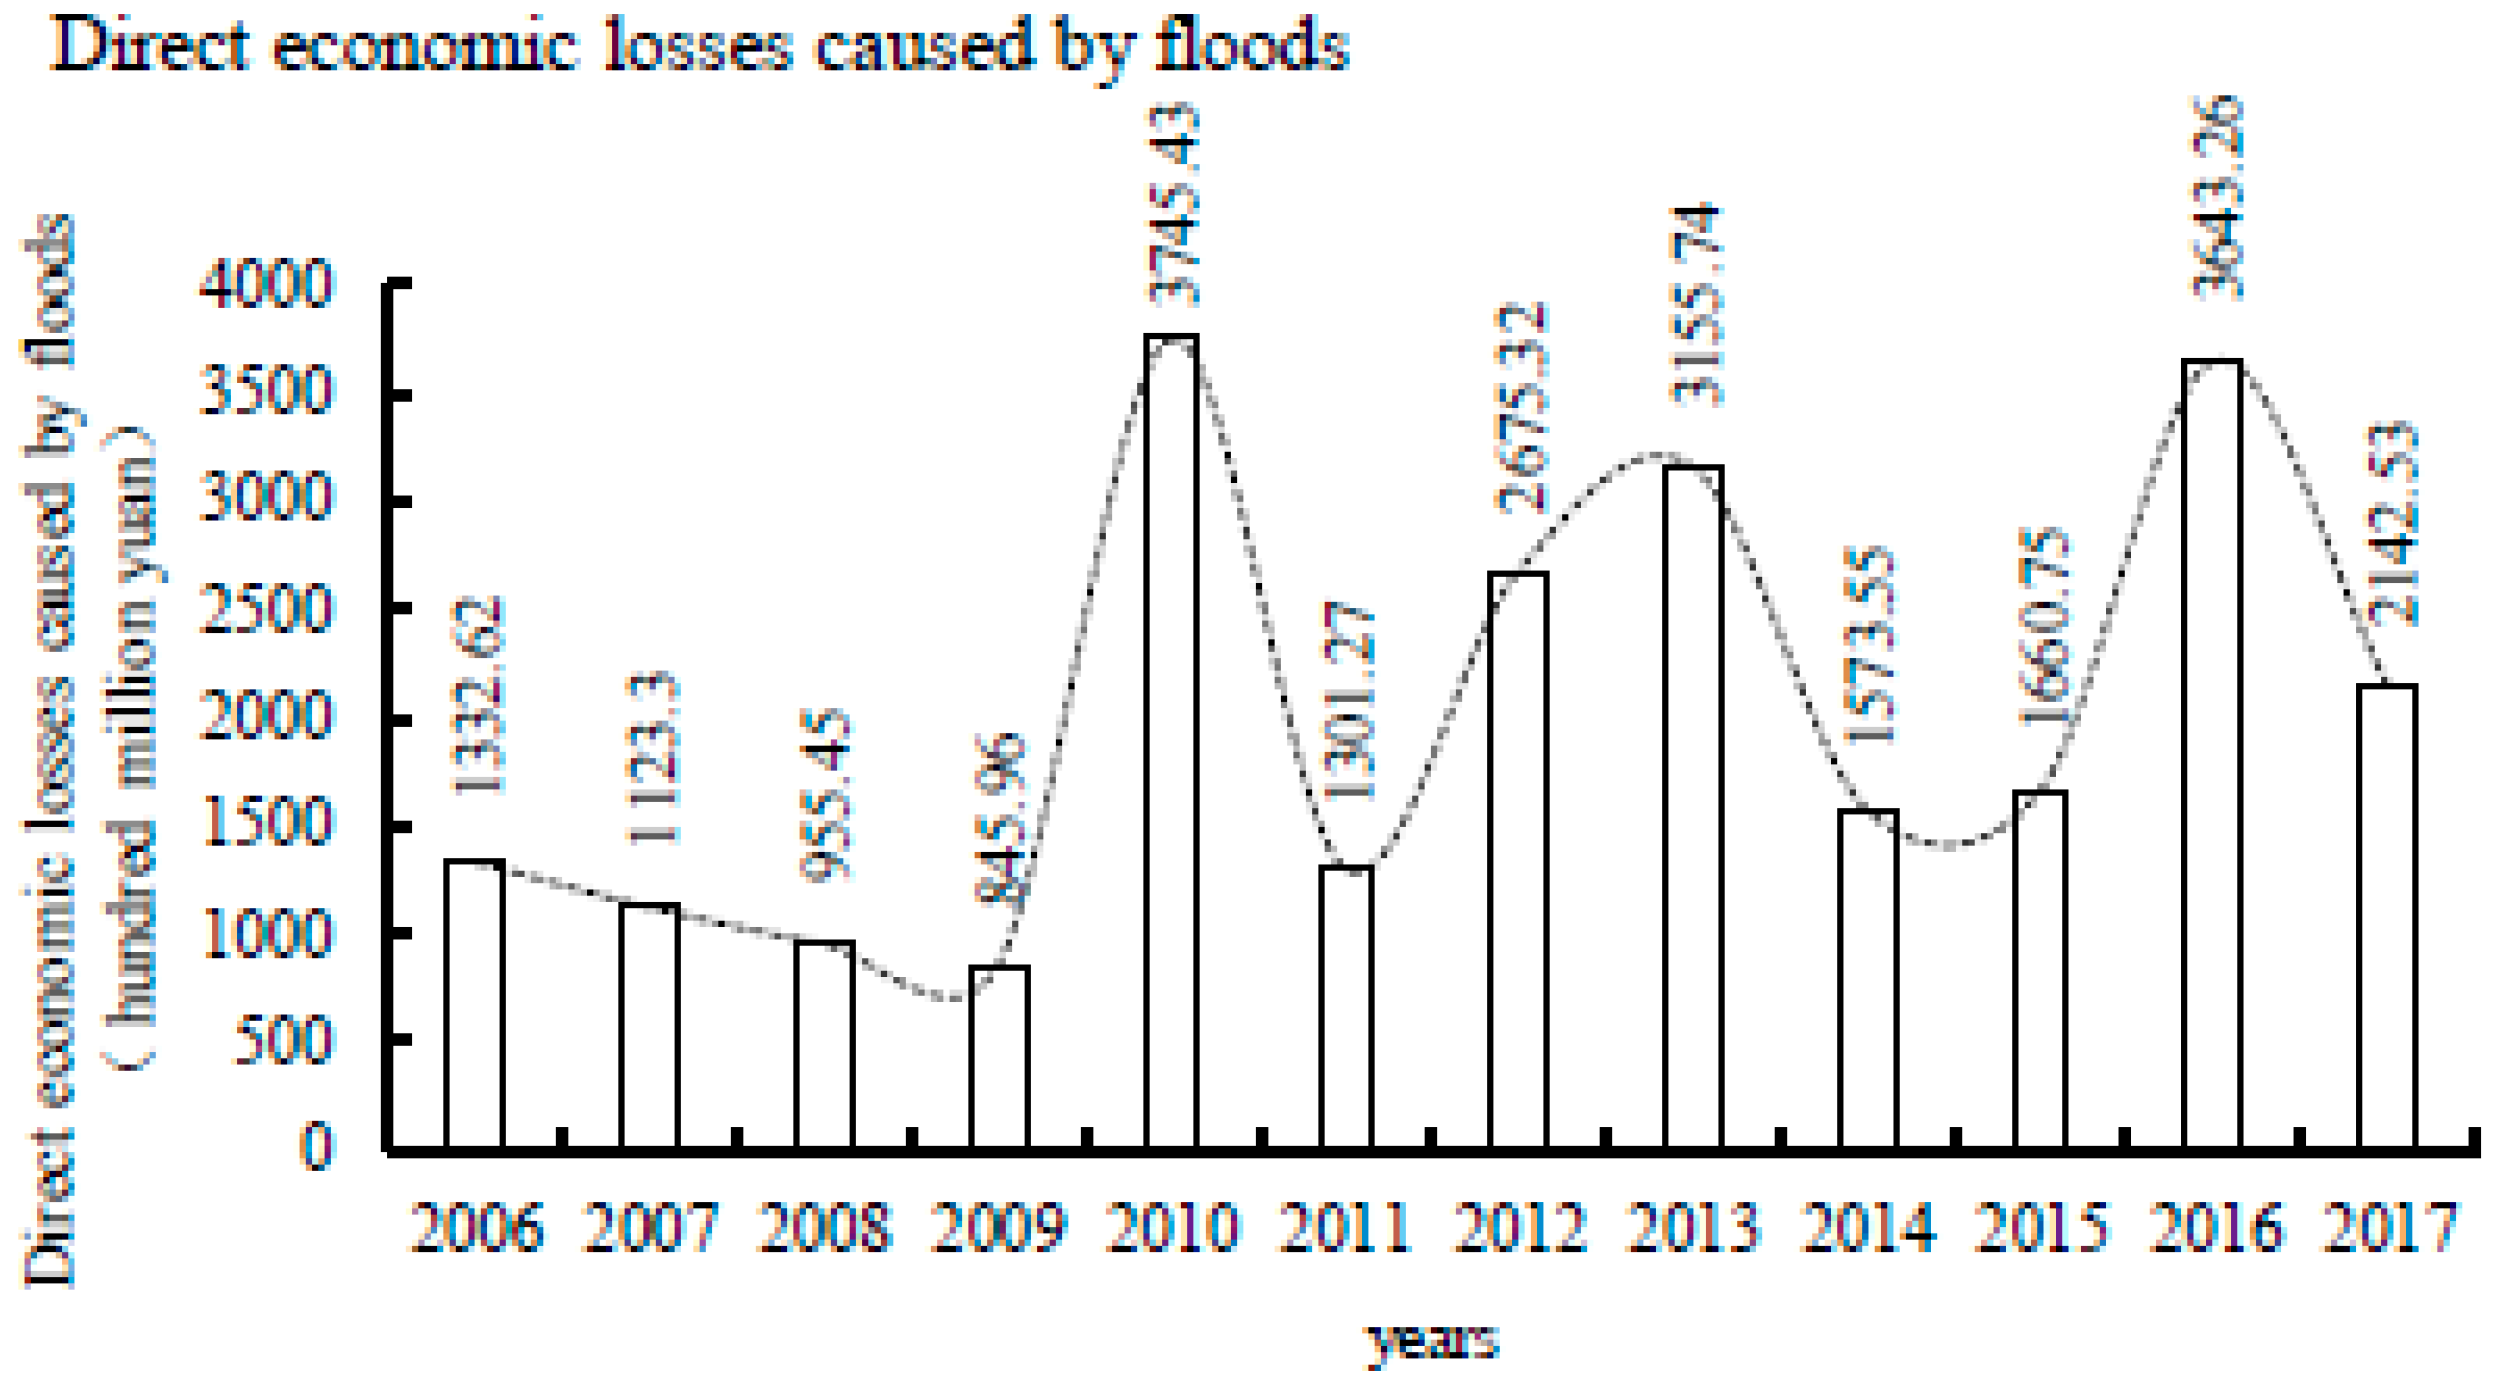
From 2006 to 2017, the average annual population affected by flood and waterlogging disasters in China was about 118.09 million, and the average annual direct economic loss caused by flood and waterlogging disasters was 201.30 billion CNY. Based on the collected data, the variation curves of annual flood-affected population and direct economic loss were drawn respectively, as shown in Figure 1 and Figure 2.
The year 2010 was the worst-affected year of flood disasters. In 2010, 210.85 million people were influenced by floods, and the direct economic loss was 374.543 billion CNY. In that year, flood disasters occurred in 30 provinces (or autonomous regions/municipalities) throughout the country. Meanwhile, spring floods occurred in southern parts of the Yangtze River Basin. Floods occurred in rivers and lakes that exceeded the warning water level, and floods with the largest scale since 1987 occurred in 2010 in the upper reaches of the Yangtze River [4]. The largest inflow peaks, since the reservoir was built, appeared in the same year at the Three Gorges Reservoir, Zhouqu region in Gansu Province, Guanling region in Guizhou Province, Qiaojia region in Yunnan Province, and earthquake devastating areas in Sichuan Province have also successively experienced huge mountain torrents. In addition, typhoons landed in China seven times in 2010, which resulted in different degrees of floods in coastal regions like Guangdong, Hainan, Fujian, Zhejiang, and Guangxi Provinces [5].
During this period, the flood-affected population in 2007 was the second highest, which reached 176.98 million people. The Huaihe River suffered from catchment floods where the floods were prominent; Chongqing and Jinan suffered from catastrophic floods caused by heavy rains, and other cities such as Wuhan, Xi’an, Zhengzhou, Hangzhou, and Nanjing also suffered from waterlogging caused by local rainstorms throughout the year. In addition, 122 mountain torrents took place in 2007, which caused severe casualties. The death toll of these mountain torrents was up to 75% of the total number of deaths caused by floods within the year [5].
Meanwhile, the second highest direct economic loss appeared in 2016, which was approximately 364.33 billion CNY. Influenced by the strong El Nino effect, there were many large-scale heavy rainfall processes in 2016. The flood area in China was wide and the local losses were heavy. Places like Hubei, Hebei, Anhui, Fujian, and Hunan Provinces suffered from grave floods and great losses. The direct economic losses caused by floods and waterlogging in these five provinces accounted for 64.9% of the total economic losses caused by floods and waterlogging in China in 2016, and disasters also frequently appeared in parts of Anhui, Fujian, and Hubei Provinces. Severe flood disasters have taken place in some basins and regions year by year, which reveals that there still are many weak links in the flood control and drainage system [5]. It is imperative to fill the “short slabs” in flood control and drainage system and disaster reduction measures; for example, it is crucial to promote the management of small and medium-sized river basins, reinforce dangerous reservoirs and urban drainage, and implement waterlogging prevention [6].
As far as the general variation of the flood-affected population and direct economic losses are concerned, there was no obvious trend of increasing or decreasing. During the statistical period, the ratio of the maximum flood-stricken population (in 2010) to the minimum flood-stricken population (in 2017) was 3.82, and the ratio of the maximum flood-affected direct economic losses (in 2010) to the minimum flood-affected direct economic losses (in 2009) was 4.43. As can be seen from Figure 1 and Figure 2, both the flood disaster-stricken population and flood-affected direct economic losses may show some periodicity over time. However, since the number of samples was limited, this cyclical change still requires further study.
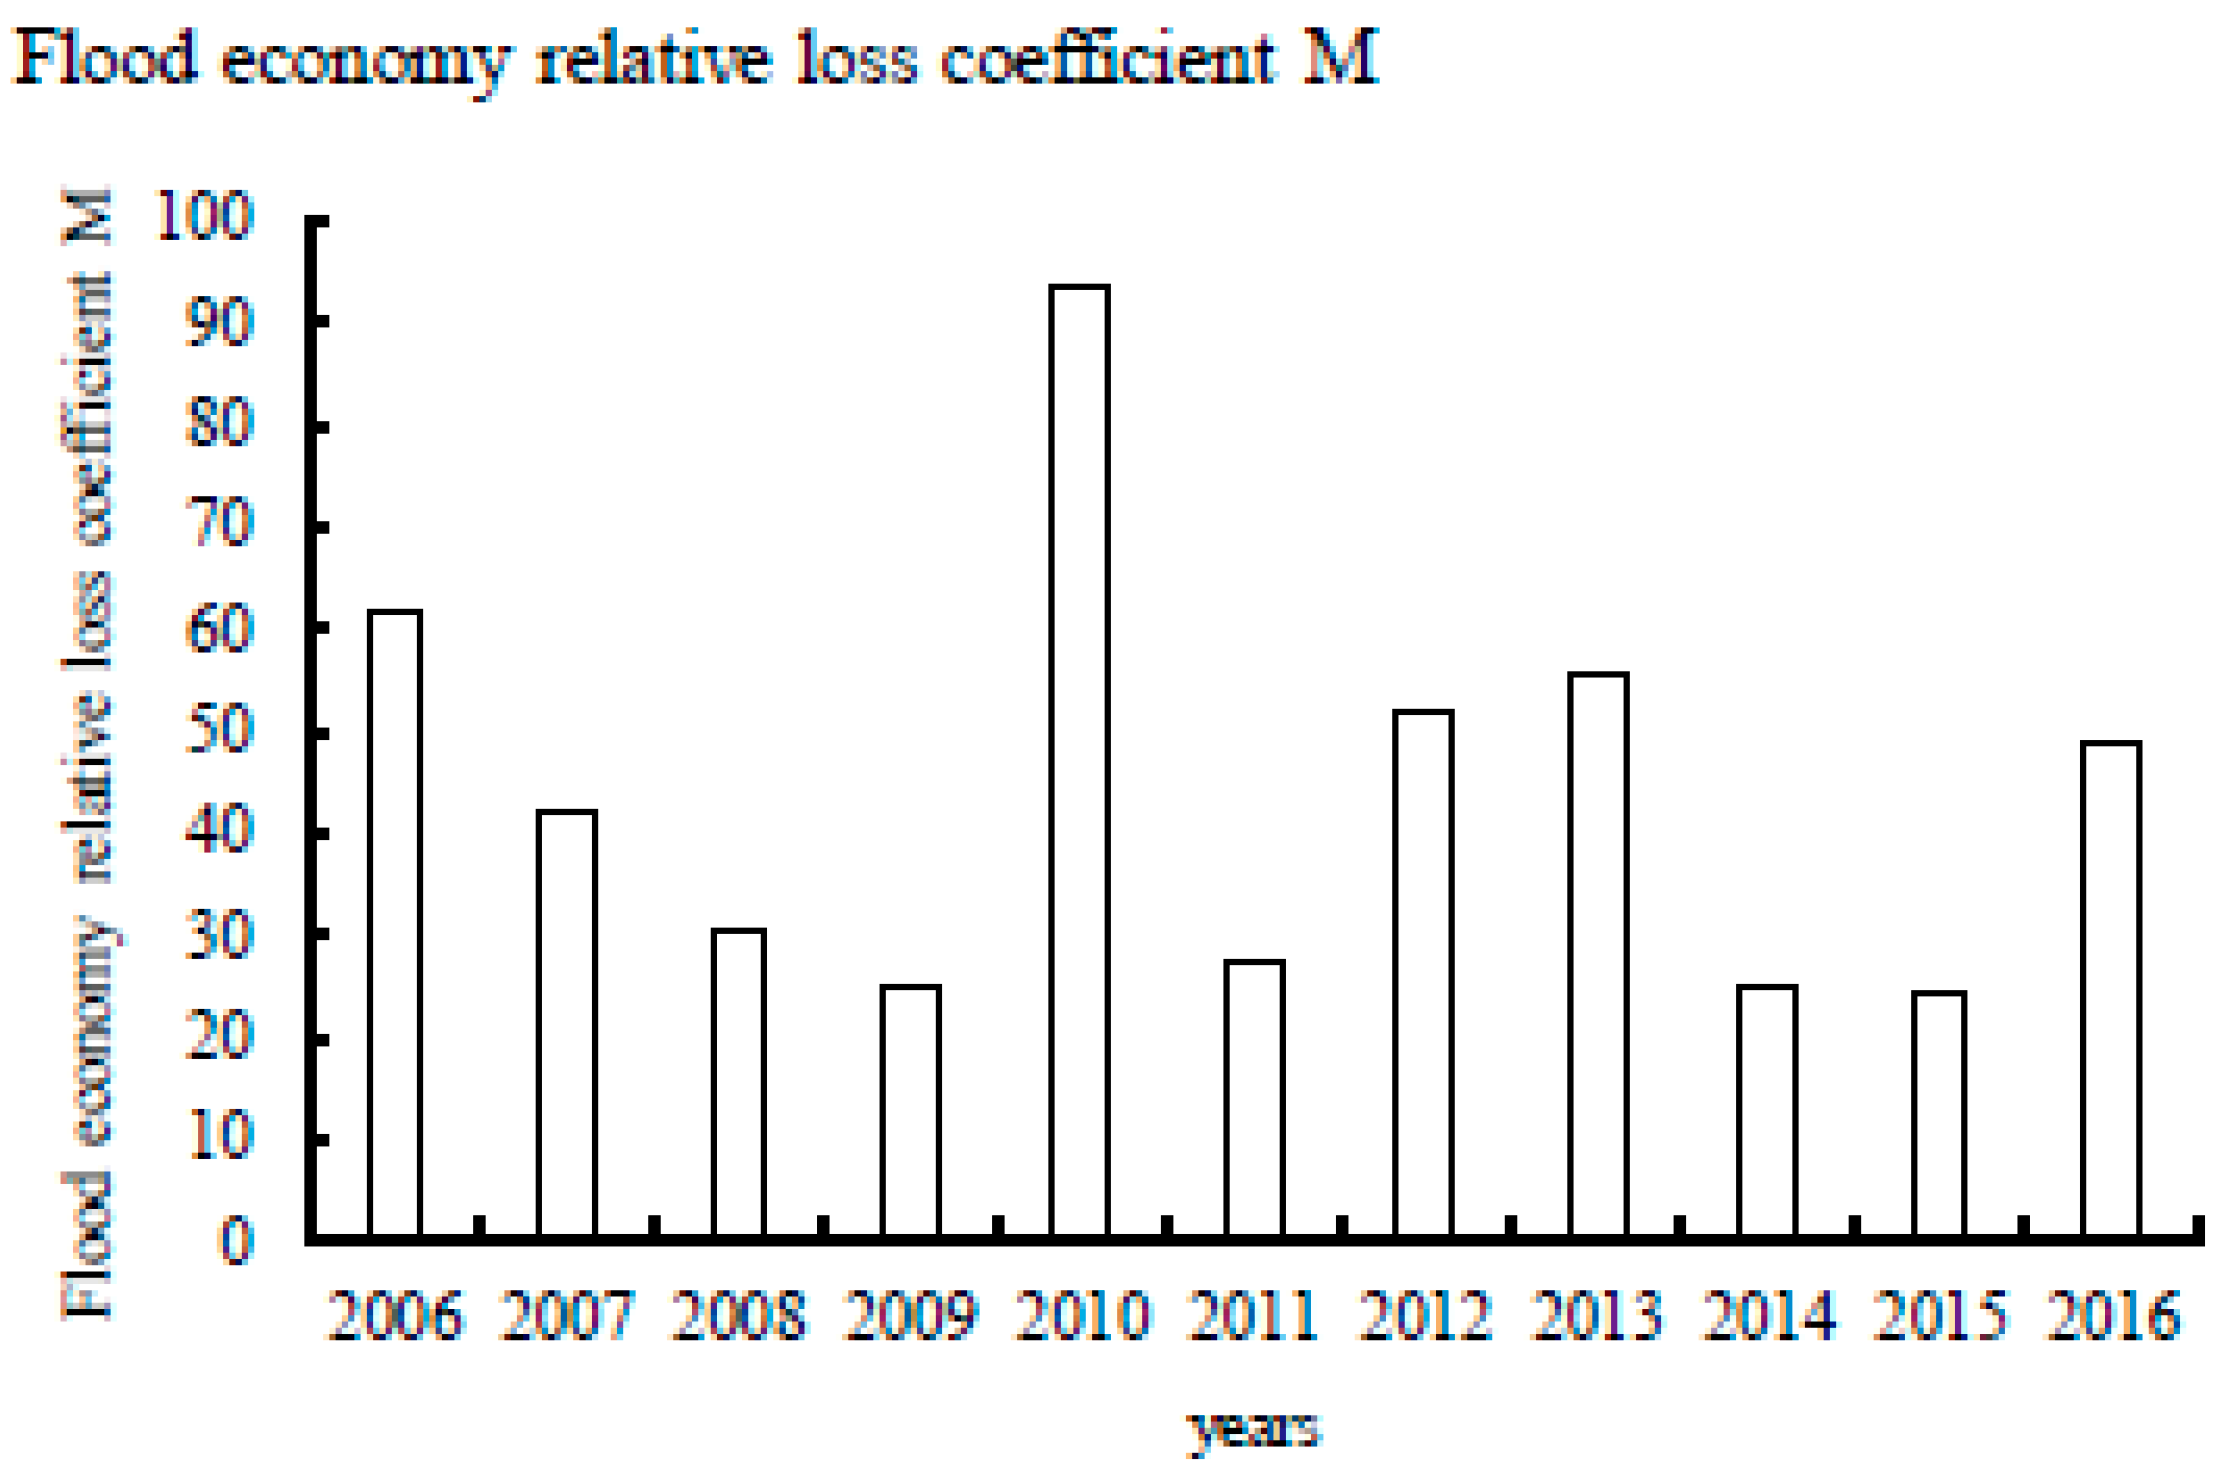
Considering the impact of flood and waterlogging disasters on China’s economic and social development, the relative coefficient of economic losses affected by floods and waterlogging (M) has been established [7]. The expression is shown as follows:
M = D i r e c t   e c o n o m i c   l o s s e s   o f   f l o o d   a n d   w a t e r l o g g i n g   d i s a s t e r s   i n   t h a t   y e a r   ×   10000 G r o s s   d o m e s t i c   p r o d u c t   o f   C h i n a   i n   t h e   y e a r
where M indicates the impact of direct economic losses caused by floods and waterlogging in a year on national economy [7]. Since the gross domestic product of China in 2017 has not yet been released by the National Bureau of Statistics, the relationship between the relative coefficient of flood-affected economic losses and time was drawn for the known data from 2006 to 2016, as shown in Figure 3. From Figure 3, it can be observed that the relative coefficient of economic losses affected by floods and waterlogging had a significant decreasing trend before 2010 and there was an abrupt change in 2010, which suggests that the occurrence of extreme weather that year led to serious losses due to flood disasters. However, the relative coefficient of economic losses affected by floods and waterlogging after 2010 varied greatly from year to year, and did not show a crucial increasing trend or decreasing trend with time.

3.2. Relationship between Precipitation and Losses Caused by Flood

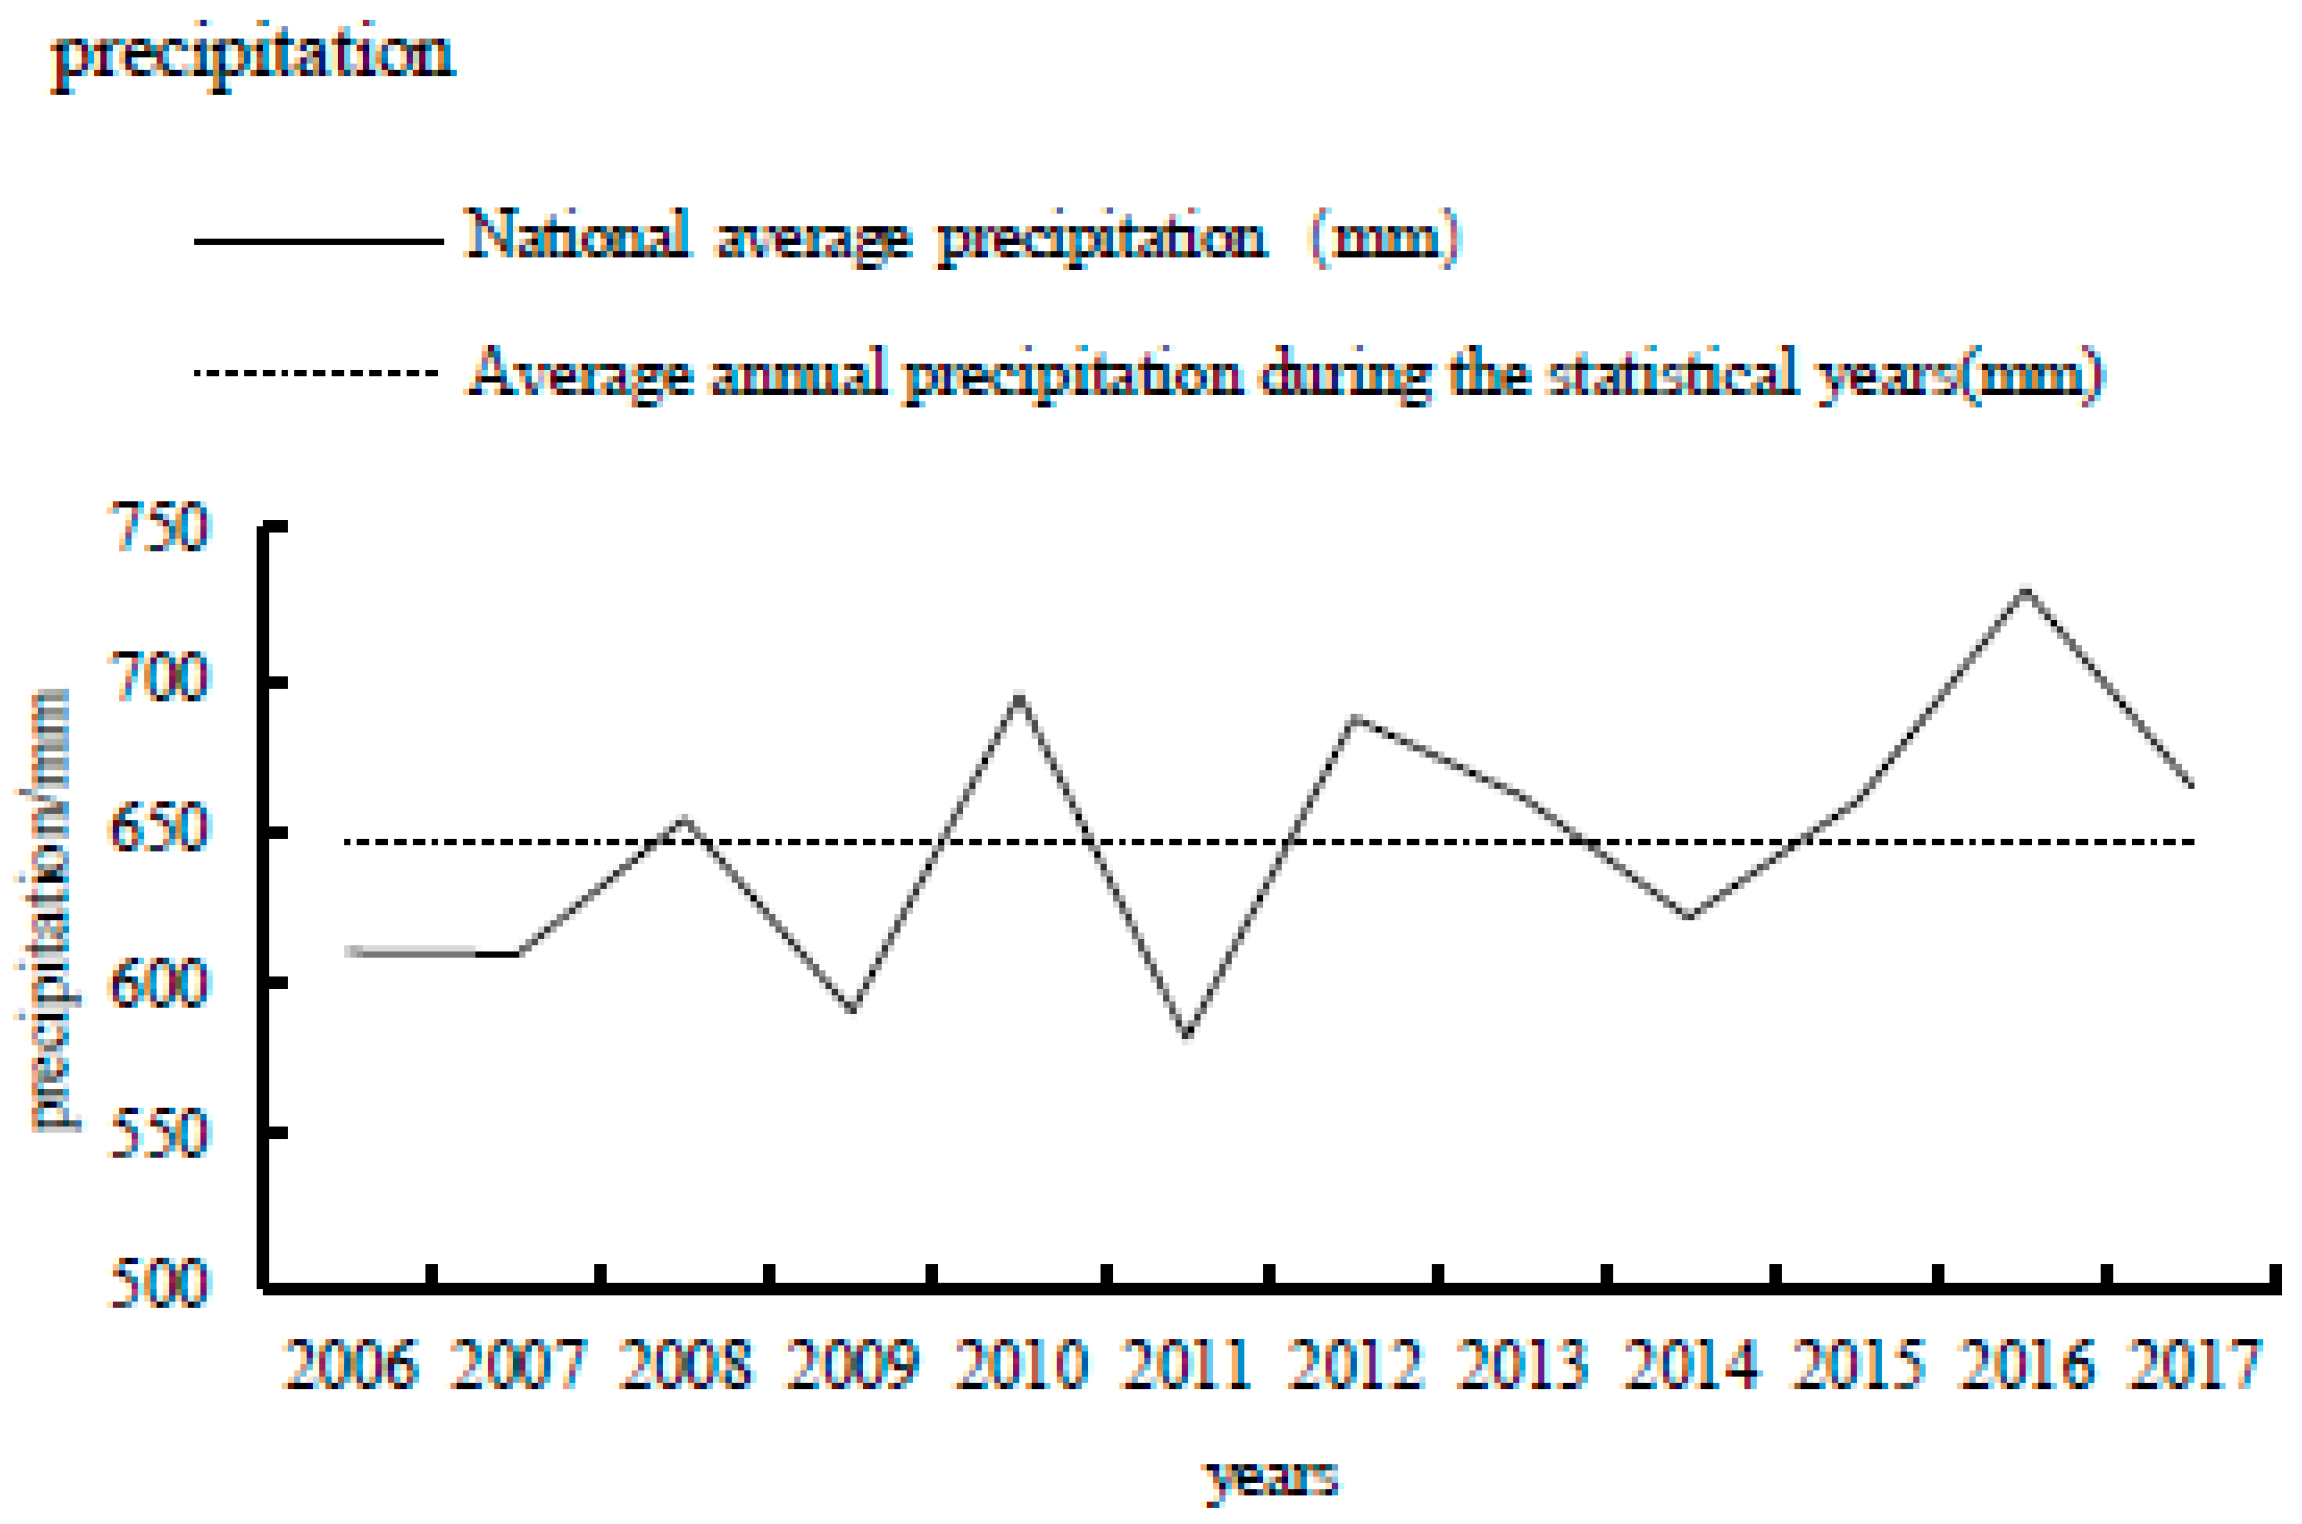
The variation of average annual precipitation in China from 2006 to 2017 is shown in Figure 4. The average annual precipitation in China from 2006 to 2017 was approximately 647.68 mm, and the average annual precipitation for five years was below the average precipitation, and the other seven years were above the average. Influenced by the strong El Nino in 2016, it had the largest annual precipitation at 730 mm in the past 12 years. The annual precipitation in 2010 was 695.4 mm, which was only less than in 2016, and the lowest annual average precipitation in these 12 years appeared in 2011, which was 582.3 mm. It is generally believed that precipitation is the direct cause of flooding. Thus, in 2010 and 2016, the flood-stricken population and the direct economic losses caused by floods and waterlogging were severe, while in 2011, when the precipitation was lower, the damage was relatively slight. Considering the influence of precipitation on flood and waterlogging disaster losses, the relative coefficient of economic losses affected by floods and waterlogging (M) and the disaster-stricken population were applied to establish the correlations with annual average precipitation. However, the correlation coefficient between the average annual precipitation and the flood disaster-stricken population was 0.01, and the correlation coefficient between the average annual precipitation and the relative coefficient M was 0.245, which indicates that the relationship between precipitation and flood damage is not prominent. Considering the causes, on one hand, the average annual precipitation weakens the impact of the heavy precipitation process on flood disaster caused by extreme weather; on the other hand, the flood disaster is the result of the comprehensive effect of many factors, and will also be affected by the ecological environment and human activities. For example, the shrinkage of lakes will reduce the regulation and storage of floods; the decreasing vegetation coverage will reduce water conservation capacity and lead to soil erosion, thus forming a vicious cycle of river and lake siltation [8]. In addition, the change in the urban underlying surface shortens the time of runoff yield and confluence, and the unreasonable design of rainwater pipe networks aggravates the occurrence of urban waterlogging [9].

3.3. Spatial Distribution Analysis of Flood and Waterlogging Disasters

China is located in the eastern part of Asia and the west coast of the Pacific Ocean. The territory of the country is vast, the north–south spanning latitude of the territory is nearly 50 degrees, and the east–west spanning longitude is more than 60 degrees. Thus, temperature and precipitation varies diversely in China, forming a variety of climates, so the losses caused by flood and waterlogging disasters are quite different.
The statistical data of flood and waterlogging from 2006 to 2017 for all provinces (municipalities or autonomous regions) in China are shown in Figure 5 and Figure 6. The occurrence of floods in the country had a wide range, basically occurring in almost every province (municipality or autonomous region), which led to significant losses and serious threats to people’s lives and property.
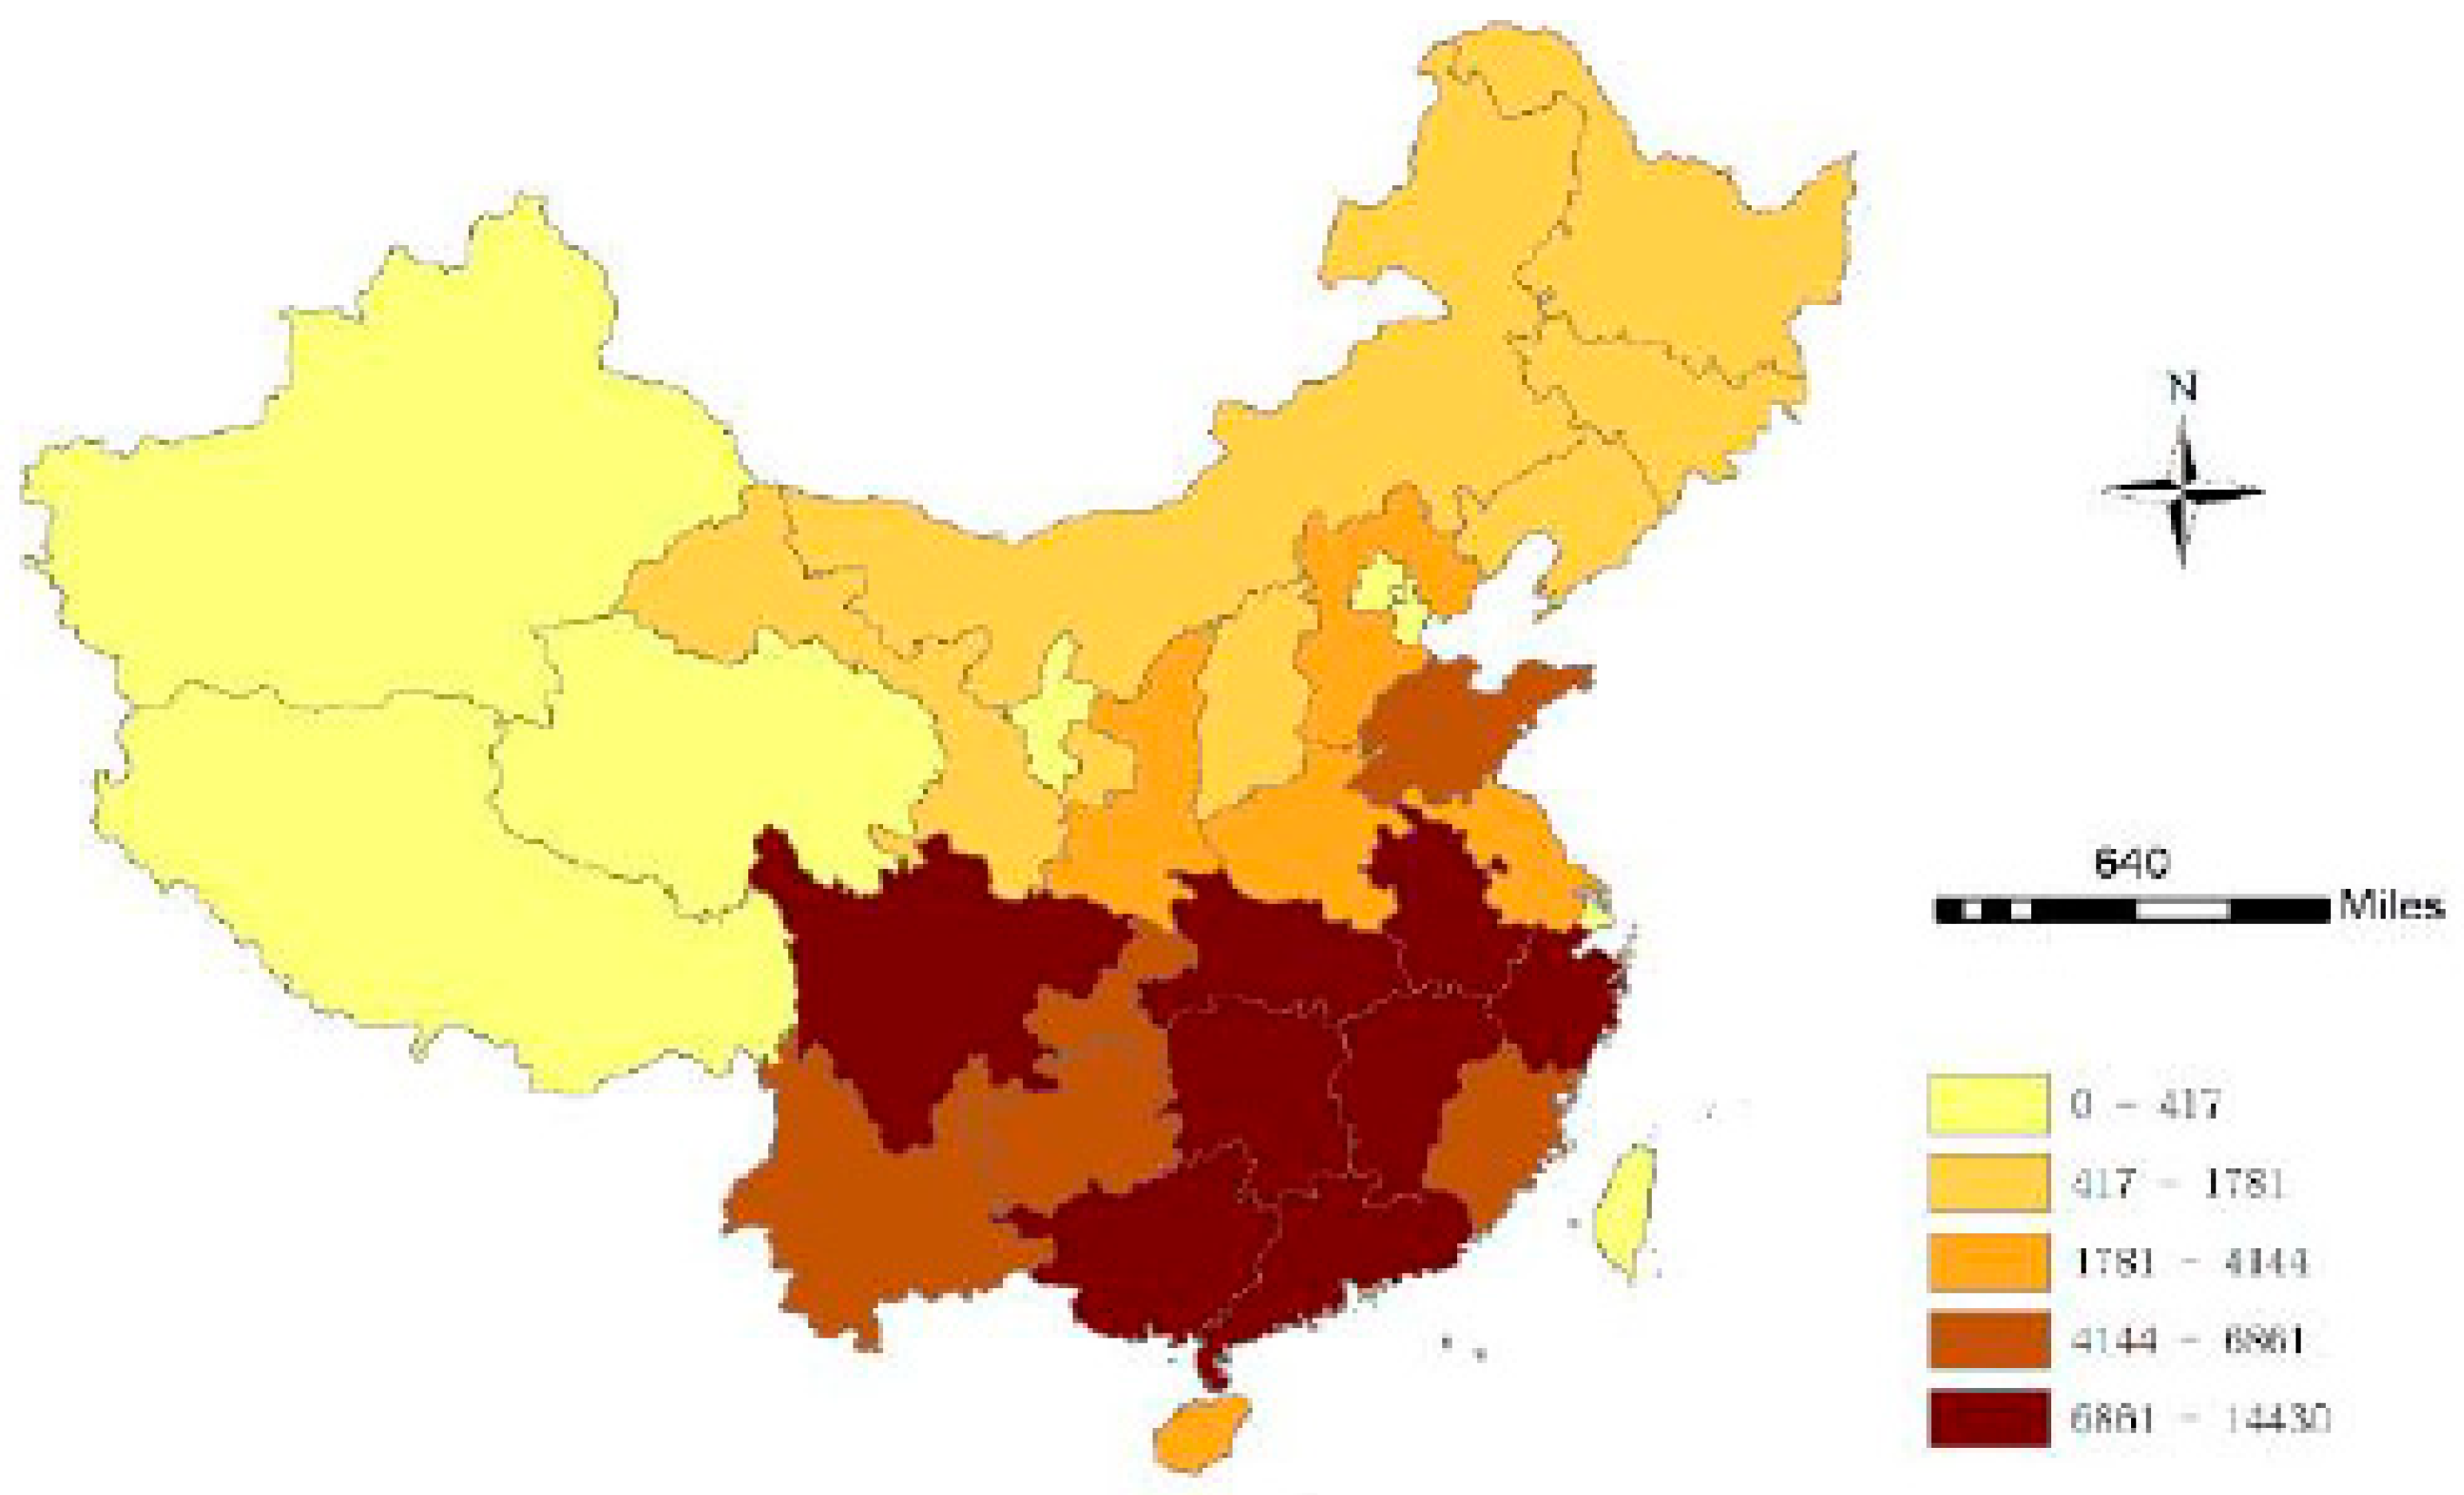
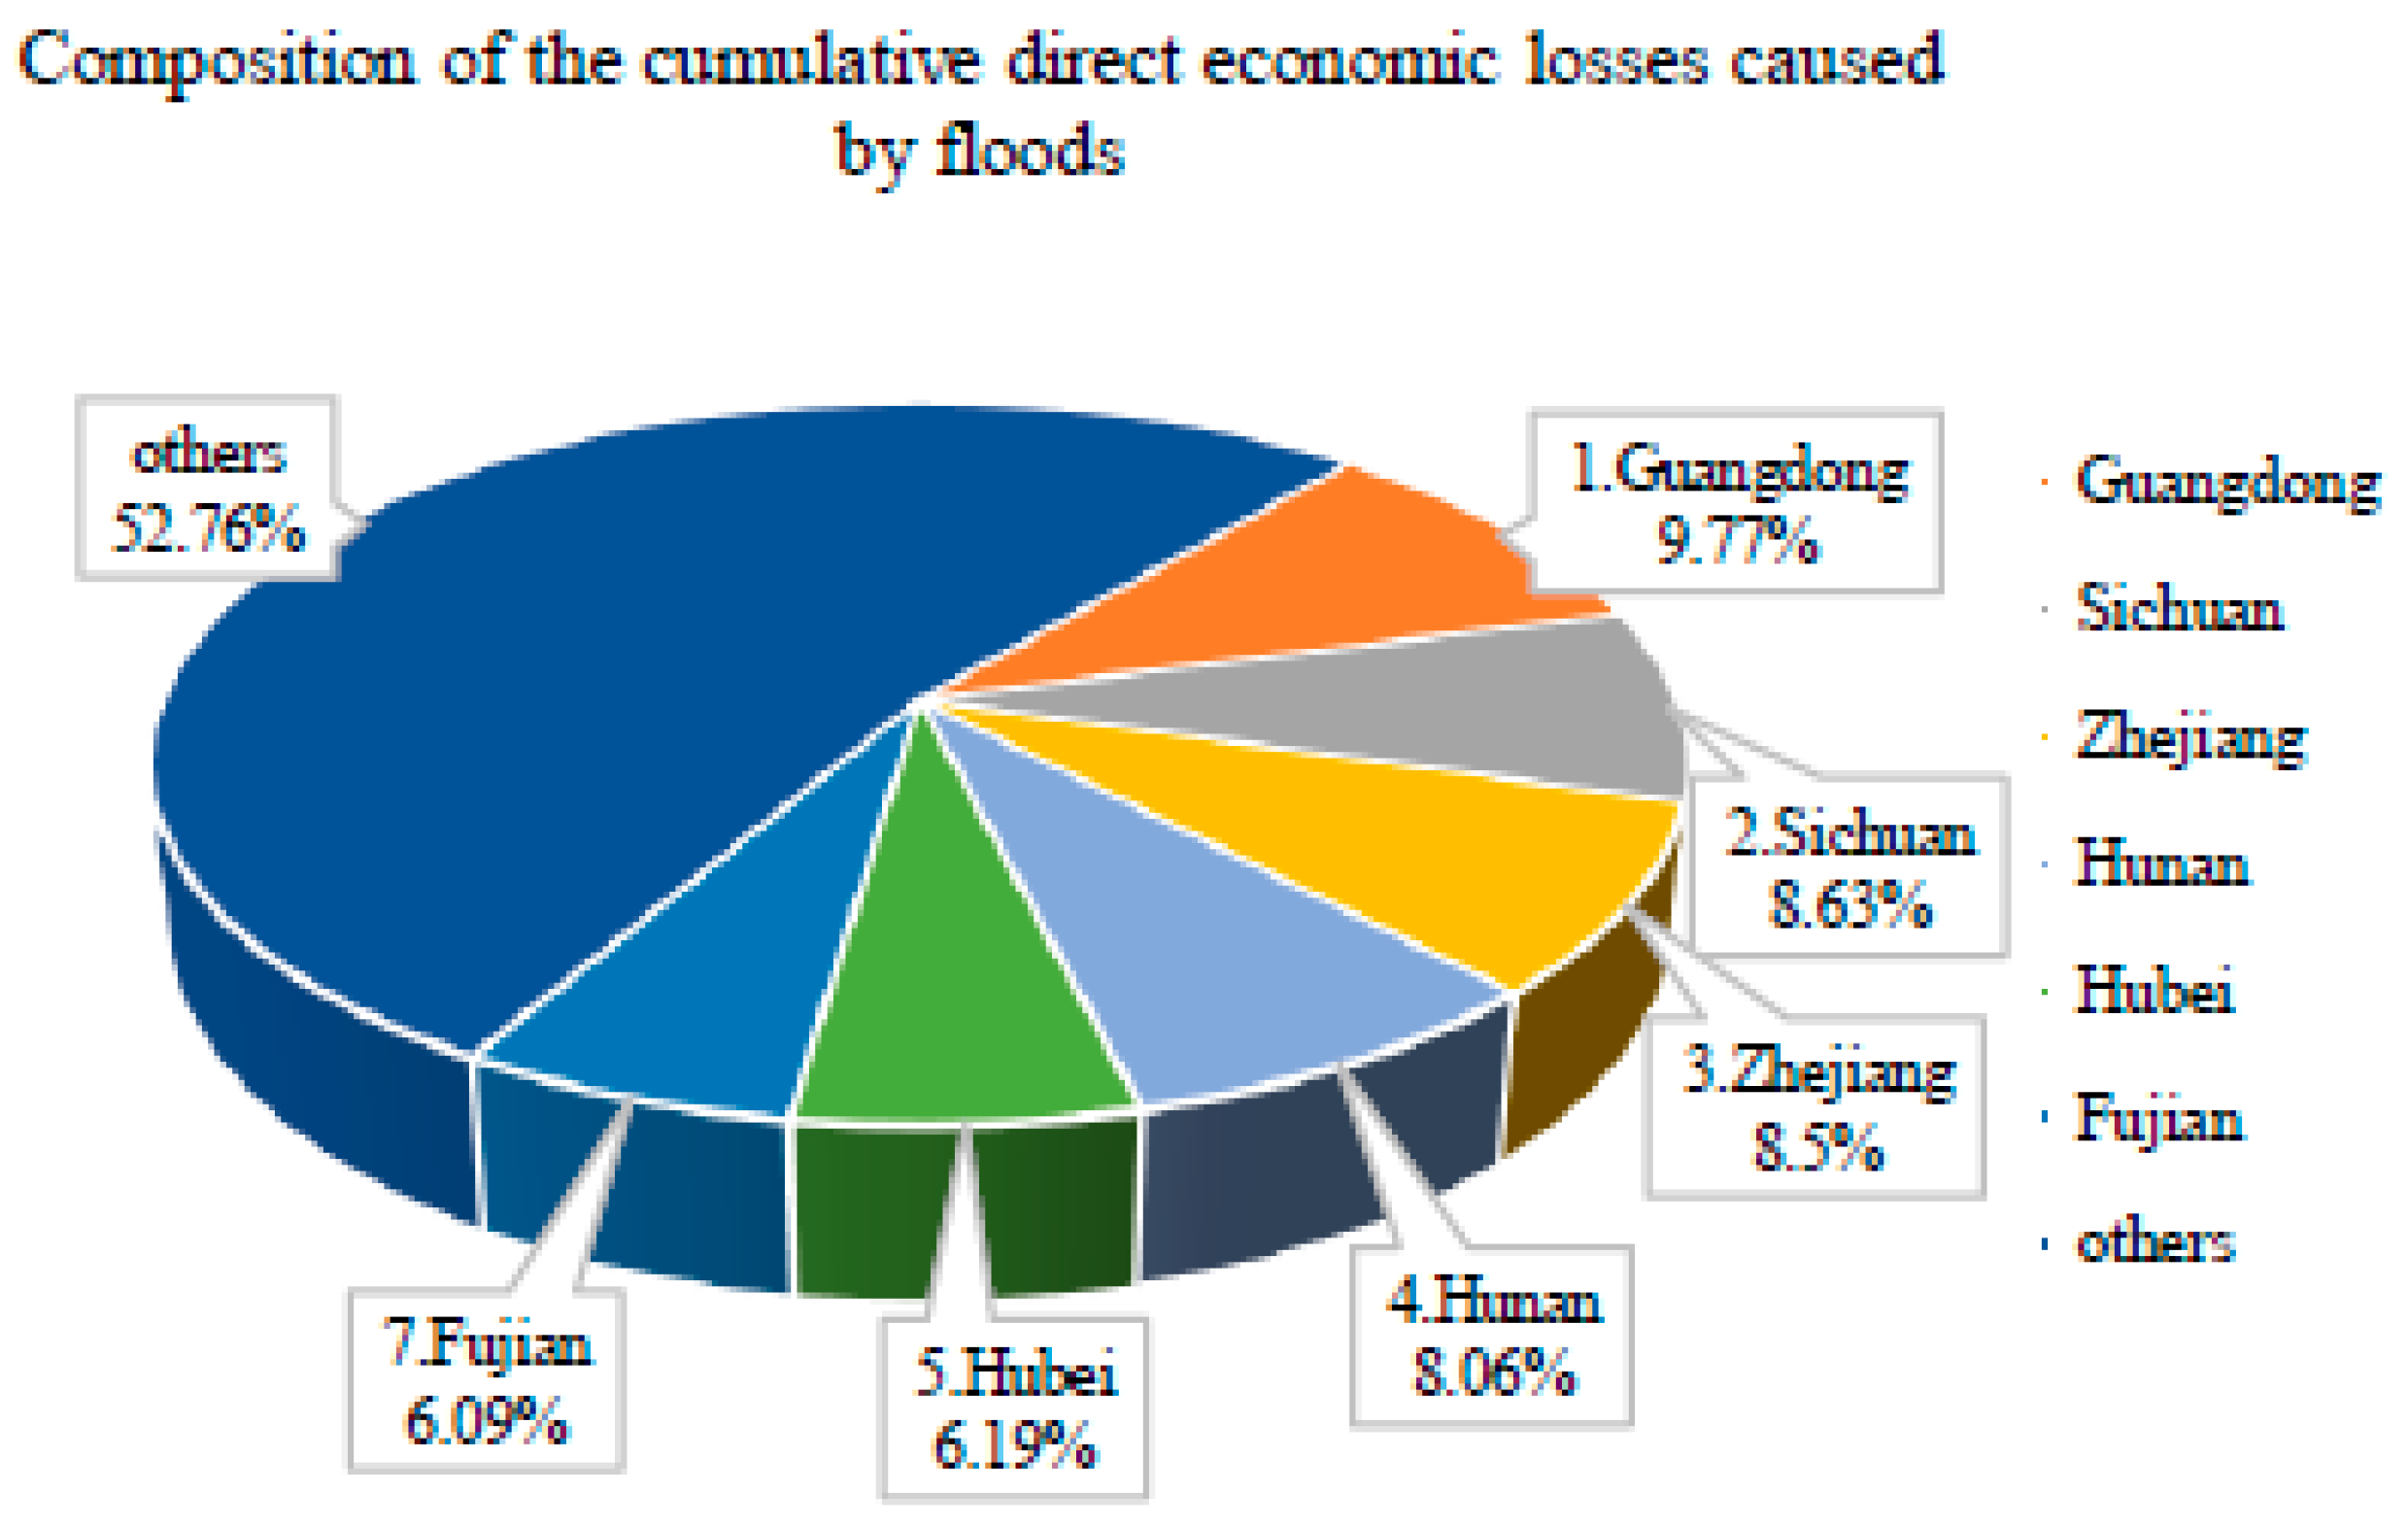
The composition and cumulative direct economic losses and the cumulative affected population by flood and waterlogging disasters in China are shown in Figure 7 and Figure 8. The top six provinces with a comparatively higher flood affected population were Sichuan, Hunan, Hubei, Guangdong, Guangxi, and Anhui (Figure 7). The flood-affected population of each of these six provinces was over 90 million, and the sum of them accounted for 50.42% of the total disaster-affected population in China from 2006 to 2017. The top six provinces with relatively higher cumulative direct economic losses caused by flood and waterlogging disasters were Guangdong, Sichuan, Zhejiang, Hunan, Hubei, and Fujian (Figure 8). The sum of direct economic losses of these six provinces accounted for 47.24% of the country’s total. Therefore, it can be concluded that due to the combined influence of monsoons and typhoons, most of China’s flood and waterlogging losses are concentrated in the eastern and southern regions.

4. Conclusions

This study conducted the analysis of losses caused by flood and waterlogging disasters in China from 2006 to 2017. The results showed that the losses caused by floods and waterlogging in China in the past 12 years were severe, especially in 2010, which was the year most affected by floods and waterlogging, and almost all provinces suffered from floods and grave losses in that year. However, by analyzing the relationship between rainfall and losses caused by flood disasters, the correlation between them was not obvious, which may be because the occurrence of flood disaster is the comprehensive effect of many factors and will also be affected by the ecological environment and human activities. By analyzing collected data based on the spatial distribution of China, the study showed that flood and waterlogging disasters led to more serious losses in the eastern and southern parts of the country, which may be mainly because these areas are affected by both monsoons and typhoons, so are more vulnerable to floods and waterlogging disasters. This study is expected to provide practical significance for understanding flood disasters and contributing to disaster resistance in the future.

Author Contributions

Z.Y. (Zhaohui Yang) and Y.L. analyzed the data; J.L. and Z.Y. (Zhiyong Yang) contributed materials; W.S., D.Y., and Y.L. wrote the paper.

Acknowledgments

This research has been financially supported by the National Key Research and Development Program of China (2018YFC1508203), the Chinese National Key Research and Development Program (2016YFC0401401), the Chinese National Natural Science Foundation (No. 51522907), and the Research Fund of the China Institute of Water Resources and Hydropower Research (No. 2017ZY02, No. WR0145B502016).

Conflicts of Interest

The authors declare no conflict of interest.

References

  1. Lv, C.R. Vulnerability Assessment of Regional Agricultural Flood Disasters—Taking Poyang Lake Area as an Example. Ph.D. Dissertation, Shanghai Normal University, Shanghai, China, April 2008. [Google Scholar]
  2. Albano, R.; Sole, A. Using FloodRisk GIS freeware for uncertainty analysis of direct economic flood damages in Italy. Int. J. Appl. Earth Obs. Geoinf. 2018, 73, 220–229. [Google Scholar] [CrossRef]
  3. Zhang, J.Y.; Wang, Y.T. Analysis of flooding problems and causes in China. AWS 2016, 27, 485–491. [Google Scholar] [CrossRef]
  4. Hui, L.Y. Make persistent efforts to win this year’s comprehensive victory in disaster relief and relief—Speech at the joint meeting of the National Flood Control and Drought Relief Headquarters and the National Disaster Reduction Committee. Disaster Reduct. China 2010, 17, 4–7. [Google Scholar]
  5. National Flood Control and Drought Relief Headquarters. Bulletin of Flood and Drought Disasters in China; China Water & Power Press: Beijing, China, 2007–2017; pp. 1–22. [Google Scholar]
  6. State Council. National 13th Five-Year Development Plan for Water Conservancy Development Reform [EB/OL]. Available online: http://www.mwr.gov.cn/ (accessed on 20 February).
  7. Zhang, H.; Xu, X.Y. Comprehensive assessment of flood disaster loss in China from 2000 to 2010 and causes analysis. J. Econ. Water Resour. 2011, 29, 5–9. [Google Scholar] [CrossRef]
  8. Kasturi, B.; Bhagirath, B. Does forest cover help prevent flood damage? Empirical evidence from India. Global Environ. Chang. 2018, 53, 78–89. [Google Scholar] [CrossRef]
  9. Dalu Mwazvita, T.B.; Shackleton Charles, M. Influence of land cover, proximity to streams and household topographical location on flooding impact in informal settlements in the Eastern Cape, South Africa. Int. J. Disaster Risk Reduct. 2018, 28, 481–490. [Google Scholar] [CrossRef]
Figure 1. Changes of the flood-affected population from 2006 to 2017.
Proceedings 07 00025 g001
Figure 2. Changes of direct economic losses caused by floods from 2006 to 2017.
Proceedings 07 00025 g002
Figure 3. Changes of the relative coefficient of economic losses from floods from 2006 to 2016.
Proceedings 07 00025 g003
Figure 4. Annual average precipitation changes from 2006 to 2017.
Proceedings 07 00025 g004
Figure 5. Distribution of accumulated flood-affected population from 2006 to 2017 in China.
Proceedings 07 00025 g005
Figure 6. Distribution of accumulated direct economic losses caused by floods from 2006 to 2017 in China.
Proceedings 07 00025 g006
Figure 7. Composition of the cumulative population affected by floods in China.
Proceedings 07 00025 g007
Figure 8. Composition of the cumulative direct economic losses caused by floods in China.
Proceedings 07 00025 g008

