Proceeding Paper

Hydrometeorological Extremes in a Warmer Climate: A Local Scale Assessment for the Island of Crete †

by
Manolis G. Grillakis
and
Aristeidis G. Koutroulis
*
School of Environmental Engineering, Technical University of Crete, 731 00 Chania, Greece
*
Author to whom correspondence should be addressed.
Presented at the 3rd International Electronic Conference on Water Sciences, 15–30 November 2018; Available online: https://ecws-3.sciforum.net.
Proceedings 2019, 7(1), 22; https://doi.org/10.3390/ECWS-3-05818
Published: 15 November 2018
(This article belongs to the Proceedings of ECWS-3)

Abstract

:
A future warmer atmosphere indicates that precipitation will increase as a consequence of the higher humidity concentrations. According to the Clausius–Clapeyron relationship, precipitation increases by a factor of 7% per degree of warming. However, recent studies have shown that increase in precipitation extremes can exceed this scaling rate. In this regard, we focus on the flash flood prone area of Crete by analyzing high resolution precipitation records form a dense network of meteorological stations to see if the relationship of precipitation and dew point temperature lies within the Clausius–Clapeyron theory. We then use simulation outputs of a “present day event” from a set of very high resolution (about 2 km grid spacing) convective permitting regional climate models (CPRCM) to investigate if the models are able to capture intense convection and thus accurately simulate extreme precipitation events over Crete. A second set of simulations for the present day event, but with a perturbation of +2 °C, is used to examine intensity changes and to see what similar events might look like in a future weather. We finally focus on a high impact flash flood event that occurred on 17 October 2006, and we study changes in hydrological impacts. Information developed in this study can advance local scale knowledge in the context of climate change adaptation and appropriate risk management.

1. Introduction

One of the staple findings in the Fifth Assessment Report of the Intergovernmental Panel on Climate Change (IPCC) [1] is that the warming of the climate system is unequivocal, with many of the recently observed changes being unprecedented over decades to millennia. It has been discussed that the global annual mean precipitation is constrained by the energy balance in the atmosphere [2]. However, with an increasing global mean temperature trend over the 21st century, it is virtually certain (probability >99%) that in the long term, global precipitation will also increase on average [3]. In theory, the Clausius–Clapeyron (CC) equation estimates that in the range of typical lower troposphere temperatures, the saturation vapor pressure increases by a rate of 7%/K of temperature increase [4]. This relationship gives a useful indication about the magnitude of expected changes in future precipitation rates in a warmer atmosphere [2,5]. However, for short temporal scales, many studies have examined CC rates derived from high resolution precipitation records (rain gauges, rain radars) or climate model simulations, showing that the obtained scaling rate may far exceed the Clausius–Clapeyron (CC) theory. For example, recent studies by Bao et al. [6] and Manola et al. [7], have shown that increase in precipitation extremes can exceed this scaling rate in Australia and the Netherlands, respectively. These findings are of increased importance, as changes in short-duration precipitation extremes can cause significant changes in the probability of extreme hydrologic events [8].
To manage the risk of high impact rainfall-runoff events in the context of climate change adaptation, local scale knowledge is required, being sufficiently reliable and custom-tailored to support decision making. Crete is a semi-arid island located in the eastern Mediterranean, with complex and steep topography, prone to high impact, localized very intense, convective rainfall and highly seasonal precipitation patterns [9]. Such an event occurred on 17 October 2006 in Almirida region [10], at the western part of the Island. The total measured rainfall for the event was approximately 200 mm with the majority of precipitation occurring within 7 h. This precipitation accumulation corresponds to a 100-year return period event and resulted to a flash flood with a unit peak discharge of the order of 8 m3 s–1 km−2 at a watershed of 25 km2 (peak discharge ~200 m3 s–1). The downstream part of the watershed experienced severe unexpected flooding leading to one casualty and extended damages to property and infrastructure.
In this study, we assess the effect of the saturation vapor pressure increase to the precipitation intensity based on high temporal resolution data from meteorological stations, and we compare our estimates with the rate of the CC theory. To obtain the correlation, we use data of precipitation and dew point temperature from 30 weather stations located in the island of Crete. The resulting precipitation intensity—dew point temperature relationship derived from observations was then used to scale/offset the extreme precipitation event of 17 October 2006, to higher dew temperatures (an analogue storm event of a warmer climate). Our results were also compared with simulations performed by three convection permitting regional climate models (CPRCM) used to simulate the same storm event. The simulations were conducted under the reference climate and under future conditions, by applying a +2 °C warming perturbation to the boundaries. The high resolution convective permitting regional climate models (CPRCMs) were able to adequately capture the main features (timing, magnitude, and location) of the intense precipitation. The precipitation fields that resulted from pattern scaling, based on observed data and from the high resolution CPRCM simulations, were used to drive a spatially distributed setup of the Hydrologic Modeling System (HEC-HMS) hydrological model, simulating the Almirida flash flood event. Comparative results of the present day and the 2 °C warmer climate were obtained and discussed.

2. Results

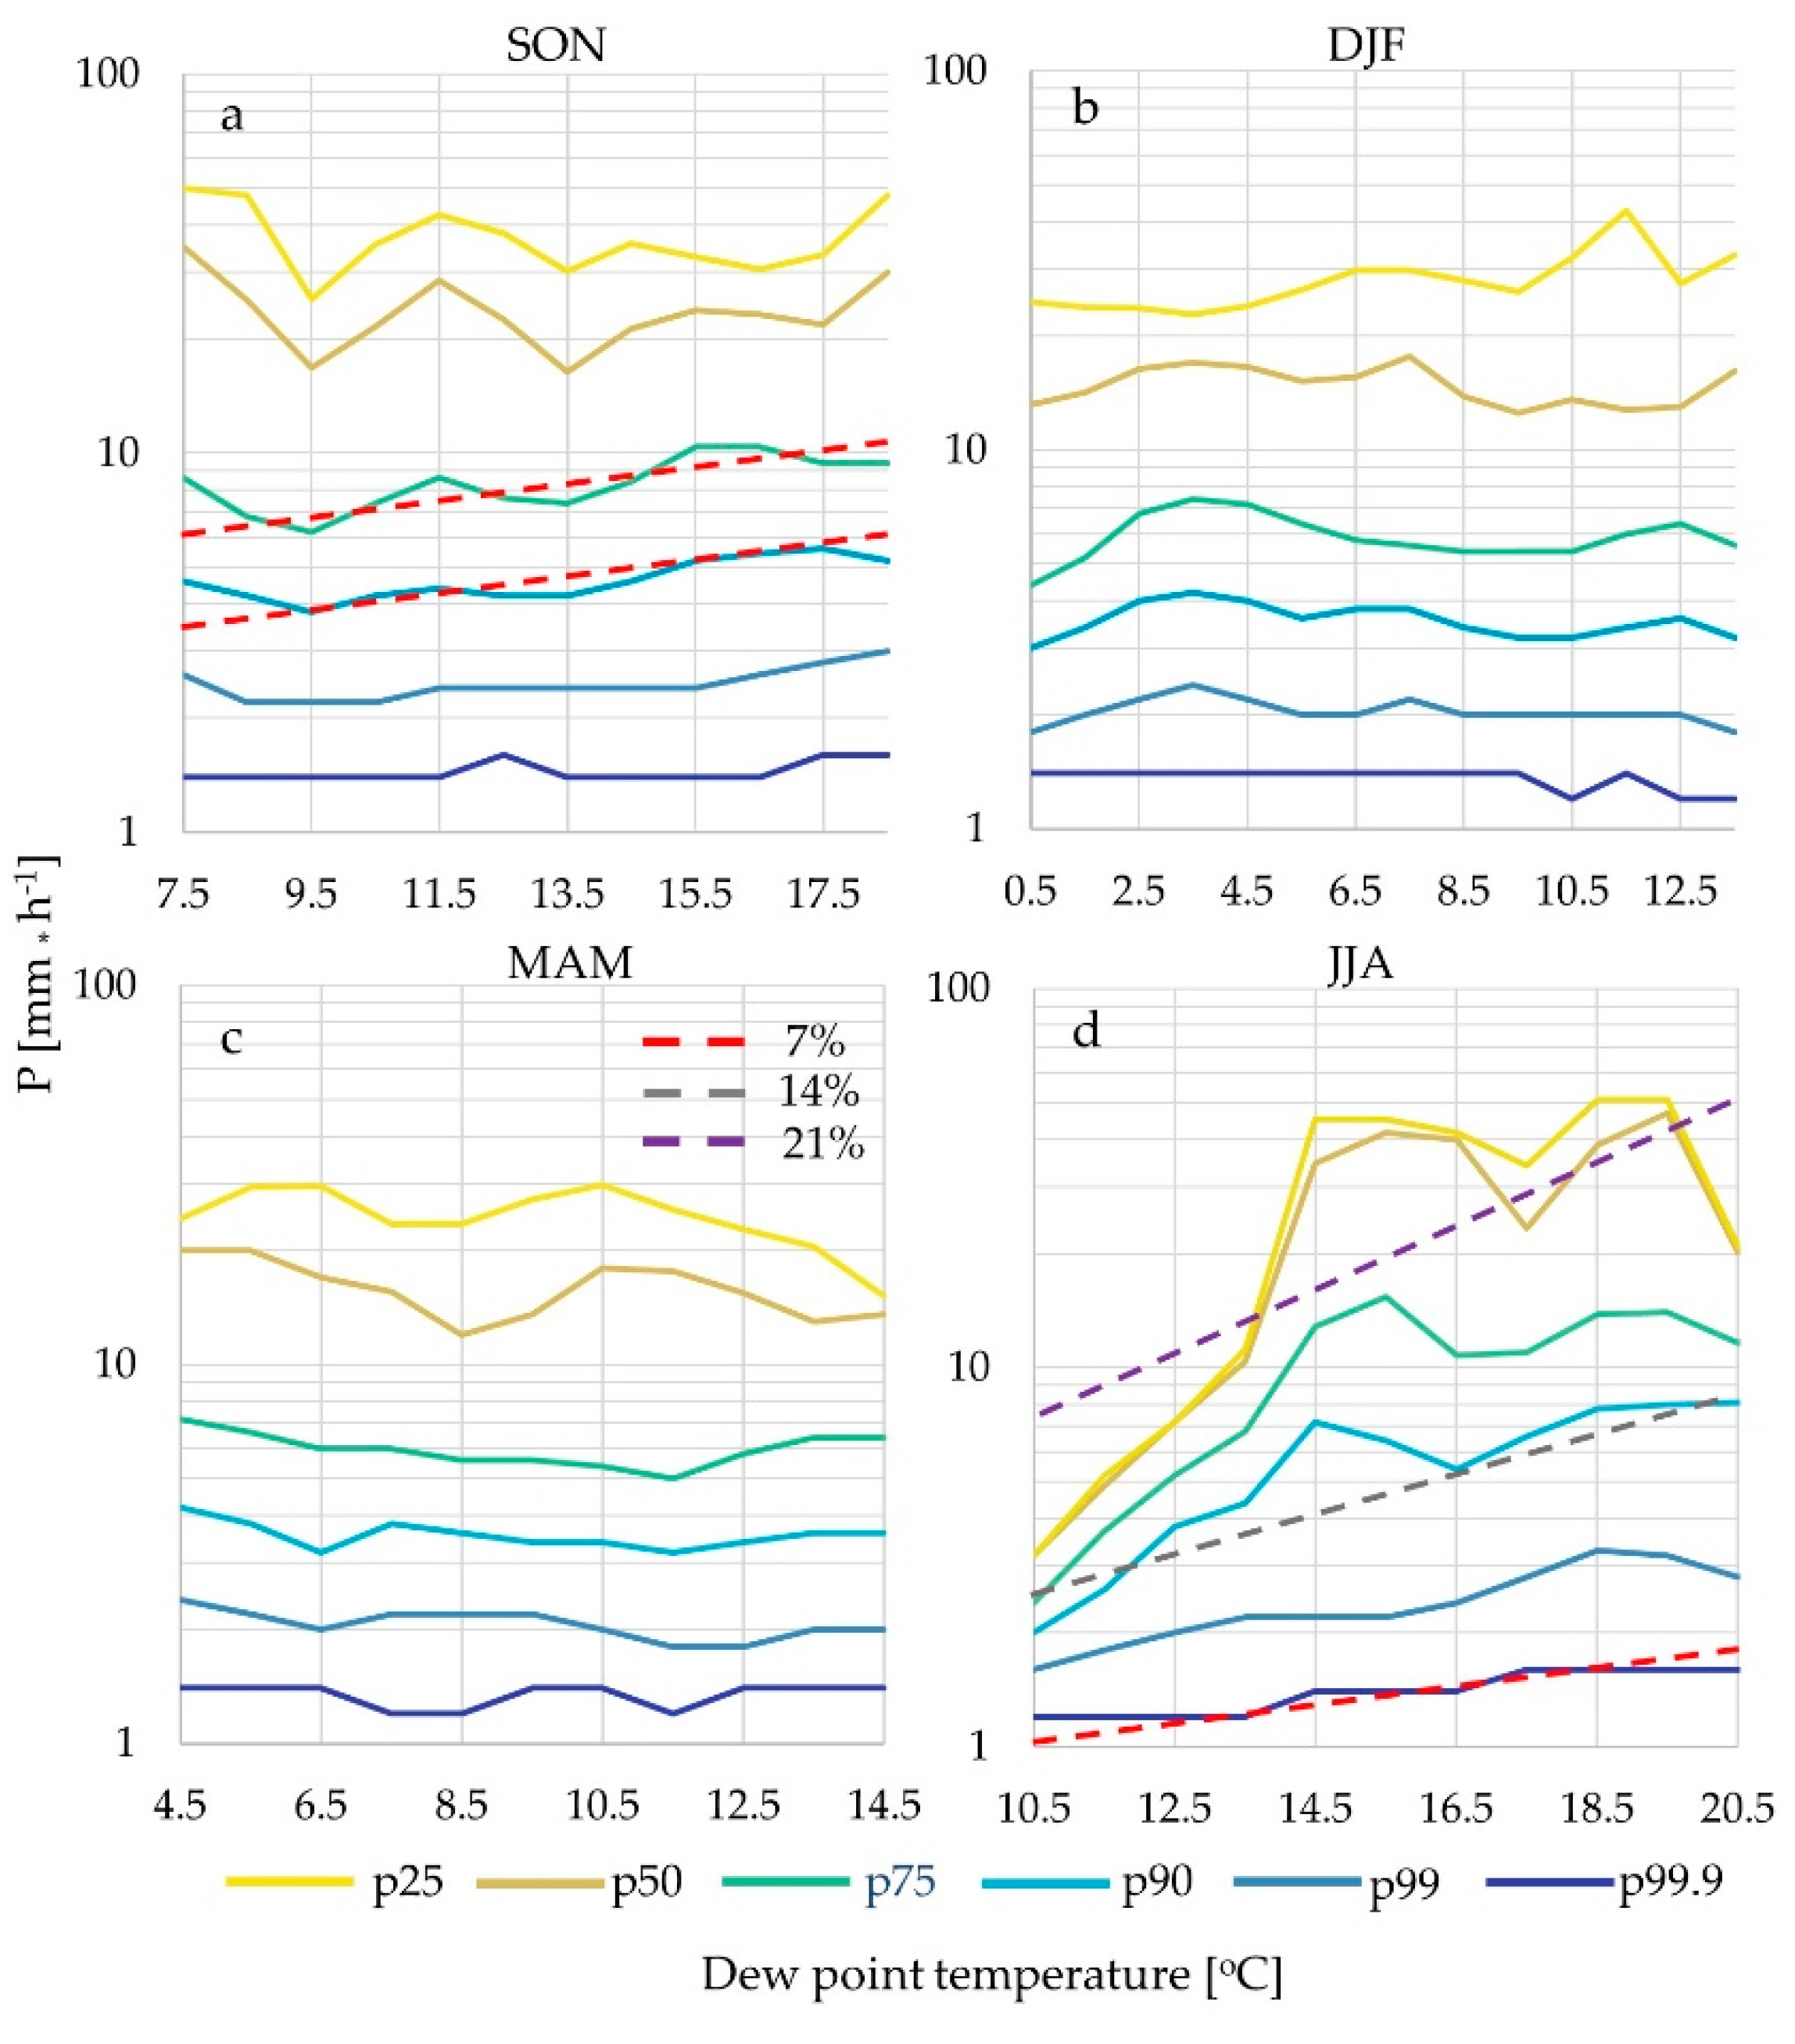
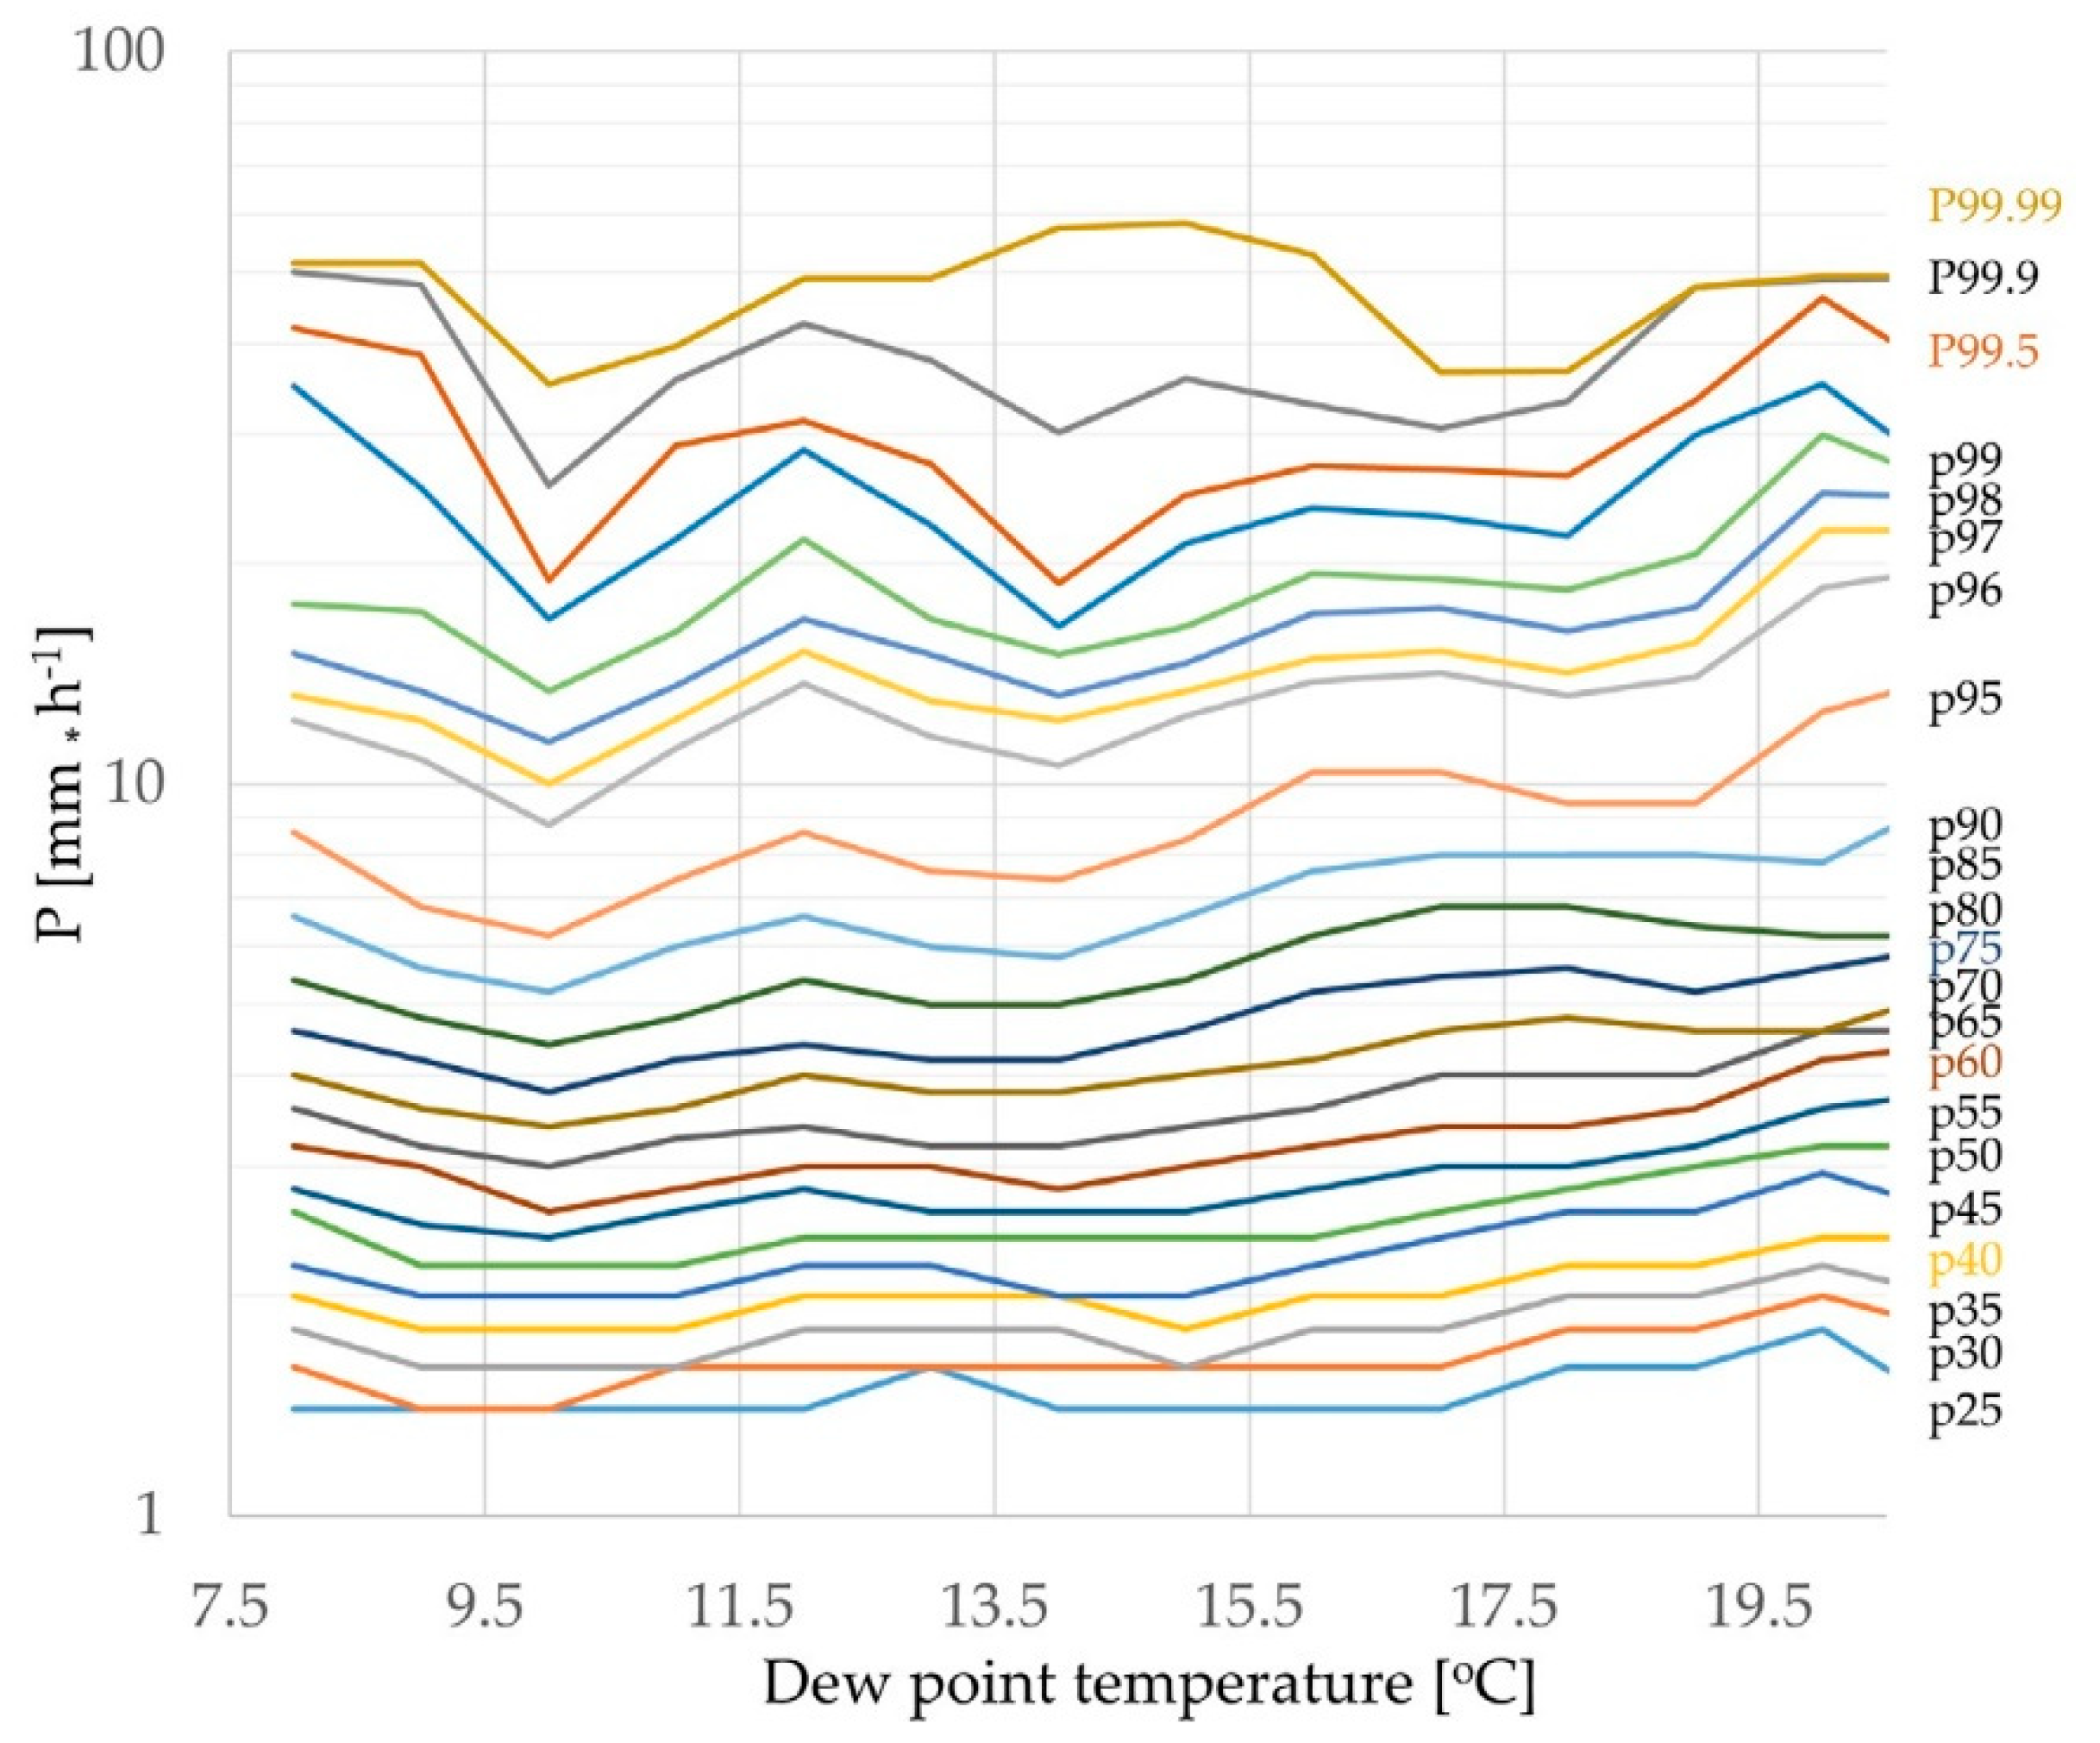
2.1. Precipitation Intensity as a Function of the Dew-Point Temperature

The relationship between the precipitation intensity (mm h−1), calculated by hourly accumulations at a 10-minute recording time step, and the dew point temperature (°C) are shown in Figure 1, for each season. The results show a diverse scaling behavior for each season, which is related to the different nature of precipitation occurrence (convective/stratiform/orographic). For Crete, during the cold winter months, the majority of the precipitation occurs in the form of stratiform and orographic, and less on convective. In contrast, during the summer months the rare precipitation occurrence is usually triggered by increased evaporation over the warm Mediterranean Sea, causing convection patterns with high convective available potential energy that can result to torrential rainfall and locally severe thunderstorms. This explains the higher rates of change in the June – July – August (JJA) (Figure 1d). In the September to November period, both forms of precipitation occur, hence the slope of the correlation is milder than the summer. Figure 2 is the same as Figure 1a, but with higher detail in terms of precipitation percentiles. Table 1 includes the slopes for each precipitation percentile illustrated in Figure 2.
The established relationships between precipitation and dew point temperature were used to scale the precipitation of the 17 October 2006 reference event to a +2 °C event. Comparison of the reference climate and the scaled future precipitation is shown in Figure 3. The scaled observations at +2 °C show a 12% increase in the total accumulated precipitation with a 47% increase in the 15-min peak precipitation. The CPRCM runs (also shown in Figure 3) simulated a 30% (HCLIM), 17% (HARMONIE), and −7% (WRF) change in the total depth of the precipitation for the +2 °C climate. The respective changes in the peak 15-min precipitation were estimated at 40%, 35%, and 40%. Absolute values of precipitation are shown in Table 2.

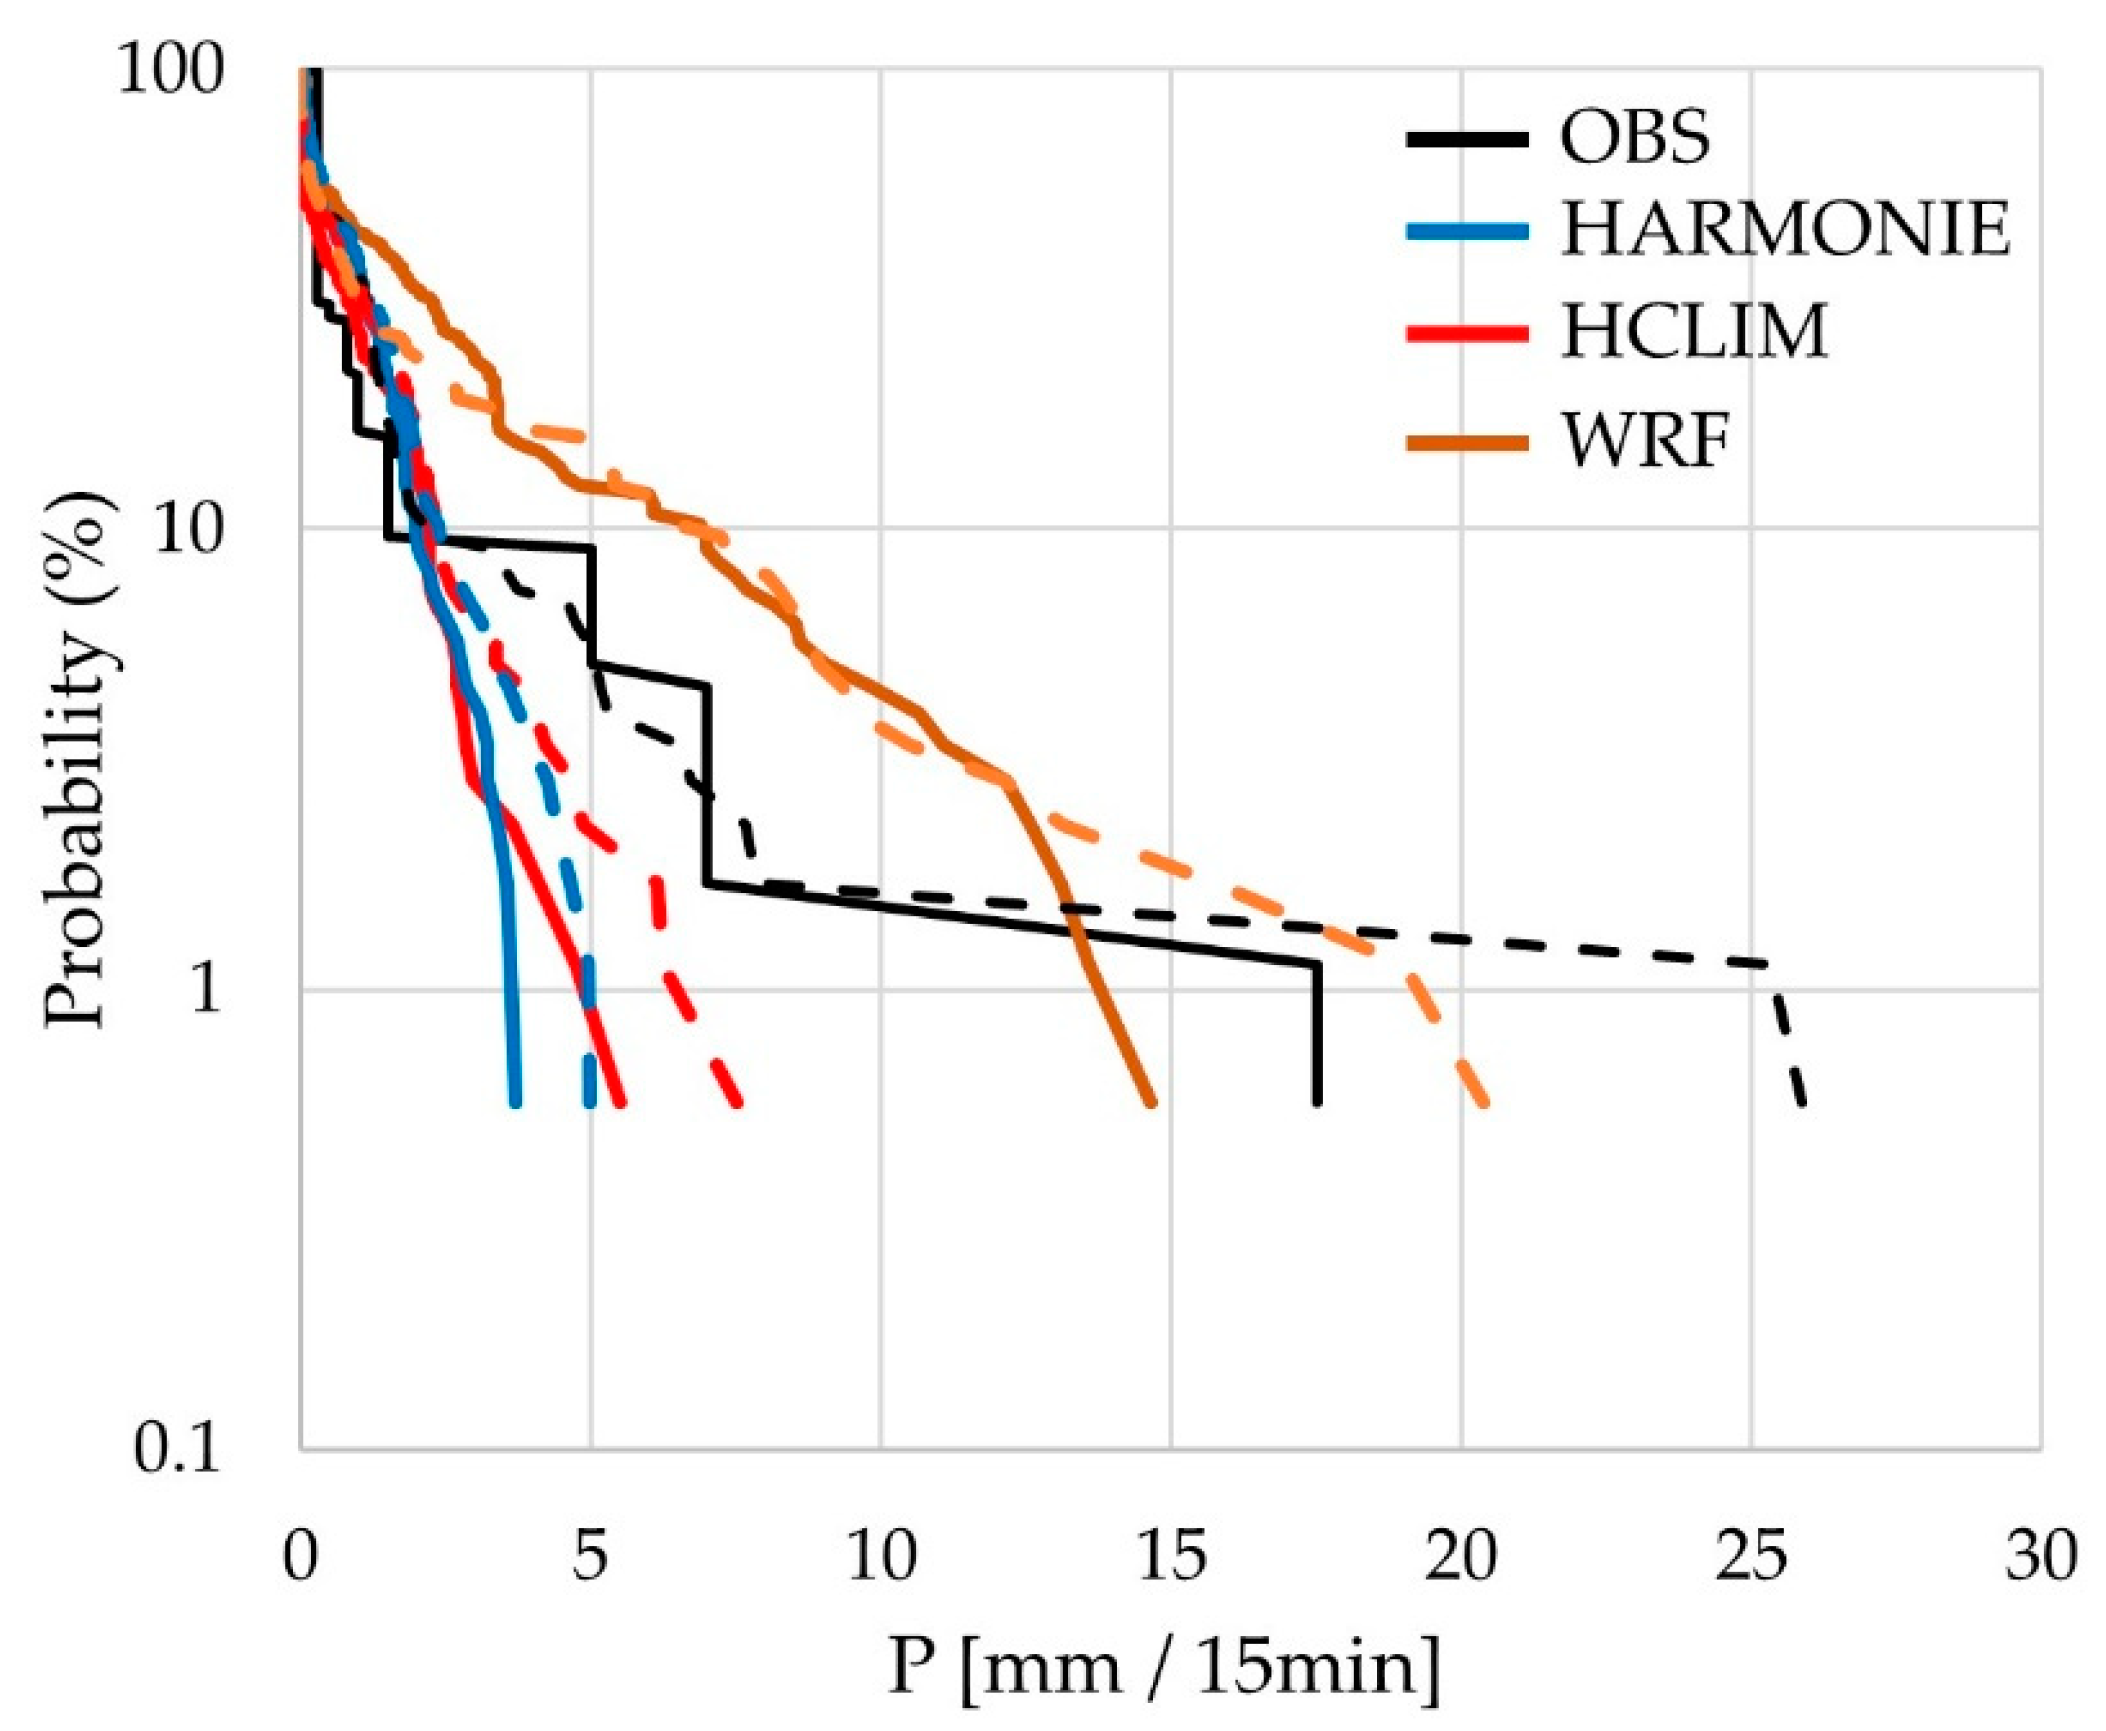
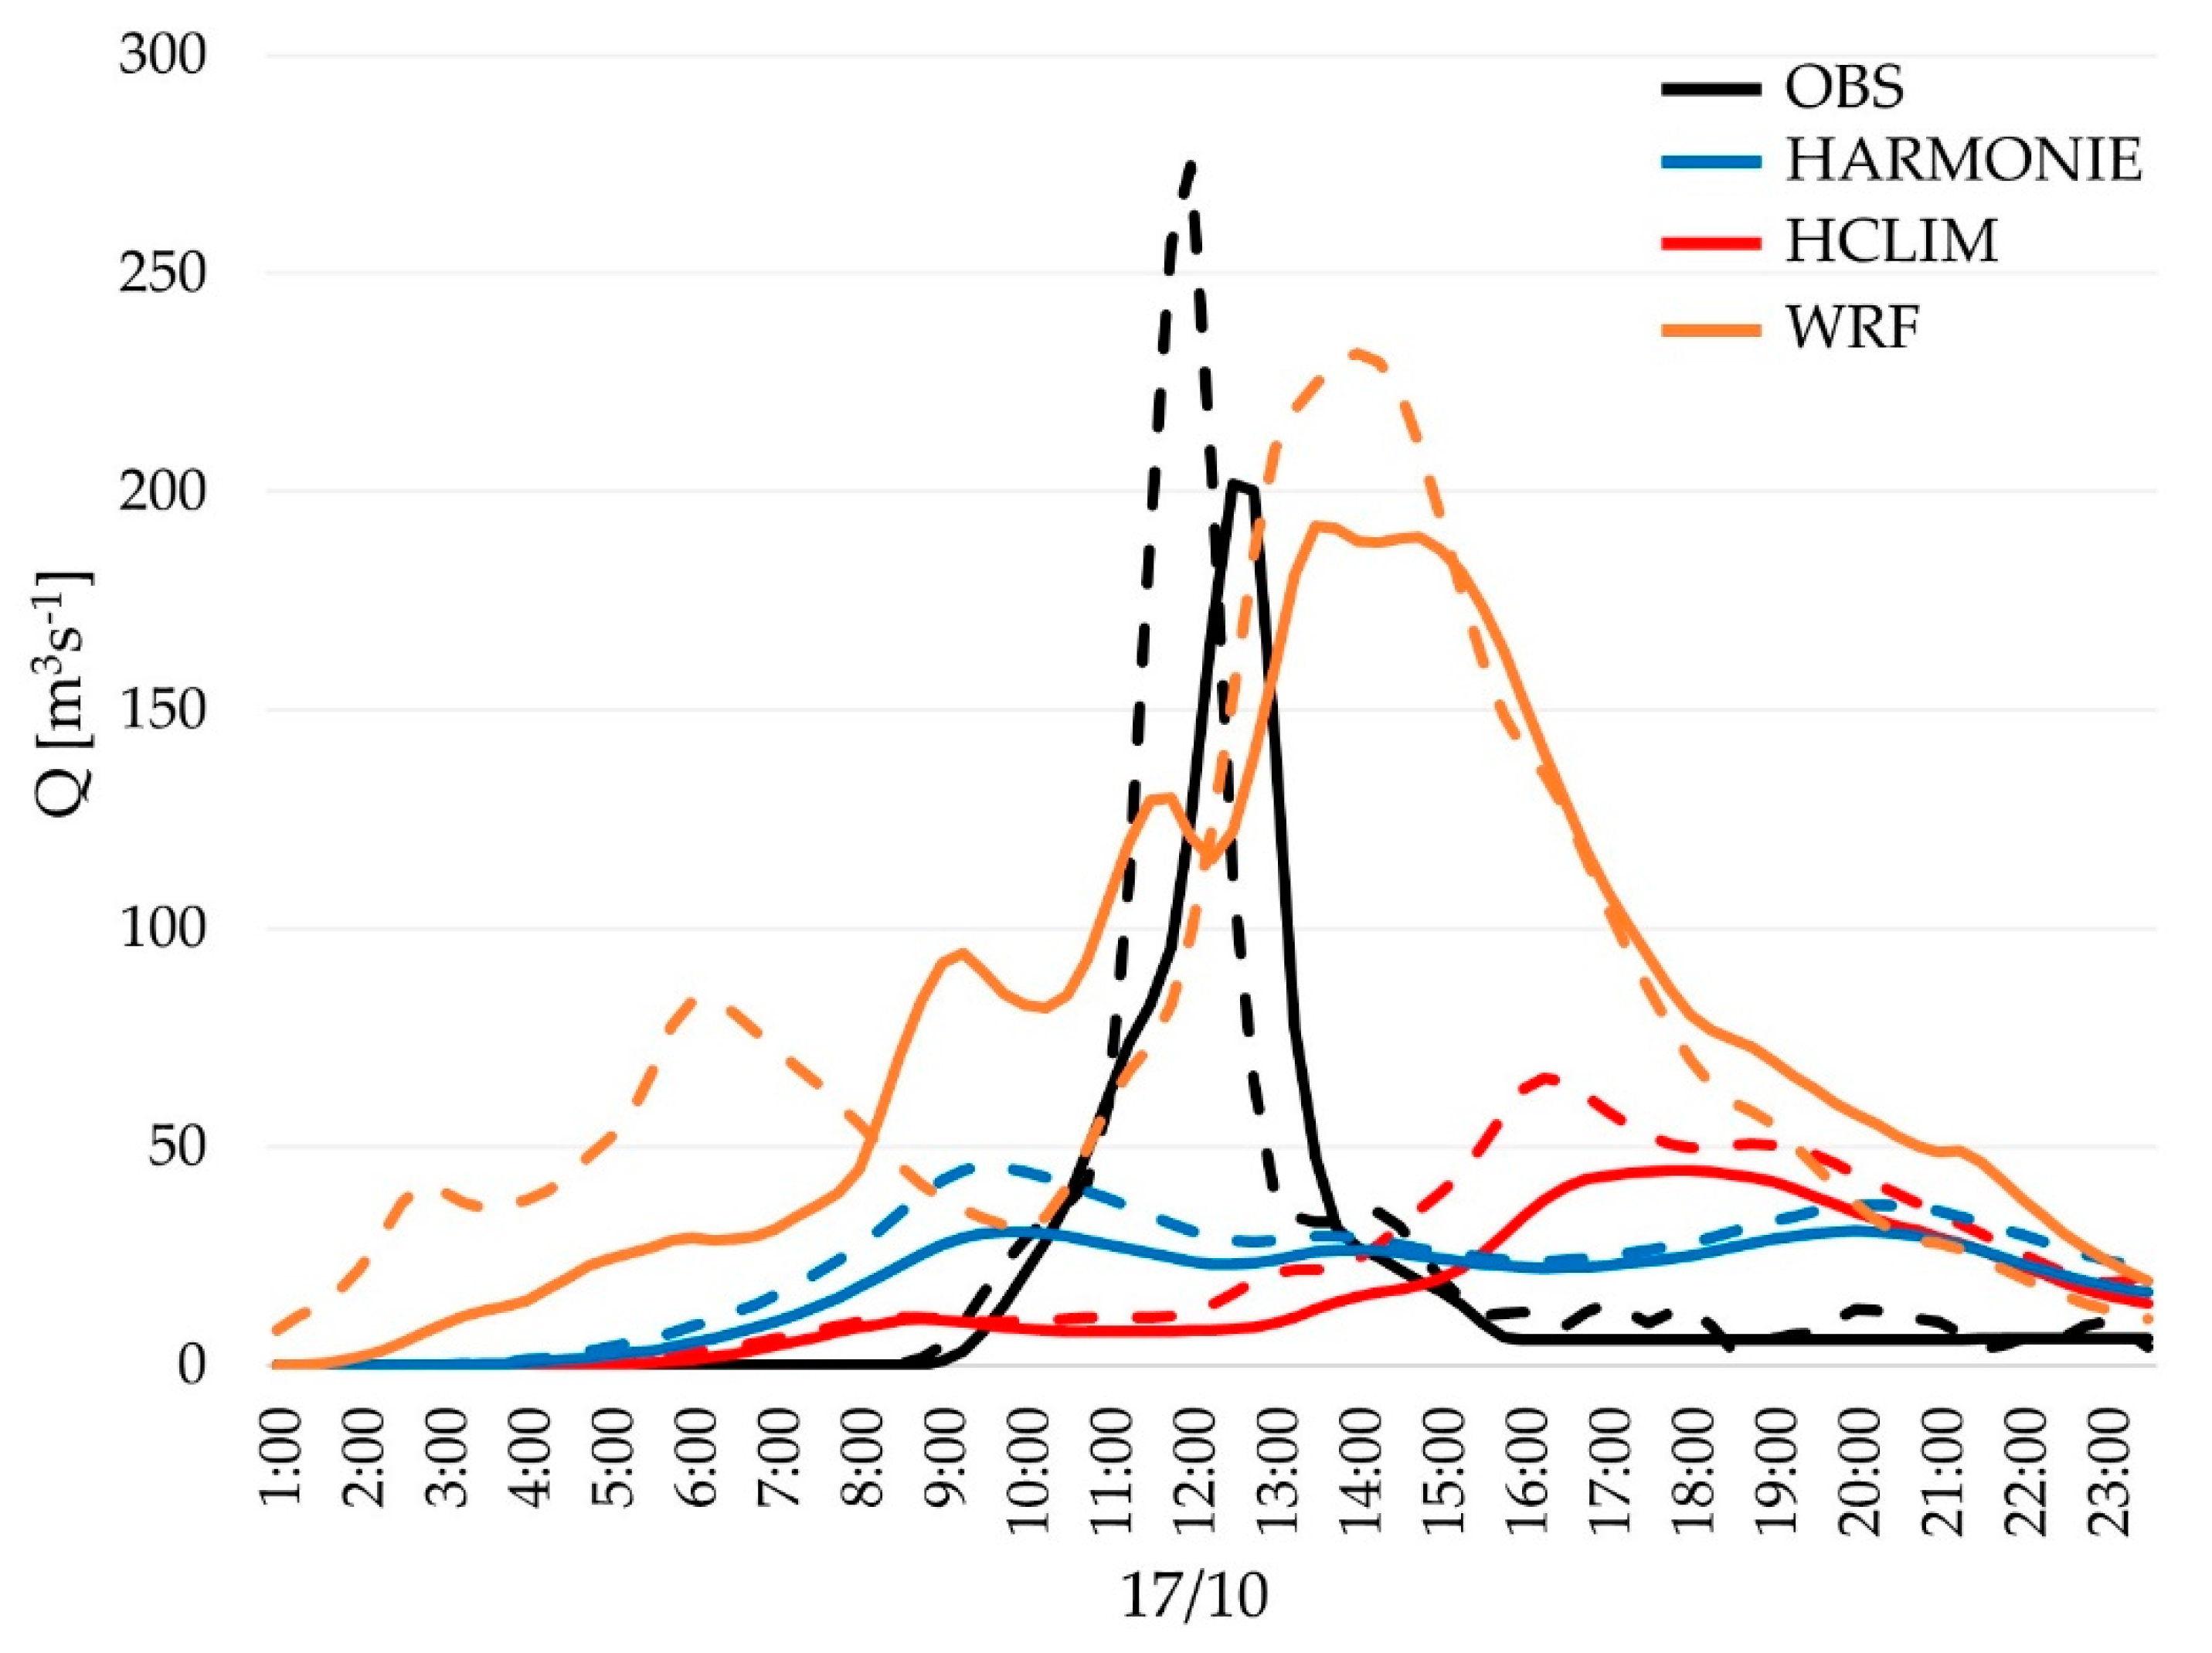
2.2. Hydrological Simualtions Comparison

The different precipitation realizations for the present day and the warmer climate were used to drive a calibrated rainfall-runoff model for simulation of the hydrologic response of the flash flood event. The results show significant increase in the peak discharge due to a potential +2 °C warming. The simulation of the scaled observations at +2 °C showed a 36% increase in the peak discharge. Similar changes also derived from the perturbed simulations at +2 °C CPRCM, with an increase in the peak discharge by 47% (HCLIM), 49% (HARMONIE), and (WRF) 20%. The hydrological simulations driven by WRF data were found to be closer to the observations, in terms of magnitude and timing of peak discharge.

3. Discussion

Analysis of the precipitation intensity and dew point temperature showed diverse results for the different seasons analyzed. This is in line with [7], which denotes that the correlation can vary with region, season, duration, and form of precipitation, and is different for low and high temperatures, ranging from below CC rate or exceeding it by far.
While large discrepancies were found among the CPRCM simulations of the reference climate, the estimated relative changes in +2 °C total precipitation and peak intensity were found to be consistent. Moreover, they were found to be consistent with the relative changes estimated between the observed data and the scaled +2 °C observations. The agreement in the relative changes is more important than the agreement in absolute values, as the latter is highly sensitive to the boundary conditions of each model setup.
The results of the hydrological simulations revealed significant increases in the flood peak that can consecutively result to higher maximum depth and wider flood inundation. The increased precipitation intensity also affected the timing of the peak discharge.

4. Materials and Methods

Precipitation and dew point temperature observations were obtained from 30 weather stations operating on the island of Crete (10 min gauging frequency). The operation period of each station varied between 0.1 and 5.6 years. The total length of the data from all weather stations was used to establish precipitation—temperature correlation was 101 years of records. The correlation was assessed using the methodology described in [7], which considers hourly precipitation data and dew point temperature, four hours prior the precipitation occurrence.
CPRCM data were provided by the HARMONIE (SMHΙ), HCLIM (ΚΝΜΙ), and WRF (UNI) models.
  • HARMONIE is a NWP model framework that contains a suite of physical parameterization packages, developed to be applicable to convective permitting resolutions of ~2 km. Details about the model can be found in [11].
  • HCLIM is a different version of HARMONIE that runs in climate model setting using different physics packages [12] that enable the model to be run at very high horizontal resolution while retaining the convection parameterization.
  • WRF (Weather Research and Forecasting Model) version employed by Uni Research is a fully non-hydrostatic modeling system with the ability to resolve strongly nonlinear small scale processes. Details about the model setup can be found in [13].
Hydrological simulations were performed with the HEC—HMS 4.2 model. The model was set up using a variant of Clark’s unit hydrograph technique to accommodate for spatially distributed rainfall data. The model was calibrated to simulate the peak discharge as it was reported in [14].

Author Contributions

A.G.K. and M.G.G. conceived and designed the experiments; M.G.G. performed the experiments; M.G.G. and A.G.K. analyzed the data and wrote the paper.

Acknowledgments

We acknowledge Stefan Sobolowski (UNI), Youmin Chen (UNI), Petter Lind (SMHI), Erik Kjellström (SMHI), and David Lindstedt (SMHI) for providing the CPRCM simulations performed in the frame of the FP7 EC funded project ECLISE (Grant Agreement: 265240) and Prof. Ioannis Tsanis (TUC) for acquisition of funding.

Conflicts of Interest

The authors declare no conflict of interest.

References

  1. Field, C.B.; Barros, V.R.; Dokken, D.J.; Mach, K.J.; Mastrandrea, M.D.; Bilir, T.E.; Chatterjee, M.; Ebi, K.L.; Estrada, Y.O.; Genova, R.C.; et al. (Eds.) IPCC Summary for Policy Makers. In Climate Change 2014: Impacts, Adaptation, and Vulnerability. Part A: Global and Sectoral Aspects. Contribution of Working Group II to the Fifth Assessment Report of the Intergovernmental Panel on Climate Change; Cambridge University Press: Cambridge, UK; New York, NY, USA, 2014; pp. 1–32. [Google Scholar]
  2. Allen, M.R.; Ingram, W.J. Constraints on future changes in climate and the hydrologic cycle. Nature 2002, 419, 224–232. [Google Scholar] [CrossRef] [PubMed]
  3. Stocker, T.; Qin, D.; Plattner, G.-K.; Tignor, M.; Allen, S.; Boschung, J.; Nauels, A.; Xia, Y.; Bex, V.; Migley, P. IPCC, 2013: Summary for Policymakers, in: Climate Change 2013: The Physical Science Basis, Contribution of Working Group I to the Fifth Assessment Report of the Intergovernmental Panel on Climate Change; Cambridge University Press: Cambridge, UK; New York, NY, USA, 2013. [Google Scholar]
  4. Held, I.M.; Soden, B.J.; Held, I.M.; Soden, B.J. Robust Responses of the Hydrological Cycle to Global Warming. J. Clim. 2006, 19, 5686–5699. [Google Scholar] [CrossRef]
  5. Pall, P.; Allen, M.R.; Stone, D.A. Testing the Clausius–Clapeyron constraint on changes in extreme precipitation under CO2 warming. Clim. Dyn. 2007, 28, 351–363. [Google Scholar] [CrossRef]
  6. Bao, J.; Sherwood, S.C.; Alexander, L.V.; Evans, J.P. Future increases in extreme precipitation exceed observed scaling rates. Nat. Clim. Chang. 2017, 7, 128–132. [Google Scholar] [CrossRef]
  7. Manola, I.; van den Hurk, B.; De Moel, H.; Aerts, J.C.J.H. Future extreme precipitation intensities based on a historic event. Hydrol. Earth Syst. Sci. 2018, 22, 3777–3788. [Google Scholar] [CrossRef]
  8. Lenderink, G.; van Meijgaard, E. Increase in hourly precipitation extremes beyond expectations from temperature changes. Nat. Geosci. 2008, 1, 511–514. [Google Scholar] [CrossRef]
  9. Koutroulis, A.G.; Grillakis, M.G.; Tsanis, I.K.; Kotroni, V.; Lagouvardos, K. Lightning activity, rainfall and flash flooding—Occasional or interrelated events? A case study in the island of Crete. Nat. Hazards Earth Syst. Sci. 2012, 12, 881–891. [Google Scholar] [CrossRef]
  10. Tsanis, I.K.; Seiradakis, K.D.; Daliakopoulos, I.N.; Grillakis, M.G.; Koutroulis, A.G. Assessment of GeoEye-1 stereo-pair-generated DEM in flood mapping of an ungauged basin. J. Hydroinform. 2014, 16, 1–18. [Google Scholar] [CrossRef]
  11. Bénard, P.; Vivoda, J.; Mašek, J.; Smolíková, P.; Yessad, K.; Smith, C.; Brožková, R.; Geleyn, J.-F. Dynamical kernel of the Aladin-NH spectral limited-area model: Revised formulation and sensitivity experiments. Q. J. R. Meteorol. Soc. 2010, 136, 155–169. [Google Scholar] [CrossRef]
  12. Gerard, L.; Piriou, J.-M.; Brožková, R.; Geleyn, J.-F.; Banciu, D.; Gerard, L.; Piriou, J.-M.; Brožková, R.; Geleyn, J.-F.; Banciu, D. Cloud and Precipitation Parameterization in a Meso-Gamma-Scale Operational Weather Prediction Model. Mon. Weather Rev. 2009, 137, 3960–3977. [Google Scholar] [CrossRef]
  13. Hong, S.-Y.; Noh, Y.; Dudhia, J.; Hong, S.-Y.; Noh, Y.; Dudhia, J. A New Vertical Diffusion Package with an Explicit Treatment of Entrainment Processes. Mon. Weather Rev. 2006, 134, 2318–2341. [Google Scholar] [CrossRef]
  14. Tsanis, I.K.; Seiradakis, K.D.; Daliakopoulos, I.N.; Grillakis, M.G.; Koutroulis, A.G. Assessment of GeoEye-1 stereo-pair-generated DEM in flood mapping of an ungauged basin. J. Hydroinform. 2014, 16. [Google Scholar] [CrossRef]
Figure 1. Precipitation intensity as a function of dew point temperature for September to November (a), December to February (b), March to May (c), and June to August (d), for different percentiles (25–99.9th). Dashed lines represent the 7%, 14%, and 21% of positive correlation, or 1, 2, and 3 times the CC ratio.
Proceedings 07 00022 g001
Figure 2. Precipitation intensity as a function of dew point temperature for September to November, for different percentiles (25–99.99th).
Proceedings 07 00022 g002
Figure 3. Probability distributions of precipitation. The solid lines correspond to the present day simulations, while the dashed lines to the +2 °C weather.
Proceedings 07 00022 g003
Figure 4. Flash flood events runoff hydrographs. The full lines represent the present day simulation, while the dashed lines shows results from the warmer atmosphere.
Proceedings 07 00022 g004
Table 1. Rate of change in precipitation for each degree of dew point temperature change.
PercentileSlope [% C−1]PercentileSlope [% C−1]
250.015800.151
300.031850.253
350.034900.429
400.040950.562
450.057960.654
500.069970.735
550.081980.707
600.098990.209
650.10399.50.216
700.11099.90.250
750.14299.99−0.012
Table 2. Changes in total precipitation at event scale (* for the 17th of October) and maximum 15-min accumulated precipitation for the present day, and the +2 °C climate.
OBSOBS+2HCLIHCLI+2HARHAR+2WRFWRF+2
Total * precipitation depth (mm)193216124160147172355328
Max 15 min precipitation (mm)17.525.95.57.53.75.014.720.4

