Proceeding Paper

Analyses of Monthly Discharges in Slovakia Using Hydrological Exploratory Methods †

by
Mária Ďurigová
1,*,
Dominika Ballová
2 and
Kamila Hlavčová
1
1
Department of Land and Water Resources Management, Slovak University of Technology, Radlinského 11, 810 05 Bratislava, Slovakia
2
Department of Mathematics and Descriptive Geometry, Slovak University of Technology, Radlinského 11, 810 05 Bratislava, Slovakia
*
Author to whom correspondence should be addressed.
Presented at the 3rd International Electronic Conference on Water Sciences, 15–30 November 2018; Available online: https://ecws-3.sciforum.net.
Proceedings 2019, 7(1), 18; https://doi.org/10.3390/ECWS-3-05824
Published: 15 November 2018
(This article belongs to the Proceedings of ECWS-3)

Abstract

:
Detailed analyses of hydrological data are necessary in order to prove changes in their character. This article focuses on an analysis of the average monthly discharges of 14 stage-discharge gauging stations in Slovakia. The measured period is from 1931 to 2016. The approaches used are hydrological exploration methods, which were created by hydrologists to describe the behavior of hydrological time series. The methods are used to identify a change-point using an analysis of any residuals, the Pettitt test, and an analysis of the relationship between the mean annual discharge deviations from the long-term annual discharge and the deviations of the average monthly discharge from the long-term average monthly discharge. A considerable number of change-points were identified in the 1970s and 1980s. The results of the analyses show changes in the hydrological regimes, but to confirm the accuracy of the outcomes, it is also necessary to examine other hydrological and meteorological elements such as, e.g., precipitation and the air temperature.

1. Introduction

Changes in natural phenomena, such as increasing sea levels, global warming and increasing occurrences of extremes in hydrology and meteorology affect us and the environment. Studies directed at changes in hydrological regimes are of great importance, especially in the fields of water resources management, flood protection and the revitalization of rivers; they concentrate on maintaining the quality of aquatic habitats or minimum discharges in the summer season ([1,2,3]). The article focuses on detecting changes in average monthly discharges by using two hydrological exploratory methods and Pettitt´s test. The aim of the article is to identify change-points and analyze the changes in a runoff regime. A considerable number of change-points were identified in the 1970s and 1980s. The results of the analyses show changes in the hydrological regimes, but to confirm the accuracy of the outcome, it is also necessary to examine other hydrological and meteorological elements such as, e.g., precipitation and the air temperature.

2. Materials and Methods

Slovakia belongs to the north temperate climate zone. The mean annual temperature is from 6 °C to 11 °C, and the mean annual rainfall total is from 500 mm to 2000 mm [4]. The data series used are the mean monthly discharges of 14 stage-discharge gauging stations in Slovakia (Figure 1, Table 1); all of them were measured from 1931 to 2016. The data was provided by the Slovak Hydrometeorological Institute.
Two methods were used to identify the change-points. These methods use an analysis of any residuals and Pettitt´s test.
The analysis of the residuals consists of calculating such residuals. They are calculated as the differences between the mean monthly discharges and the long-term mean monthly discharge. These residuals are cumulatively added and are then are plotted on a graph. The maximal value of the cumulative curve of the residuals represents the change-point.
Pettitt’s test belongs to a group of nonparametric homogeneity tests. These tests allow researchers to determine whether or not a series can be considered as homogeneous over time, or if abrupt changes have appeared over time. This test seeks to find abrupt changes in the mean of series based on the ranking of the observations. It is a widely used tool for detecting change-points in hydrological processes. The null hypothesis of this test is that there is no change in the mean of the time series. The alternative hypothesis says that there is a statistically significant change in the series. The test statistic is defined
U ^ = m a x | U k |
where Uk is given
U k = 2 i = 1 k r i k ( n + 1 )
where k = 1, 2, …, n and ri are the ranks of the observations Xi. The most probable change-point is located where U ^ reaches its maximum value [5].
The test was evaluated with RStudio statistical software. Pettitt´s test obtained the most probable location of the change-point, and the significance of this change-point was evaluated by the corresponding p-value. If the p-value was less than the significance level of the test, we rejected the null hypothesis. That means there was a statistically significant change in the series. Otherwise, there was no statistically significant change-point in the series at the significance level selected.
The third method for analyzing changes in a runoff regime is based on an analysis of the relationship between the mean annual discharge deviations from the long-term annual discharges, and the mean monthly discharge deviations from the long-term average monthly discharge. This method deals with the dependence of the runoff regime of each month upon the runoff regime of that year. The method compares data time series divided into two periods. The mean annual discharge deviations considering the long-term mean annual discharge (Formula 3) and the mean monthly discharge deviations considering the long-term mean monthly discharge (Formula 4) were calculated. The deviations were calculated according to the formulas:
Δ 1 = Q i Q Q 100
Δ 2 = Q j Q j Q j 100
where:
Δ1—the deviations of the mean annual discharges from the long-term mean annual discharge,
Qi—the mean annual discharge for each i-year,
Q —the long-term mean annual discharge,
Δ2—the deviations of the mean monthly discharges from the long-term mean monthly discharge,
Qj—the mean monthly discharge of the j-month in that i-year,
Q j —the long-term mean monthly discharge of the j-month.
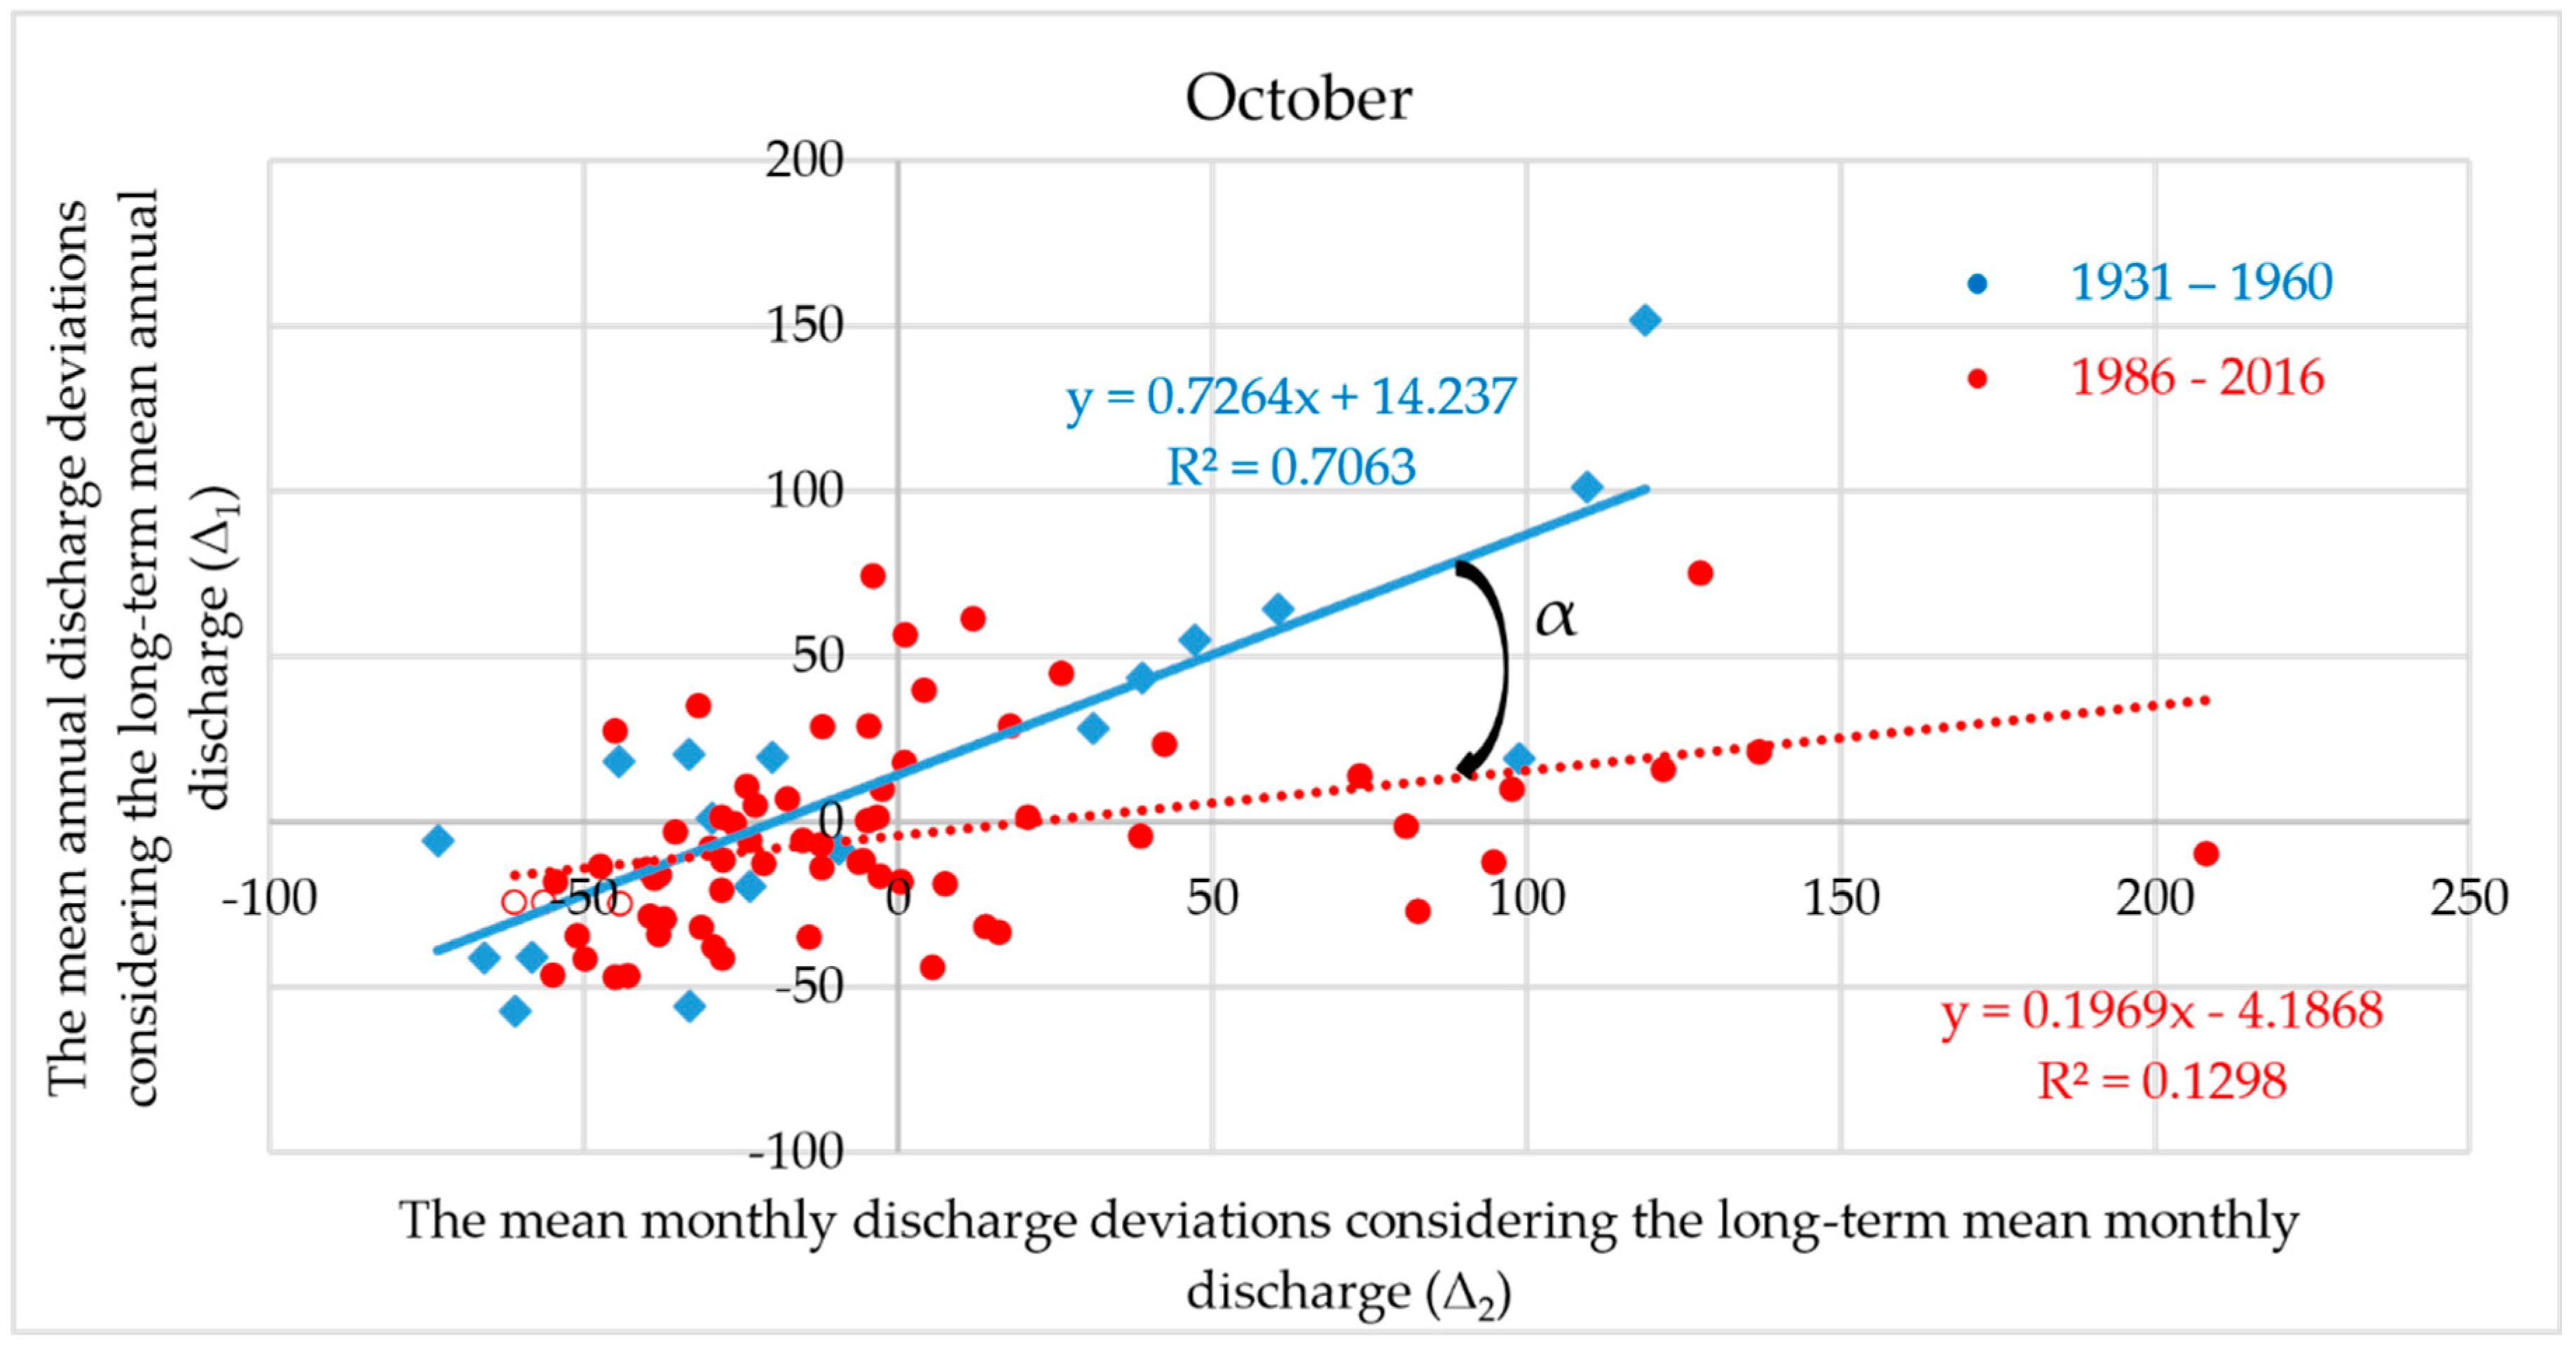
The trend lines which were provided for the two periods look like a closed pair of the scissors (Figure 2). The more open the scissors, the higher the changes in the runoff regime of the specific month. The scissors created forms an angle α. The angle α ranges from (10°, −10°) to (20°, −20°) and indicates a certain change; an angle greater than (20°, −20°) indicates a significant change in the runoff regime [6].
Four approaches were used to divide the time data series into two periods:
  • A division of the time data series into two 30-year periods. The first period was from 1931 to 1960, and the second period was from 1986 to 2016.
  • A division of the time data series into two halves; the first period was from 1931 to 1973, and the second period was from 1974 to 2016.
  • A division of the time data series by an analysis of the residuals. The change-point of the summer and winter periods determines the division of the time data series (Table 2, the columns Qsum and Qwin). The summer period was defined as May to October and the winter period from November to April.
  • A division of the time data series also by an analysis of the residuals. The change-point of the mean monthly discharge period determines the division of the time data series (Table 2, the last column Qm).

3. Results

3.1. The Analysis of the Residuals

The results of the analysis of the residuals showed change-points in 1941 for September and change-points in 1952 for November (Table 2). A considerable number of change-points were identified in the 1970s and 1980s. The range of colors from green to red represents the period from the earliest change-point year to the latest change-point year.

3.2. Pettitt’s Test

Pettitt’s test showed similar results in its analysis of the residuals. The underlined years in Table 3 are change-points with a p-value ≤0.15. The change-points in September are not so significant, but November has six significant change-points in 1952. Overall, there were 8 change-points in 1952. The entire measured period of the mean monthly discharges (Qm) has 4 statistically significant change points out of a total of 9 change-points in 1980. More than a quarter of the change-points are statistically significant (58 change-points out of 210).

3.3. An Analysis of the Runoff Regime Changes by the Deviations

The analysis of the deviations compares two periods of the entire measurements for each month. The purpose of using four approaches is to analyze the differences which were visualized into the angles and then eventually into changes in the runoff regime.
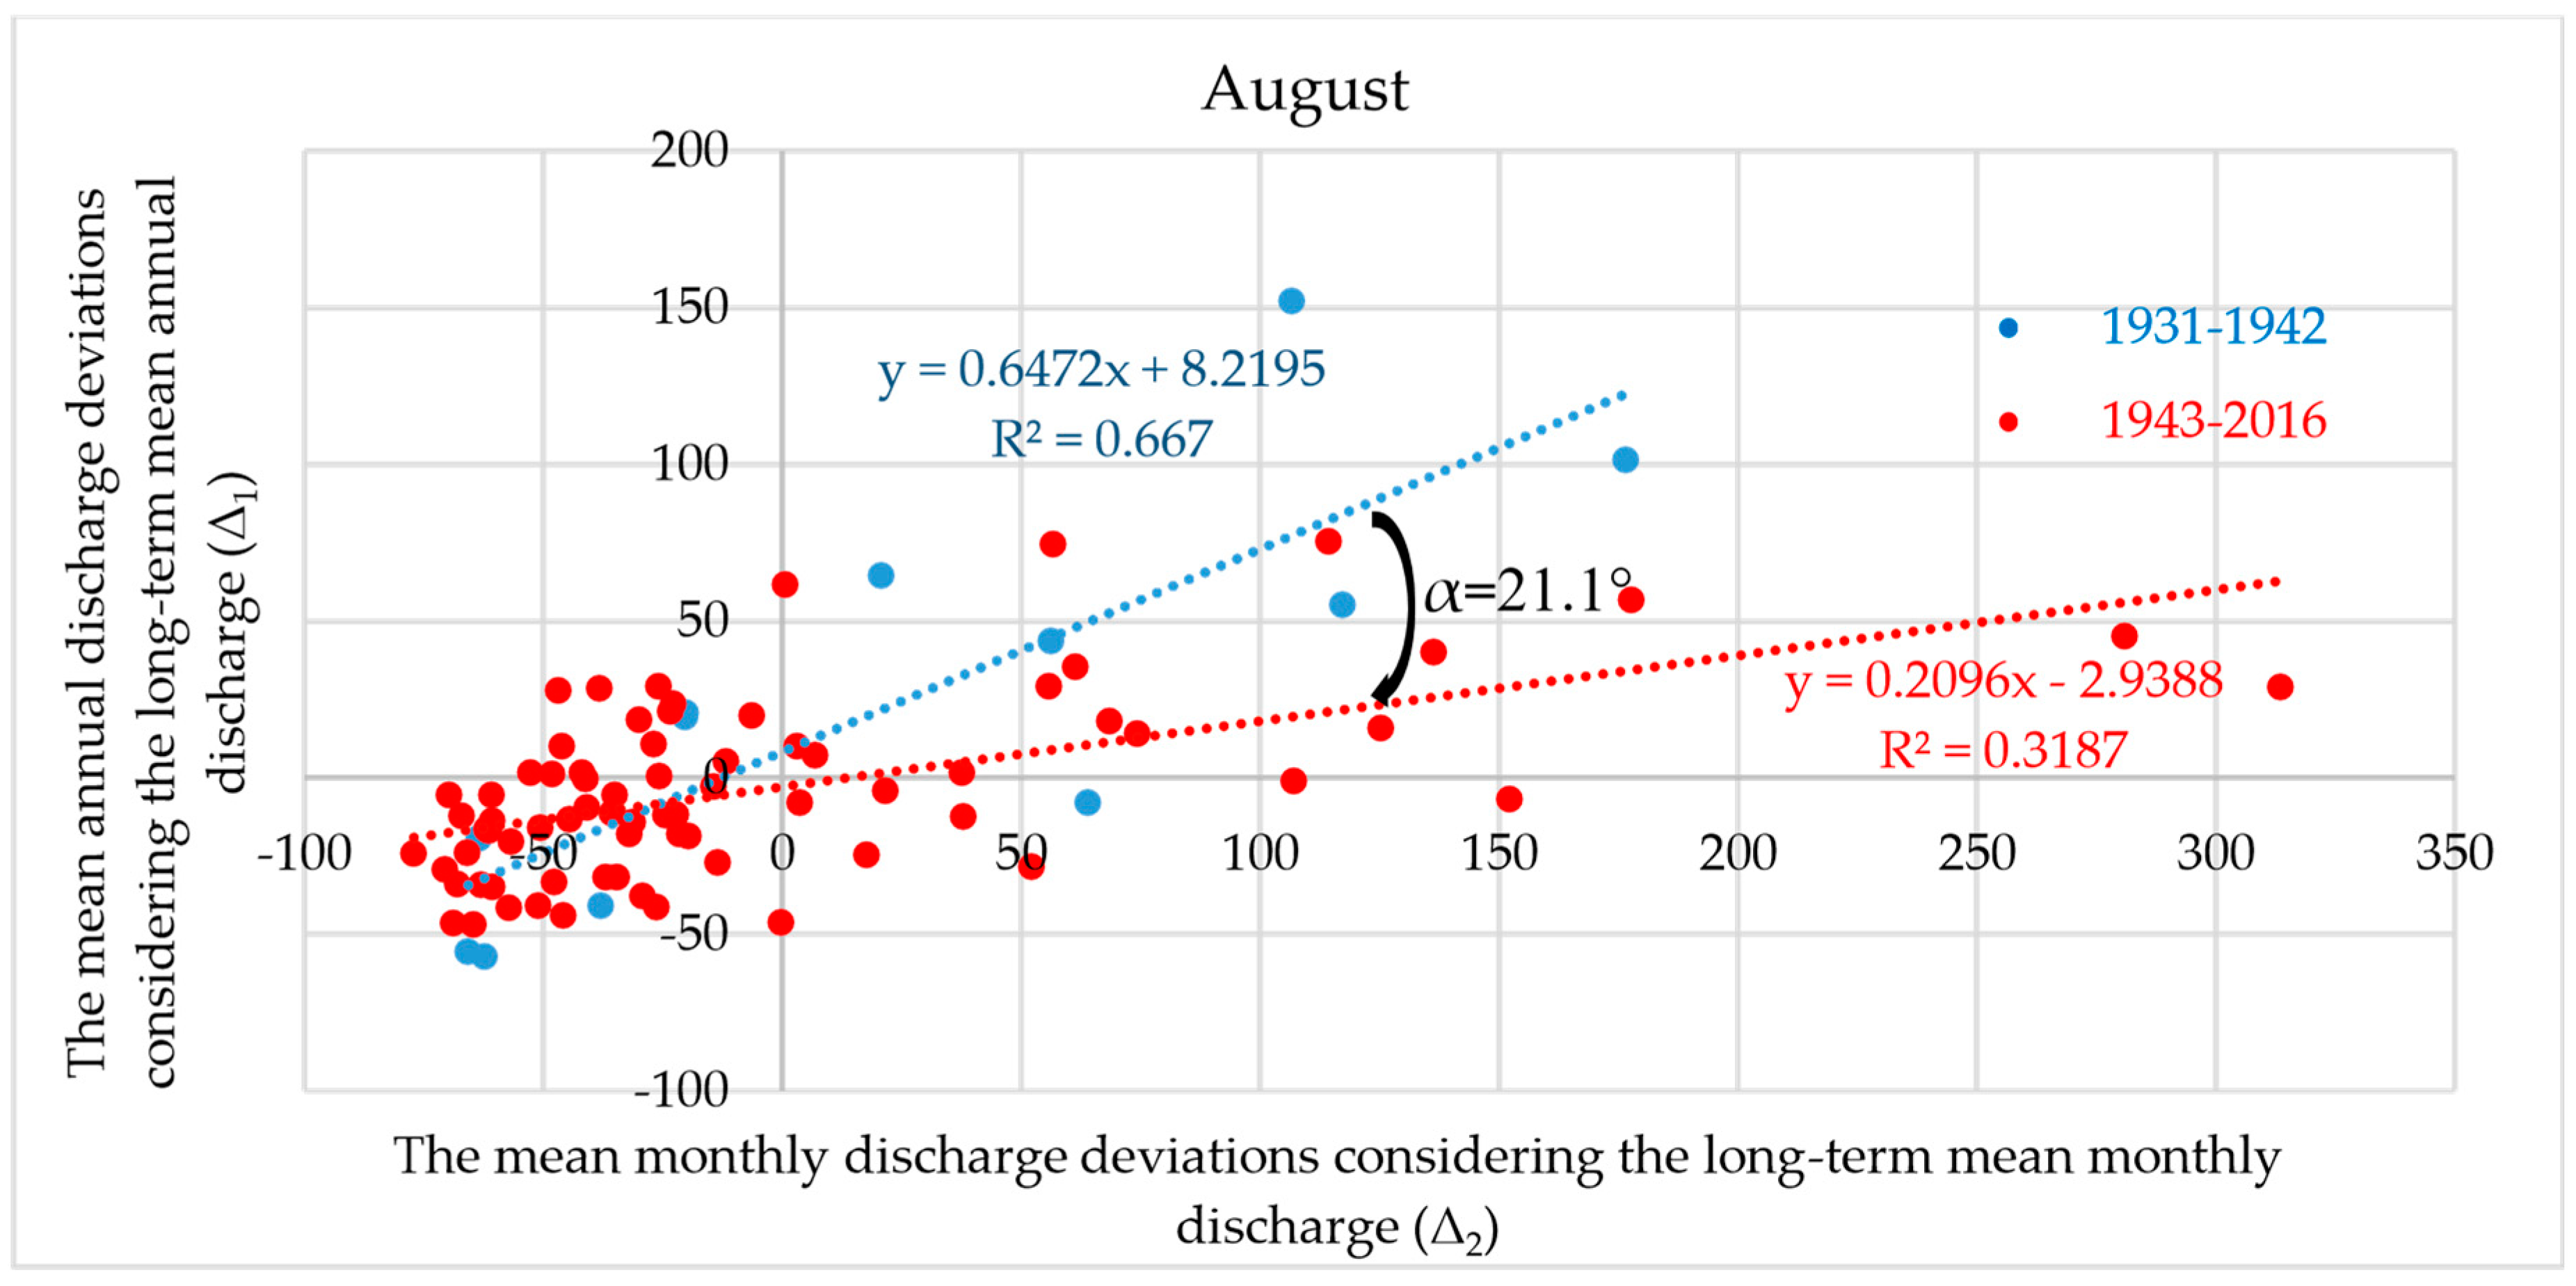
The selected graph (Figure 3) shows an analysis of the deviations for the stage-discharge gauging station 5040 (Šaštín-Stráže) in August. The division of the measured period is based on the seasonal mean monthly discharges (Qsum vs. Qwin). Specifically for this graph, the first period was from 1931 to 1942, and the second period from 1943 to 2016. The change-point was in 1942 (see Table 2, row 5040, column Qsum). The angle between the trend lines is 21.1°. This means a significant change in the runoff regime in August.
Using the four different methods for all the months at each station, angles were selected that ranged from (10°, −10°) to (20°, −20°) and then angles greater than the interval (20°, −20°). A significant number of the changes in the runoff regime were identified at the Šaštín-Stráže station (5040). Where from May to November, but excluding September, changes in the runoff regime were identified. The method found the most changes in the runoff regime were in October, where changes in five stations were identified.

4. Discussion

The analysis of the residuals identified the most changes in September (year 1941) and in November (year 1952). Many of the change-points were identified in the 1970s and 1980s. This simple method is applicable to hydrological data series. A disadvantage is the absence of statistical significance, but Pettitt’s test, which showed statistical significance, was used in the study. The change-points identified by Pettitt´s test show several significant change-points in November of 1952. More than a quarter of the change-points were statistically significant.
A considerable number of changes in the runoff regime were identified at the Šaštín-Stráže (5040) station and at other stations in October.
The results of the analyses show certain changes in the mean monthly discharges, but in order to confirm their correctness, it will be necessary to examine other hydrological and meteorological elements and use other methods for identifying the changes.

Author Contributions

Conceptualization, M.Ď., D.B. and K.H.; methodology, K.H., M.Ď. and D.B.; software, D.B. and M.Ď.; validation, M.Ď., D.B. and K.H.; data curation, M.Ď. and D.B.; writing—original draft preparation, M.Ď., D.B. and K.H.; writing—review and editing, M.Ď., D.B. and K.H.; visualization, M.Ď.; supervision, K.H.; project administration, K.H., M.Ď. and D.B.; funding acquisition, K.H.

Acknowledgments

This work was supported by the Science Granting Agency (Slovakia) under Contract No. VEGA 1/0891/17.

Conflicts of Interest

The authors declare no conflict of interest.

References

  1. Barnett, T.P.; Adam, J.C.; Lettenmaier, D.P. Potential Impacts of a Warming Climate on Water Availability in Snow-Dominated Regions. Nature 2005, 438, 303–309. [Google Scholar] [CrossRef] [PubMed]
  2. Hlavcova, K.; Szolgay, J.; Kohnová, S.; Hlásny, T. Simulation of hydrological response to the future climate in the Hron River basin. J. Hydrol. Hydromech. 2008, 56, 163–175. [Google Scholar]
  3. Škvarenina, J.; Szolgay, J.; Šiška, B.; Lapin, M. (Eds.) The Climate Change and Landscape—Impacts of the Climate Change and Assessment of the Territorial Vulnerability in Slovakia in Water Resources Management, Forests and agriculture; Study XXV, Vol. XXII; The Slovak Bioclimatological Society: Zvolen, Slovakia, 2010; ISBN 978-80-228-2272-5. [Google Scholar]
  4. Implementation of Directive 2007/60/EC of the European Parliament and of the Council of 23 October 2007 on the Assessment and Management of Flood Risks. The Preliminary Flood Risk Assessment in the Bodrog Subbasin. Ministry of the Environment of the Slovak Republic. Dec. 2011, pp. 38–42. Available online: http://www.minzp.sk/sekcie/temyoblasti/voda/ochrana-pred-povodnami/manazment-povodnovych-rizik/ (accessed on 28 October 2018).
  5. Pettitt, A.N. A non-parametric approach to the change-point problem. J. Appl. Stat. 1979, 28, 126–135. [Google Scholar] [CrossRef]
  6. Tegelhoffová, M.; Danáčová, M.; Szolgay, J. A spatial assessment of the indicator of hydrological regime changes. Acta Hydrologica Slovaca 2013, 14, 243–251. [Google Scholar]
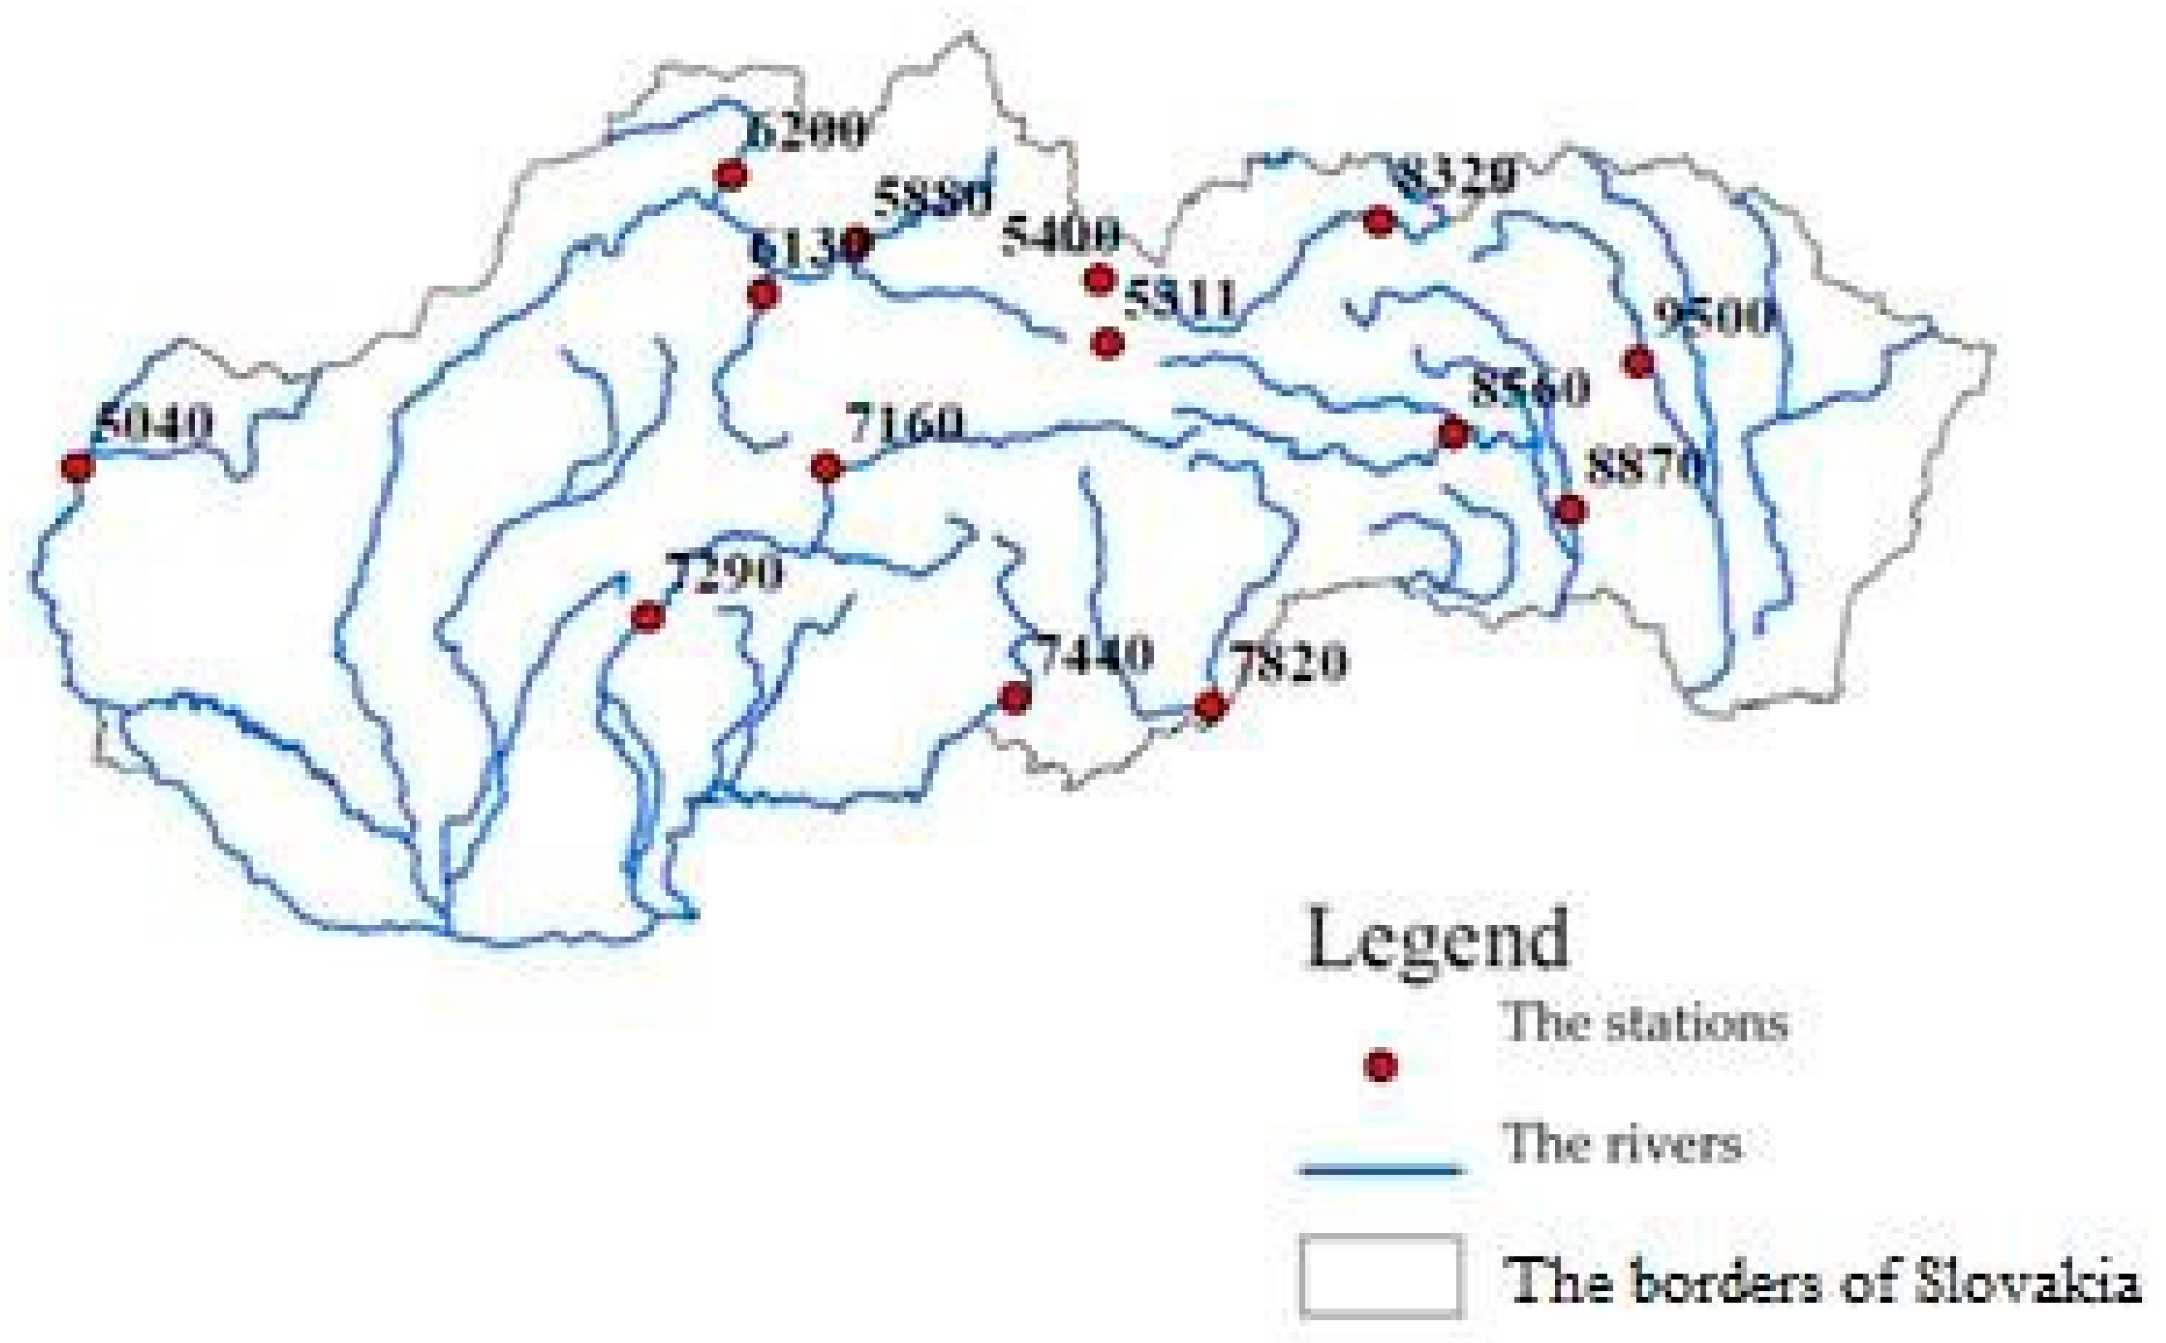
Figure 1. The localization of the 14 stage-discharge gauging stations used in Slovakia.
Proceedings 07 00018 g001
Figure 2. The sample of the analysis of the runoff regime changes by the deviations.
Proceedings 07 00018 g002
Figure 3. The analysis of the deviations of the stage-discharge gauging station 5040 in August.
Proceedings 07 00018 g003
Table 1. List of the stage-discharge gauging stations with the numbering and the catchment areas.
Stage-Discharge Gauging
Stations
The Rivers Number of Station Catchment Area (km2)
Moravský sv. Ján Morava 5040 24,129.30
Čierny Váh Čierny Váh 5311 243.06
Podbánské Belá 5400 93.49
Dierová Orava 5880 1966.75
Martin Turiec 6130 827.00
Kysucké Nové Mesto Kysuca 6200 955.09
Bánska Bystrica Hron 7160 1766.48
Brehy Hron 7290 3821.38
Holiša Ipeľ 7440 685.27
Lenártovce Slaná 7820 1829.65
Jaklovce Hnilec 8560 606.32
Košické Olšany Torysa 8870 1298.30
Hanušovce Topľa 9500 1050.03
ChmelnicaPoprad83201262.41
Table 2. The change-points identified of each station and each month.
Stat.JanFebMarAprMayJunJulAugSepOctNovDecQsuQwiQm
50401974 1988 1948 1970 1987 1987 1952 1987 1941 1941 1952 1988 1942 1948 1948
53111953 1977 1983 1972 1979 1989 1975 1972 1984 1980 1952 1966 1979 1980 1980
54001947 1944 1953 1953 1974 2002 1985 1981 1975 1962 1952 1952 1964 1953 1981
58801954 1954 1951 1956 1986 1954 1993 1978 1941 1981 1952 1962 1945 1983 1949
61301974 1965 1951 1970 1972 1968 1966 1966 1941 1980 1952 1976 1966 1977 1967
62001973 1965 1976 1970 1938 1954 1975 1986 1941 1981 1952 1989 1987 1965 2002
71601953 1977 1981 1972 1996 1989 1966 1966 1941 1984 1952 1966 1985 1970 1981
72901953 1977 1983 1970 1987 1989 1966 1966 1941 1984 1952 1980 1985 1981 1981
74401982 1979 1970 1980 1942 1994 1952 1970 2009 1973 1952 1976 2009 1980 1981
78202008 1979 1941 1961 1969 1964 1952 1970 1944 1963 1952 1976 1953 1980 1980
85601953 1977 1945 1980 1945 1975 1960 1960 1941 1984 1952 1952 1955 1953 1955
88701953 1965 1945 1980 1974 2004 1996 1985 1941 1973 1952 1985 1969 1981 1945
95001953 1977 1986 1980 1973 1964 1996 1985 1941 1980 1980 1987 1969 1981 1981
83201975 1969 1946 1970 1982 1967 1996 1960 1941 1973 1952 1950 1949 1970 1949
Table 3. The change-points identified by Pettitt´s test. The underlined years are change-points with p-value ≤0.15.
Stat.JanFebMarAprMayJunJulAugSepOctNovDecQsumQwinQm
50401973 1988 1948 1988 1997 1987 1987 1987 1954 1954 1981 1998 1987 1948 1988
53111953197119831979 1996 198919751972 1980198119521966198019791980
588019541954195119521986 1954 1993 1978 1941 1981 1950 19621945 1983 1949
54001947 19441944 1997 1974 2002 1985 1981 1941 1962 195219522002 1953 1981
61301992 2006 1998 1972 1987 1968197219861942 196619661976 1966 19771967
71601983 1977 1983 19721996 19891975 1980 1981 1941 1952196619801970 1980
620019731965 2009 1970 1938 1957 1982 19861941 1941 1952 1989 1987 1936 2002
72902000 1981 1983 1988198719891972 1978 1981 1941 19521967 198519831985
74401982 198119701988 1991 1991 1952 1952 1950 1962 1980 197019501980 1980
78201983 19801941 1961 1964 1989 1975 1996 1980 1944 1945 1966 1950 1980 1980
8560198319731955 1980 1991 1976 1960 1960 1955 1945 1952196819801970 1980
88701953 2006 1986 2001 1969 1937 1996 1995 1941 1973 1945 1945 1969 1983 1945
95002004 2006 1986 2000 1969 1964 1952 1981 1996 1945 1981 1982 19691983 1981
83201961 1969 1971 1970 1936 1936 1996 1945 1941 1945 19521960 19491970 1949