1. Introduction
There is current general concern about the non-stationary behaviour of flood series, due to both climate change and anthropogenic effects, such as changes in land uses and urbanisation, deforestation and river training [
1]. Specially, non-stationarity is more evident in long series recorded at gauging stations. Consequently, several studies have recently attempted to identify patterns of change and trends in flood series at both small and large scales [
2,
3,
4,
5]. In Spain, a previous study found a generalised decreasing trend in flood magnitude that was more evident in the period 1959–2009 [
3]. A multi- temporal test, with varying starting and ending years, showed that trend signs depended on the period considered. Series with beginning years in the period 1950–1970 usually led to significant decreasing trends.
This study aims to conduct a sounded statistical analysis to identify potential oscillations in flood series in Spain that cannot be identified by the traditional Mann–Kendall (MK) test. Temporal oscillations may drive consecutive flood-poor and -rich periods. Accordingly, the longest available flood series in near-natural catchments in Spain were selected. A methodology was developed based on the comparison between the expected variability of floods under the stationarity assumption with the variability of floods in observed flood series. Statistically significant flood-poor and -rich periods were identified.
At most of the sites, a flood-rich period was identified from the beginning of the series to 1980 and a flood-poor period at the end of the series, usually finishing in 2014.
2. Methodology
The methodology proposed in this study to identify flood-poor and -rich periods in flood series analyses the temporal oscillations in annual maximum series (AMS) of floods. AMS are usually characterised by an extremal distribution function. In Spain, a regional study concluded that the distribution function that best characterises AMS in the selected gauging stations is the generalised extreme value (GEV) distribution with the L-moments method [
6]:
where
x is the flood magnitude,
u is the location parameter,
α is the scale parameter and
k is the shape parameter.
Assuming a stationary behaviour in the arrival of floods in the AMS, flood occurrences should be driven by a random process. Therefore, successive flood magnitudes in AMS should be independent. Flood-poor and -rich periods would be identified when such a stationary hypothesis is not met for a significance level α, through the following steps in each gauging station:
A GEV distribution function is fitted to flood magnitudes in AMS.
N random series of n years are generated from the GEV distribution function fitted in Step 1.
The mean value for each N series of n years generated in Step 2 is calculated.
Upper and lower thresholds are obtained from the series of N mean values obtained in Step 3, for the confidence intervals (α/2) and (1 − α/2).
If the mean value of flood magnitudes in n consecutive years in the observed AMS was larger than the upper threshold obtained in Step 4, a significant flood-rich period of n years was identified, meaning that the stationary hypothesis was rejected and that the result could not be explained by climate variability. If the mean value of flood magnitudes in n consecutive years in the observed AMS was smaller than the lower threshold obtained in Step 4, a significant flood-poor period of n years was identified.
In this study, N equals 100,000, n equals 10, 20 and 30 years and α equals 10%, in order to identify flood-poor and -rich periods of n years for a significance level of 10%, with 5% in each tail. However, only the results for 20 years are shown.
In addition, a similar methodology was developed to identify flood-rich and -poor periods in peak-over-threshold (POT) series, in terms of the flood magnitude of exceedances over a given threshold and the annual number of such exceedances. POT3 series with an average of three exceedances per year were considered. The methodology and results for POT series are not included in this proceeding because of extension limitations.
3. Case Study
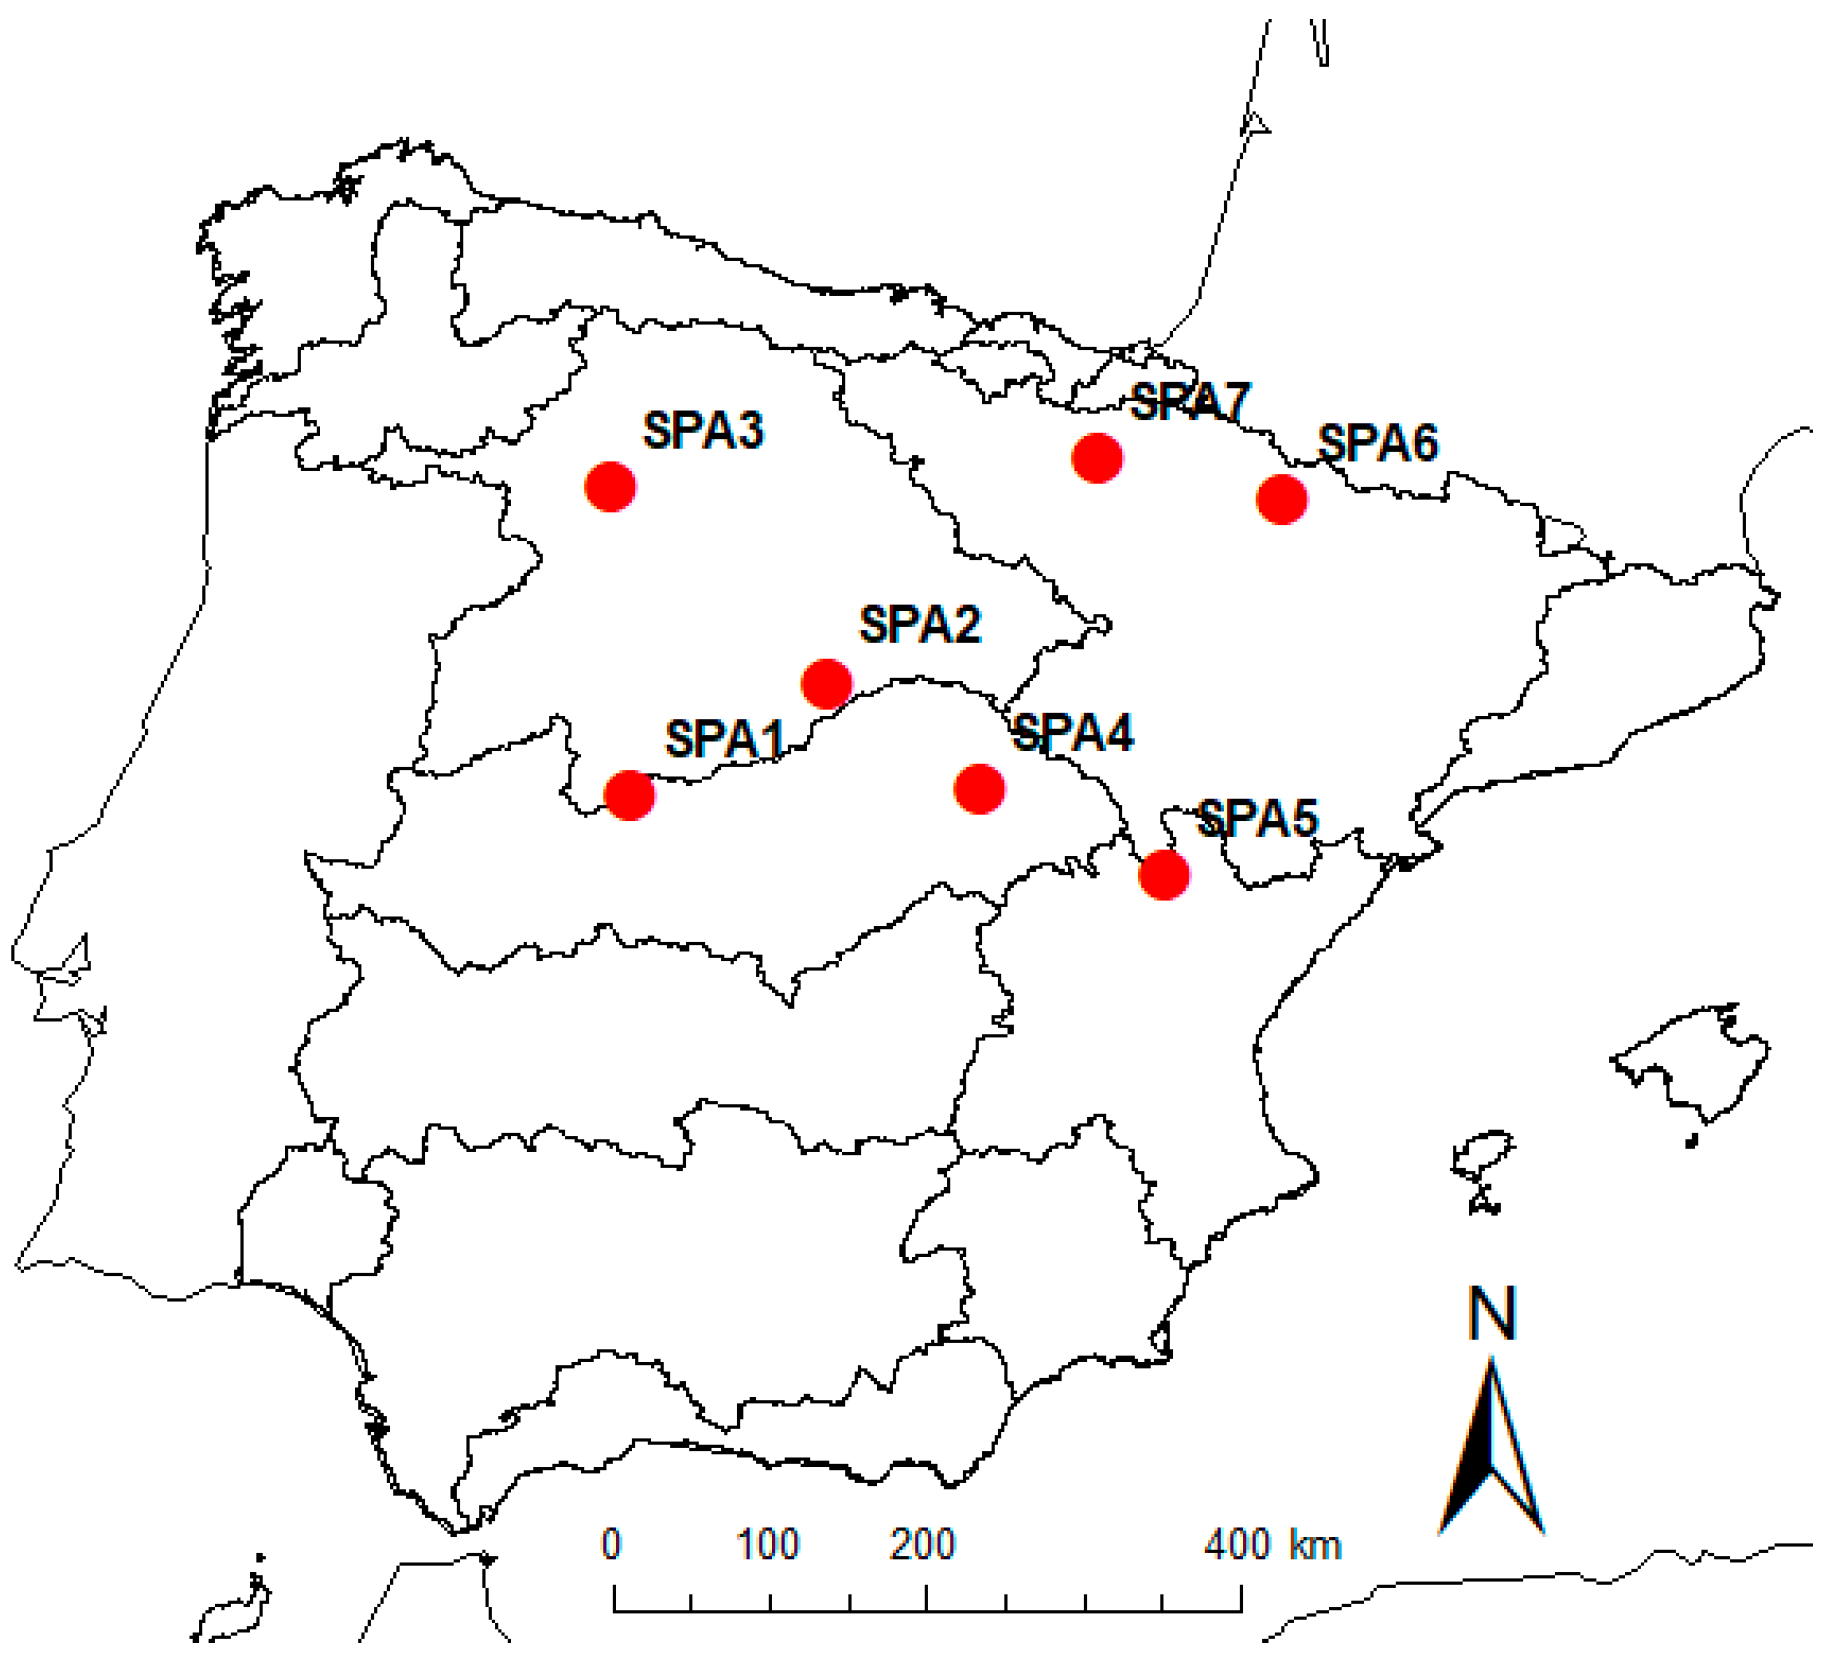
A previous study selected a set of 60 gauging stations in near-natural catchments with long flood series in Spain [
3]. From such sites, the seven gauging stations with observations in the longest period 1942–2014 were selected for this study (
Figure 1). No continuous longest series are available in Spain, with the reason being that, despite observations beginning in 1912, there is a gap in the period 1936–1942, due to no data being recorded either during the Spanish Civil War or for a three-year period after it ended.
4. Results
The methodology was applied to the AMS of floods recorded at the seven gauging stations with observations in the period 1942–2014. A set of 100,000 synthetic series of annual maximum floods with 10, 20 and 30 years were generated. Upper and lower thresholds were obtained for a significance level of 10% (5% in each tail of the distribution). Significant flood-rich periods were identified when the moving average in
n years exceeded the upper threshold. Significant flood-poor periods were identified when the moving average in
n years was below the lower threshold. The results for the moving average in 20 years are shown in
Figure 2 and
Table 1.
In six of the seven gauging stations, a significant flood-rich period was identified at the beginning of the series, in a period ending around 1980. Such a period ended a little earlier, in 1974, in the case of SPA1. In the case of SPA3, the flood-rich period was delayed, beginning in 1959 and ending in 1986.
In five of the seven gauging stations, a significant flood-poor period was identified at the end of the series. However, the beginning and ending years varied from one site to another. In four of them, the flood-poor period ended around 2014 and began between 1974 and 1991. In the case of SPA1, the flood-poor period occurred a little earlier, in 1966–1999. A flood-poor period was identified at the beginning of the series in SPA6.
Neither flood-rich nor flood-poor periods were identified in the gauging station SPA3.
Summarising, in six of the seven gauging stations, a significant flood-rich period was identified from the beginning of the series to around 1980. In addition, at five of the seven sites, a significant flood-poor period was identified at the end of the series with a varying beginning year, but most likely finishing at the ending year of the series.
5. Conclusions
A methodology to identify statistically significant flood-poor and -rich periods was presented. The methodology was based on the comparison between the expected variability of flood magnitudes, under an assumption of stationarity, and the actual variability of flood magnitudes in observed flood series.
Seven gauging stations, with the longest recorded flood series in the period 1942–2014, in Spain were selected. In six of the seven gauging sites, periods that did not meet the hypothesis of stationarity were found. A period with unexpected large and consecutive floods, or a flood-rich period, from the beginning of the series to around 1980 was identified at six of the seven sites. A period with unusual small consecutive floods under the hypothesis of stationarity, or flood-poor period, was identified at the end of the series in four of the seven gauging stations.
This finding could explain the generalised significant decreasing trend identified by the MK test at most of gauging stations located in Spain in [
3]. A flood-rich period at the beginning of the flood series, followed by a flood-poor period at the end of the series, influence such trends. Consequently, the decreasing trend may not point to decreasing flood magnitudes in the future, though it seems to have been caused by a natural temporal oscillation in flood magnitudes, with consecutive flood-rich and -poor periods.


