Proceeding Paper

Effect of Soil Loading and Unloading on Its Acoustic Behavior †

1
‎Civil Engineering Department, Sami Shamoon College of Engineering, Jabotinsky 84, Ashdod 77245, Israel
2
Department of Electrical and Electronics Engineering, University of West Attica, 12244 Egaleo-Athens, Greece
*
Authors to whom correspondence should be addressed.
Presented at 1st International Electronic Conference on Applied Sciences, 10–30 November 2020; Available online: https://asec2020.sciforum.net/.
Proceedings 2020, 67(1), 20; https://doi.org/10.3390/ASEC2020-07516
Published: 9 November 2020
(This article belongs to the Proceedings of The 1st International Electronic Conference on Applied Sciences)

Abstract

:
The aim of the study was to understand the changes of ultrasound-wave speed (US) and acoustic emission (AE) as a result of soil loading and unloading. The soil was dune Sand, Poorly graded, i.e., “SP” according to the Unified Soil Classification System (USCS). Natural dune sand, as well as its three extracted fractions as follows: 2.36–0.6, 0.6–0.3, and 0.3–0.075 mm, were studied. The dried sand samples were studied using an oedometer instrument with simultaneous measurement of load and stain level. The stress range was 0 to 143.5 kPa. Each sample was loaded and unloaded while measuring US p-wave speed and AE activity (number of hits) at each loading and unloading stage. The results portray the difference in the behavior of the two studied phenomena. In the stress increase branch, there is a gradual increase in p-wave speed and sharp excitation of AE activity, while in the stress relaxation branch there is an abrupt decrease in p-wave speed and a minor excitation of AE signals.

1. Introduction

Acoustic emission (AE) is a widely used phenomenon for assessing the degree of failure of various materials under applied stresses (e.g., [1,2,3,4,5,6]). Michlmayr et al. [7], in their comprehensive review of the AE mechanism, consider six possible mechanisms of AE induced in different materials, some of which are more or less common for different materials, while others are inherent to some specific materials and conditions. For example, soil destruction (when it is dry) can be associated with AE emission due to crack development, grain friction, grain cementation fracture (for cemented soils), and liquid bridge rupture (when the soil is wet or saturated). The AE phenomenon associated with the destruction of soil was mainly studied in connection with the slopes’ stability (e.g., [8,9,10,11]). Laboratory AE studies of soil samples are less common. For example, Lin et al. [12] studied sandy soils subjected to triaxial compression. It has been shown that an increased confining stress or initial relative density causes more AΕ. It was also shown that the rate of AE hits is related with stress–strain conditions. Naderi-Boldaji et al. [13] studied the AE behavior during confined uniaxial compression of soil samples. A close correspondence was found between the number of AE hits, their energy, and the soil strain–stress conditions. It was also noted that more research was necessary before proposing the AE method as a robust one for soil study.
Ultrasound (US) is the standard method for assessing dynamic properties in various materials [14]. For example Stephenson [15] studied dynamic Young and shear moduli of soil using the US method. Zimmer et al. [16] measured the p- and s-wave speeds in the samples of dry and water-saturated natural sand samples. The exponential relationships between p-wave and the applied external load were found. Chen et al. [17] studied the elastic wave velocity of an unsaturated, silty sand.
It is known that the use of only one geophysical method causes ambiguity in the interpretation of material properties. This article is devoted to an extensive study of the behavior of AE and US when loading four types of dry sandy soils.

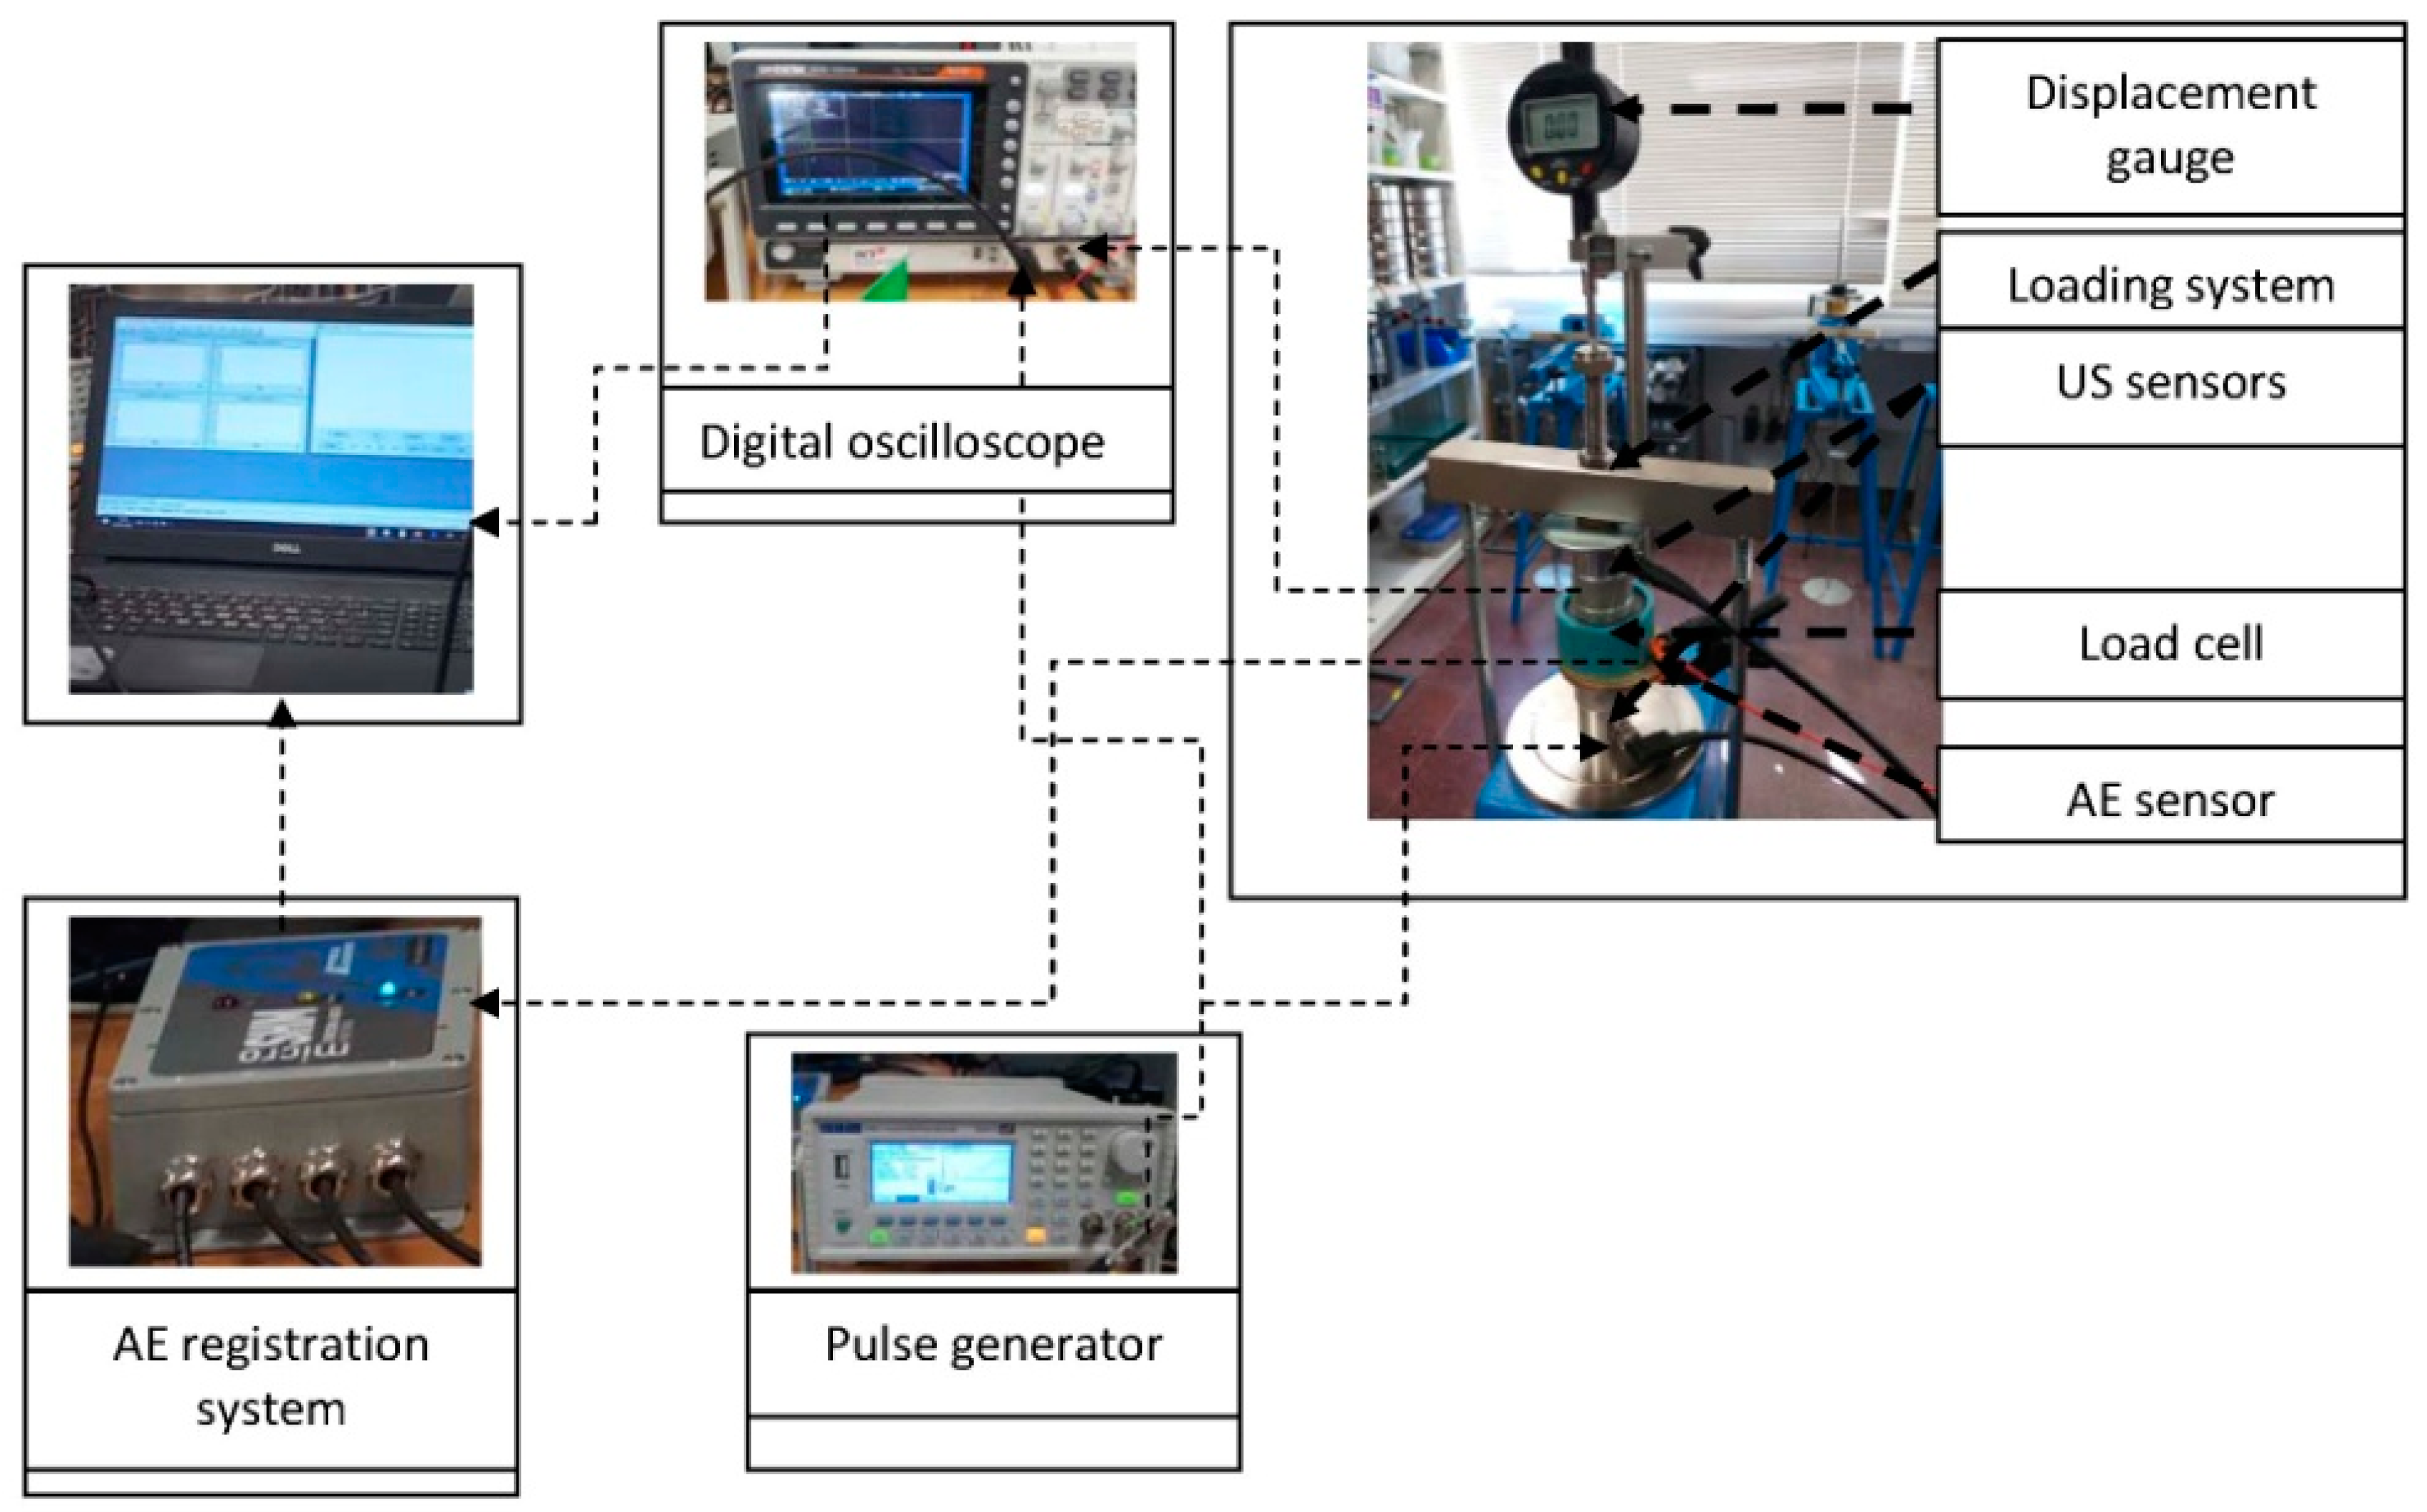
2. Materials and Methods

Dune sand from the Ashdod beach (Southern Israel) was selected for the experiments. Grain distribution analysis shows that the sand can be categorized as SP based on the Unified Soil Classification System (USCS). The experiments were carried out using four types of samples as follows: natural dune sand and its three extracted fractions: 2.36–0.6, 0.6–0.3, 0.3–0.075 mm. Prior to sample preparation, all types of sand were dried for 24 h in an oven at 105 °C. For the experiments the samples were prepared in the fiberglass load cell (blue ring in Figure 1) with an internal diameter of 51.6 mm and height of 31.5 mm. The average value of beginning density for all samples was 1.67 ± 0.03 gr/cm3.
Figure 1 shows the experimental system using an oedometer instrument (The Matest Inc., Arcore, Italy) The used load cell allows vertical deformation of the soil sample, restricting its horizontal extension. The samples were incrementally loaded via its top end while its bottom end was in fixed position. The load increment was 5 kg. The maximal load applied to the samples was 30 kg that corresponds to the maximal applied stress level—143.5 kPa. At each increment of loading the final deformation value was measured using a displacement gauge (Figure 1). Two ultrasonic sensors were located at both ends of the soil samples while the AE sensor was located at the bottom (fixed) end of the load cell.
Generating and receiving US sensors were connected to the pulse generator (TG5011A) and the digital oscilloscope (GDS1054B), respectively (Figure 1). The resonance frequency of ultrasonic sensors was 75 kHz. The Open Wave software was used for the data recording to a personal computer. The US wave speed was measured using the first arrivals method.
The AE sensor located at the fixed bottom end of the load cell was connected to the “Structural Health Monitoring System-Micro-SHM” monitoring system (Mistras/Physical Acoustic Inc., Princeton Jct, NJ, USA). The “AE win” for Micro SHM software was used for data recording to the PC. The AE measurements were performed continuously at each loading stage from the moment of load application (US generator in switched off position) till cessation of AE hits. Just after the AE cessation, the record of AE was stopped and the US generator was switched on for US measurements. After the completion of US measurements, the US generator was switched off again and the procedure of sample loading with simultaneous AE measurements was repeated.

3. Results

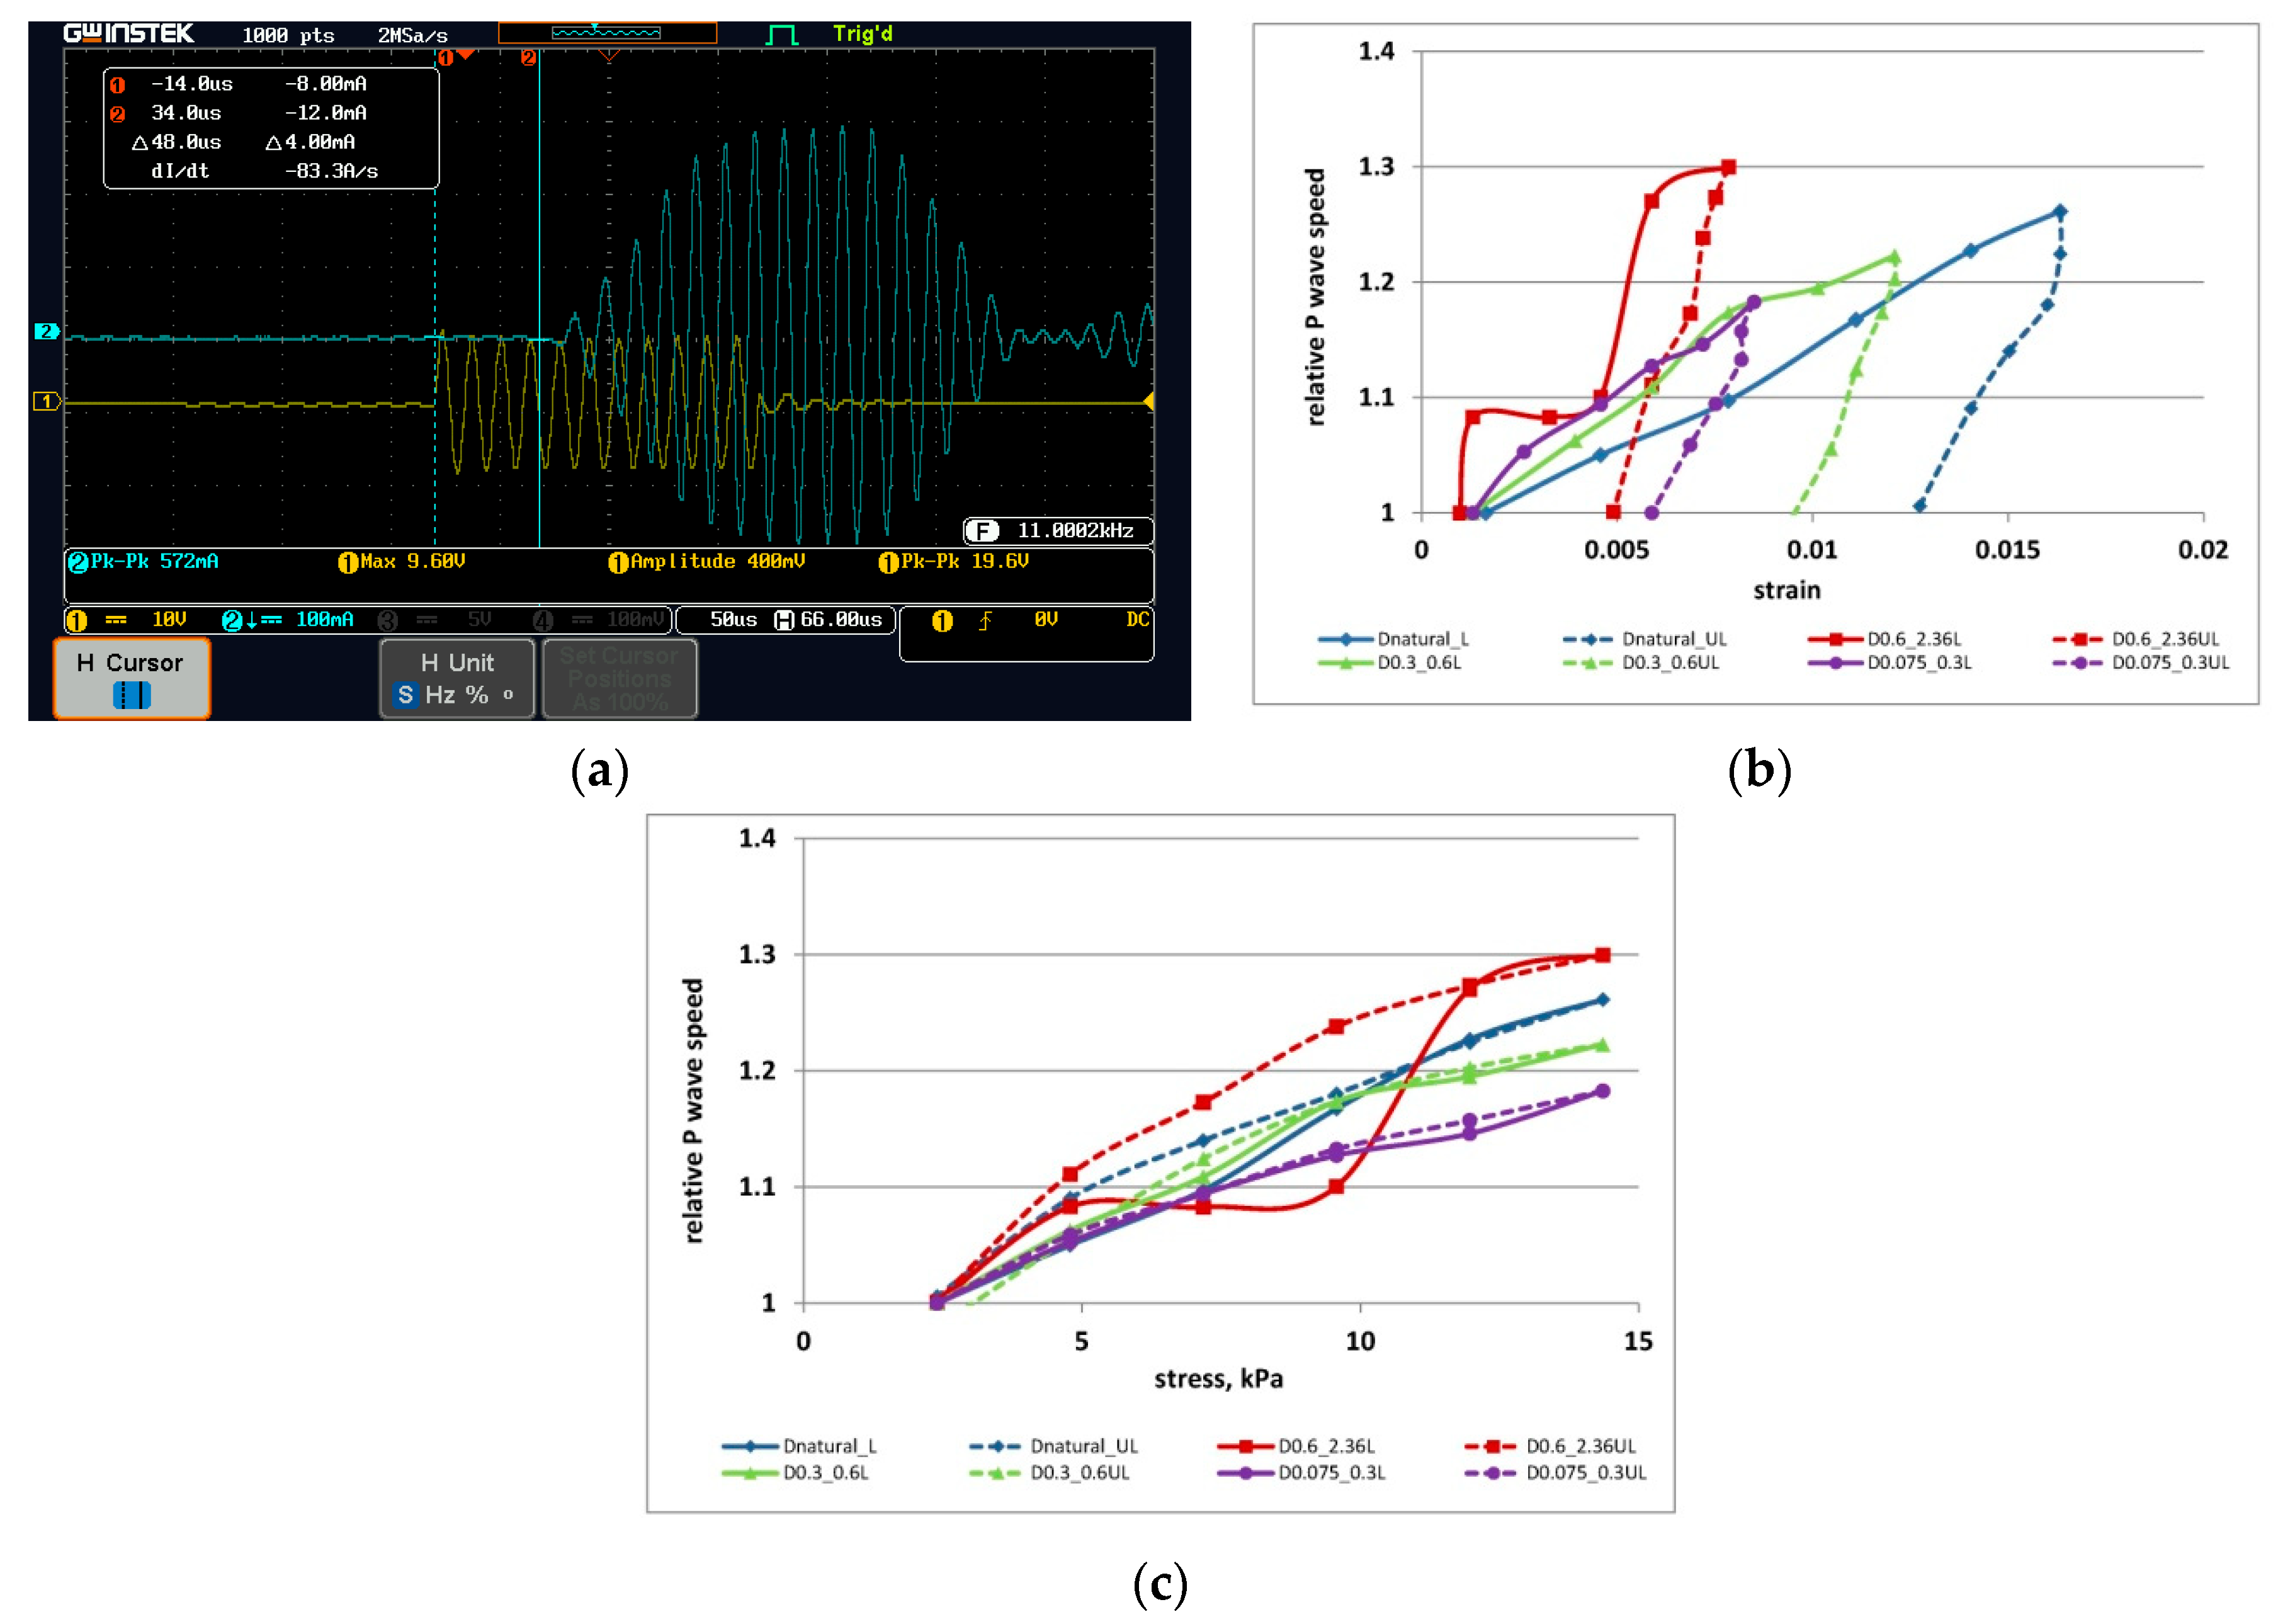
3.1. The Results of US Measurements

Figure 2a shows a typical example of US measurements by the first arrival method. Figure 2b,c demonstrate the changes of relative US speed vs. samples strain and applied stress, respectively. The relative (normalized) values of US wave speed was calculated as follows: V n = V i V m a x , where V i and V m a x are the current (at a specific loading stage/increment) and maximal values of US wave speed, respectively.
The experimental results (Figure 2c) show that the increase in stress level causes the rise of p-wave speed in the range of 514–630, 490–624, 521–637, 476–563 m/s for natural dune sand and its fractions of 2.36–0.6, 0.6–0.3, 0.3–0.075 mm, respectively. Analysis of Figure 2b shows a significant difference between the changes in the US speed during sample loading and unloading. It is seen that the values of the US wave speed gradually increase with increasing strain and sharply drops when the strain decreases (unloading branch).
Analysis of Figure 2c shows the difference between the values of the ultrasound speed during loading and unloading the samples. It is seen that the maximal difference is for the coarsest fraction. The difference for the natural dune sample is also essential. The difference in US wave speed values between loading and unloading branches for two fine fractions is insignificant.

3.2. The Results of AE Measurements

Figure 3a shows a typical shape of the AE hit caused by the sand loading and unloading. To compare the results of AE measurements of the four soil types, the relative and normalized strain and applied stress values were used (the calculation procedure is the same as for relative (normalized) US wave speed—see Section 3.1). Figure 3b,c shows the results of AE measurements vs. normalized strain (Figure 3b) and normalized stress (Figure 3c) changes, respectively. Analysis of both figures portrays that an essential increase in the number of AE hits (AE events) begins at the range 0.65–0.7 of maximum normalized stress and strain level. Maximum measured values of AE hits were measured at the range 0.8–1 of maximum relative stress and strain. These two observations concern the loading branch of the samples (full circles in the Figure 3b,c). During the samples unloading (empty circles in Figure 3b,c) only single AE hits were recorded. Summarizing, the analysis of AE behavior indicates gradual increase in the AE activity with increase in stress and strain levels for all studied samples, while a minor AE activity during all soil types unloading is observed.

4. Discussion

The results of US and AE measurements demonstrate a difference in both phenomena’s behavior during loading and unloading of sand samples. It can be seen that a gradual increase in the applied load causes a corresponding increase in the speed of the longitudinal US wave for the two finer sand samples (fractions 0.6–0.3, 0.3–0.075 mm), which probably reflects homogeneous changes in grain packing. The situation is most different for the coarsest faction sample. An increase in load first causes an increase in the speed of ultrasonic waves, after which a stage appears at which the speed remains unchanged, and then the value of US wave speed continues to increase uniformly again. The appearance of the second stage probably means a significant redistribution in the packing of coarse grains when the load reaches some critical (threshold) value. The appearance of similar phenomena (while in smaller scale) during the loading of natural dune sand indirectly confirms this hypothesis. The smaller scale of the phenomenon can probably be explained by the filling of the space between coarse grains with finer ones. This suggestion is consistent with the observation of behavior of the two finer fractions samples. This hypothesis is also confirmed by the quite “linear” changes in US wave speed during all samples unloading. Note the high sensitivity of the ultrasonic wave speed to a decrease in sample strain with a decrease in the external load. The slopes of the curves are very similar for all tested samples. This phenomenon can be explained by the lack of grain redistribution during sample unloading (for all tested samples), but by an increase in pore volume.
As we noted above, the mechanism responsible for AE appearance during dry soil deformation is crack development and grain friction [7]. Analysis of Figure 3b,c shows that AE was registered after 0.5–0.6 of maximum stress and strain level. This value of stress corresponds to about 70 kPa that is the stage of grain re-distribution for natural dune and coarse fraction curves (Figure 2b,c). This observation means that this stress level causes more or less dense packing of the grains and, consequently, friction between them due to slippage. Since the stress level is low enough, the initiation of cracking in the sand samples is less likely. Hence, the most probable mechanism responsible for AE excitation in this condition is grain friction. The minor number of AE hits caused during samples unloading confirms this hypothesis (Figure 3b,c).

5. Conclusions

One can see the difference in the behavior of the two studied phenomena—ultrasonic wave and AE:
  • In the stress increase branch: gradual increase in US-wave speed and sharp excitation of AE activity.
  • In the stress relaxation branch: abrupt decrease in US-wave speed and minor excitation of AE signals.
The difference appearing in these two phenomena can be used for accurate estimation of stress and strain changes in sandy environment.

Author Contributions

Authors (V.F., S.M.P. and S.S.) have equal contribution in the ideas leading to, in the calculations of and in writing and reviewing the manuscript. All authors have read and agreed to the published version of the manuscript.

Acknowledgments

V.F. and S.S. would like to thank Ministry of Construction and Housing of Israel for the financial support of the research (Grant 3/2019, 4501851885).

Conflicts of Interest

The authors declare no conflict of interest.

References

  1. Lockner, D. The role of acoustic emission in the study of rock fracture. Int. J. Rock Mech. Min. Sci. Geomech. Abstr. 1993, 30, 883–899. [Google Scholar] [CrossRef]
  2. Grosse, C.U.; Ohtsu, M. Acoustic Emission Testing; Springer: Berlin/Heidelberg, Germany, 2008. [Google Scholar]
  3. Anders, M.H.; Laubach, S.E.; Scholz, C.H. Microfractures: A review. J. Struct. Geol. 2014, 69, 377–394. [Google Scholar] [CrossRef]
  4. Manthei, G.; Plenkers, K. Review on in situ Acoustic Emission Monitoring in the Context of Structural Health Monitoring in Mines. Appl. Sci. 2018, 8, 1595. [Google Scholar] [CrossRef]
  5. Khoshouei, M.; Bagherpour, R. Application of Acoustic Emission (AE) in mining and earth sciences: A review. Min. Geol. Pet. Eng. Bull. 2019, 34, 19–32. [Google Scholar] [CrossRef]
  6. Nejati, H.R.; Nazerigivi, A.; Imani, M.; Karrech, A. Monitoring of fracture propagation in brittle materials using acoustic emission techniques-A review. Comput. Concr. 2020, 25, 15–27. [Google Scholar]
  7. Michlmayr, G.; Cohen, D.; Or, D. Sources and characteristics of acoustic emissions from mechanically stressed. Earth-Sci. Rev. 2012, 112, 97–114. [Google Scholar] [CrossRef]
  8. Smith, A.; Dixon, N.; Meldrum, P.; Haslam, E.; Chambers, J. Acoustic emission monitoring of a soil slope: Comparisons with continuous deformation measurements. Géotech. Lett. 2014, 4, 255–261. [Google Scholar] [CrossRef]
  9. Smith, A.; Dixon, N.; Fowmes, G.J. Early detection of first-time slope failures using acoustic emission measurements: Large-scale physical modeling. Géotechnique 2017, 67, 138–152. [Google Scholar] [CrossRef]
  10. Hu, W.; Scaringi, G.; Xu, Q.; Huang, R. Acoustic emissions and microseismicity in granular slopes prior to failure and flow-like motion: The potential for early warning. Geophys. Res. Lett. 2018, 45, 10406–10415. [Google Scholar] [CrossRef]
  11. Deng, L.; Yuan, H.; Chen, J.; Sun, Z.; Fu, M.; Zhou, Y.; Yan, S.; Zhang, Z.; Chen, T. Experimental investigation on progressive deformation of soil slope using acoustic emission monitoring. Eng. Geol. 2019, 261, 105295. [Google Scholar] [CrossRef]
  12. Lin, W.; Liu, A.; Mao, W.; Koseki, J. Acoustic emission characteristics of a dry sandy soil subjected to drained triaxial compression. Acta Geotech. 2020. [Google Scholar] [CrossRef]
  13. Naderi-Boldaji, M.; Bahrami, M.; Keller, T.; Or, D. Characteristics of acoustic emissions from soil subjected to confined uniaxial compression. Vadose Zone J. 2017, 16. [Google Scholar] [CrossRef]
  14. ASTMD2845-08. 2008 Standard Test Method for Laboratory Determination of Pulse Velocities and Ultrasonic Elastic Constants of Rock; ASTM International: West Conshohocken, PA, USA, 2008. [Google Scholar]
  15. Stephenson, R.W. Ultrasonic testing for Determination Dynamic Soil Mocduli, Dynamic Geotechnical Testing; ASTM STP 654; American Society for Testing and Materials: West Conshohocken, PA, USA, 1978; pp. 179–195. [Google Scholar]
  16. Zimmer, M.A.; Prasad, M.; Mavko, G.; Nur, A. Seismic velocities of unconsolidated sands: Part 1—Pressure trends from 0.1 to 20 MPa. Geophysics 2007, 72, E1–E13. [Google Scholar] [CrossRef]
  17. Chen, Y.; Irfan, M.; Uchimura, T. Estimation of elastic wave velocity through unsaturated soil slope as function of water content and shear deformation. Soils Found. 2019, 59, 2180–2194. [Google Scholar] [CrossRef]
Figure 1. The setup of the US-AE-odometer experiments.
Proceedings 67 00020 g001
Figure 2. The results of US measurements. (a) The example of US measurements by the first arrival method. The yellow curve and blue curves are the signals from generating and receiving US sensors, respectively. (b) The changes of relative US wave speed V n vs. strain variation for four used soil samples. (c) The changes of relative US wave speed vs. applied stress variation for four used soil samples. “Dnatural”, “D0.6–2.36”, “D0.3–0.6” and D0.075–0.3 in the (b,c) figures’ key to symbols stand for natural dune sand, fractions 0.6–2.36, 0.3–0.6, and 0.075–0.3 mm, respectively, while ‘L’ and ‘UL’ keys mean the loading (full line) and unloading (dashed line) branches, respectively.
Proceedings 67 00020 g002
Figure 3. The results of AE measurements. (a) Typical shape of the AE hit caused by the sand loading and unloading. (b) The normalized strain value (calculated as the ratio of the value of strain at loading increment to the maximum strain value) vs. AE hits number per loading (full circles) and unloading (empty circles) increment stage. (c) The normalized stress value (calculated as the ratio of the value of stress at loading increment to the maximum stress) vs. AE hits number per loading (full circles) and unloading (empty circles) increment stage.
Proceedings 67 00020 g003
Publisher’s Note: MDPI stays neutral with regard to jurisdictional claims in published maps and institutional affiliations.

