Abstract
Effective and efficient building renovations require significant data management and analysis. The ability to store, analyse, and display this data in a user-friendly way can play an important role in easing the process. The tools developed by authors of this paper during their work in the BIM4EEB research project are contained in three distinct intuitive applications that will allow users to (a) find recommended positions for HVAC, lighting, and other devices; (b) analyse data from sensors, energy bills, and other sources (weather for example); and (c) manage the data that they have on the above and create new data sets that they can share with other tools.
1. Introduction
Building Information Models (BIM) effectiveness becomes stronger with less “manual” interaction. Depending on human interaction to amend, BIM-based outputs can result in missing and/or duplicate data. Slow interaction with BIM-based building models may result in inaccurate and obsolete information making its way into the models. Cf. [1], it is possible to reduce this direct BIM–human interaction with application of supportive tools for automated gathering and retrieving of data required at various stages of the construction and renovation processes.
The scope of this paper is to describe the process used to create the BIM Constraint Checking, Performance Analysis, and Data Management (BIMcpd) toolset [2] developed by the International Energy Research Centre [3] in the Tyndall National Institute and University College Cork within the BIM4EEB Project [4] activities. Moreover, it will describe in fine-granular detail the Requirements Analysis, System Design, and Object Design (Code) used in creating these tools. The comprehensive document to encompass the BIMcpd toolset is produced with “confidential” status for internal use of the BIM4EEB stakeholders. However, this paper aims to enlighten a wide audience of BIM and other relative stakeholders, e.g., [5] with our latest achievements in the “BIM for renovation” area of science. More information is accessible via links defined in “Supplementary Materials” subsection at the end of this paper.
2. Materials and Methods
The ability to measure savings made in terms of energy, money, and other factors such as CO2 can be invaluable in proving to people and businesses the benefits of energy efficient renovation of their buildings. The BIMcpd toolset (developed in the BIM4EEB project, Work Package 6, Tasks 6.2 to 6.5 inclusive) contains several distinct intuitive applications that will allow the user to (a) find recommended positions for HVAC, lighting, and other devices; (b) analyse data from sensors, energy bills, and other sources (weather for example); and (c) manage the data that they have on the above and create new data sets that they can share with other tools. Any improvements and corrections that arise are noted, rectified, and updated to include any additional elements not previously covered for all three BIMcpd interconnected components, i.e., “c”—Constraint Checking, “p”—Performance evaluation, and “d”—Data Management.
These tools were designed to ensure minimum complications for the user while maximising the outputs of each tool. Through a series of form wizards, the users are guided throughout each process.
The constraint checking tool (i.e., “c” part) is designed to include as much references to building regulations as possible, and calculations were made using recommended guidelines.
The performance analysis tools (i.e., “p” part) were split into two separate modules: (a) data viewer, for viewing data uploaded in the data management module and applying outlier detection methods to the data, and (b) measurement and verification (M&V), for creating a baseline model of the building prior to the implementation of Energy Conservation Measures (ECMs) or building renovation and comparison post-work, and creating a reporting period model to calculate energy and other savings, in addition to applying non-routine adjustments to the reporting period.
The data management tool (i.e., “d” part of the BIMcpd toolset) is designed to reduce the time consumed in data entry; it allows users to map data uploaded to our database schema and make the data immediately useable in the performance analysis tools.
2.1. Users of the System
The tools developed in BIMcpd are designed to be used mostly by the following stakeholders:
- BIM Designer: These individuals will be able to check their model against building codes to ensure they are compliant;
- Energy Auditor: Energy auditors will use BIMcpd to conduct energy audits. BIMcpd will support compliance with the standard EN 16247 Energy Audits [6];
- M&V Practitioner: M&V practitioners will use BIMcpd to execute M&V projects;
- Administrator: A number of functions and system attributes may need modification from time to time. It is envisaged that these modifications will be undertaken by an Administrator familiar with the software architecture.
2.2. Methodology
The BIMcpd toolset employs the traditional software development process, which includes specifically dedicated documentation. This process of development was divided into three sections and described with the following documents: (a) Requirements Analysis, (b) System Design, and (c) Object Design. There is combined report being delivered in addition to the software tool itself. It includes the following components:
- Requirements Analysis Document (RAD): This document describes what the tool will be required to do. It starts from the task description from the proposal and expands it out into the smaller elements in order to ensure the requirements are met.
- System Design Document (SDD): This document follows on from the RAD and starts designing the tool (using UML and mock-ups). Once this is populated, the implementation can commence.
- Object Design Document (ODD): The ODD will describe the algorithms that will be used in BIMcpd, including the database schema.
- Software Testing Report: This report describes the tests that were carried out on the software tool to ensure that it is usable.
This documentation process has created a logical flow from the definition of the BIM Constraint Checking, Performance Analysis, and Data Management application right through to the design and implementation module.
Methodology Breakdown
The Constraint Checking Tool: The focus of this tool was the extract of information from an IFC file (e.g., demo-site BIM model) and comparing it with data stored in our database, which allows the values from the model to be checked to ensure they are compliant with existing building codes, such as fire or lighting regulations. The main output of that would be an on-screen (exportable) report which highlights where the BIM model does not comply with the regulations and why it failed, for example: fire doors not compliant with that specific countries building code.
The Performance Evaluation Tool: This is following the Measurement and Verification (M&V) process and principles [7], while allowing data uploaded by the user to be modelled. A baseline model can be created (prior to the renovation work being carried out), and a reporting period model can be created (after the renovation work is carried out).
The Data Management Tool: Data model type is chosen by a user, with Simple Linear Regression (SLR), Change Point Regression (CPR), and SLR/CPR with Filtering. Data can also be viewed independently (i.e., not modelled with other data) and displayed in a variety of formats. In addition, data can be manipulated, such as data filtering and outlier identification. Non-routine adjustments [8] can also be applied to the reporting period model, allowing users to indicate a change in circumstances between the baseline and report modelling periods (such as change in occupancy of the building). All data uploaded in this Data Management Tool is accessible in the Performance Evaluation Tool mentioned above.
The data saved to a MySQL relational database consisting of an extensive list of potential data types, which will allow a large variety of data to be saved, thus future proofing the tool. Data tags are provided to be applied to all data uploaded into the database [9]. These tags and other details, when uploaded by a user, will allow him/her to create metadata files and ensure compliance with GDPR Article 24 [10]. Data tags can be added by users to provide an accurate description of the data they are uploading.
3. Results and Discussion
BIMcpd toolset consists of a responsive web-based software application constructed on the Bootstrap 3 Framework and includes a secure user registration/login system. The tools developed in BIMcpd set will include PHP, JavaScript, jQuery, Python, MySQL, and JSON.
3.1. Constraint Checking Tool
The generic requirements of this engineering tool were developed to support constraint checking based on BIM-specification. Examples for BIM requirements were converted into multiple modules, i.e., (i) possible positions for ducts and cable runs, (ii) consideration of fire zones, (iii) position of switches (e.g., for elderly living), and (iv) install-zones for devices. The resulting software component allowing constraints’ checking of BAC-topologies against selected building codes.
This tool will provide information to the user of electrical socket locations, air inlets/outlets required for space usage/size, fire doors, escape routes, fire extinguishers, fire, and CO and CO2 detectors required in a space. This is with respect for space usage and other devices installed or that may be required, depending on the building codes for the country of the building’s location. To sum-up, the Constraint Checking Tool wizard is a user-friendly straight-forward tool that makes the process of identifying ideal locations for HVAC, lamps, detectors, and other devices easy. Its starts with creation of a project and uploading floor plans, as displayed in Figure 1. Next, the floorplans uploaded are converted to individual floors, where users can provide more details for them.
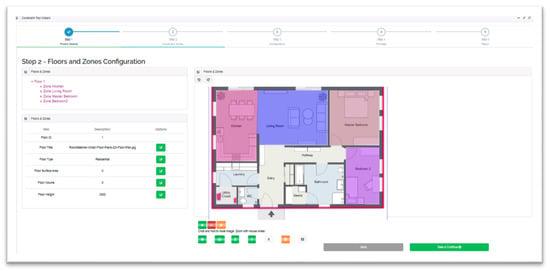
Figure 1.
BIMcpd—Constraint Wizard Processing on Zones.
Once the details of the project have been added, a user will be required to configure the project parameters, e.g., to prioritise in what order the project will be processed (i.e., floors, zones, or functions). The processing step is next, and upon completion, the user can view a complete report of everything that was processed and display a variety of views (heatmap, ducting, electrical, devices, etc.) as displayed in Figure 2. These can be exported as images and excel/csv documents by the user.
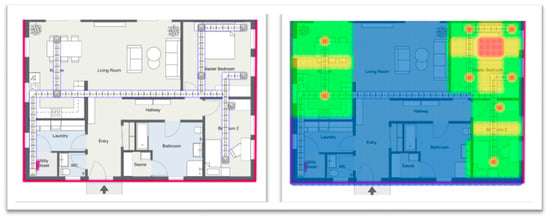
Figure 2.
BIMcpd—HVAC Ducting Placement and Heatmap.
The tool allows users to benchmark their buildings against other buildings of similar type and to create profiles (e.g., types of HVAC diffusers to use, lamps, etc.) for those building types they can use in future projects.
3.2. Performance Evaluation Tool
The acquisition and structured analysis of data compiled from Building Automation Systems (BAS) becomes increasingly important. There exist numerous use cases, such as (i) quality assessment for building operators, (ii) user feedback, and (iii) compliance checks between “design intent” and “as built operation”. This BIM-based performance evaluation tool and a related BIM-compatible meta-data schema is the software component allowing seamless performance evaluation before and after building renovation; the example of comparing with a baseline model is presented in Figure 3.
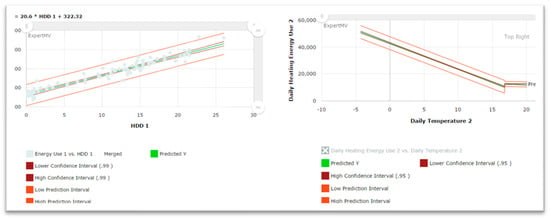
Figure 3.
M&V Tool with examples of Simple Linear and Change Point Regression.
The information models “amalgamate” data sources from BAC and BIM, so the Performance Evaluation Tool consists of the following modules described below.
Data Viewer Module: Here, all data uploaded by the user can be viewed, shared, and exported in numerous formats. The system will examine the data chosen for viewing, and based on the options selected by a user, the appropriate chart types and tables will be available for selection. If data is modified or deleted by a user (a collaborator or someone that has been given access by the data owner), this version of the data is saved to a different database table to ensure that tractability of the data source is maintained. If data is modified or deleted by the owner, the database is updated to reflect this alteration. This data is not removed from the database, but simply hidden from users’ access. Data modified or deleted can be also restored. As described in Figure 4, the Data Viewer displays data in a high-quality interactive format and currently can display data in over twenty different formats (automatically generated based on the database query).
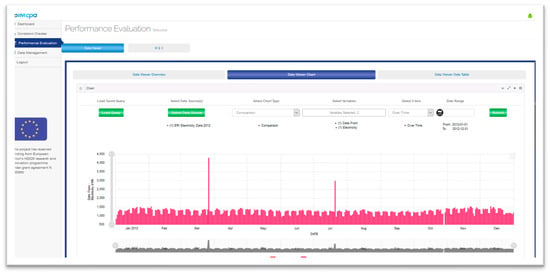
Figure 4.
Data Viewer Tool.
Measurement and Verification (M&V) Module: It is created to undertake M&V of energy savings associated with energy efficiency measures in accordance with the international standard ISO 50015:2014 [11]. When working with a new M&V task, a user will be able to enter text data into a series of “Project Information” text fields to describe the particulars of this task. It will be possible to edit these fields at any stage during the task execution. The contents of these fields will be included in the M&V Plan and M&V report generated by the BIMcpd toolset. Moreover, BIMcpd will provide a view of the data sets for the variables selected for the M&V task. It will be possible to present graphically the values of the variables against time. The presentation of the time series data will enable the M&V practitioner to identify any data gaps and to calculate energy savings as the difference between the energy consumption recorded in the reporting period and the energy consumption calculated by the baseline model with the values of the independent variables in the reporting period.
Data Filtering and Outlier Identification (F&O) Module: The ability to modify data in BIMcpd is essential to ensure accurate models. Filtering involves user-selected data to be filtered out by specific database query (e.g., when one is modelling energy use with HDD and wants to only see the data where building occupancy was over 75%). Additional filtering may involve a user removing items from the results table and re-running the model script to produce a different result.
The Outliers’ Identification involves a series of Python scripts (reflecting numerous dedicated mathematical methods, e.g., Grubbs’, Z-score, Tietjen—Moore Test for Outliers, etc.) being available to a user to apply on initial results, which may produce a different result (e.g., different Predicted Y). Data results are generated from a database query, which creates a JSON file. This outcome data will be presented in both graphical and tabular format from this JSON file. Any alterations to the data will modify this JSON file, thus maintaining the original raw data in the relational database.
The JSON file is stored in the system (in a directory with a reference to the file in the database). Users can recall/reload this file as they wish and can also export it. Moreover, data in the output table can be filtered out by using a search box (e.g., to select a date or sensor etc.), so the results required (graphical and tabular) are displayed.
3.3. Data Management Tool
Within the BIM4EEB Project [4], data gathered from sensors and other related monitoring devices is stored in the relational database management systems (DBMS). This data will also be accessed by other tools and applications, including user-interaction data, and stored in this DBMS. In parallel, this database will be accessed by the Performance Evaluation Tool (as previously mentioned BIMcpd component). A series of its algorithms will perform the data analysis and will display results in a variety of formats to aid decision-making. The BIMcpd Database Management Tool allows data gathered to be managed efficiently and provide the core source of information for data analysis with accurate results. This tool includes not only the relational database system, but also contains options for importing data into the database in the form of a data mapping process, similar to SQL Server import. Data uploaded or imported from other databases can be mapped to the database schema in BIMcpd’s DBMS, as seen in Figure 5.
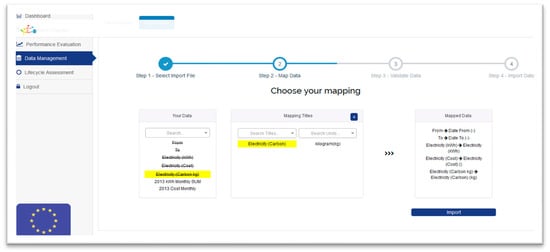
Figure 5.
BIMcpd Data Management Tool—data mapping.
The datasets provided can vary in content from user to user, depending on their origin. These datasets can be imported from varying non-propriety file types and will contain unpredictable units and values. The importance of being able to map the imported data from the file to become a reusable dataset is the underlying BIMcpd feature that allows effective analysis of the data in the Performance Evaluation section.
In accordance with FAIR principles [12], the dataset will be always be documented in the system with its original data. As discussed in the Performance Evaluation Section 3.2, users will have the option to save modified datasets for either sharing with other users or using at a later date as a baseline model dataset. These modified datasets will be saved as a JSON file, which is a non-relational database format, with the database’ reference relative to users and their original query being chosen.
4. Conclusions
Within the BIM4EEB Research Project [4], University College Cork (UCC) is leading Work Package 6, where the BIMcpd toolset was developed. There are two UCC groups (IERG and IERC) that were contributing together to different tasks and project activities. The Intelligent Efficiency Research Group (IERG) is responsible for overall work package activities, while the International Energy Research Centre (IERC) is leading predominantly software development tasks. The IERC has combined these tasks from an efficiency point-of-view to streamline design and development activities. They have created a web-based BIMcpd tool, which has different sections to implement each of the tasks, so there is a clear separation between them. This BIMcpd tool employs the traditional software development process, which includes documentation. There is a combined report being delivered in addition to the software tool itself for the project. The BIMcpd tool will be further progressed within the project in order to update and improve its functionalities to the best extent possible.
Supplementary Materials
The BIMcpd toolset is available online at [2]; all related video and text material are constantly updated on the BIM4EEB LinkedIn page https://www.linkedin.com/company/bim4eeb/.
Author Contributions
Conceptualization: B.O. and A.H.; methodology: B.O.; software: B.O., E.O., F.T., K.M., S.O. (Stephen O’Donovan) and S.O. (Sinead O’Sullivan); validation and formal analysis: B.O. and A.H.; paper writing: A.H. and B.O.; paper review and editing: D.O. and B.O.; visualization: B.O.; supervision and project administration: D.O.; funding acquisition: B.O. and A.H. All authors have read and agreed to the published version of the manuscript.
Funding
The BIM4EEB research was funded by the EU Horizon 2020 Research and Innovation Framework Programme, grant number H2020-NMBP-EEB-2018.
Acknowledgments
The authors want to acknowledge great support of all our BIM4EEB Research Project partners listed here: https://www.bim4eeb-project.eu/partners.html.
Conflicts of Interest
The authors declare no conflict of interest.
References
- Cahill, B.; Menzel, K.; Flynn, D. BIM as a centre piece for optimised building operation. In Proceedings of the eWork and eBusiness in Architecture, Engineering and Construction, European Conference of the Product and Process Modelling, London, UK, 6 July 2012. [Google Scholar]
- IERC; UCC. BIMcpd. 2020. Available online: http://www.bim4eeb.ierc.info (accessed on 11 January 2021).
- IERC. International Energy Research Centre. 2020. Available online: http://www.ierc.ie/ (accessed on 11 January 2021).
- BIM4EEB Consortium. 2020. Available online: https://www.bim4eeb-project.eu (accessed on 11 January 2021).
- EASME on Behalf of the European Commission. Build Up The European Portal for Energy Efficiency in Buildings. Executive Agency for Small and Medium-sized Enterprises (EASME). 2020. Available online: https://www.buildup.eu/en (accessed on 11 January 2021).
- CEN/CLC/JTC 14. Energy Management and Energy Efficiency in the Framework of Energy Transition. European Committee for Standardization. 2012. Available online: https://standards.cen.eu/dyn/www/f?p=204:110:0::::FSP_PROJECT,FSP_ORG_ID:35014,2340498&cs=1B2781618A92D90EA1460D4E8A69161CB (accessed on 11 January 2021).
- EVO. What Is M&V. Efficiency Valuation Organization. 2020. Available online: https://evo-world.org/en/m-v/what-is-m-v (accessed on 11 January 2021).
- ICP. Stopping M&V Adjustment Abuse. Investor Confidence Project. 2014. Available online: http://www.eeperformance.org/blog/stopping-mv-adjustment-abuse (accessed on 11 January 2021).
- Project Haystack. Project Haystack-Tags. 2020. Available online: https://project-haystack.org/tag (accessed on 11 January 2021).
- EU. General Data Protection Regulation. 2016. Available online: https://gdpr-info.eu/art-24-gdpr/ (accessed on 11 January 2021).
- International Organization for Standardization (ISO). Energy Management Systems—Measurement and Verification of Energy Performance of Organizations—General Principles and Guidance. 2014. Available online: https://www.iso.org/obp/ui/#iso:std:iso:50015:ed-1:v1:en (accessed on 11 January 2021).
- Go FAIR. FAIR Principles. GFISCO. 2020. Available online: https://www.go-fair.org/fair-principles/ (accessed on 11 January 2021).
Publisher’s Note: MDPI stays neutral with regard to jurisdictional claims in published maps and institutional affiliations. |
© 2021 by the authors. Licensee MDPI, Basel, Switzerland. This article is an open access article distributed under the terms and conditions of the Creative Commons Attribution (CC BY) license (http://creativecommons.org/licenses/by/4.0/).