1. Introduction
The production systems characteristic of the third millennium involve profound changes in their composition that affect both the technical basis and the methods and techniques of management, organization, and quality assurance. Thus, a company will need a high innovation capacity, because, without this element, even if it makes great efforts to capitalize on the material resources at its disposal, it will lag behind in terms of quality.
The customer orientation of a production organization, as a principle of quality management, is materialized by establishing quality objectives and adopting appropriate strategies to ensure competitive advantages. Improving quality must be a continuous and not sporadic action, a prevention of defects and not their remedy, and a systematic, professional approach.
Improving the production process frequently requires significant investments in time and financial resources to identify and implement improvements. It is necessary to carefully consider whether the improvement of the targeted process is the most appropriate for the business strategy, before making the investment.
Among the component management processes of quality management [
1], continuous quality improvement has a dominant role in reducing costs and economic growth of organizations. Objectives of the improvement processes can be the following:
obtaining customer satisfaction;
continuous improvement of the quality of products/services;
improving the effectiveness and efficiency of processes throughout the organization;
reduction of losses due to non-quality.
Continuous quality improvement is a type of strategy that can be approached in two ways:
in the classical vision—the strategy of technological innovation, which involves major technological changes, as a result of which the improvement of products is achieved with substantial investment efforts in order to obtain rapid economic effects;
in the modern vision—the Kaizen strategy, which is considered an integrative strategy of the marketing, design-development, and production strategies of the company that pursues the gradual and continuous improvement of the quality of both products and services [
2] and productivity and competitiveness, with the participation of the entire staff. This strategy adopts the principle of gradual improvement, through “small steps”, which can be achieved with small and continuous investment efforts, through conventional know-how, without major technological changes.
This paper aims to present ways to increase the efficiency of the production activity implemented at the level of an important company of the Romanian car market producing car wiring, cables for photovoltaic panels, and industrial sensors. The company relies on state-of-the-art production processes to make its products and also develops innovative production concepts and products. In this regard, the company aims to continuously improve processes by ensuring quality standards at every stage of project management and the production process, as well as the correction and efficient elimination of errors or defects in the shortest possible time.
2. Theoretical Foundations
For a real image of the situation of a production company, it is necessary to use a key performance indicator that highlights as accurately as possible the level of performance of the company [
3] at a given time. For predominantly automated activities, an optimal indicator is overall equipment efficiency (OEE). This indicator was created as part of the concept of total productive maintenance (TPM) and is a key performance indicator of the production department. As the machines take over much of the manual labor, it is important to know if these machines are working properly and at the desired efficiency. This aspect becomes even more important as the demand increases, and the question that arises is whether additional equipment is needed, which involves large investments for the company.
The OEE provides a measurement method that gives a correct perspective of the performance of the equipment. At the same time, the OEE shows where opportunities for improvement can be identified. Thus, this indicator is not only a tool that can compare the performance of one company with that of another company (benchmarking), but also a tool for continuous improvement. The parameters to be followed in the calculation of the OEE are availability, performance, and quality rate. The beauty of the OEE is that it does not provide a magic number, but offers three numbers that are useful and individual as the situation changes from day to day, and helps to visualize performance in simple terms—a very practical simplification [
4].
3. Materials and Methods
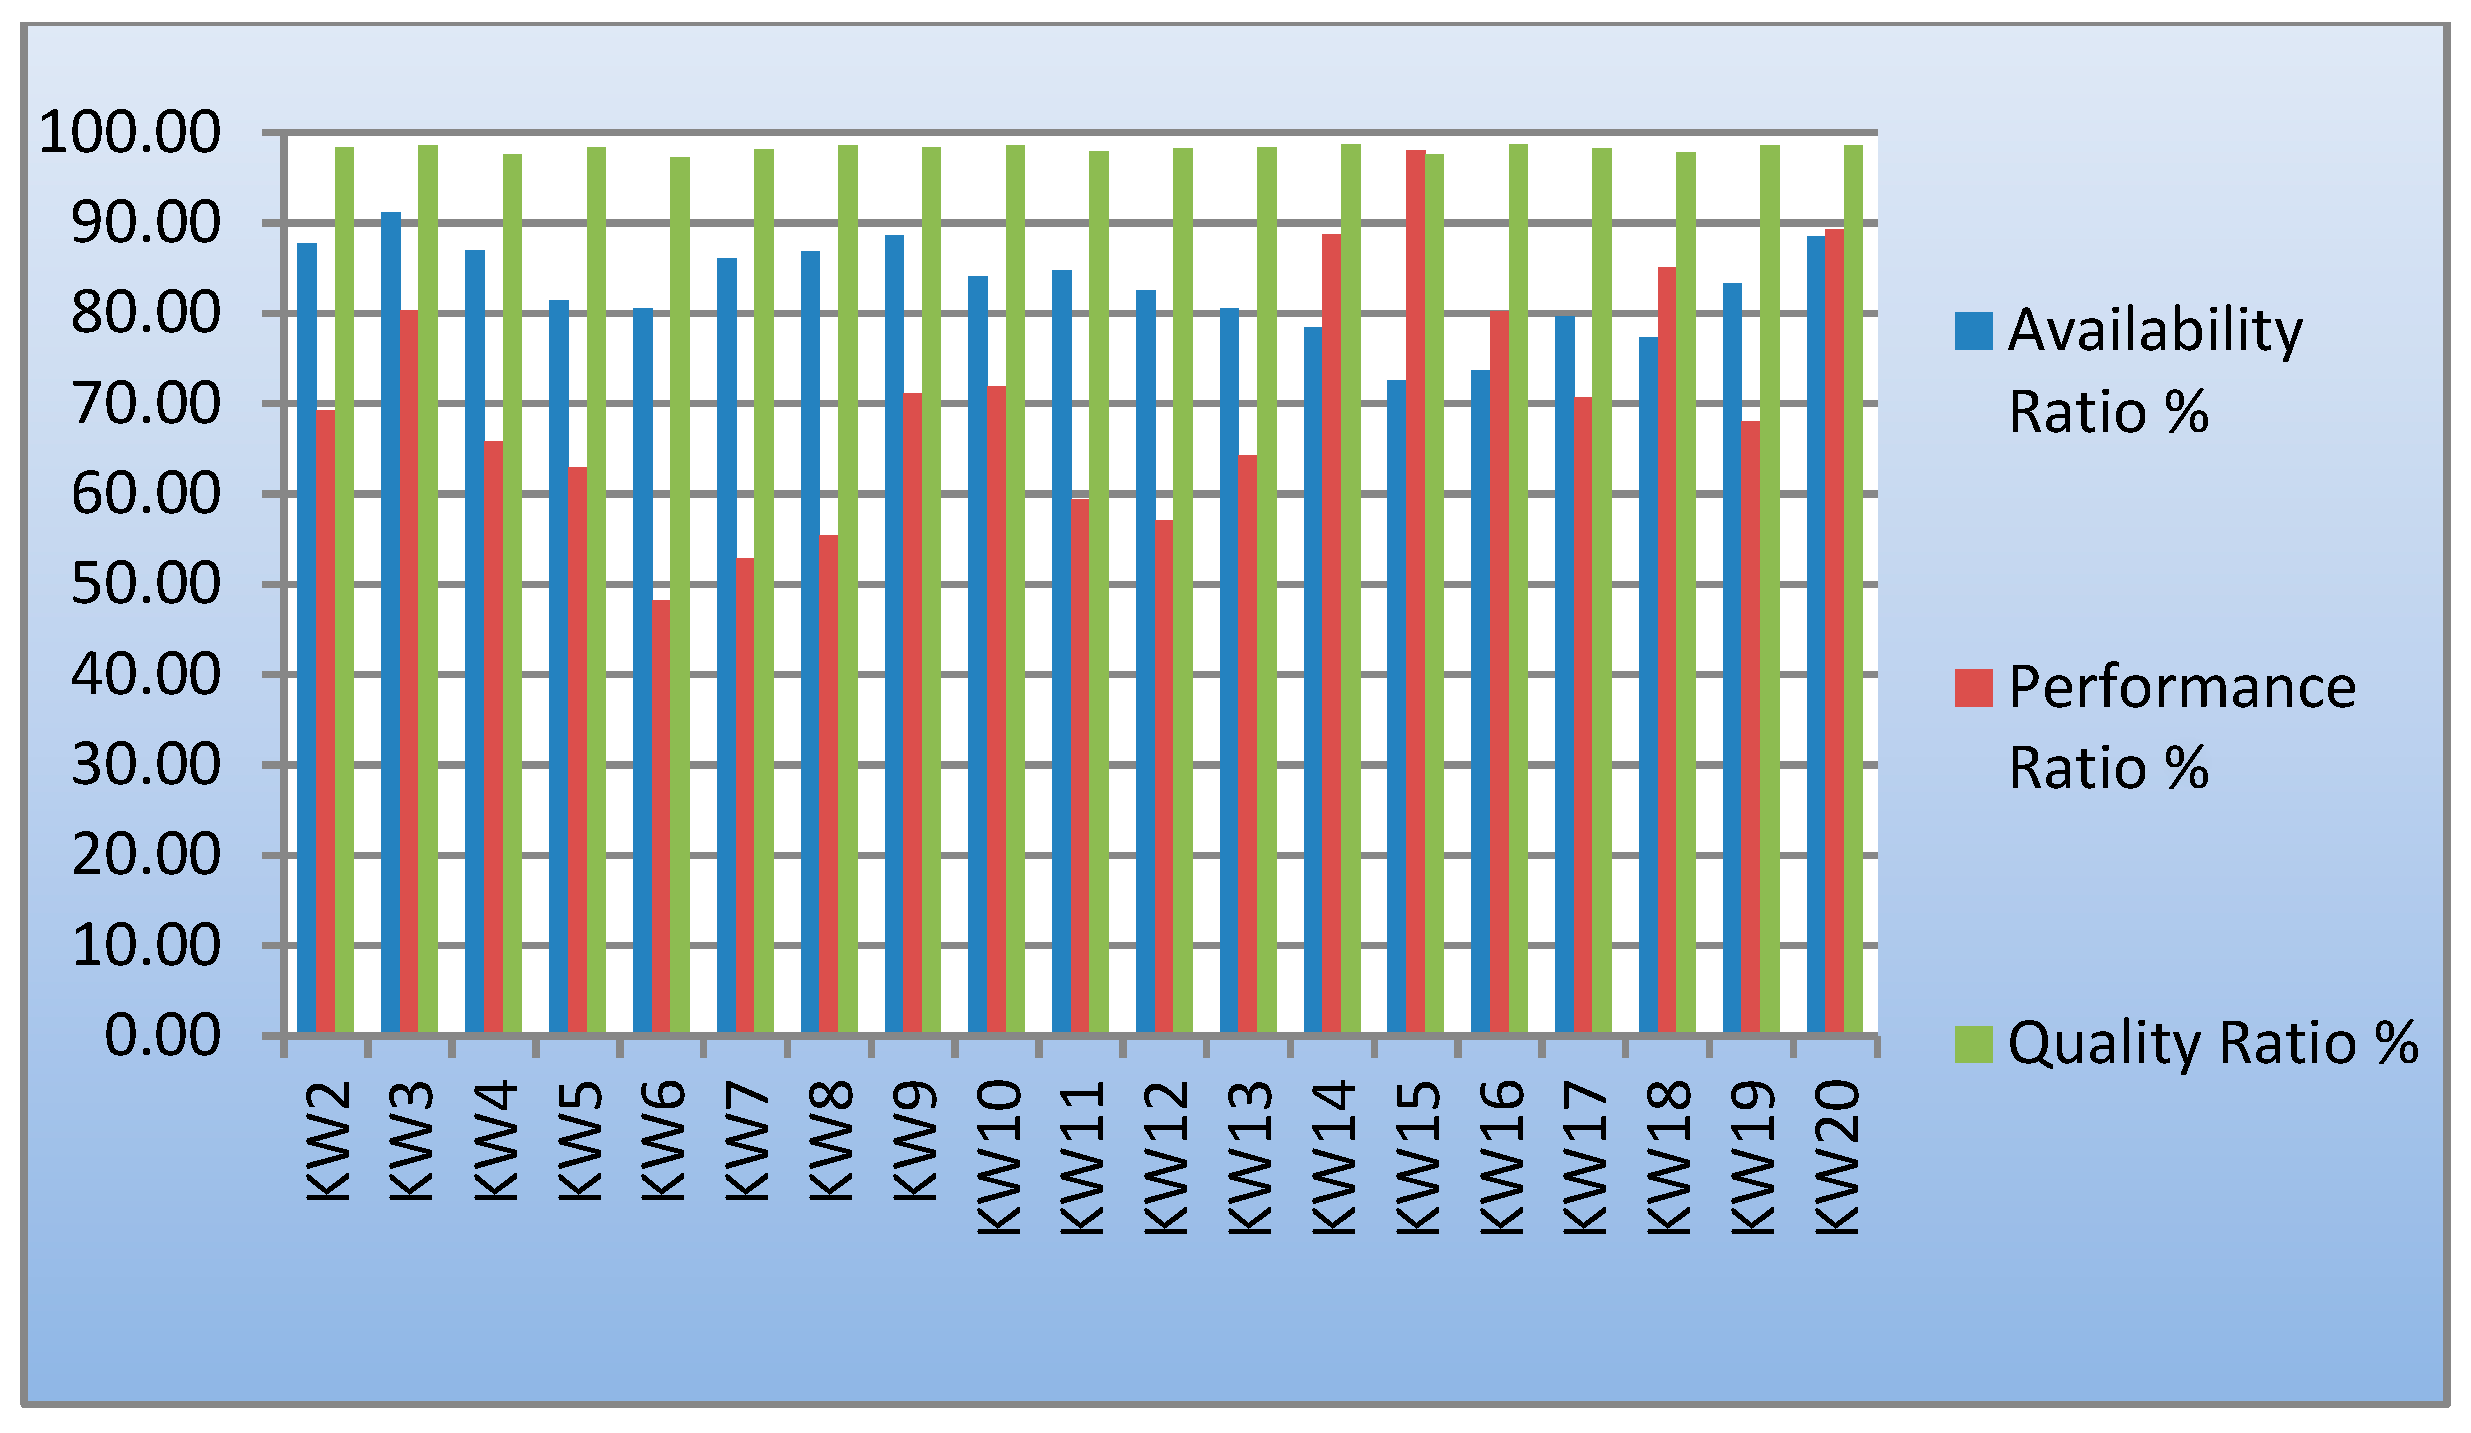
From the evolution of the OEE factors in 2016 at the level of the production department, presented in
Figure 1, there was an average availability of 82.82%, a quality rate of 99.67%, and a lower performance of the machines, on average 70.43%. Compared to global performance, at that time, the possibilities for improvement were significant and actions were required to increase the efficiency of production activity.
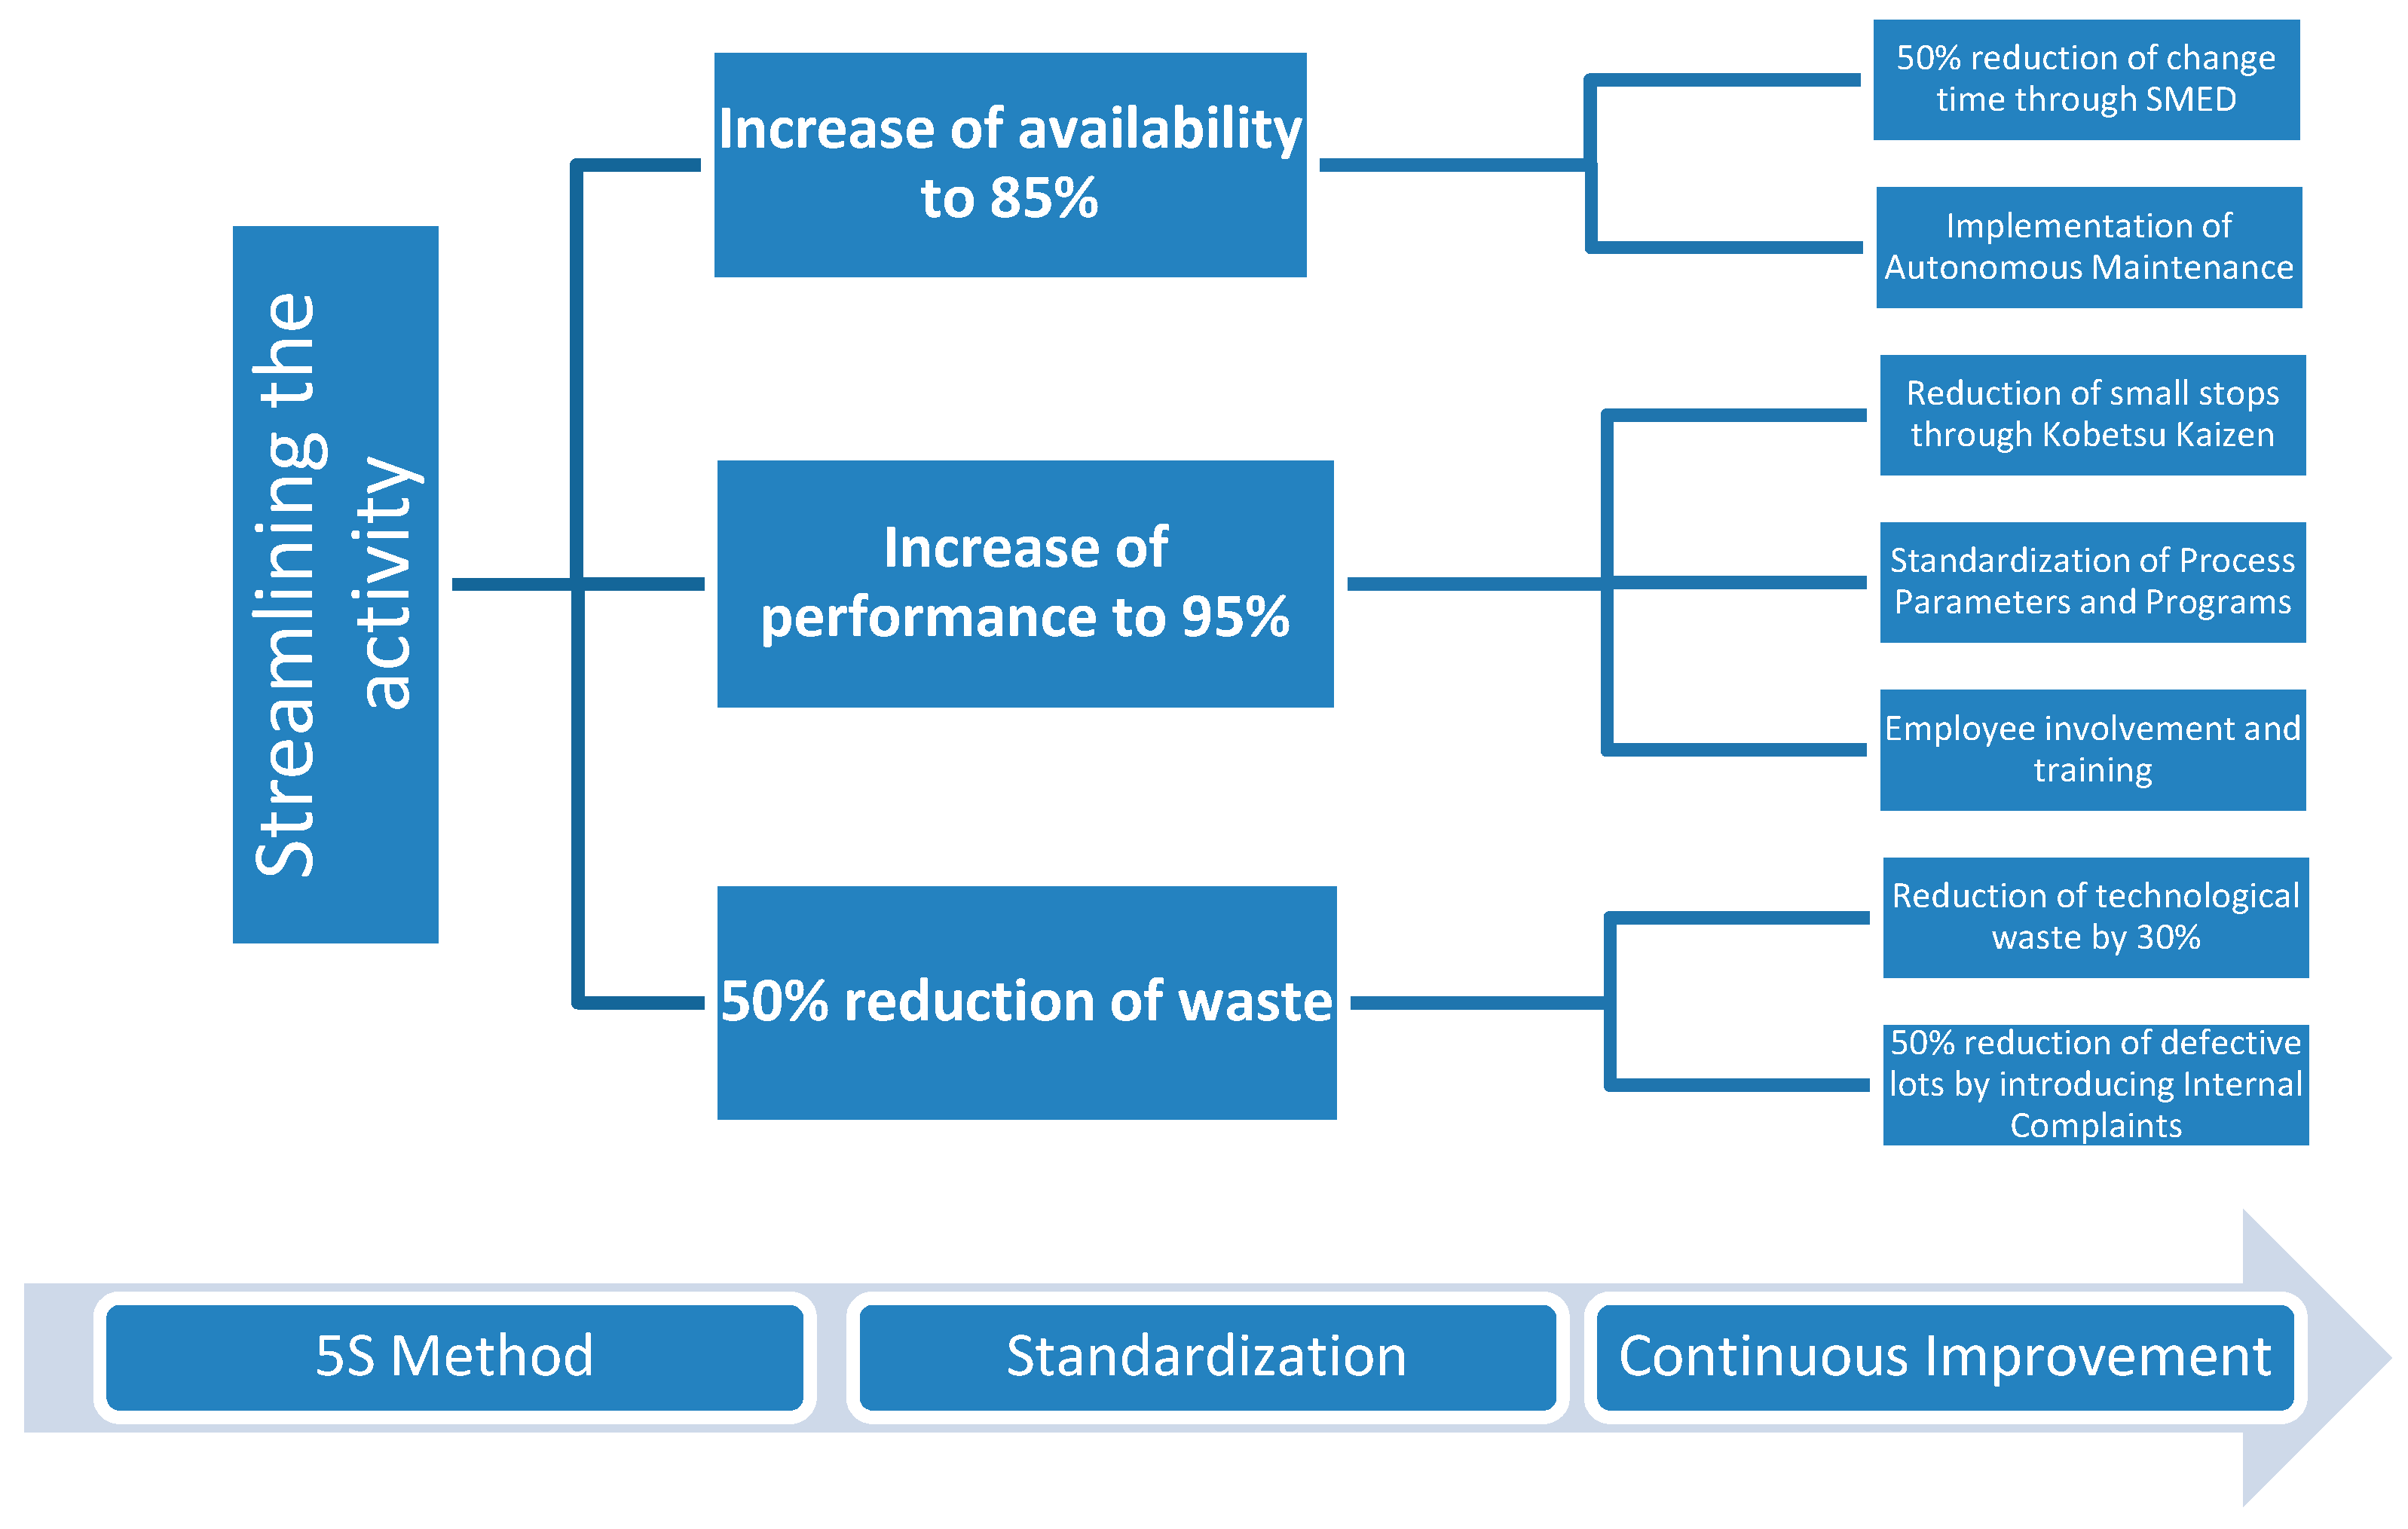
Consequently, the management team set as a major objective the efficiency of the production activity by improving the OEE to 80% by the end of 2016 and 85% by the end of 2017.
In order to achieve the proposed objective, the main objective was cascaded into secondary objectives, all based on the implementation of the 5S method, standardization, and continuous improvement (
Figure 2):
4. Results
4.1. Implementation of the 5S Method
Before any other improvement action, the implementation of the 5S method in the production department was started, with the 5S activities being considered the bases of any improvement project. The implementation was performed on different types of machines, following the replacement of the detected defective parts and the implementation of the ergonomic changes, after which a working standard was created, maintained, and audited periodically.
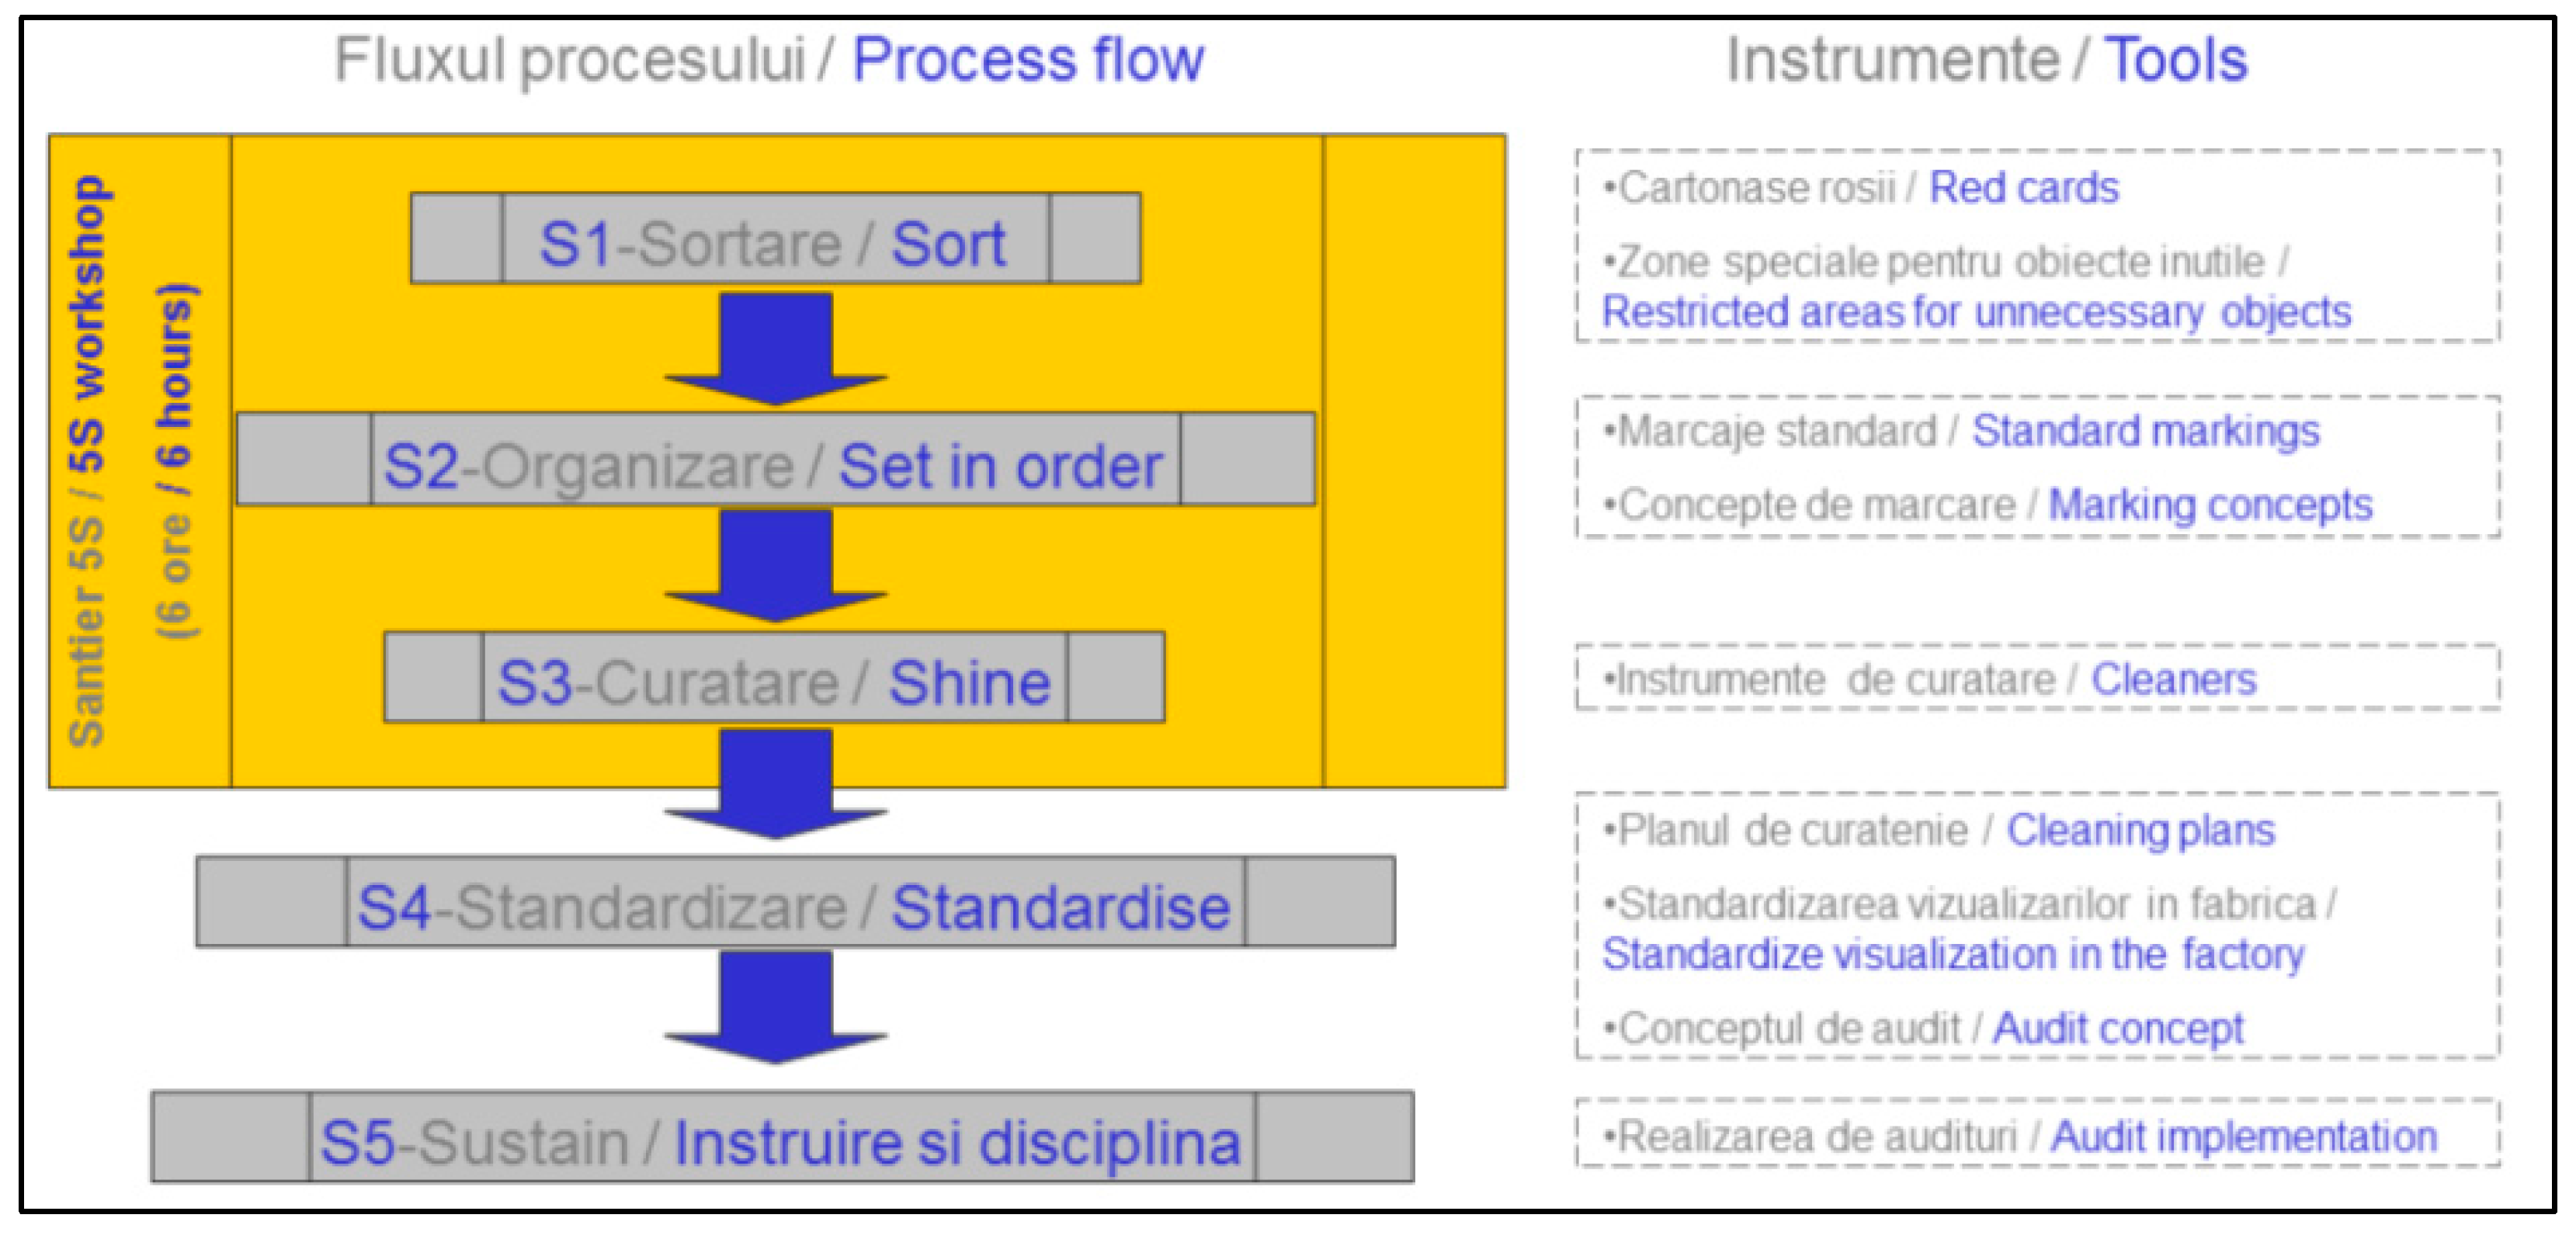
The implementation flow of the 5S Method (sort, set in order, shine, standardize, and sustain) on each workstation is represented in
Figure 3:
The actions and standards resulting from the implementation on each workstation were extended to the entire production department, in order to bring the entire area to a level satisfactory to the 5S method.
4.2. Performance Improvement: Kobetzu Kaizen
Small machine stops for operator confirmations, small adjustments, product tub emptying, and low working speeds due to wear are all causes that can significantly reduce machine performance and cannot be recorded by the operator as downtime due to the fact that they take a little longer (on the order of tens of seconds) than their recording would take. They are the subject of a study for “Kobetsu Kaizen”, a method applied to increase the performance of machines.
To carry out the study, the following steps are followed:
Two or three hours of activity of a machine are filmed, during which the operating parameters, the quantity produced, the qualitative problems, and the organizational problems that prevent the realization of the production in optimal conditions [
5] are noted.
The movie is watched, noting the duration of each production stop and grouping the stops by cause.
The causes that lead to low stops/speeds are analyzed, and corrective and preventive actions are proposed.
The causes are eliminated, and the filming is remade, comparing the obtained results.
If the results are satisfactory, the corrective actions are extended to the remaining machines.
Following the analysis of the data resulting from the filming, the causes leading to the stops were grouped and their recurrence studied, resulting in 6.5% of the total stop time not being recorded. Thus, the total elimination of these causes could increase the performance of the car by about 2%.
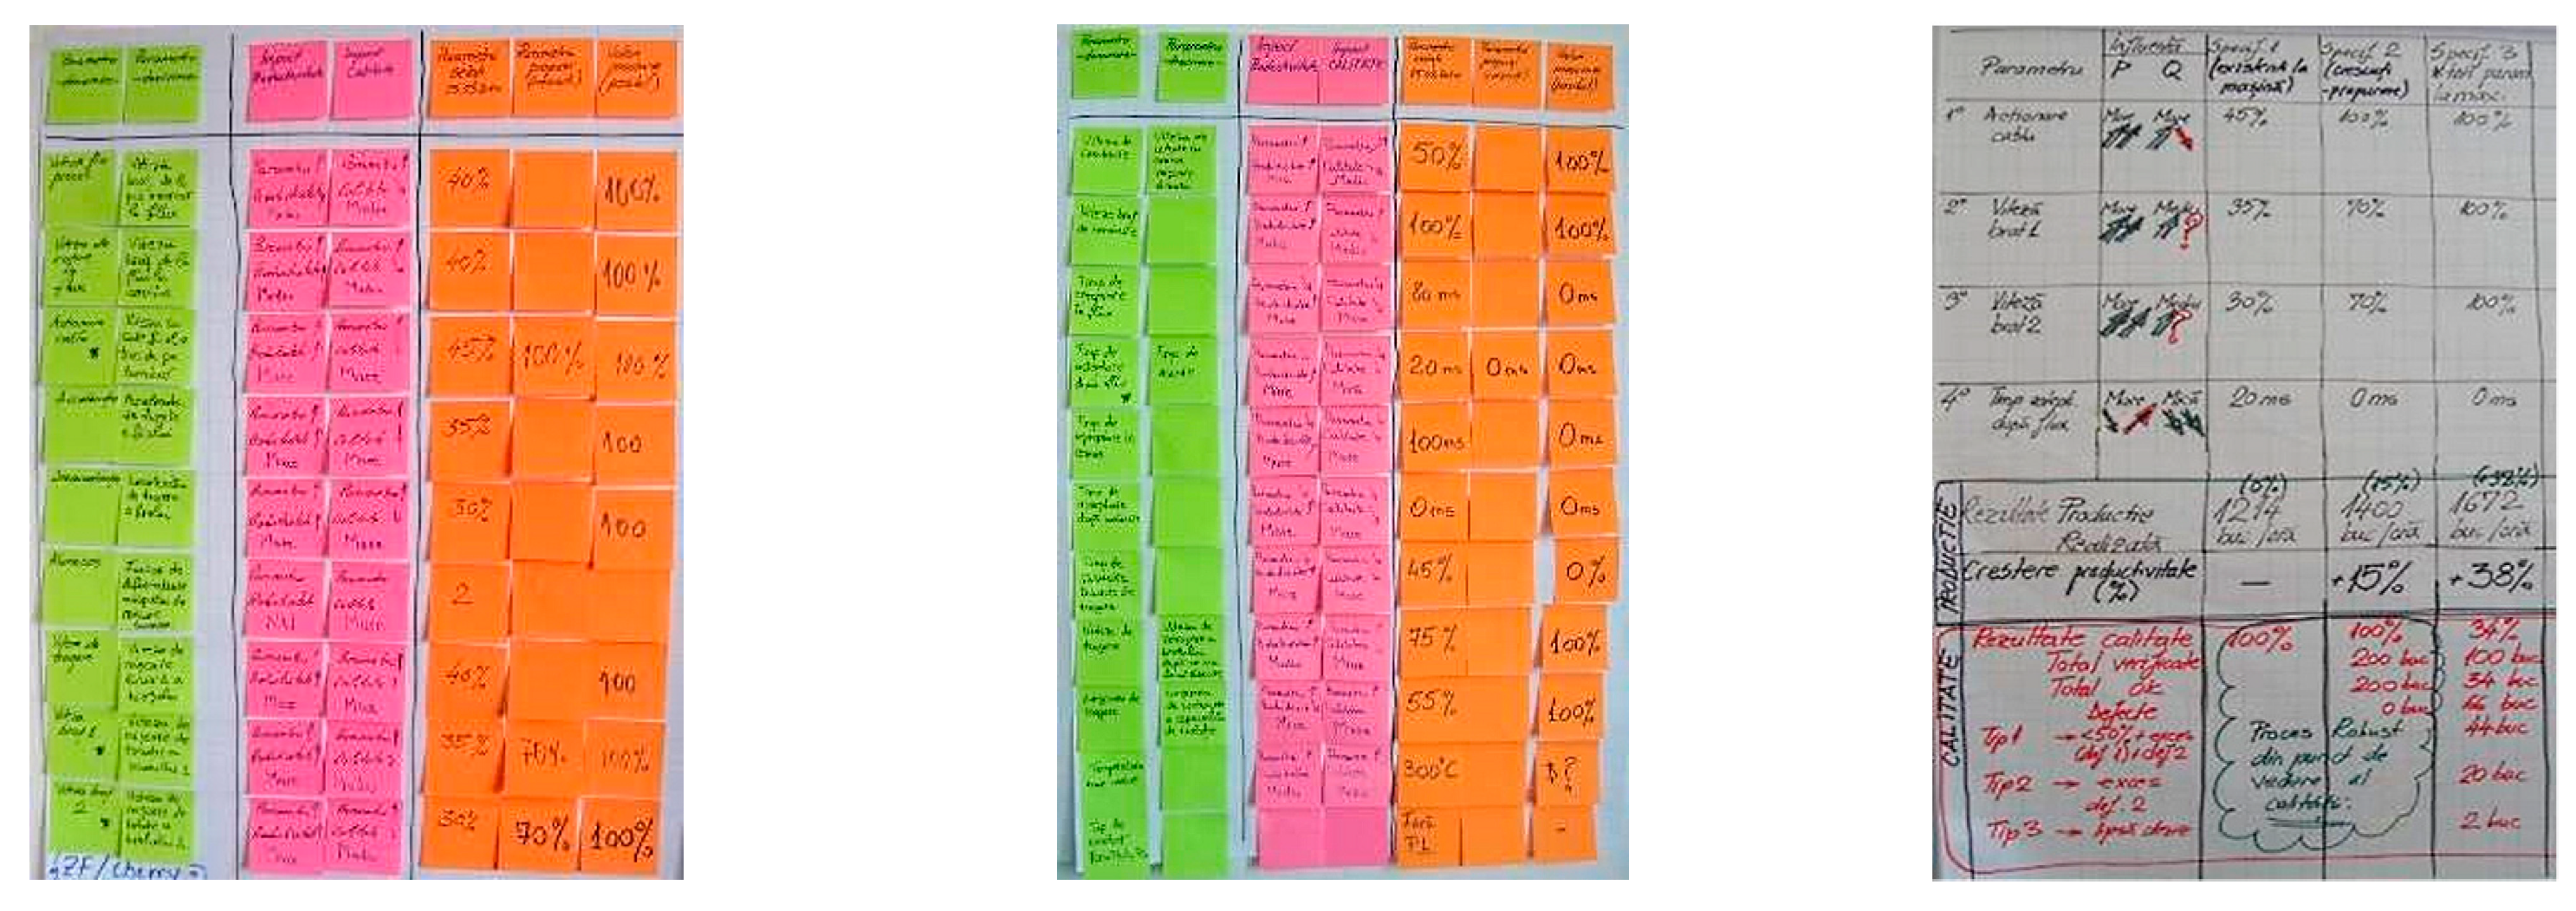
The operating parameters of the machine with an impact on productivity [
6] and quality were analyzed, studying their effect on quality when maximizing values to improve performance (
Figure 4). In the 2 h of monitoring, the machine achieved, with the initial parameters, 1214 pcs/h. With the parameters set to maximum productivity, it would have been possible to achieve 1672 pcs/h; however, with these settings, the scrap rate increased by 34%. Following the analysis of the weight of the parameters on the quality, a set of optimized parameters was defined, parameters with which the production was 1400 pcs/h, obtaining a 0% rejection rate. Thus, a 15% increase in the machine’s performance compared to the initial value was obtained.
The set of parameters accordingly determined was standardized for the remaining machines with identical processes, thus ensuring the development of the concept of “best practice”.
4.3. Reduction of Technological Waste: 6 Sigma
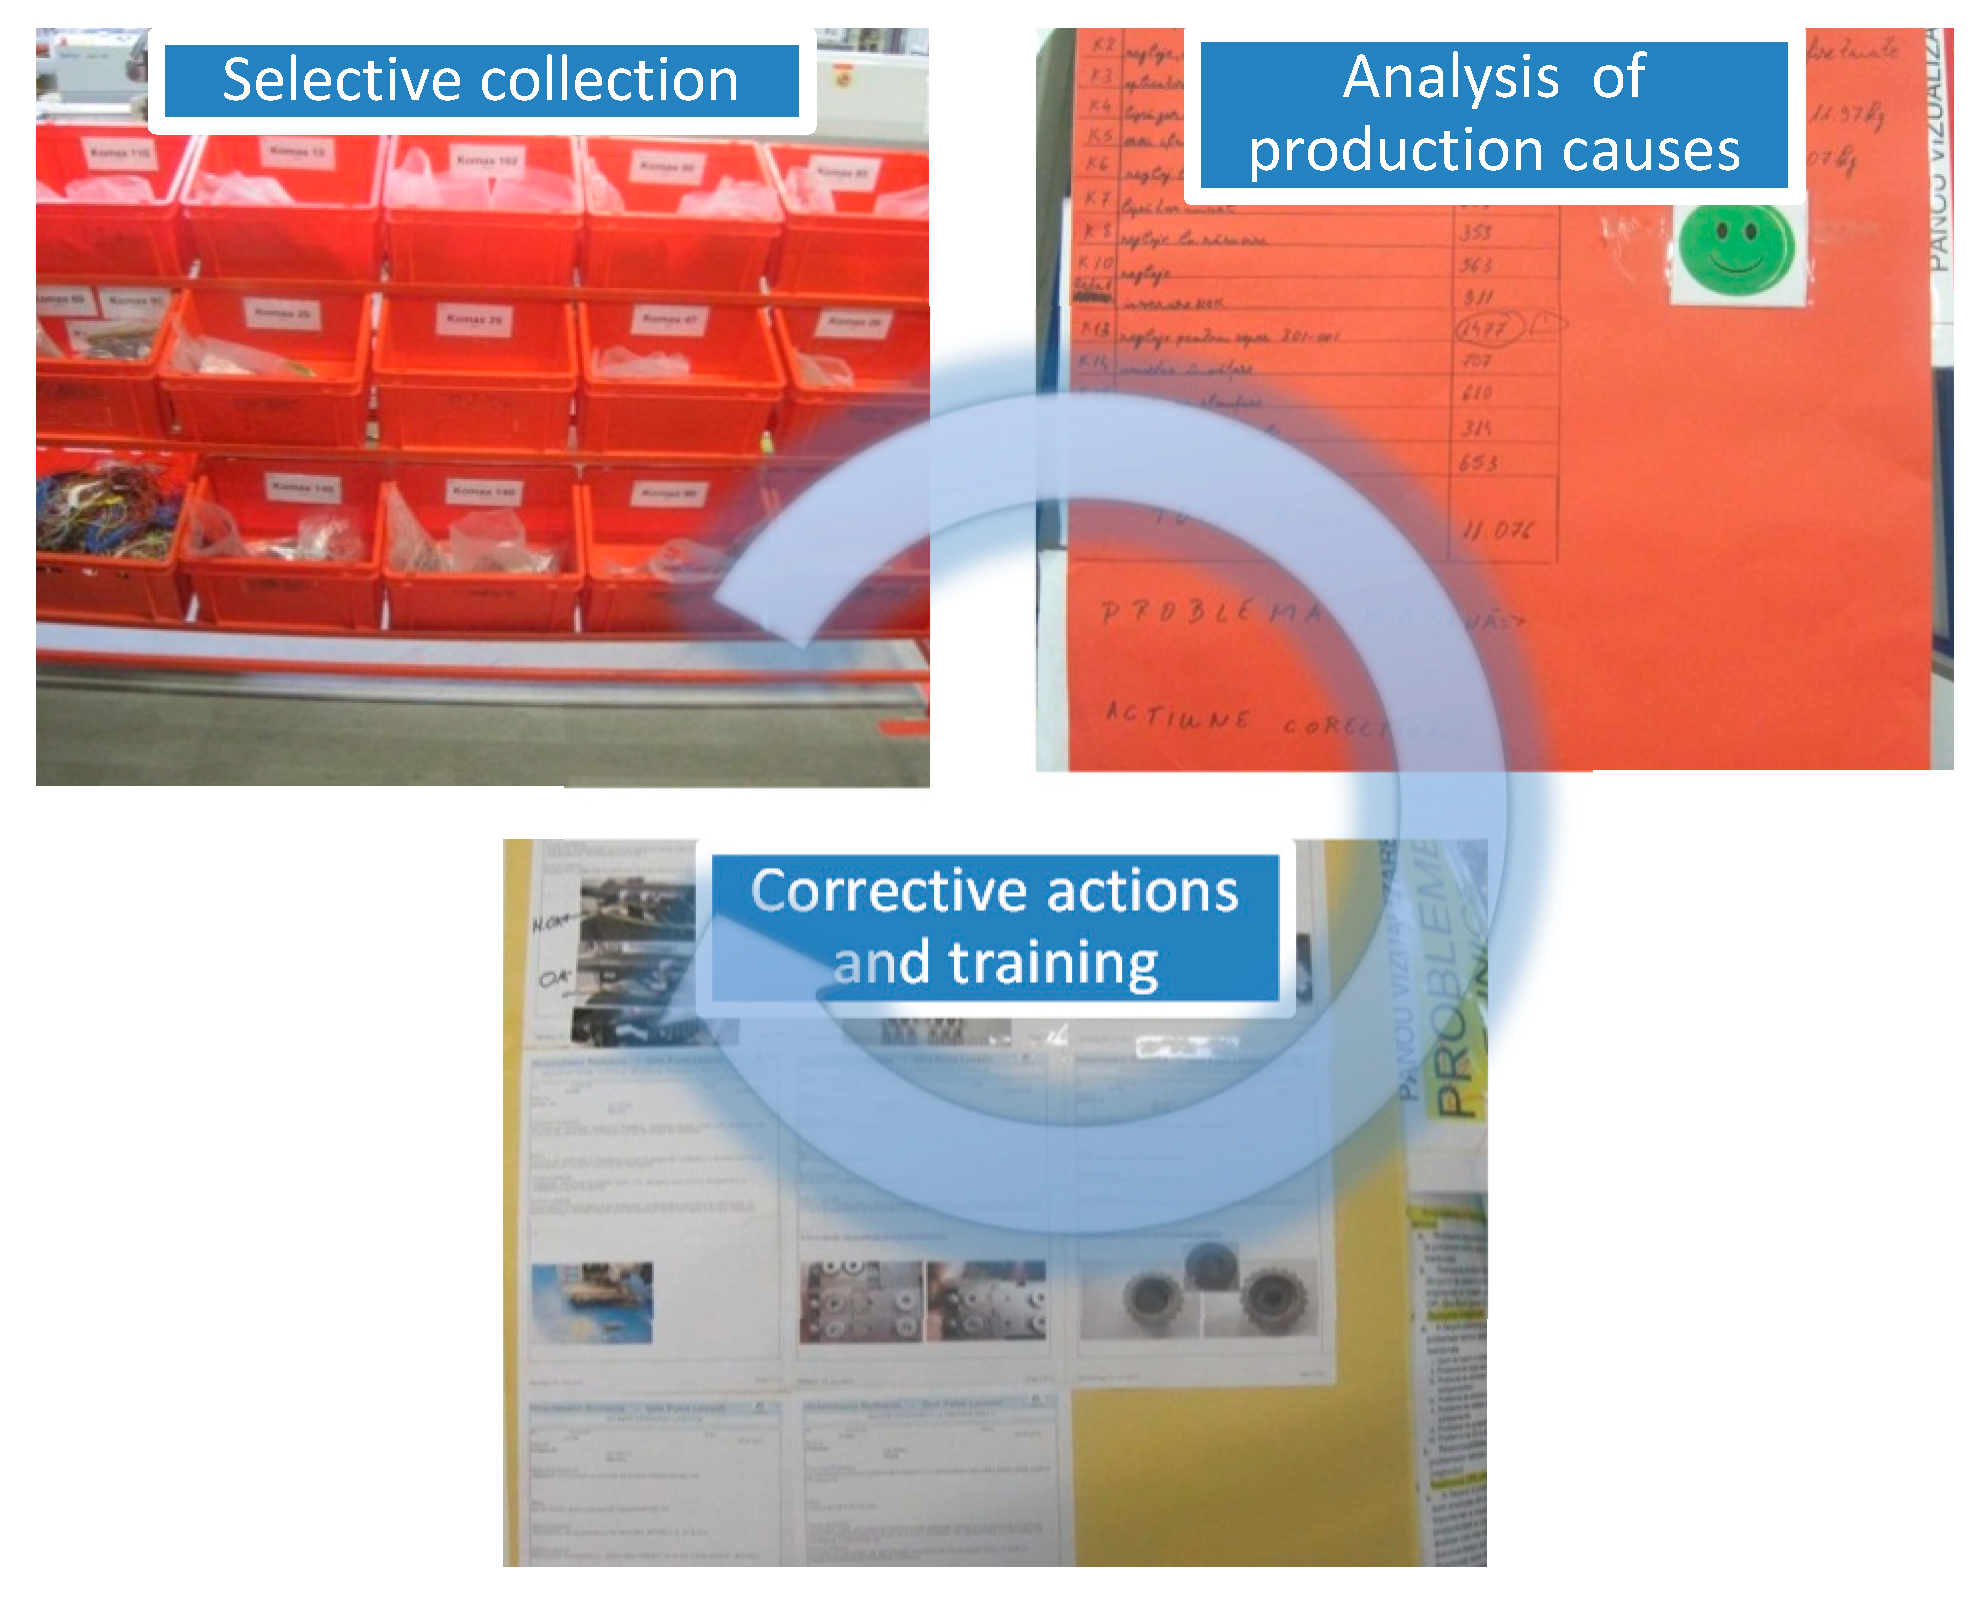
Only through the impact of selective collection and daily analysis, without taking other actions, the amount of technological waste decreased by 28%. Operators paid more attention to the correct setting of the machine and quickly intervened in the case of defective products.
Daily, the project team analyzed the defects and their mode of production, as well as their distribution by categories, taking actions to prevent recurrence. The resulting information was presented to all operators in the daily quality meeting (
Figure 5), and the implemented technical solutions were distributed by conducting open punctual lessons (OPL).
The evolution of the amount of technological waste was monitored daily and reported monthly, also being an indicator of the performance of the production department [
7]. For any major deviation from the maximum permitted limit or for an unfavorable evolution of the quantity of waste, an analysis was performed, and corrective and preventive actions were taken.
The analysis was performed by the entire management team with the participation of experienced operators. Moreover, operators had an active role in solving quality problems, participating with ideas and solutions in the analysis of the situation.
The identified systematic technical problems leading to the production of technological waste (e.g., wear of stripping knives, nonlinearity of the storage tub to the machine, and nonlubricated applicator) were introduced in the daily checklist (autonomous maintenance sheet), so that the operator could check these points daily, thus preventing the production of waste.
Starting in 2017 from an average of 150 kg of waste/1,000,000 products made, at the end of 2018, a stable situation of 32 kg of waste/1,000,000 products was reached.
4.4. Internal Delivery Performance
From a procedural point of view, the output elements of the production department are input elements for the other departments, with the production department being an internal supplier of semi-finished products for the other departments.
Thus, not only are internal improvement projects required, but also projects that directly satisfy the requirements of the client, with respect to the department for the client. For this, starting with 2018, the monitoring of the degree of satisfaction of the requirements was started, through the indicator “performance on delivery”, which was calculated as the ratio between the number of products delivered on time and the total number of products required.
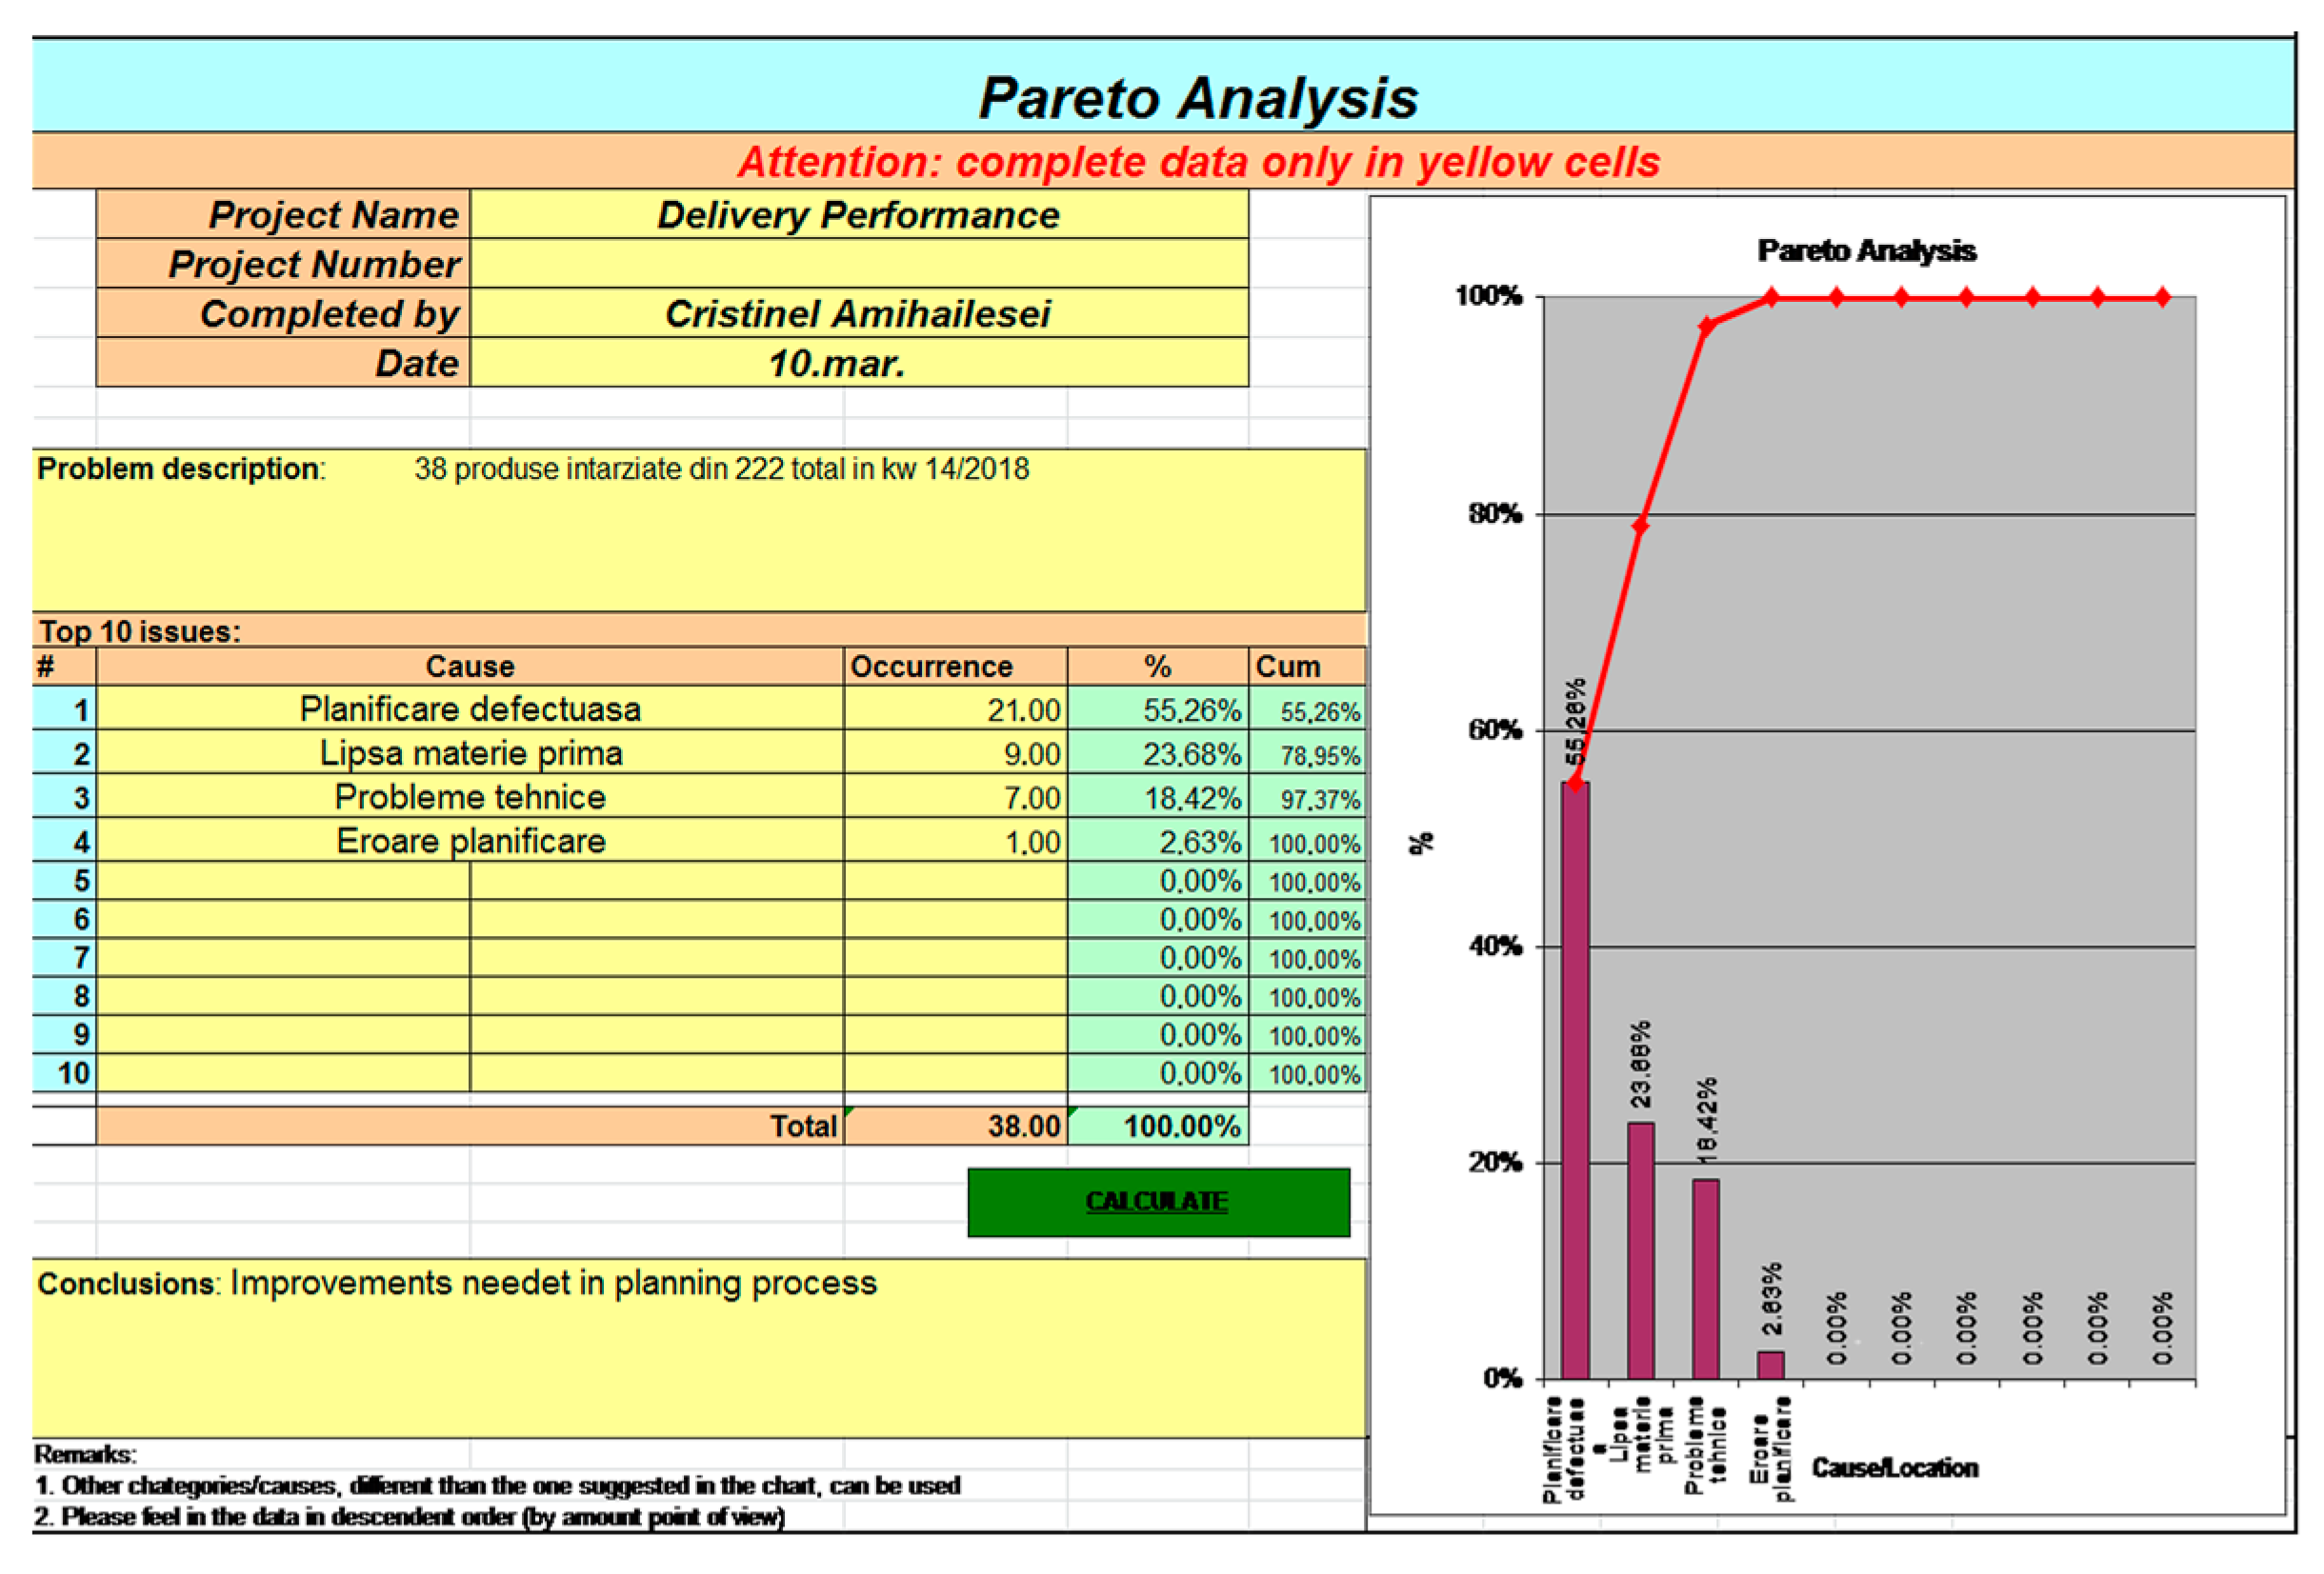
From the analysis of the situation at that time, as can be seen in
Figure 6, it emerged that the problem of delayed delivery of products was poor production planning.
In this regard, analyses and actions were taken to achieve the goal of 95% delivery performance by mid-2019.
Initially, the planning of the products on cars was done manually, with the information written on a panel of considerable size and replaced weekly. The advantage of this method was that the panel was visual, centrally located, and accessible by anyone who needed information, even simple operators. Disadvantages were as follows:
information could be easily lost;
the allocation of parts on cars was done according to experience;
the data from the previous weeks could be stored only in the form of a photograph, making their analysis extremely difficult;
the process of allocating products on machines and prioritizing them took about 20 h a week.
As the first solution to improve the planning process, an Excel file for electronic planning management was proposed and developed, which, in addition to the much more accurate storage of information, allowed analysis of the planning process. Every day, the reason for delaying the delivery of a product was documented in the file. Some examples were the following:
The data were extracted weekly and their summary sent to the responsible persons.
As a result of this planning file being continuously supplemented with new data, one year after its implementation in production activity, the following improvements were made:
prioritization of products was done automatically depending on the delivery date;
the allocation of products on machines was assisted by the system by suggesting the machines capable of making the respective product;
overloading or uneven loading of machines could be avoided by graphically displaying the capacity of the machine;
by graphically viewing the orders per day, the peaks could be avoided and a leveling of the orders could be achieved;
the production rules were updated automatically from the central information system (SAP);
escalation of technical problems and lack of raw materials was done automatically by activating a macro that sent an email with the extract of information to the people involved;
filling in the information in the file was done in real time, and, by sharing the support, departments could provide feedback to the problems reported directly in the file.
By optimizing the planning process [
8], we obtained the following achievements:
reducing the time required for planning from 20 h per week to a maximum of 8 h, in the context in which the number of products increased in 2018 by 43% compared to 2017;
reduction of approximately 53% in human planning errors (from 15 misplaced landmarks in 2017 to seven landmarks in 2018) [
9];
improving delivery performance to 90% by the end of 2018.
5. Discussion
The effects of the continuous improvement actions carried out were visible in the evolution of the indicators at the level of the first semester of 2019.
The OEE not only reached the set target, but significantly exceeded it, with an average of 87.74% in 2018 and 94.36% in the first 4 months of 2019 (
Figure 7).
Upon analyzing the OEE factors, a significant exceeding of the initial working norms was found, with the performance having an average of approximately 121% for the first 4 months of 2019, as well as a slight decrease in availability, partly due to the more precise way of collecting stop data compared to the initial period.
Following the improvement actions carried out, the performance of the cars increased in 2019 by 37% compared to 2016. Admitting a natural increase in this indicator by 12% resulted in a net improvement in performance by 25% following the actions.
In this context, the costs related to training and the implementation of improvement projects did not represent even 1% of the value of cost reductions obtained through performance increases [
10].
If considering a reduction in the amount of technological waste to 25% of the initial quantities of waste or reaching a degree of 95% in delivery performance, the improvements could bring cost reductions [
11] of hundreds of thousands of euros.
6. Conclusions
A production company must represent the image of a well-oiled machine, perfectly organized and controlled, in order to meet customer expectations.
Using the right system for production management can help the organization meet and even exceed the expectations of business partners. It can also lead to better decision-making, improved quality standards, and increased production efficiency, all leading to an easier and faster response of the company to market challenges and ensuring competitive advantages.
A production management system that manages all aspects that easily lead to the improvement of the production activity offers the security of the smooth running of the company’s activity at low costs, giving the management team more time and information needed to develop the activity as it wishes.
