Proceeding Paper

Influence of Sex and Diet on the Gastrointestinal Tract in a Mice Model with Partial Deficiency for TGF-β3 †

by
Paula Gallego
1,‡,
Ana Bagüés
1,2,3,‡,
Elia Escasany
4,
Yolanda López-Tofiño
1,5,
Antonio Márquez
6,
Gema Medina-Gomez
4,*,
José Antonio Uranga
5,6,* and
Raquel Abalo
1,3,5,*
1
Area of Pharmacology and Nutrition, Department of Basic Health Sciences, Faculty of Health Sciences, Universidad Rey Juan Carlos (URJC), Campus de Alcorcón, Avda. de Atenas s/n, 28022 Madrid, Spain
2
High Performance Research Group in Experimental Pharmacology (PHARMAKOM-URJC), Department of Basich Health Sciences, Faculty of Health Sciences, Universidad Rey Juan Carlos (URJC), Campus de Alcorcón, Avda. de Atenas s/n, 28022 Madrid, Spain
3
Associated Unit to Institute of Medicinal Chemistry (Unidad Asociada I+D+i del Instituto de Química Médica, IQM), Spanish National Research Council (Consejo Superior de Investigaciones Científicas, CSIC), 28006 Madrid, Spain
4
Area of Biochemistry and Molecular Biology, High Performance Research Group in the study of molecular mechanisms of glucolipotoxicity and insulin resistance (Lipobeta Group). Department of Basic Health Sciences, Universidad Rey Juan Carlos (URJC), Campus de Alcorcón, Avda. de Atenas s/n, 28022 Madrid, Spain
5
High Performance Research Group in Physiopathology and Pharmacology of the Digestive System NeuGut-URJC, Department of Basich Health Sciences, Faculty of Health Sciences, Universidad Rey Juan Carlos (URJC), Campus de Alcorcón, Avda. de Atenas s/n, 28022 Madrid, Spain
6
Area of Histology, Department of Basic Health Sciences, Universidad Rey Juan Carlos (URJC), Campus de Alcorcón, Avda. de Atenas s/n, 28022 Madrid, Spain
*
Authors to whom correspondence should be addressed.
Presented at the The 1st International Electronic Conference on Nutrients—Nutritional and Microbiota Effects on Chronic Disease, 02–15 November 2020; Available online: https://iecn2020.sciforum.net/.
These authors contributed equally to this work.
Proceedings 2020, 61(1), 18; https://doi.org/10.3390/IECN2020-06983
Published: 30 October 2020

Abstract

:
Functional and structural alterations of the gastrointestinal (GI) tract were evaluated in mice with partial deficiency of TGF-β3 (heterozygous; HZ) and the influence of sex and diet in them. No signs of inflammatory bowel disease (IBD) were detected. Wild type (WT) females presented lower body weight and delayed GI transit compared to males. The HZ genotype modified the latency of marked feces expulsion, in a sex and diet dependent manner, without GI macroscopic structural alterations. A high fat diet (HFD) counteracted TGF-β3 heterozygosity functional effect in males. Sex, diet, and TGF-β3 may alter GI tract motility and structure, with a possible impact on the obesity-associated IBD.

1. Introduction

Transforming growth factor β (TGF-β) is a family of cytokines which, acting through both canonical (SMAD) and non-canonical (MAP kinases (MAPK), Rho-like GTPase, and phosphatidylinositol-3-kinase (PI3K)/AKT cascades, are involved in a wide range of biological processes such as differentiation, proliferation, and apoptosis. Moreover, dysregulation of TGF-β-activated cascades has been correlated with the development of cancer and chronic inflammatory diseases [1,2], highlighting its key role in homeostasis.
The family comprises three isoforms in mammals: TGF-β1, TGF-β2, and TGF-β3. Although similar in their active domain sequences, they activate specific cell-surface receptors and perform different functions. Accordingly, mice carrying mutations for the different isoforms display also different phenotypes [3].
In particular, TGF-β3 is well-known for its involvement in craniofacial development. Mice homozygous for TGF-β3 deletions (TGF-β3−/−) die shortly after birth due to cleft palate and also due to defects in pulmonary and cardiovascular development [4,5,6]. In contrast, mice heterozygous for TGF-β3 (TGF-β3+/−) survive normally, with no apparent external differences with wild type littermates. However, these mice display lower subcutaneous adipocyte progenitor proliferation, but adipose hypertrophy and glucose intolerance upon weight gain induced by a high fat diet [7], suggesting that TGF-β3 is an important regulator of adipose tissue expansion in obesity (favoring subcutaneous adipose tissue hyperplasia, at least in males). Furthermore, some mild cardiovascular malformations associated with dysregulated collagen matrix reorganization and fibrotic lesions were recently described in TGF-β3+/− fetuses, whereas adults are currently being studied [4]. Thus, TGF-β3 mutations result in dysregulated collagen matrix reorganization and fibrotic lesions, at least in the cardiovascular system [4].
Inflammatory bowel disease (IBD) is an inflammatory chronic immuno-mediated disease of the intestinal tract characterized by periods of exacerbation and periods of remission [8]. IBD arises because of genetic, immunological, and environmental factors [9]. The chronic inflammation of the mucosa is a result of the disbalanced immunological defenses of the gastrointestinal tract against alimentary antigens, extracellular contaminants, and pathogens [2]. In order to prevent this inflammation, the body promotes the proliferation of T regulatory lymphocytes to fight pathogens that cross the intestinal barrier [2]. TGF-β balances the proinflammatory and anti-inflammatory processes that take place in IBD [2]. In particular, it is known that TGF-β1 overexpression at the intestinal level promotes spontaneous colitis [10,11], with inflammation and irregular collagen deposition leading to fibrosis [12,13]. However, to our knowledge, the role of TGF-β3 in the gastrointestinal tract has not yet been evaluated.
Crohn’s disease and ulcerative colitis are the main types of IBD [14]. In ulcerative colitis, the inflammatory process affects just the mucosa, starting in the rectum and spreading orally. One of the most characteristic symptoms of ulcerative colitis is bloody diarrhea, but the patient may present abdominal pain or fever as well. Patients with just rectum inflammation may present constipation during periods of exacerbation. In Crohn’s disease, inflammation affects all layers of the intestinal wall, and spreads segmentally from mouth to rectum, with abdominal pain, fever, weight loss, anemia, and diarrhea as characteristic symptoms [14].
IBD can develop at any age and sex, although the incidence of Crohn’s disease is higher in teenagers and middle age women, while in men from 45 years on, the incidence of ulcerative colitis is higher [15]. The incidence is also higher in Western countries such as North America, north of Europe, the United Kingdom, and Australia [16]. However, in the last decades the incidence has also increased in southeast Europe, Asia, and many developing countries where obesity rates have increased. This may be due to changes in lifestyle and diet characteristic of industrialized societies [16]. Thus, high fat diets favor whereas diets rich in fiber, fruit, and vegetables protect against the development of IBD [8,16]. This has also been observed in genetically modified murine models in which Crohn’s disease may be mimicked when these mice are fed a high fat diet [8,17].
Not surprisingly, diet-induced obesity is also a risk factor in the development of IBD. There are 2.100 million overweight people worldwide, of which 600 million are considered obese [9]. The incidence of IBD in obese population (body mass index (BMI) > 30 kg/m2) varies from 15% to 40% [9]. Obesity may be due to an unhealthy diet and lifestyle and/or to genetic factors, and both contribute to IBD development [8,16].
Lastly, as previously mentioned, sex is an important factor in IBD incidence as well as in obesity incidence and severity. Likewise, obesity and IBD involve gastrointestinal disorders, which may be differently affected by sex. On the one hand, endocrine secretion from adipose tissue, which is sex-dependent, regulates gastrointestinal motility [18,19]. On the other hand, in patients with IBD, the dysbiosis (dysregulation of intestinal microbiota) and other factors such as plexitis or enteric nervous system inflammation [20] may favor changes in motility, feces consistency, and abdominal pain in a sex-dependent manner [21]. Female sex hormones indeed have a key role in gastrointestinal motility regulation [22]. Thus, there are studies that show a lower gastrointestinal transit in females compared with males and that link changes in female intestinal motility to the menstrual cycle [22]. However, there is a scarcity of preclinical studies focusing on the influence of sex on motility and other functional and structural aspects of the gastrointestinal tract under pathological circumstances such as obesity or IBD.
Taking all this information into account, our aim was to determine the possible alterations in motor function and structure of the gastrointestinal tract in mice with partial deficiency of TGF-β3 and the influence of diet and sex in these alterations.

2. Materials and Methods

2.1. Ethics

The experimental procedures were authorized by the Ethics Committee of Rey Juan Carlos University (URJC), according to European (2016/63/EU) and Spanish (RD 53/2013) regulations for the protection of animals destined for scientific studies (PROEX #194/17 and internal registration number ENM 84/170704202009420).
The design of the studies always sought to reduce the number of animals involved and their suffering.

2.2. Experimental Animals and Groups

A total of 104 (54 females and 50 males) C57BL/6J mice donated by Concepción Martinez´s laboratory (Universidad Complutense de Madrid Madrid, Spain) were used in this study [23]. They were housed in standard transparent cages (maximum 4 per cage), separated by sex, under environmentally controlled conditions (temperature = 20 °C; humidity = 60%), with a 12 h light/12 h dark cycle (lights on: 8–20 h), and had access to food and water ad libitum. Mice were weaned at the third week of age and fed the control diet. At the fourth week, some of the mice continued with the control diet (CD; 11% of calories from fat; Rod14, Altromicin®, Lage, Germany), and the rest were given a high fat diet (HFD; 54.4% kcal calories from fat; TD. 07011, ENVIGO®, Indianapolis, IN, USA) for 3 more months.
Male and female mice were divided into four experimental groups, based on their genotype with respect to TGF-β3 (wild type, WT; heterozygous, HZ) and on the supplied diet (CD; HFD). Therefore, 8 different experimental groups were stablished: male WT-CD (n = 12); male WT-HFD (n = 13); male HZ-CD (n = 11); male HZ-HFD (n = 14); female WT-CD (n = 13); female WT-HFD (n = 12); female WT-CD (n = 16); and female WT-HFD (n = 13). Body weight data from the mice of each group was collected until sacrifice.

2.3. Functional Study of the Gastrointestinal Transit

At the end of the 3 months of exposure to CD or HFD, a functional study of the gastrointestinal transit, consisting of two phases, was performed.
In the first phase, barium sulfate (BariGraph® AD, Juste SAQF, Coslada, Madrid, Spain) suspended in 0.3 mL of tap water (2 g/mL) was administered by gavage to each mouse, with an orogastric probe. Then, animals were individually placed in cages without sawdust or food, but with water. Feces were collected every 30 min in individual self-sealing plastic bags and weighed on a precision scale before and after drying in an oven at 70 °C for 24/48 h, so that the degree of fecal moisture could be determined. The degree of moisture in the stool can be modified by many factors (stress, pathology), and influences motility, since higher humidity generally implies greater volume of the stool and greater stimulation of the colonic wall for its propulsion and expulsion (including diarrhea) [24]. The number of stools excreted by each animal at each time interval was also recorded.
In the second phase, an X-ray study of the dry feces was carried out in order to obtain information about gastrointestinal transit. The feces were radiographed with a digital X-ray apparatus (CS2100, Carestream Dental, 60 kV, 7 mA; time exposure, 20 ms; focus distance manually set at 50 ± 1 cm) using Carestream Dental T-MAT G/RA film (15 × 30 cm) housed in a cassette provided with regular intensifying screen. X-rays were developed using a Kodak X-OMAT 2000 automated processor (Kodak AG, Stuttgart, Germany). The percentage of barium-marked feces was determined at each time point. In addition, a stool marking index was established, where the poorly marked feces visualized in the radiograph for each mouse at each time point were multiplied by 1, and the intensely marked, by 2. These two factors were summed and divided by the total number of feces produced by each mouse at each time point, as shown in the formula:
Stool   marking   index = ( ( Poorly   marked   feces   x   1 ) + (   Intensely   marked   feces   x   2 ) ) Total   feces
The criteria to differentiate the marking were established from the beginning and were maintained throughout the assessment, which was performed in a blinded fashion.
Finally, the latency of excretion of the first marked feces in each experimental group was also determined.

2.4. Structural Study: Macroscopic Study of the Gastrointestinal Organs

After sacrifice, by cervical dislocation, the small intestine, colon, cecum, and stomach were removed en bloc, weighed, spread on a sheet of graph paper, and photographed (see Supplementary Material, Figure S1). The pictures were opened with ImageJ 1.38 and the graph paper was used to set the scale for each picture. The area of the stomach and cecum and the length of the small intestine and colon were recorded.

2.5. Histological Analysis

Samples of distal colon were obtained after sacrifice, fixed in buffered 10% formalin, and embedded in paraffin. Sections of 5 μm were stained with Van Gieson’s stain to detect collagen fibers. They were studied under a Zeiss Axioskop 2 microscope equipped with the image analysis software package AxioVision 4.6 to measure submucosa thickness. The analysis was made in 8–10 random fields measured in 40x objective microphotographs per section and specimen. The experimenter was blind to the treatment received by the rat from which the sample under analysis was obtained.

2.6. Statistical Analysis

Statistical analysis was performed with GraphPad Prism 7.0® (GraphPad Software Inc, San Diego, CA, USA.). The results were expressed as the mean of the values obtained ± SEM (standard error of the mean). The data obtained from the functional study for the different experimental groups were compared using two-way ANOVA, followed by Sidak´s multiple comparison test for multiple comparisons. On the other hand, the results of the areas and lengths of the organs from the macroscopic study and the weights of the organs were analyzed by one-way ANOVA followed by Sidak’s multiple comparisons post hoc test, which compared the data of the different experimental groups. In addition, for these results, the effect of sex was determined by comparing WT females and males fed the control diet (WT-CD), using a Student’s t test. Differences were considered statistically significant when p ≤ 0.05.

3. Results

3.1. Functional Study of Gastrointestinal Motor Function—Phase 1: Characteristics of Excreted Feces

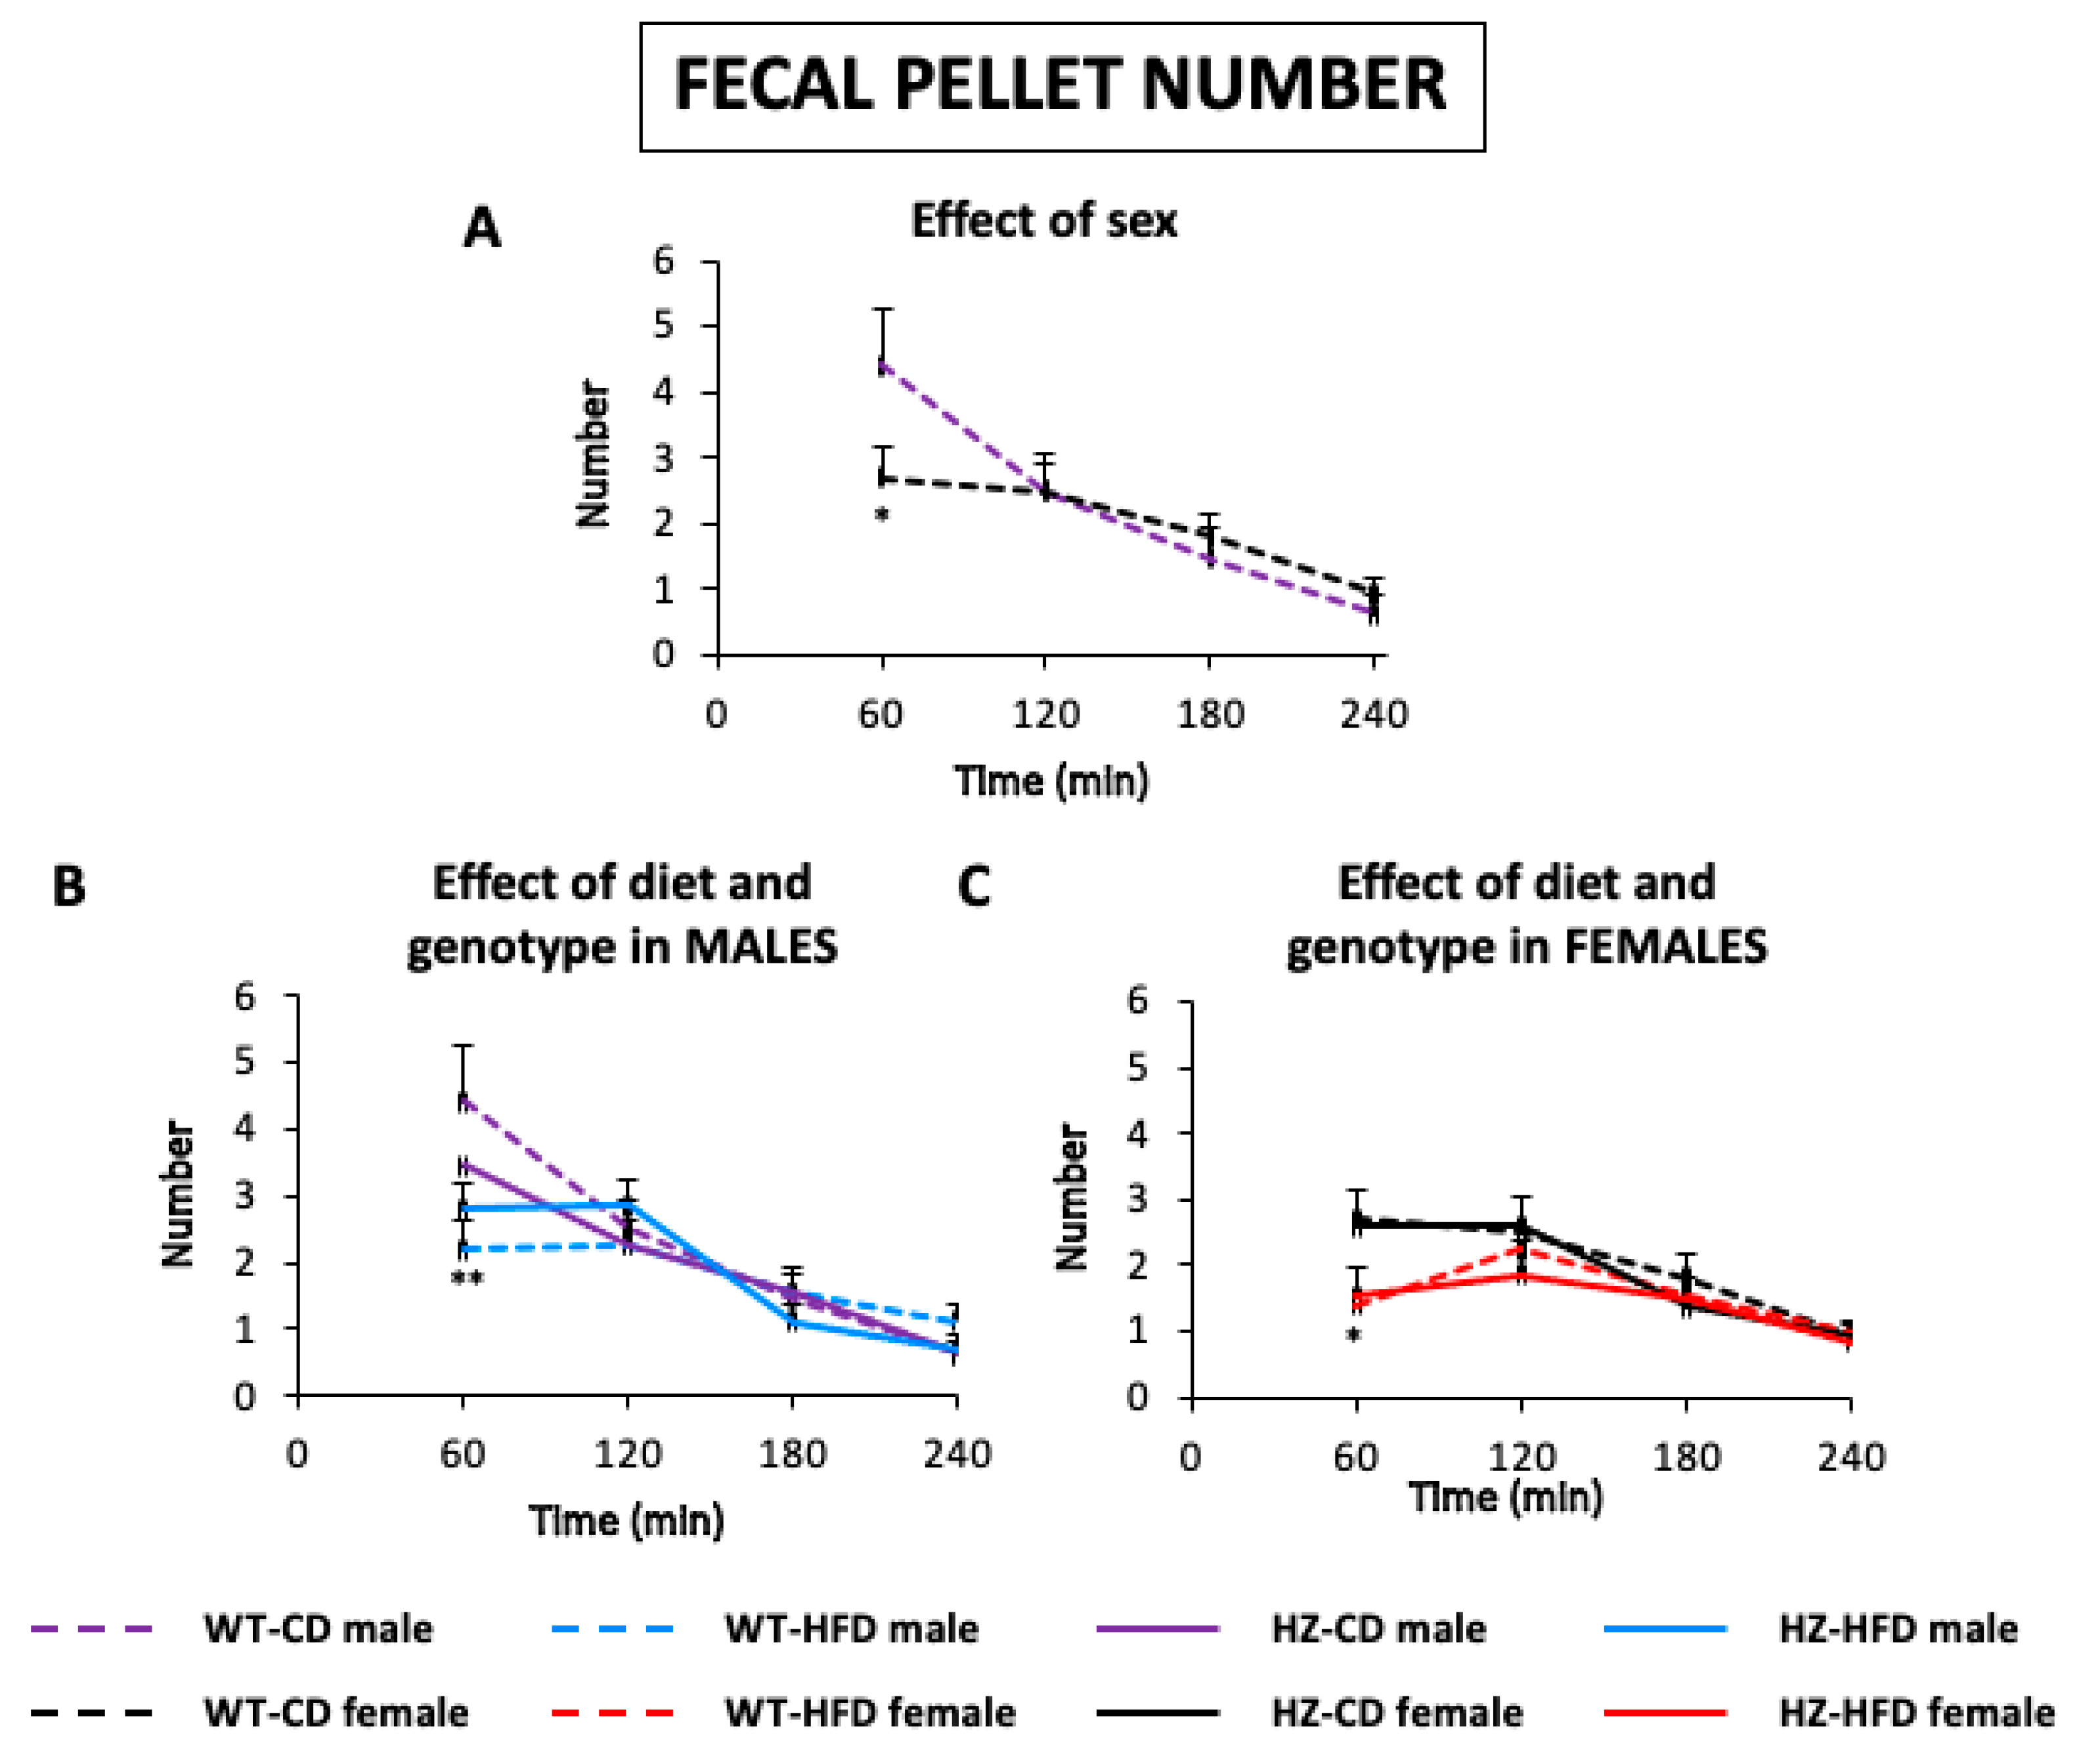
3.1.1. Number of Feces

In control animals (WT-CD), there was a progressive reduction in the number of feces along the experiment, more pronounced in males than females (males: 120 p < 0.05, 180, 240 p < 0.001 vs. 60; females: 240 p < 0.05 vs. 60). Females expelled fewer feces than males during the first 60 min, this difference being statistically significant (p = 0.05); during the rest of the experiment the number of feces in both groups was similar (Figure 1A).
On the other hand, during the first hour of the study, a significant decrease in the number of feces excreted by WT-HFD males and females compared with their respective WT-CD (males: p < 0.01; females: p < 0.05) was found, whilst HZ did not significantly modify this parameter in CD or HFD animals (Figure 1B,C).

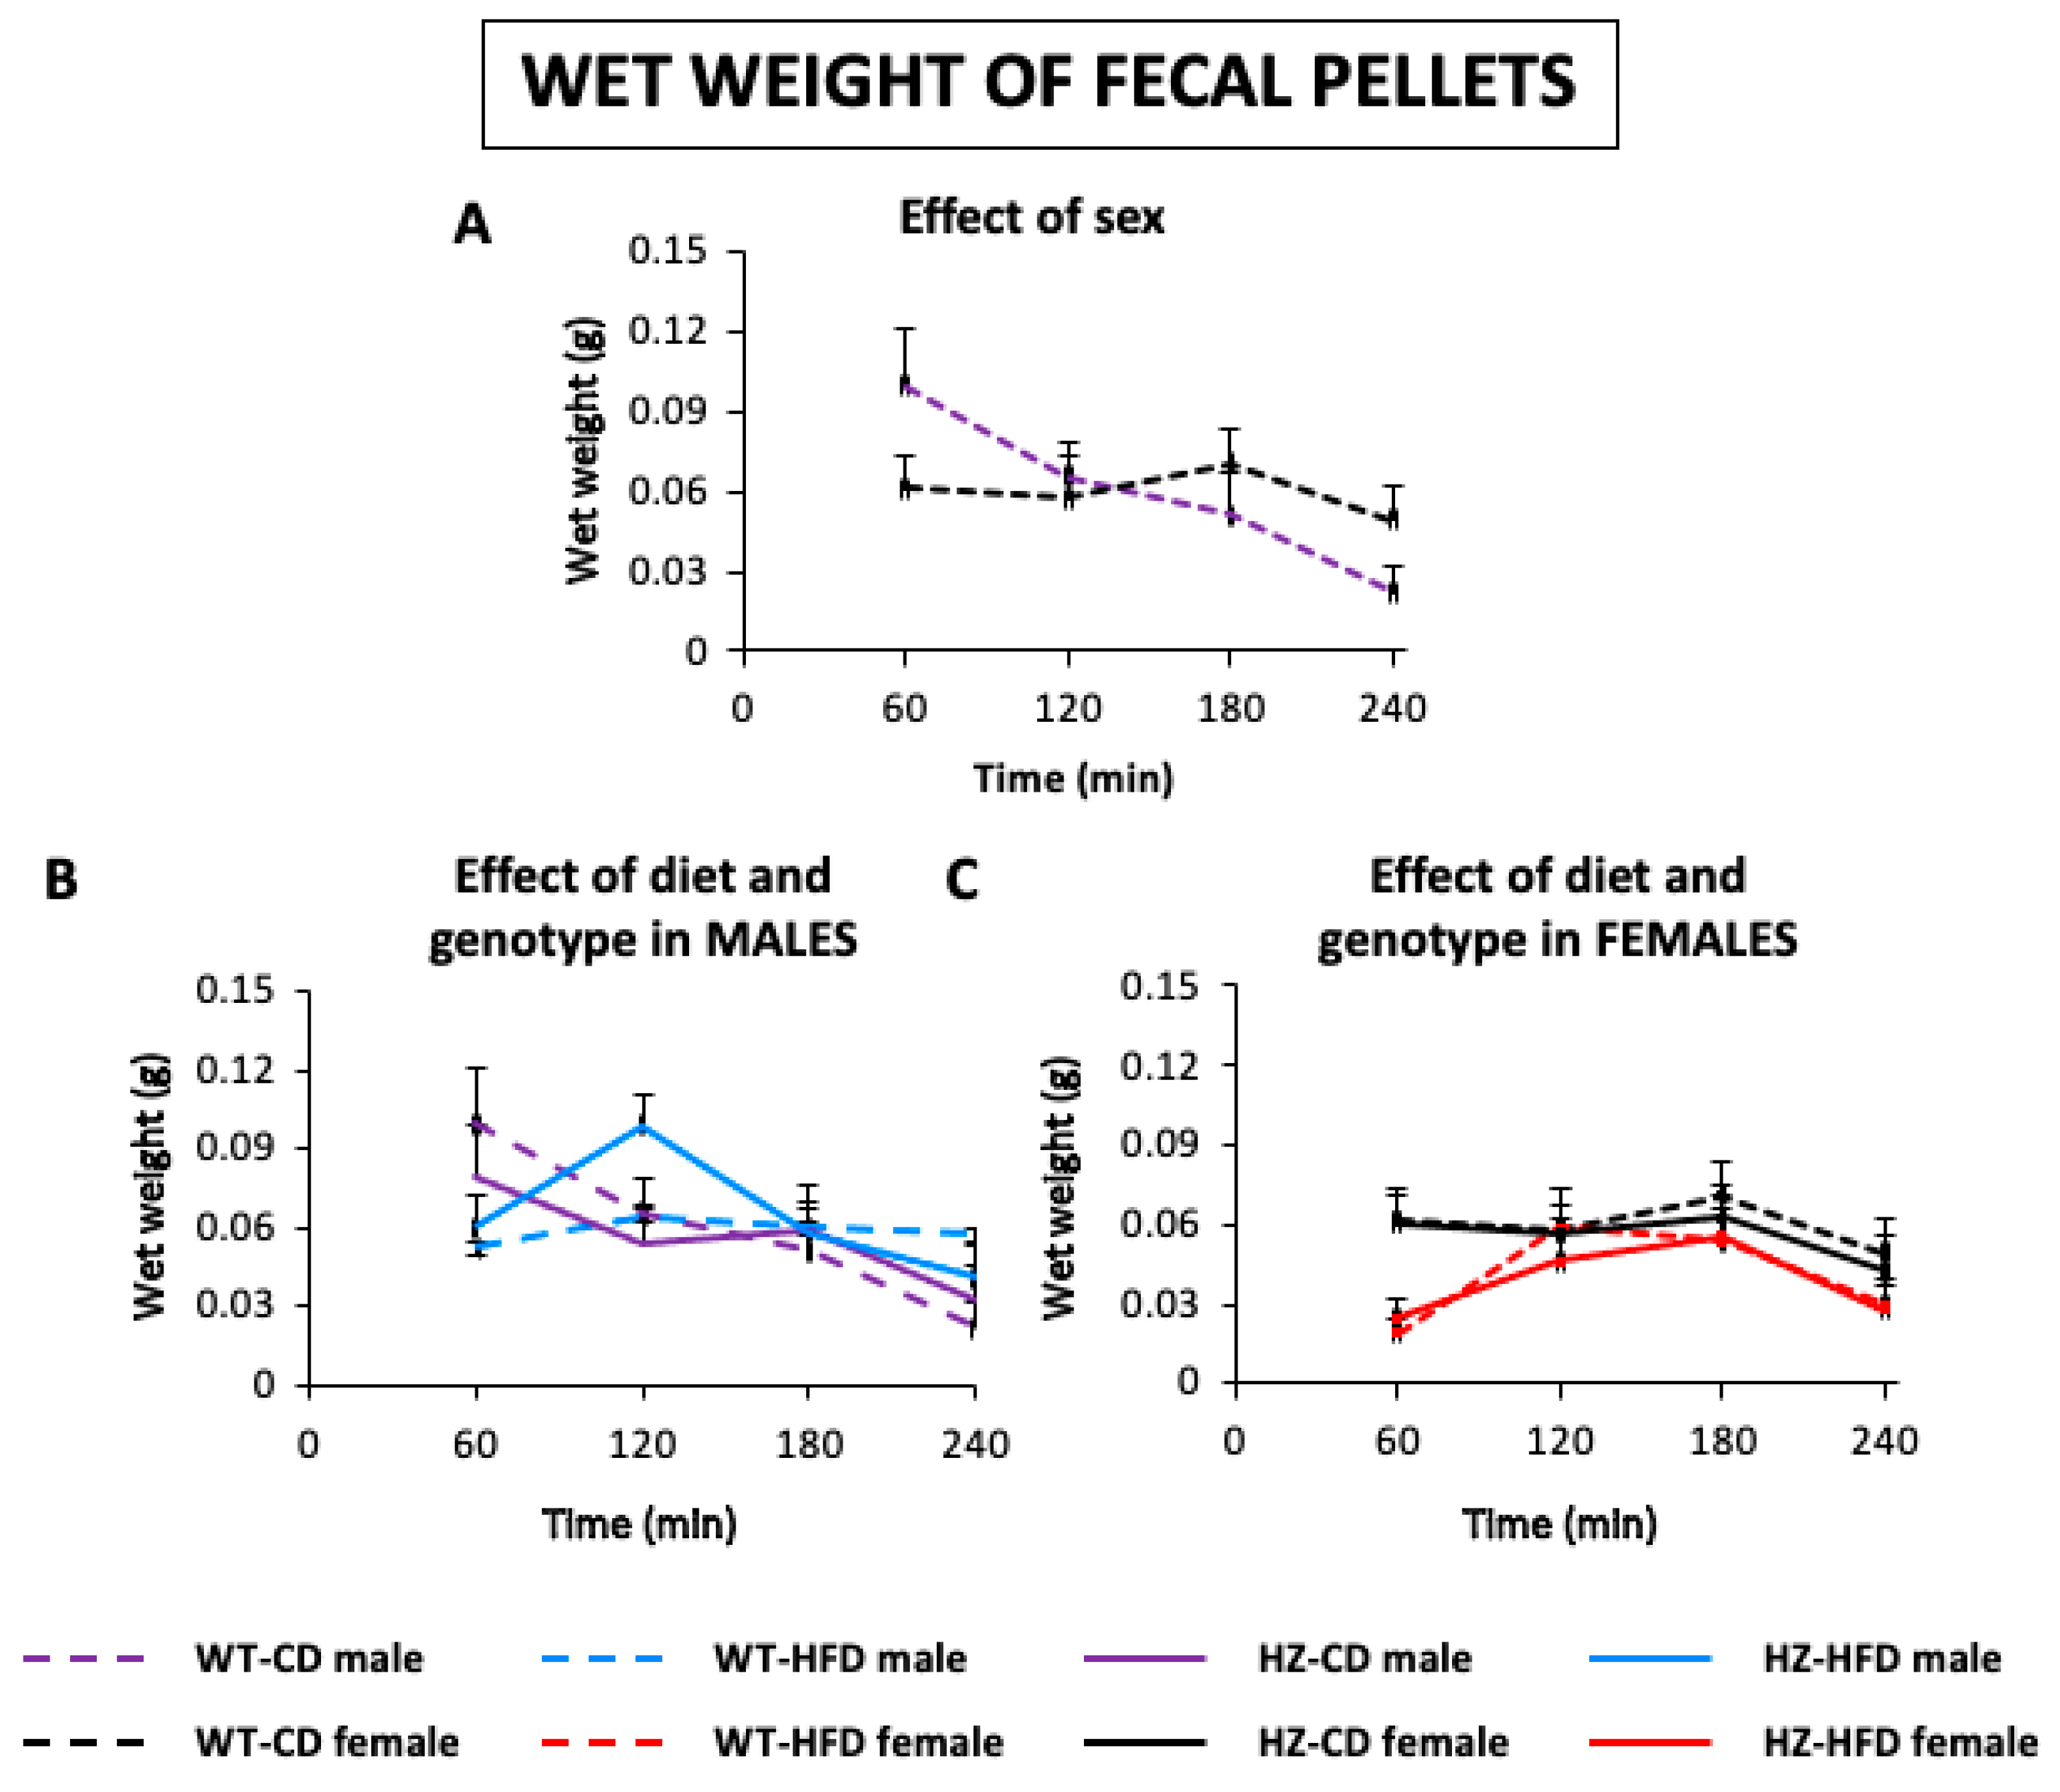
3.1.2. Wet Weight of Feces

Values of fecal wet weight obtained for WT animals resembled to some extent those obtained for the number of feces. Thus, across the study, fecal wet weight decreased in males (males: 240 p < 0.05 vs. 60) but remained stable in females, without statistically significant differences between the two groups (Figure 2A). No statistically significant differences were found either in the effects of diet and genotype (Figure 2B,C).

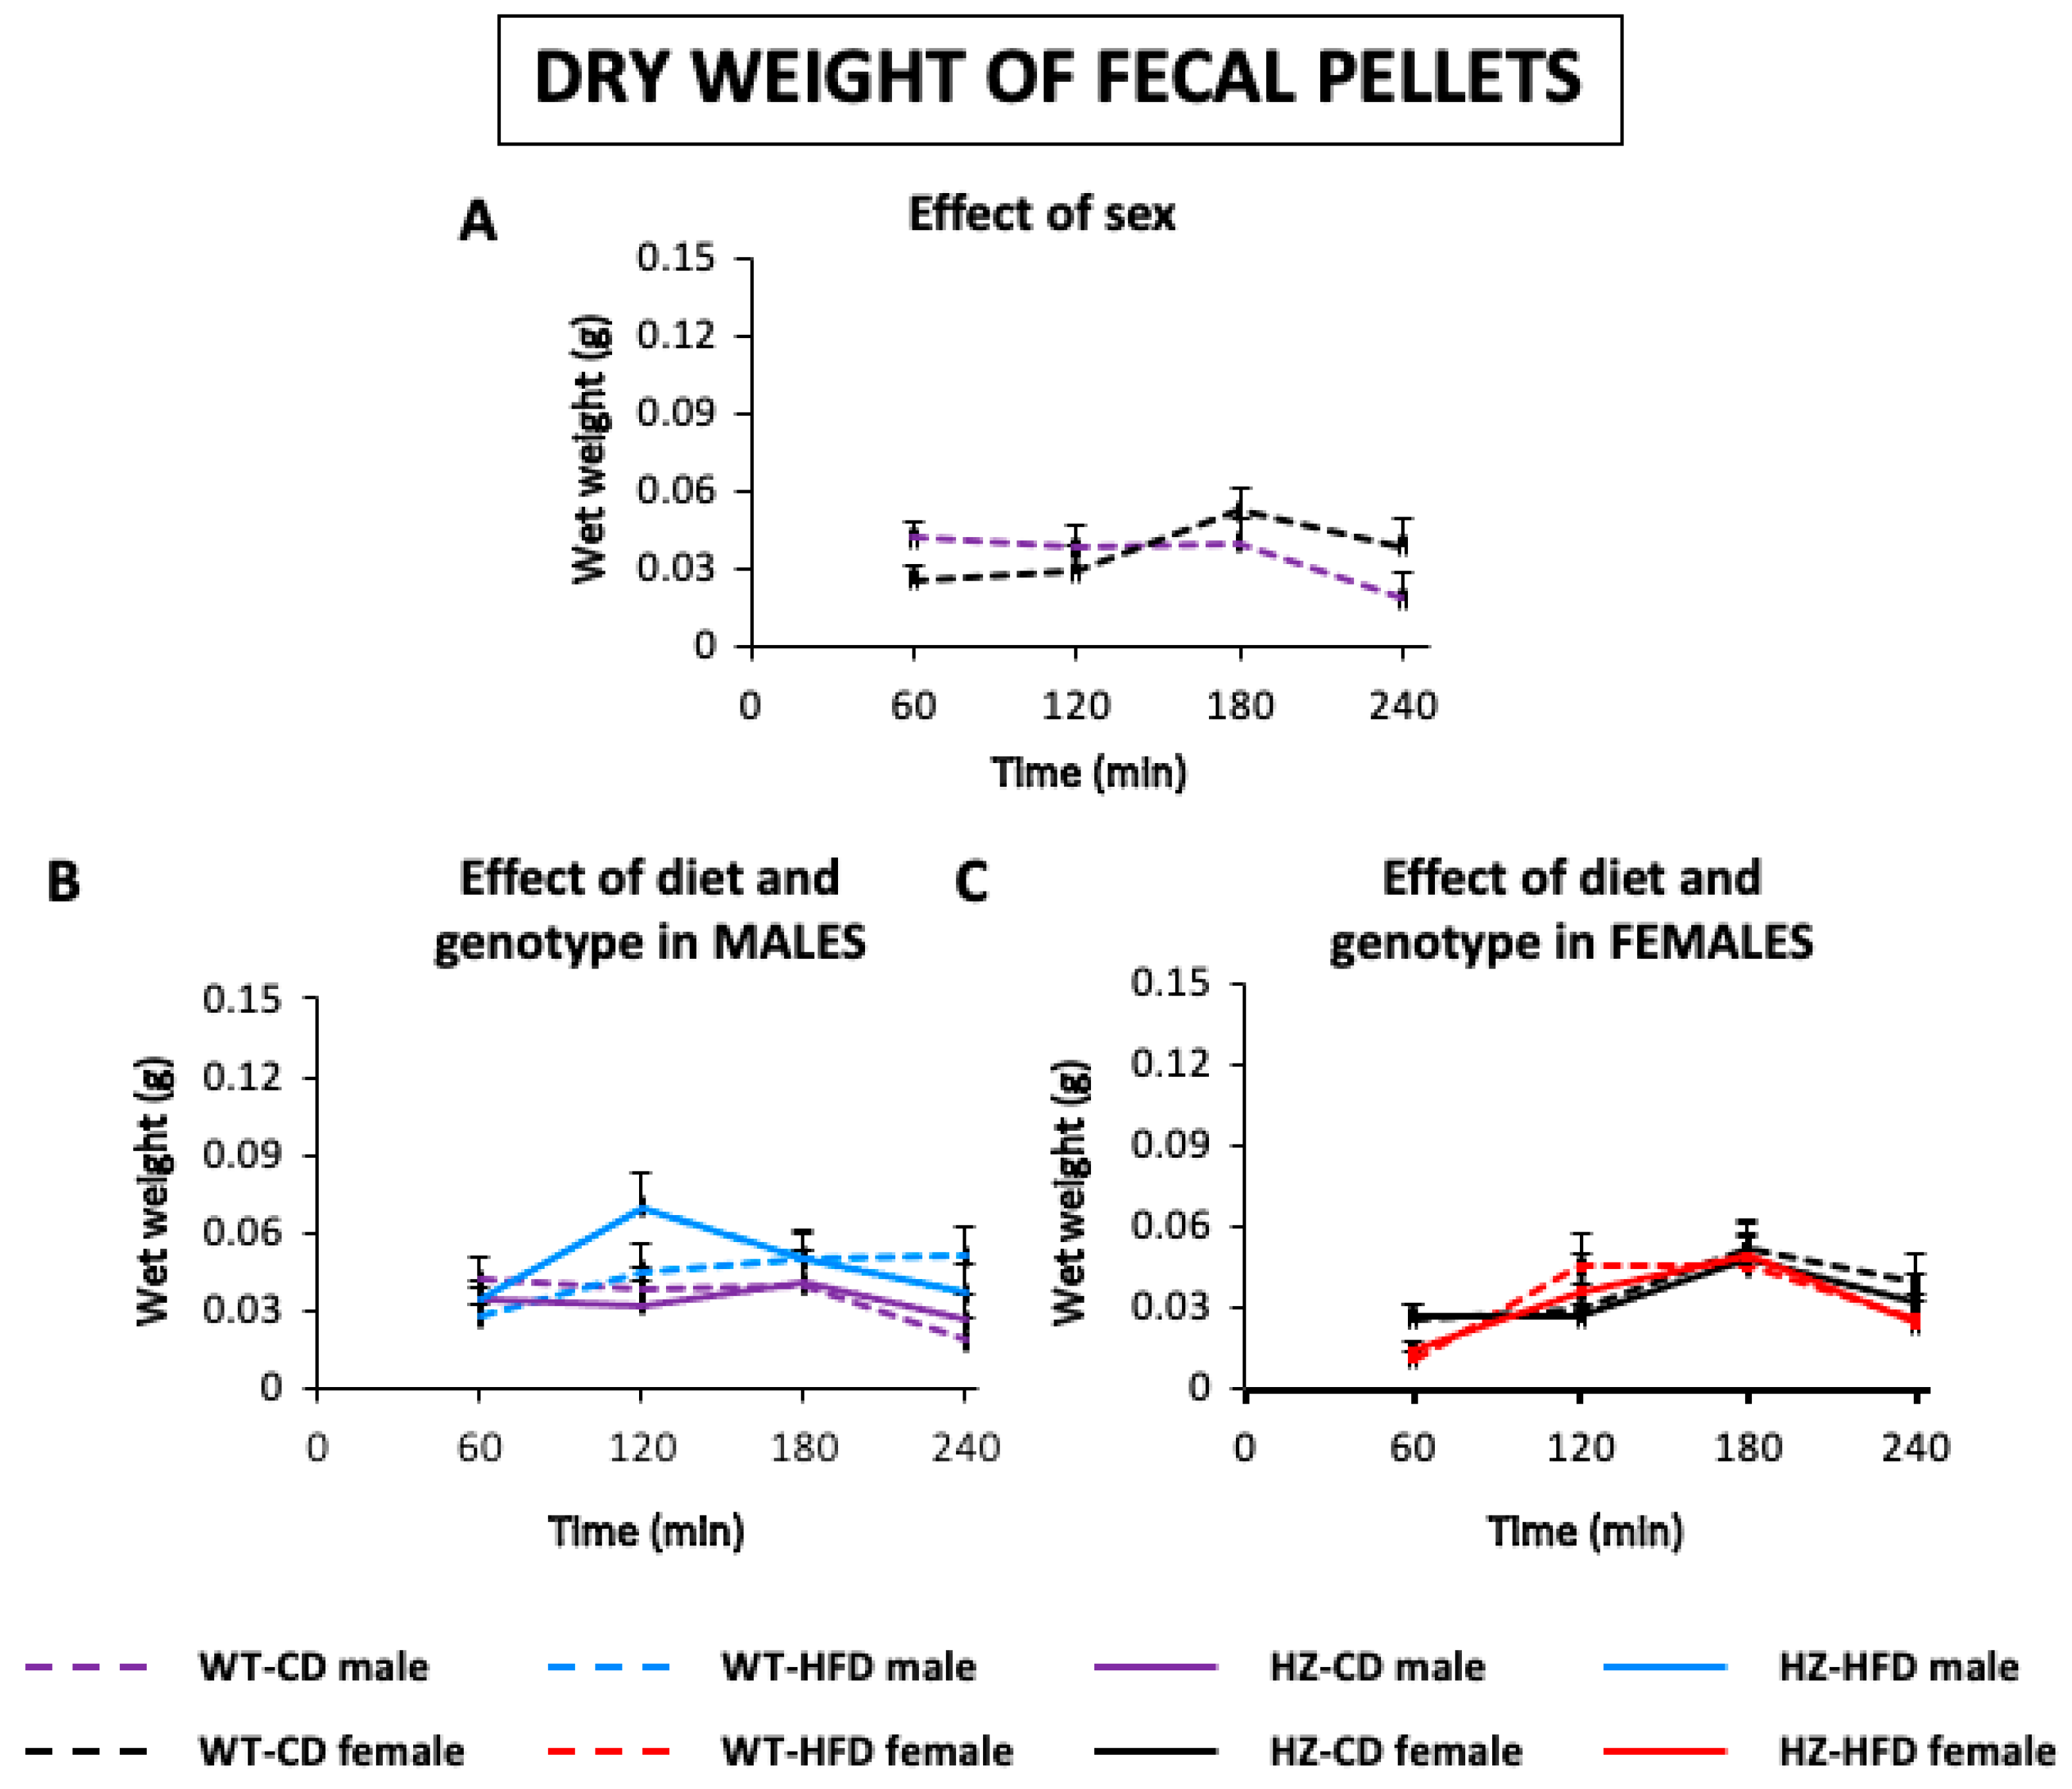
3.1.3. Dry Weight of Feces

The curves representing the dry weight of the feces throughout the experiments were very similar for control males and females, with no statistical differences across the experiment (Figure 3A), and these were not significantly affected either by diet or genotype for either sex (Figure 3B,C). These results suggest that the differences found in the number and wet weight of the feces are due to the degree of water content and not to the solid mass, therefore fecal moisture was calculated, by two different methods: the difference in weight between the wet and dry feces (see Supplementary material, Figure S2) and the percentage of water content (see below).

3.1.4. Fecal Moisture

Fecal moisture (expressed as percentage of water content) was reduced across the experiment in both males and females, in a similar manner. This reduction was more evident during the third hour (males: 120 p < 0.05, 180 and 240 p < 0.001 vs. 60; females: 180 and 240 p < 0.001 vs. 60) (Figure 4A).
In both males (Figure 4B) and females (Figure 4C), the mutation did not seem to have any effect, whereas exposure to HFD decreased the degree of moisture in both genotypes, particularly in males during the third hour in HZ mice (p < 0.05) and females during the first (WT p < 0.001, HZ p < 0.01) and second hour (WT and HZ p < 0.001) (Figure 4C).

3.2. Functional Study of Gastrointestinal Motor Function—Phase 2: Gastrointestinal Transit

Different parameters were obtained, based on appearance of barium in feces, in order to characterize the gastrointestinal transit. The results for the percentage of barium-marked fecal pellets are shown in Supplementary Material (Figure S3). The results for the remaining parameters are shown below.

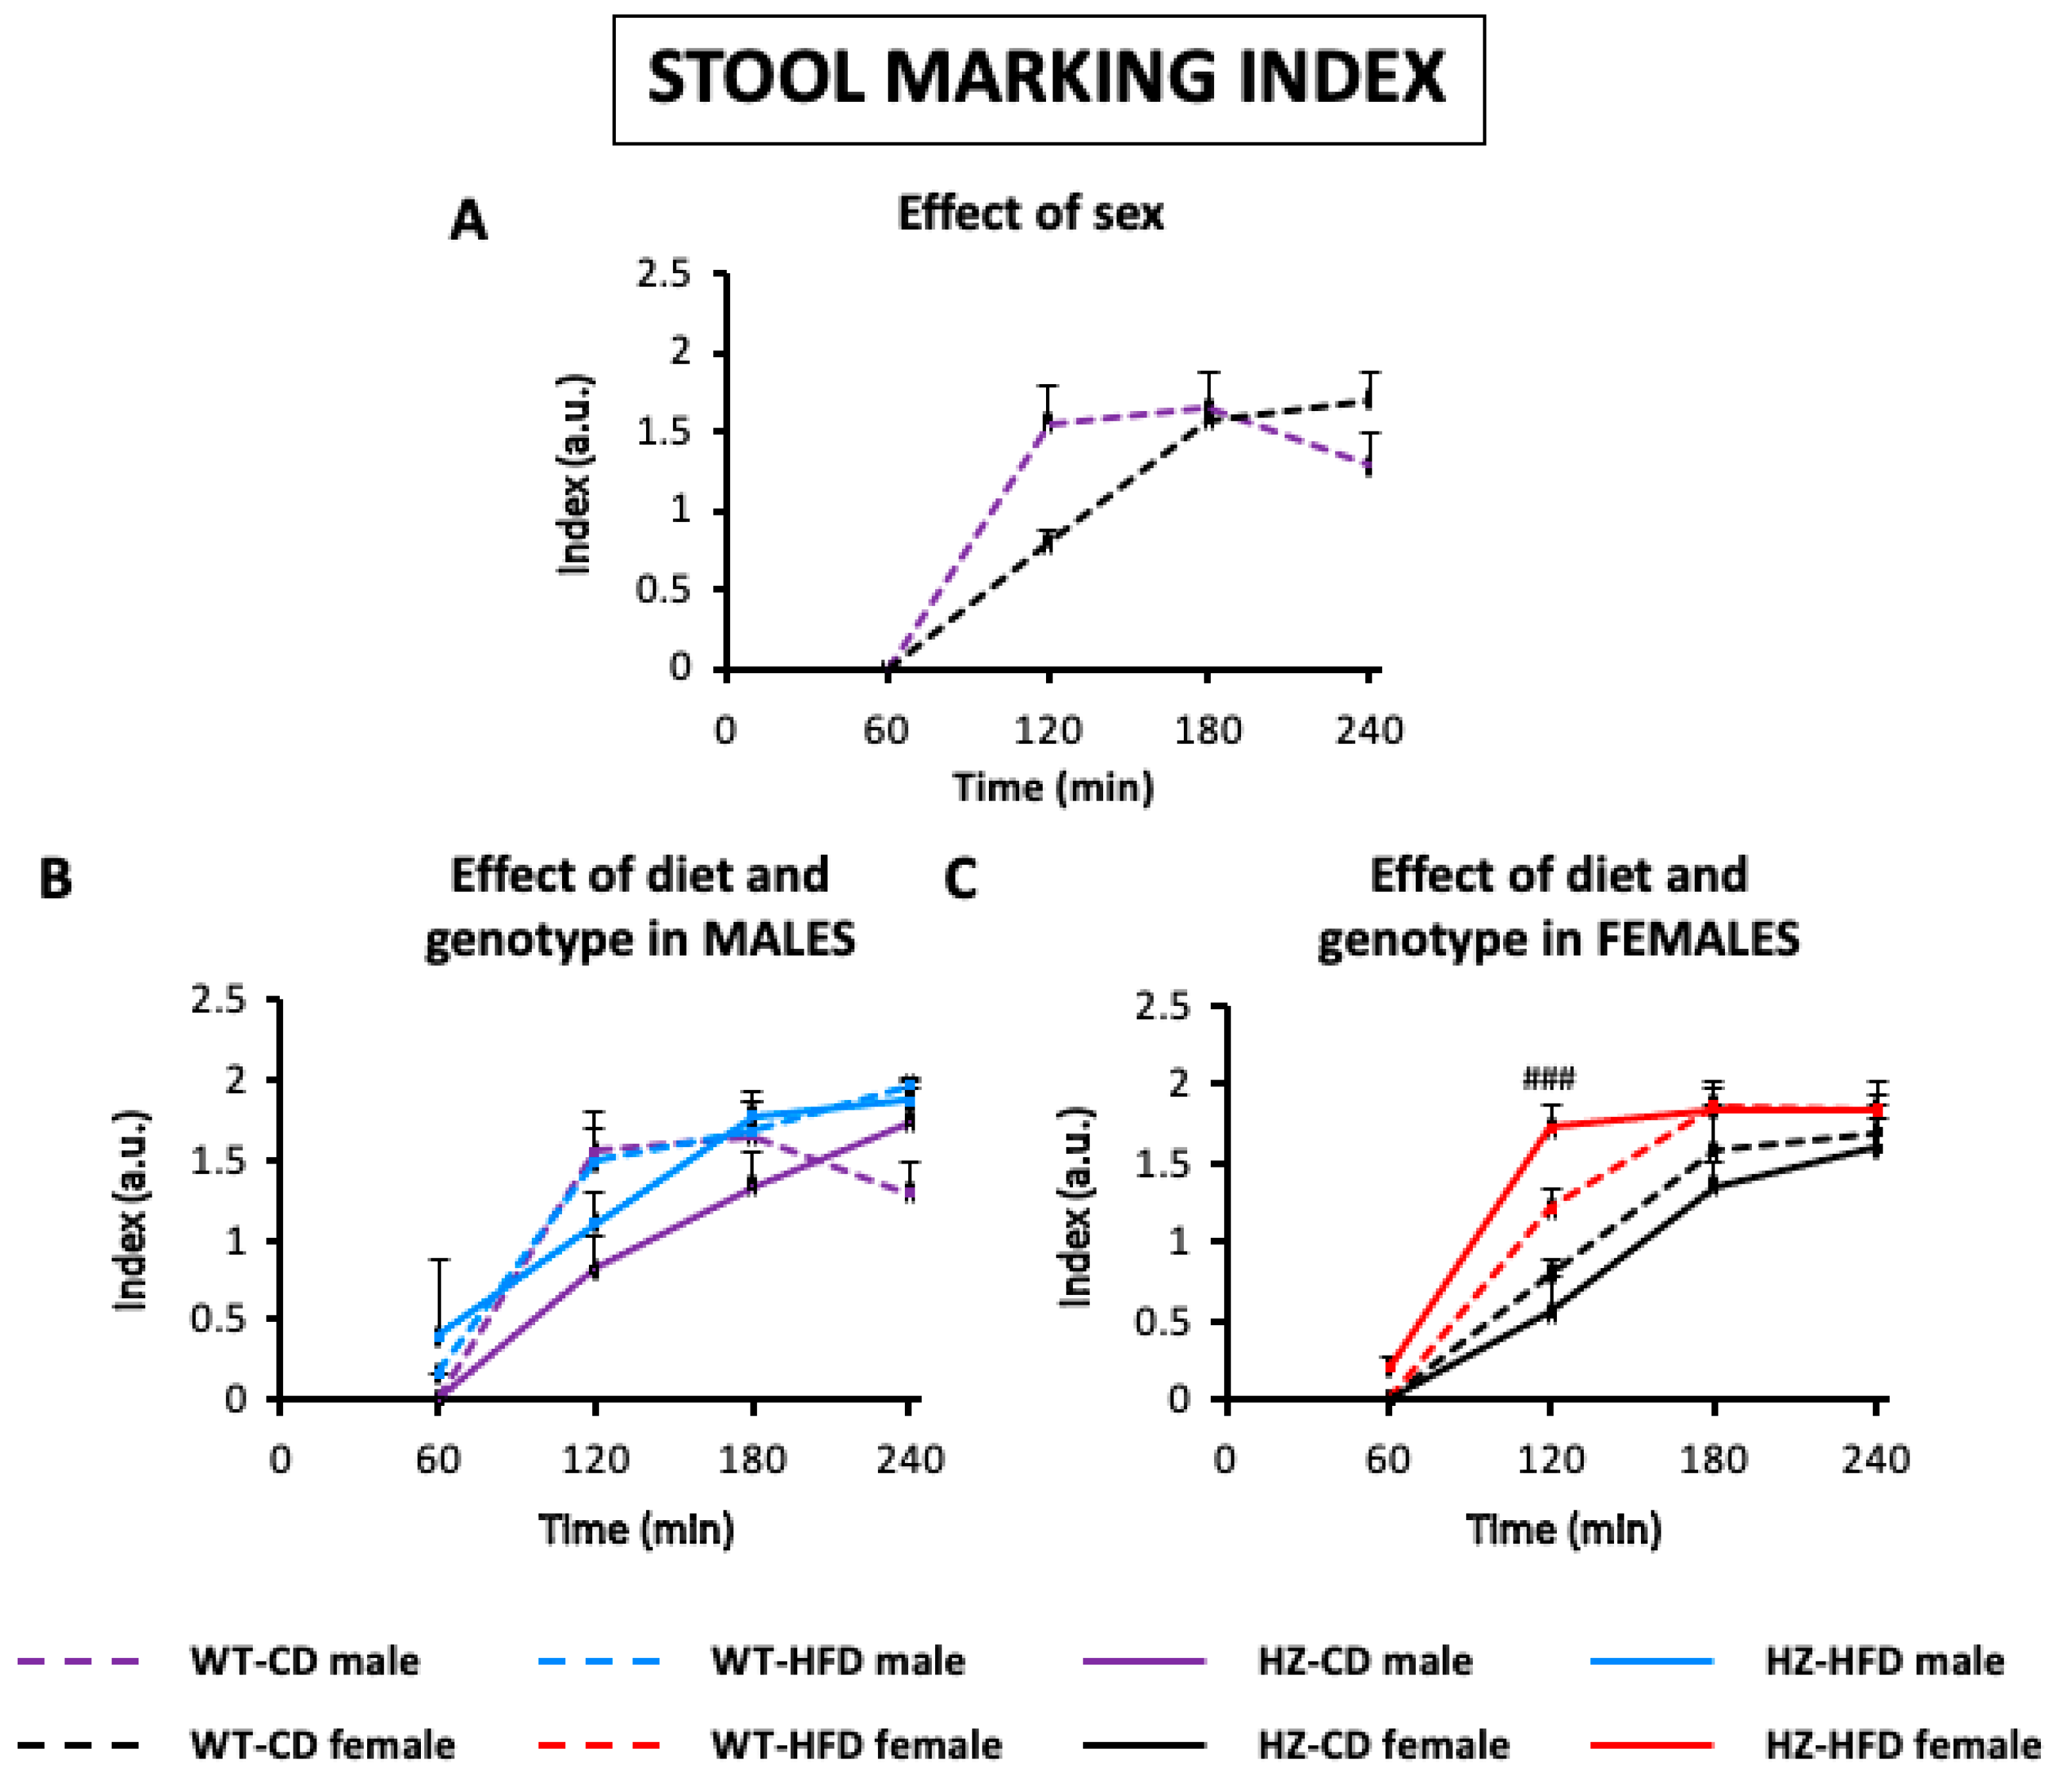
3.2.1. Stool Marking Index

In WT-CD animals, there was a progressive increase in the stool marking index, during the first 3 h, which was faster in males than females (males: 120, 180, 240 p < 0.001 vs. 60; females 120 p < 0.01, 180, 240 p < 0.001 vs. 60). During the fourth hour, this index was still increasing in females whilst in males it started to decrease (Figure 5A).
In WT males, HFD modified the index at 240 min when compared to CD, because it was still increasing instead of decreasing (p < 0.05). On the other hand, HZ mice tended to have a lower index than WT, the difference with WT being statistically significant at 120 min (p < 0.05) (Figure 5B); HFD somehow prevented the decelerating effect of HZ on this. In females, HFD tended to accelerate GI transit and this was more pronounced in the HZ-HFD group, whose differences with HZ-CD were statistically significant at 120 min (p < 0.001) (Figure 5C). The mutation alone did not significantly alter this parameter in females.

3.2.2. Latency of Expulsion of the First Marked Fecal Pellet

As shown in Table 1, the latency of expulsion of the first marked fecal pellet was higher in females than males, meaning that gastrointestinal transit was slower in females (p < 0.05). Whereas HFD by itself did not significantly modify this parameter in females nor males, HZ genotype did slow down gastrointestinal transit in males (p < 0.01), but curiously not in females. Interestingly, exposure of HZ male mice to HFD normalized gastrointestinal transit.

3.3. Structural Study: Macroscopic Study of the Gastrointestinal Organs

With regard to the weight of the different organs, there were no important differences between males and females except for the cecum, which was heavier in females than males (p < 0.01). HFD reduced the weight of most organs in both males and females; this difference was significant in most of the studied organs, irrespective of genotype, except for the weight of the stomach and small intestine of males where no statistically significant differences were found. The mutation per se did not affect the weight of any organ, but in HZ animals exposed to HFD, the effect of this exposure was as in WT mice (except for colon in males, in which the difference with WT-CD or, more importantly, HZ-CD did not reach statistical significance).
When evaluating the differences between genders in the size of the organs, only the small intestine was significantly longer in males when compared to female mice (p < 0.01). HFD per se did not have any statistically significant effect in the area of the stomach or length of small intestine but significantly reduced the area of cecum in both sexes and the length of the colon in males. The genotype per se did not affect the area or length of the organs, except curiously for the colorectum in females, which was significantly longer than in WT animals (p < 0.05). When HZ mice were exposed to HFD, all areas and lengths were significantly reduced in both sexes, except stomach area in males and small intestinal length in both sexes.
The results of the macroscopic study are shown in Table 2.

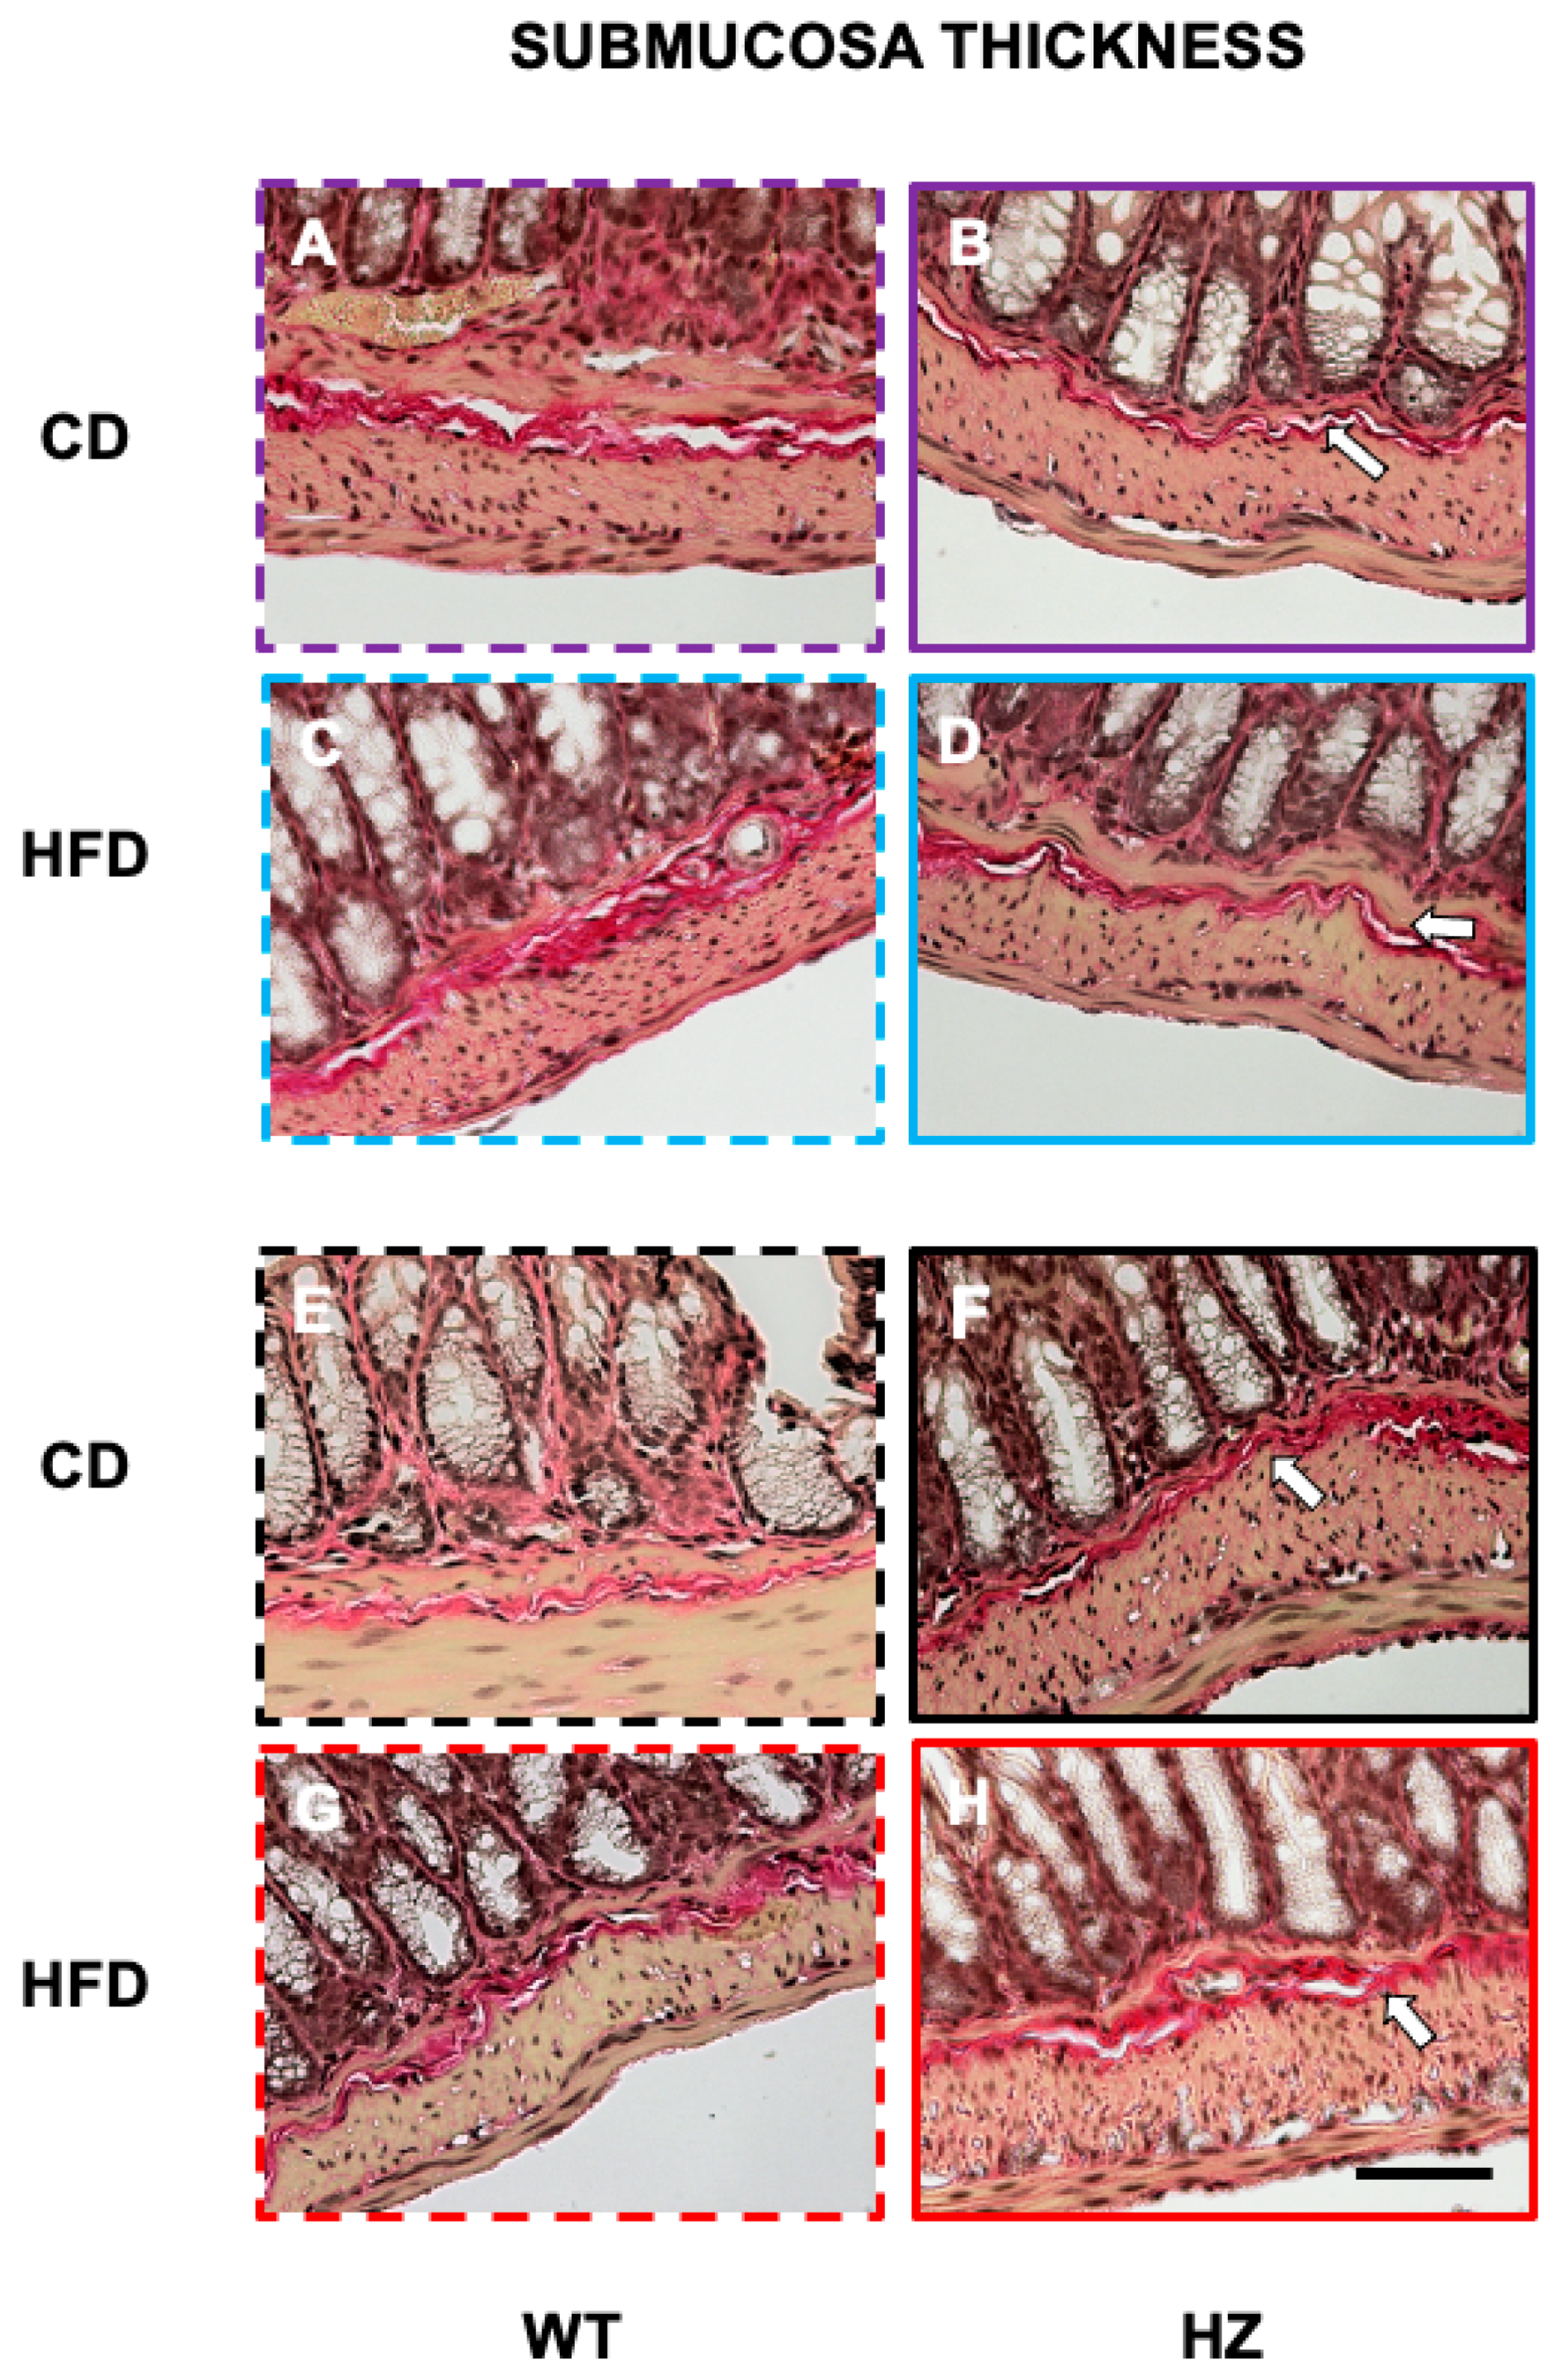
3.4. Structural Study: Microscopic Study of Distal Colon

Colonic architecture was not apparently affected in any of the experimental groups studied. Neither ulcers or goblet cell depletion in the mucosa nor inflammatory infiltrates were seen (Figure 6). However, some differences in submucosa thickness were appreciated (Table 3). Interestingly, the mutation significantly decreased submucosa thickness in males (p < 0.05) but increased its value in females (p = 0.05). Submucosa thickness increased in the other three groups of females compared with WT-CD, with the differences being statistically significant in both mutated animals irrespective of the diet used (p < 0.05 for HZ-CD; p = 0.05 for HZ-HFD).

4. Discussion

The present study aimed to determine the differences in gastrointestinal motor function and structure depending on three different factors alone and combined: sex (male or female), diet (CD or HFD), and genotype for TGF-β3 (WT or HZ). Importantly, we did not detect any signs related to the occurrence of IBD, such as diarrhea or physical deterioration of the animals or their organs, in any group.
Sex-related differences were determined by comparing WT-CD males vs. females; the latter presented a lower body weight (as expected taking into account the nature of these animals [2,25]), a bigger cecum, a slightly shorter small intestine, and reduced transit. The fatty diet was the variable that induced most alterations. Thus, in spite of increasing body weight in all groups (also expected from previous studies: Petrus et al., 2018 [7]), HFD reduced practically all the values of weight and area/length of gastrointestinal organs, irrespective of sex and genotype, the differences being particularly evident in stomach, cecum, and colon, and in a more pronounced way in females. Moreover, in the functional study, in both sexes, HFD reduced the number of feces in the first hour and fecal moisture across the whole study. In addition, HFD tended to increase transit in males but reduce it in females. Finally, the heterozygous genotype per se only induced, in males, an increase in the latency of the first marked fecal pellet excretion and sex-dependent effects in submucosa thickness, which decreased in males and increased in females. HFD in HZ mice behaved as in WT animals (the genotype added nothing to diet) in most parameters. However, latency of the first fecal pellet, which increased in HZ-CD males, was normalized upon HFD exposure.
In previous studies, we used X-rays, in vivo, to evaluate motility as well as morphometric and densitometric changes of gastrointestinal organs and fecal pellets along the X-ray session [26,27]. Unfortunately, this was not possible in the current study. However, we still used barium to mark the gastrointestinal contents and evaluated fecal pellet excretion in individualized animals along 4 h after administration. First, we observed that the expulsion of feces varied throughout the experiment. During the first hours, WT-CD males had an increased fecal pellet output and the water content of these feces was higher, but as the time went by, both parameters decreased. Possibly, this increase could be due to the stress induced by the manipulation and changes in the environment at the beginning of the experiment. Indeed, this kind of increase in intestinal transit and water content in feces has previously been seen in mice submitted to acute stressors [24,28]. On the other hand, although there was a smaller variation in the number of feces expelled by females throughout the experiment, the water content of the feces was also higher at the beginning of the experiment.
Importantly, the presence of barium did not seem to modify the dry weight of the feces throughout the experiment (which was also quite constant irrespective of sex, genotype, and diet). This indicates that the amount of barium used did not affect the results of the study, although, as mentioned, it did allow us to mark the feces to evaluate possible changes in gastrointestinal transit. In other studies, such as the one performed by Ling et al., 2016 [29], carbon was used as a tracer in the feces, although they just studied the time necessary for the animals to defecate the first marked feces.
The percentage of marked feces and stool marking index increased progressively throughout the experiment in both males and females, as expected (in rodents, that do not vomit, barium deposited in the stomach can only travel distally to the anus [30,31]). In previous studies, performed in vivo in mice using X-rays [26] and in another study performed using a suspension of carbon [29], the first fecal pellet appeared 90 min after the administration of the tracer. In WT-CD males, we obtained a slightly higher average for occurrence of the first fecal pellet (107.5 ± 9.4 min), but 50% of male mice actually defecated the first marked feces 90 min after the beginning of the experiment, which is in accordance with those previous studies.
The occurrence of barium in stool was slower in females when compared to males. Thus, the average latency for marked pellets expulsion in female WT-CD was 138.5 ± 5.4 min, with the first fecal pellet appearing after 150 min in 69% of the animals. The hormonal cycle can affect the speed of transit [22]. Although we did not evaluate the phase of the estrous cycle in our animals, our results were quite homogeneous, suggesting that, under our conditions, this effect, if any, was negligible. There are some studies which indicate that females tend to suffer more from constipation [32], which is related to a slower intestinal transit in females [33], also seen here. Interestingly, in the macroscopic study, the length of both small intestine and colon was slightly reduced in WT-CD females compared with males, but the cecum was bigger and significantly heavier. Thus, it is likely that in females the cecum accumulates contents for longer, explaining our results.
When animals were fed with HFD, the number of fecal pellets, its wet weight, and its percentage of water during the first hours of the experiment were reduced when compared to CD animals. This could be simply due to the hydrophobic nature of fat, that was excreted in excess in HFD-exposed animals (although no specific study was performed of fat content in fecal pellets, these and also the contents of the stomach, small intestine, and cecum showed a yellowish appearance suggestive of fat being at a higher degree in gastrointestinal contents, data not shown). However, the different impact of stress at the beginning of the functional study could also be involved. Bridgewater et al. (2017) [34] evaluated the effects of combining HFD-induced obesity and stress in mice of both sexes, finding that male mice were more vulnerable to the anxiogenic effects of the HFD when compared to females, and the authors attributed this finding with different sex- and diet-dependent changes in the intestinal microbiota which, unfortunately, could not be studied here. In any case, the level of stress in our study was probably milder than in the study performed by these authors, who used dedicated tests to evaluate this, and these authors did not study fecal pellet moisture as a biomarker for stress, thus limiting direct comparisons to be performed between both studies.
On the other hand, HFD tended to slow down the appearance of marked feces in males, which is in agreement with the results previously described, where C57BL/6J male mice fed on HFD during 11–12 weeks had a slower gastrointestinal motility, which the authors related to reduced neurons expressing nitric oxide in the proximal colon [35,36,37]. In females, HFD tended to accelerate the appearance of marked feces, but we have not found any previous data related to gastrointestinal transit in females fed a HFD. The changes in transit observed in males and females could be due to structural changes in the organs, that might alter in a different manner the distance that the barium has to travel. However, the effect of HFD in macroscopic parameters was qualitatively quite similar (a reduction in area/length of the organ) in both WT-CD groups, although a bit more intense in males for small intestinal and colon lengths, which is counterintuitive for these smaller lengths explaining a slower transit. Thus, it is more likely that differences are due to altered propulsive activity in the gastrointestinal tract, like altered activity of the myenteric neurons (as found in the previously mentioned studies in male mice [35,36,37]), altered coordination of the interstitial cells of Cajal [38], or structural changes in the muscle (which we have not noticed in this preliminary study). Further investigations are needed to determine the exact mechanisms involved in our findings.
In our study, HFD reduced the size and weight of the gastrointestinal organs in accordance with previous studies performed in mice [39,40]. This reduction in the size of the organs could be due to the low-grade chronic inflammation associated with obesity, in which pro-inflammatory cytokines, such as tumor necrosis factor alpha (TNF-α) or interleukin-6 (IL-6), are increased [41]. Future studies would be needed to corroborate this hypothesis.
Finally, we studied the influence of TGF-β3 on gastrointestinal transit for the first time. The deficiency in TGF-β3 did not induce by itself any significant effect in the size or weight of the gastrointestinal organs (except for a slight increase in colon length in females) and HFD alone reduced these values, as done in WT animals. However, the mutant genotype by itself significantly increased the latency of appearance of marked feces in males (without altering this parameter in females), and HFD normalized transit in HZ males. These effects occurred in parallel with a significant reduction in submucosa thickness in HZ but an increase in females, not prevented by exposure to HFD in either sex. No previous data exist regarding the effect of TGF-β3 on colon structure. However, our results seem to indicate that it could be similar to that of TGF-β1 in males. Vallance el al. (2005) [11] showed that transfection of TGF-β1 in male mice causes severe and prolonged inflammatory response as well as progressive fibrosis, resulting in colonic obstruction. Increased TGF-β transcripts have also been found in Crohn’s disease patients in relation with chronic inflammation and fibrosis. Interestingly, pirfenidone, an anti-fibrotic drug, suppressed this fibrosis by targeting TGF-β signaling [42]. At this stage, we do not know why the effects in gastrointestinal transit and colonic submucosa thickness are so different in mutated males and females, nor why HFD counteracts some and not others.

5. Conclusions

The effects of sex and diet found here on motor function and macroscopic structure of the gastrointestinal organs are in general agreement with the literature.
However, we describe, for the first time, that the partial deficiency of TGF-β3 reduces gastrointestinal transit and submucosa thickness in male mice. The effect on the submucosa suggest that this cytokine behaves in the male gastrointestinal tract in a similar manner to TGF-β1, whose overexpression is associated with the development of IBD. Intriguingly, the mutation produced an opposite effect on the submucosa thickness in females, in which gastrointestinal transit was not significantly altered compared with control females.
A further important finding is that exposure to HFD counteracted the functional effects of the mutation in males. Further research is needed to determine the mechanisms involved in this effect.

Supplementary Materials

The following are available online at www.mdpi.com/2504-3900/61/1/18/s1, Figure S1: Structural study: macroscopic study of the gastrointestinal organs. Figure S2: Difference between the weight of dry and wet feces. Figure S3: Percentage of marked fecal pellets.

Author Contributions

Conceptualization, R.A.; methodology, P.G., A.B., E.E., Y.L.-T., A.M., J.A.U., and R.A.; formal analysis, P.G., A.B., A.M., and J.A.U.; investigation, P.G., A.B., G.M.-G., J.A.U., and R.A.; data curation, A.B., G.M.-G., J.A.U., and R.A.; writing—original draft preparation, P.G., A.B., E.E., J.A.U., and R.A.; writing—review and editing, G.M.-G., J.A.U., and R.A.; supervision, G.M.-G., J.A.U., and R.A.; funding acquisition, G.M.-G. and R.A. All authors have read and agreed to the published version of the manuscript.

Funding

This research was funded by Ministerio de Ciencia, Innovación y Universidades (Spain), grant number PID2019-111510RB-I00 (to R.A.); Ministerio de Economía y Competitividad (Spain), grant number BFU2016-78951-R (to G.M.-G); Comunidad de Madrid (Spain), grant numbers B2017/BMD-3684 (to G.M.-G), and PEJD-2017-PRE/BMD-3924 (to Y.L.-T., through R.A.); Karolinska Institutet (Article 83).

Acknowledgments

Technical assistance by Laura López-Gómez and Adrián Sánchez Yáñez.

Conflicts of Interest

The authors declare no conflict of interest. The funders had no role in the design of the study; in the collection, analyses, or interpretation of data; in the writing of the manuscript; or in the decision to publish the results.

References

  1. Kang, J.S.; Liu, C.; Derynck, R. New regulatory mechanisms of TGF-β receptor function. Trends Cell Biol. 2009, 19, 385–394. [Google Scholar] [CrossRef] [PubMed]
  2. Hong, S.; Lee, H.J.; Kim, S.J.; Hahm, K.B. Connection between inflammation and carcinogenesis in gastrointestinal tract: Focus on TGF-β signaling. World J. Gastroenterol. 2010, 16, 2080–2093. [Google Scholar] [CrossRef] [PubMed]
  3. Laverty, H.G.; Wakefield, L.M.; Occleston, N.L.; O’Kane, S.; Ferguson, M.W.J. TGF-β3 and cancer: A review. Cytokine Growth Factor Rev. 2009, 20, 305–317. [Google Scholar] [CrossRef] [PubMed]
  4. Chakrabarti, M.; Al-Sammarraie, N.; Gebere, M.G.; Bhattacharya, A.; Chopra, S.; Johnson, J.; Peña, E.A.; Eberth, J.F.; Poelmann, R.E.; de Gittenberger-Groot, A.C.; et al. Transforming Growth Factor Beta3 is Required for Cardiovascular Development. J. Cardiovasc. Dev. Dis. 2020, 7, 19. [Google Scholar] [CrossRef]
  5. Kaartinen, V.; Voncken, J.W.; Shuler, C.; Warburton, D.; Bu, D.; Heisterkamp, N.; Groffen, J. Abnormal lung development and cleft palate in mice lacking TGF–β3 indicates defects of epithelial–mesenchymal interaction. Nat. Genet. 1995, 11, 415–421. [Google Scholar] [CrossRef]
  6. Proetzel, G.; Pawlowski, S.A.; Wiles, M.V.; Yin, M.; Boivin, G.P.; Howles, P.N.; Ding, J.; Ferguson, M.W.J.; Doetschman, T. Transforming growth factor–β3 is required for secondary palate fusion. Nat. Genet. 1995, 11, 409–414. [Google Scholar] [CrossRef]
  7. Petrus, P.; Mejhert, N.; Corrales, P.; Lecoutre, S.; Li, Q.; Maldonado, E.; Kulyté, A.; Lopez, Y.; Campbell, M.; Acosta, J.R.; et al. Transforming Growth Factor-β3 Regulates Adipocyte Number in Subcutaneous White Adipose Tissue. Cell Rep. 2018, 25, 551–560.e5. [Google Scholar] [CrossRef] [PubMed]
  8. Lee, D.; Albenberg, L.; Compher, C.; Baldassano, R.; Piccoli, D.; Lewis, J.D.; Wu, G.D. Diet in the pathogenesis and treatment of inflammatory bowel diseases. Gastroenterology 2015, 148, 1087–1106. [Google Scholar] [CrossRef]
  9. Nikiphorou, E.; Fragoulis, G.E. Inflammation, obesity and rheumatic disease: Common mechanistic links. A narrative review. Ther. Adv. Musculoskelet. Dis. 2018, 10, 157–167. [Google Scholar] [CrossRef]
  10. Ihara, S.; Hirata, Y.; Koike, K. TGF-β in inflammatory bowel disease: A key regulator of immune cells, epithelium, and the intestinal microbiota. J. Gastroenterol. 2017, 52, 777–787. [Google Scholar] [CrossRef]
  11. Vallance, B.A.; Gunawan, M.I.; Hewlett, B.; Bercik, P.; Van Kampen, C.; Galeazzi, F.; Sime, P.J.; Gauldie, J.; Collins, S.M. TGF-β1 gene transfer to the mouse colon leads to intestinal fibrosis. Am. J. Physiol. Gastrointest. Liver Physiol. 2005, 289. [Google Scholar] [CrossRef] [PubMed]
  12. Sans, M.; Masamunt, M.C. Fibrogenesis and inflammatory bowel disease. Gastroenterol. Hepatol. 2007, 30, 36–41. [Google Scholar] [CrossRef] [PubMed]
  13. Lawrance, I.C.; Maxwell, L.; Doe, W. Altered response of intestinal mucosal fibroblasts to profibrogenic cytokines in inflammatory bowel disease. Inflamm. Bowel Dis. 2001, 7, 226–236. [Google Scholar] [CrossRef] [PubMed]
  14. Owczarek, D.; Rodacki, T.; Domagała-Rodacka, R.; Cibor, D.; Mach, T. Diet and nutritional factors in inflammatory bowel diseases. World J. Gastroenterol. 2016, 22, 895–905. [Google Scholar] [CrossRef] [PubMed]
  15. Mak, W.Y.; Zhao, M.; Ng, S.C.; Burisch, J. The epidemiology of inflammatory bowel disease: East meets west. J. Gastroenterol. Hepatol. (Aust.) 2020, 35, 380–389. [Google Scholar] [CrossRef]
  16. Uranga, J.A.; López-Miranda, V.; Lombó, F.; Abalo, R. Food, nutrients and nutraceuticals affecting the course of inflammatory bowel disease. Pharmacol. Rep. 2016, 68, 816–826. [Google Scholar] [CrossRef]
  17. Gruber, L.; Kisling, S.; Lichti, P.; Martin, F.P.; May, S.; Klingenspor, M.; Lichtenegger, M.; Rychlik, M.; Haller, D. High Fat Diet Accelerates Pathogenesis of Murine Crohn’s Disease-Like Ileitis Independently of Obesity. PLoS ONE 2013, 8, e71661. [Google Scholar] [CrossRef]
  18. Emerenziani, S.; Guarino, M.P.L.; Asensio, L.M.T.; Altomare, A.; Ribolsi, M.; Balestrieri, P.; Cicala, M. Role of overweight and obesity in gastrointestinal disease. Nutrients 2020, 12, 111. [Google Scholar] [CrossRef]
  19. Idrizaj, E.; Garella, R.; Squecco, R.; Baccari, M.C. Adipocytes-released Peptides Involved in the Control of Gastrointestinal Motility. Curr. Protein Pept. Sci. 2019, 20, 614–629. [Google Scholar] [CrossRef]
  20. Stavely, R.; Abalo, R.; Nurgali, K. Targeting Enteric Neurons and Plexitis for the Management of Inflammatory Bowel Disease. Curr. Drug Targets 2020, 21. [Google Scholar] [CrossRef]
  21. Kim, Y.S.; Unno, T.; Kim, B.Y.; Park, M.S. Sex differences in gut microbiota. World J. Men’s Health 2020, 38, 48–60. [Google Scholar] [CrossRef] [PubMed]
  22. Houdeau, E. Sex Differences in Gastrointestinal Physiology and Diseases: From Endogenous Sex Hormones to Environmental Endocrine Disruptor Agents. Sex Differ. Physiol. 2016, 125–143. [Google Scholar] [CrossRef]
  23. Martínez-Álvarez, C.; Tudela, C.; Pérez-Miguelsanz, J.; O’Kane, S.; Puerta, J.; Ferguson, M.W.J. Medial edge epithelial cell fate during palatal fusion. Dev. Biol. 2000, 220, 343–357. [Google Scholar] [CrossRef]
  24. Babygirija, R.; Bülbül, M.; Cerjak, D.; Ludwig, K.; Takahashi, T. Sustained acceleration of colonic transit following chronic homotypic stress in oxytocin knockout mice. Neurosci. Lett. 2011, 495, 77–81. [Google Scholar] [CrossRef]
  25. Pettersson, U.S.; Waldén, T.B.; Carlsson, P.O.; Jansson, L.; Phillipson, M. Female Mice are Protected against High-Fat Diet Induced Metabolic Syndrome and Increase the Regulatory T Cell Population in Adipose Tissue. PLoS ONE 2012, 7, e46057. [Google Scholar] [CrossRef]
  26. McQuade, R.M.; Stojanovska, V.; Donald, E.; Abalo, R.; Bornstein, J.C.; Nurgali, K. Gastrointestinal dysfunction and enteric neurotoxicity following treatment with anticancer chemotherapeutic agent 5-fluorouracil. Neurogastroenterol. Motil. 2016, 28, 1861–1875. [Google Scholar] [CrossRef] [PubMed]
  27. Girón, R.; Pérez-García, I.; Abalo, R. X-ray analysis of gastrointestinal motility in conscious mice. Effects of morphine and comparison with rats. Neurogastroenterol. Motil. Off. J. Eur. Gastrointest. Motil. Soc. 2016, 28, 74–84. [Google Scholar] [CrossRef]
  28. Barone, F.C.; Barton, M.E.; White, R.F.; Legos, J.J.; Kikkawa, H.; Shimamura, M.; Kuratani, K.; Kinoshita, M. Inhibition of phosphodiesterase type 4 decreases stress-induced defecation in rats and mice. Pharmacology 2007, 81, 11–17. [Google Scholar] [CrossRef]
  29. Liang, C.; Wang, K.Y.; Yu, Z.; Xu, B. Development of a novel mouse constipation model. World J. Gastroenterol. 2016, 22, 2799–2810. [Google Scholar] [CrossRef]
  30. Andrews, P.L.R.; Horn, C.C. Signals for nausea and emesis: Implications for models of upper gastrointestinal diseases. Auton. Neurosci. Basic Clin. 2006, 125, 100–115. [Google Scholar] [CrossRef]
  31. Horn, C.C.; Kimball, B.A.; Wang, H.; Kaus, J.; Dienel, S.; Nagy, A.; Gathright, G.R.; Yates, B.J.; Andrews, P.L.R. Why Can’t Rodents Vomit? A Comparative Behavioral, Anatomical, and Physiological Study. PLoS ONE 2013, 8, e60537. [Google Scholar] [CrossRef]
  32. Forootan, M.; Bagheri, N.; Darvishi, M. Chronic constipation. Medicine (U.S.) 2018, 97, e10631. [Google Scholar] [CrossRef] [PubMed]
  33. Oh, J.E.; Kim, Y.W.; Park, S.Y.; Kim, J.Y. Estrogen rather than progesterone cause constipation in both female and male mice. Korean J. Physiol. Pharmacol. 2013, 17, 423–426. [Google Scholar] [CrossRef] [PubMed]
  34. Bridgewater, L.C.; Zhang, C.; Wu, Y.; Hu, W.; Zhang, Q.; Wang, J.; Li, S.; Zhao, L. Gender-based differences in host behavior and gut microbiota composition in response to high fat diet and stress in a mouse model. Sci. Rep. 2017, 7, 1–12. [Google Scholar] [CrossRef] [PubMed]
  35. Anitha, M.; Reichardt, F.; Tabatabavakili, S.; Nezami, B.G.; Chassaing, B.; Mwangi, S.; Vijay-Kumar, M.; Gewirtz, A.; Srinivasan, S. Intestinal Dysbiosis Contributes to the Delayed Gastrointestinal Transit in High-Fat Diet Fed Mice. Cell. Mol. Gastroenterol. Hepatol. 2016, 2, 328–339. [Google Scholar] [CrossRef]
  36. Bhattarai, Y.; Fried, D.; Gulbransen, B.; Kadrofske, M.; Fernandes, R.; Xu, H.; Galligan, J. High-fat diet-induced obesity alters nitric oxide-mediated neuromuscular transmission and smooth muscle excitability in the mouse distal colon. Am. J. Physiol. Gastrointest. Liver Physiol. 2016, 311, G210–G220. [Google Scholar] [CrossRef] [PubMed]
  37. Miron, I.; Dumitrascu, D.L. Gastrointestinal motility disorders in obesity. Acta Endocrinol. 2019, 15, 497–504. [Google Scholar] [CrossRef]
  38. Sanders, K.M.; Ward, S.M.; Koh, S.D. Interstitial cells: Regulators of smooth muscle function. Physiol. Rev. 2014, 94, 859–907. [Google Scholar] [CrossRef]
  39. Soares, A.; Beraldi, E.J.; Ferreira, P.E.B.; Bazotte, R.B.; Buttow, N.C. Intestinal and neuronal myenteric adaptations in the small intestine induced by a high-fat diet in mice. BMC Gastroenterol. 2015, 15, 1–9. [Google Scholar] [CrossRef]
  40. Xie, Y.; Ding, F.; Di, W.; Lv, Y.; Xia, F.; Sheng, Y.; Yu, J.; Ding, G. Impact of a high-fat diet on intestinal stem cells and epithelial barrier function in middle-aged female mice. Mol. Med. Rep. 2020, 21, 1133–1144. [Google Scholar] [CrossRef]
  41. Wang, T.; He, C. Pro-inflammatory cytokines: The link between obesity and osteoarthritis. Cytokine Growth Factor Rev. 2018, 44, 38–50. [Google Scholar] [CrossRef] [PubMed]
  42. Li, G.; Ren, J.; Hu, Q.; Deng, Y.; Chen, G.; Guo, K.; Li, R.; Li, Y.; Wu, L.; Wang, G.; et al. Oral pirfenidone protects against fibrosis by inhibiting fibroblast proliferation and TGF-β signaling in a murine colitis model. Biochem. Pharmacol. 2016, 117, 57–67. [Google Scholar] [CrossRef] [PubMed]
Figure 1. Number of feces excreted by the mice belonging to the different experimental groups. Male and female mice of wild type (WT) or mutant (heterozygous; HZ) genotypes were used, which were exposed to a control (CD) or a high fat (HFD) diet for 3 months. The number of feces excreted per hour is shown. The difference due to gender in the WT-CD groups is shown in (A). The effect of diet and genotype on the number of feces excreted by males and females are shown in (B) and (C), respectively. Values are represented by the mean ± SEM (standard error of the mean). * p < 0.05, ** p < 0.01 vs. WT-CD (two-way ANOVA followed by Sidak’s multiple comparisons test).
Proceedings 61 00018 g001
Figure 2. Wet weight of the feces excreted by the mice of the different experimental groups. Male and female mice of wild (WT) or mutant (HZ) genotypes were used, which were exposed to a control (CD) or a high fat (HFD) diet for 3 months. The wet weight of feces excreted per hour is shown. The difference due to gender in the WT-CD groups is shown in (A). The effect of diet and genotype on wet weight of feces excreted by males and females are shown in (B) and (C), respectively. Values are represented by the mean ± SEM (two-way ANOVA followed by Sidak’s multiple comparisons test).
Proceedings 61 00018 g002
Figure 3. Dry weight of the feces excreted by the mice belonging to the different experimental groups. Male and female mice of wild (WT) or mutant (HZ) genotypes were used, which were exposed to a control (CD) or a high fat (HFD) diet for 3 months. The dry weight of the feces per hour is shown. The difference due to gender in the WT-CD groups is shown in (A). The effect of diet and genotype on dry weight of feces excreted by males and females are shown in (B) and (C), respectively. Values are represented by the mean ± SEM (two-way ANOVA followed by Sidak’s multiple comparisons test).
Proceedings 61 00018 g003
Figure 4. Fecal moisture expressed as percentage of water content in the feces excreted by the mice of the different experimental groups. Male and female mice of wild (WT) or mutant (HZ) genotypes were used, which were exposed to a control (CD) or a high fat (HFD) diet for 3 months. The percentage of water in the excreted feces per hour is shown. The difference due to gender in the WT-CD groups is shown in (A). The effect of diet and genotype on moisture of feces excreted by males and females are shown in (B) and (C), respectively. Values are represented by the mean ± SEM. *** p < 0.001 vs. WT-CD and # p < 0.05, ## p < 0.01, ### p < 0.001 vs. HZ-CD (two-way ANOVA followed by Sidak’s multiple comparisons test).
Proceedings 61 00018 g004
Figure 5. Stool marking index in mice of the different experimental groups. Male and female mice of wild (WT) or mutant (HZ) genotypes were used, which were exposed to a control (CD) or a high fat (HFD) diet for 3 months. The stool marking index per hour is shown. The difference due to gender in the WT-CD groups is shown in (A). The effect of diet and genotype on stool marking index in feces excreted by males and females are shown in (B) and (C), respectively. Values are represented by the mean ± SEM. p < 0.05 vs. WT-CD ### p < 0.001 vs. HZ-CD (two-way ANOVA followed by Sidak’s multiple comparisons test).
Proceedings 61 00018 g005
Figure 6. Submucosa thickness in distal colon. Wild type (WT) and mutant (HZ) mice were exposed to a control (CD) or a high fat (HFD) diet for 3 months. Histological samples of WT (left: A, C, E, and G) or HZ (right: B, D, F, and H) mice stained with Van Gieson´s stain. Male (AD) and female (EH) animals. Arrow shows submucosa tissue stained in red. Bar 50 μm.
Proceedings 61 00018 g006
Table 1. Latency of expulsion of the first marked fecal pellet.
WT-CDWT-HFDHZ-CDHZ-HFD
Males107.5 ± 9.4122.3 ± 9.9147.3 ± 10.3 *107.1 ± 8.1
Females138.5 ± 5.4 ^120 ± 14132 ± 7.6135 ± 14.5
Male and female mice of wild (WT) or mutant (HZ) genotypes were used, which were exposed to a control (CD) or a high fat (HFD) diet for 3 months. The interval at which the first fecal pellet appeared was averaged. ^ p < 0.05 vs. males (Student’s t-test); * p < 0.05 vs. males (one-way ANOVA followed by Sidak’s multiple comparisons test).
Table 2. Macroscopic and microscopic characteristics of gastrointestinal organs.
WT-CDWT-HFDHZ-CDHZ-HFD
Weight of organs at sacrificeStomachMales0.35 ± 0.020.29 ± 0.020.38 ± 0.030.31 ±0.02
Females0.36 ± 0.030.25 ± 0.02 **0.4 ± 0.010.24 ±0.02 ###
Full small intestineMales1.17 ± 0.031.14 ± 0.031.28 ± 0.061.24 ± 0.05
Females1.16 ± 0.021.03 ± 0.03 *1.26 ± 0.041.04 ± 0.02 ###
CecumMales0.43 ± 0.030.24 ± 0.01 ***0.48 ± 0.040.26 ± 0.01 ###
Females0.53± 0.03 ^^0.2 ± 0.01 ***0.56 ± 0.020.2 ± 0.01 ###
Full colorectumMales0.35 ± 0.020.27 ± 0.02 *0.37 ± 0.020.31 ± 0.02
Females0.34 ± 0.020.24 ± 0.01 **0.37 ± 0.030.24 ± 0.01 ###
Area or length of organs at sacrificeStomachMales0.89 ± 0.050.81 ± 0.031 ± 0.050.85 ± 0.03
Females0.91 ±0.050.81 ± 0.031.02 ± 0.040.8 ± 0.04 ##
Full small intestineMales27.89 ± 0.6825.83 ± 1.1627.16 ± 0.7724.7 ± 0.88
Females25.13 ± 0.45 ^^24.72 ± 0.6125.54 ± 0.424.59 ± 0.78
CecumMales1.24 ± 0.070.68 ± 0.05 ***1.22 ± 0.090.82 ± 0.05 ###
Females1.38 ± 0.040.63 ± 0.02 ***1.39 ± 0.050.62 ± 0.03 ###
Full colorectumMales4.61 ± 0.153.95 ± 0.16 **4.73 ± 0.124.01 ± 0.11 ##
Females4.24 ± 0.083.93 ± 0.064.73 ± 0.15 *3.99 ± 0.13 ###
Macroscopic characteristics of gastrointestinal organs. Male and female mice of wild (WT) or mutant (HZ) genotypes were used, which were exposed to a control (CD) or a high fat (HFD) diet for 3 months. ^^ p < 0.01 vs. males, * p < 0.05, ** p < 0.01, *** p < 0.001 vs. WT-CD; ## p < 0.01, ### p < 0.001 vs. HZ-CD. (one-way ANOVA followed by Sidak’s multiple comparisons test or Student t test when analyzing gender differences).
Table 3. Submucosa thickness of distal colon.
WT-CDWT-HFDHZ-CDHZ-HFD
Males7.32 ± 0.168.07 ± 0.285.92 ± 0.42 *6.74 ± 0.37
Females6.79 ± 0.578.01 ± 0.738.94 ± 0.44 *9.60 ± 0.59
Male and female mice of wild (WT) or mutant (HZ) genotypes were used, which were exposed to a control (CD) or a high fat (HFD) diet for 3 months. Data represent the submucosa thickness. * p < 0.05, vs. WT-CD (One-way ANOVA followed by Sidak’s multiple comparisons test).
Publisher’s Note: MDPI stays neutral with regard to jurisdictional claims in published maps and institutional affiliations.

