Abstract
Per-arnt-sim (PAS) kinase is a nutrient sensing serine/threonine kinase whose absence protects against triglyceride accumulation, insulin resistance, a decreased metabolic rate and increased weight gain in response to a high fat diet, using phenotypes associated with the gut microbiome. Herein we further explored the metabolic effects of PAS kinase-deficiency(PASK−/−) on a high fat high sugar (HFHS) diet, including contributions from an altered microbiome. PASK−/− mice were not protected from weight gain on the HFHS diet but were resistant to liver triglyceride accumulation. Microbiome analysis of both WT and PASK−/− mice revealed a forked shift with two discrete clusters of HFHS-fed mice emerging, which displayed increased beta and decreased alpha diversity compared with the normal chow diet (NCD). A “lower” cluster associated with both increased weight gain and glucose intolerance contained elevated levels of Firmicutes, Bacteroidetes, Actinobacteria, Proteobacteria and Defferibacteres. Lower cluster PASK−/− mice also influenced glucose tolerance and Claudin-1 expression, a protein associated with leaky gut. These results suggest PAS kinase-deficiency can protect mice against the deleterious effects of liver triglyceride accumulation, leaky gut and glucose intolerance in response to diet; however, microbiome imbalance can override protection. In addition, these results support a healthy diet and suggest microbial culprits associated with metabolic disease.
Keywords:
gut microbiome; diet; insulin resistance; glucose tolerance; obesity; triglyceride; high fat; high sugar; leaky gut; PAS kinase; Claudin-1 1. Introduction
In healthy individuals, increased blood glucose levels trigger beta cells in the pancreas to produce insulin. Extracellular insulin can subsequently bind to insulin receptors on cellular membranes [1], allowing for increased glucose uptake by the cell by translocating glucose receptors to the cellular membrane, and stimulating glycogen synthesis [2]. A decrease in the cell’s sensitivity to insulin is known as insulin resistance, and it can then lead to hyperglycemia, hepatic lipid synthesis and adiposity [3]. The severity of insulin resistance is used to classify individuals as either prediabetic or type 2 diabetic, with prediabetes affecting 33.9% and diabetes affecting 10.5% of adults in the United States [4]. Of adults diagnosed with diabetes, 87.5% were overweight or obese [5], with obesity affecting 39.8% of US adults. Diet plays an important role in the development of obesity and insulin resistance.
Between 2013 and 2016, 37% of adults in the United States ate fast food, typically high in fat, sugar and calories, on a given day [6]. Adults in the United States consume 14.9% of their daily calories from sugar [7], which can lead to metabolic disease [8], and a high-fat diet is a significant driver in the development of obesity [9]. In addition to over nutrition’s caloric contribution to obesity, the influence of diet on obesity and insulin resistance can be traced through the direct effect diet has on the gut microbiota. Over 1000 bacterial species have been identified in the human intestine [10], with populations ranging from 103 bacterial cells/gram of tissue (bacteria/g) in the duodenum, 104 bacteria/g in the jejunum, 107 bacteria/g in the ileum and 1012 bacteria/g in the colon [11]. The duodenum, jejunum and ileum have a higher prevalence of Firmicutes (Lactobacillacea family), Proteobacteria and Actinobacteria, while the colon has a higher prevalence of Bacteroidetes, Firmicutes (Lachnospiraceae and Ruminococcaceae families) and Verrucomicrobia (Akkermansia genus) [11]. This diverse collection of bacteria exists in a delicate dance with the host, as the bacteria are influenced by immune cells and nutrients provided by the host, and the host’s health is subsequently affected by the bacteria in a beneficial or detrimental manner.
Gut bacteria influence the host primarily through by-products of their metabolism. The colon microbiota are responsible for the breakdown of complex polysaccharides otherwise undigestible by the host into short chain fatty acids (SCFA), supplying up to 10% of the host’s daily energy requirements [12,13]. The gut microbiota plays an important role in the development of obesity and insulin resistance, first shown by Gordon et al. [14] with shifts in the ratio of Bacteroidetes, a Gram-negative bacteria, and Firmicutes, a Gram-positive bacteria, in genetically obese mice. Further studies also showed a preponderance of Firmicutes in both obese human subjects [15] and high-fat fed mice [16], with a high-fat high-sugar (HFHS) diet also altering the gut microbiota and increasing intestinal permeability [17]. Additionally, studies showed that transplantation of microbiota from obese human donors into germ-free mice led to the development of weight gain and insulin resistance [18,19,20,21]. Specific strains of bacteria isolated from human hosts and transplanted into germ free mice were shown to induce the correlated phenotype (either lean or obese) found in the host, including Enterobacter cloacae B29 (induced obesity [19]), Bifidobacterium pseudocatenulatum C95 (improved hypoglycemia [22]), and Akkermansia muciniphila (improved glucose tolerance and body weight [21,23,24]). Germ-free mice on a high-fat diet are also protected from obesity and insulin resistance [25], and oral antibiotics ameliorate the effects of a high-fat diet on weight gain, adiposity, glucose intolerance and inflammation [16].
Per-Arnt-Sim kinase-deficient mice(PASK−/−) were previously reported to be resistant to weight gain, adiposity, liver triglyceride accumulation and insulin resistance when placed on a high-fat diet [26,27]. We recently characterized the phenotype of these mice on a western-style HFHS diet, reporting resistance to liver triglyceride accumulation as well as a decreased metabolic rate [28]. PAS kinase has also been shown to play a role in the development of maturity onset diabetes of the young, perhaps through its regulation of insulin gene expression and glucagon secretion [29,30]. Herein, we examine the role that gut microbiota play in metabolic health and their ability to override genetic influences (PASK−/−) to induce altered metabolism and inflammation, including liver triglyceride accumulation, adiposity, insulin resistance and intestinal permeability.
2. Materials and Methods
Animals: All procedures were carried out with the approval of the Institutional Animal Care and Use Committee (IACUC) of Brigham Young University (protocols 16-1003 and 13-1003). C57BL/6 (Charles River Laboratories Wilmington, MA, USA) PASK+/− male (2) and (1) female mice were generously donated by Jared Rutter (University of Utah) [31] and bred to produce the colony used for this study. Upon weaning at 3 weeks of age, littermates were randomly assigned to either a normal chow diet (NCD) (8604; Tekland Diets, Madison, WI; protein 32% kcal, fat 14%, carbohydrate 54%) or a western-style high-fat, high-sugar diet (HFHS) (D12266Bi; Research Diets, Inc., New Brunswick, NJ; protein 16.8% kcal, fat 31.8%, carbohydrate 51.4%). Mice were co-housed according to sex, genotype and assigned diet. All mice were housed with no more than five mice per cage, on a 12-h light/dark cycle. Water and food were freely available. PASK genotypes were determined by polymerase chain reaction (PCR) of tail snip genomic DNA specimens using the following primers: PASK for (5′-GAAGTCACCCCCGATCCCCTCCTAAC-3′), PASK MUT rev primer (5′-ACTTTCGGTTCCTCTTCCCATGAATTC-3′) and PASK WT rev primer (5′-CTAGCCATGGTGCTTACCCTC-3′).
Glucose tolerance testing (GTT) and insulin tolerance testing (ITT): All mice were fasted 6 h prior to both GTT and ITT, with water freely available. Blood glucose levels were measured using the TRUEresult glucometer (Nipro diagnostics, Fort Lauderdale, FL). An initial blood glucose reading was taken prior to injection. For GTT, a 20% glucose solution in PBS was injected intraperitoneally (IP) at a dose of 1mg/g body weight. Blood glucose samples were measured at 5, 15, 30, 60, 90 and 120 min after injection. For ITT, 0.375 units/kg body weight of 0.5 U/mL insulin was IP administered (Humulin R; Lilly, Indianapolis, IN). Blood glucose levels were measured at 15, 30, 45, 60, 90 and 120 min after injection. Mice with multiple readings below 20 mg/dL and demonstrating signs of insulin shock were IP injected with 100 uL of glucose and removed from the analysis. Food was made readily available and the mice were observed for recovery.
Tissue harvest: At 25 weeks of age, mice were euthanized by using cervical dislocation. Tissues and organs of interest were excised, cleaned, weighed, flash frozen in liquid nitrogen and stored at −80 °C.
Metagenomic analysis of gut microbiota: To track changes in weight and gut microbial contents, mice were weighed weekly and fecal samples were collected and placed on dry ice until storage at −80 °C. Bacterial DNA was isolated and purified from fecal pellets using the extraction protocol described in Godon et al. [32] with the following changes: samples were homogenized in the Next Advance Bullet Blender Storm (Next Advance, Averill Park, NY), using 3.2 mm stainless steel beads (SSB32; Next Advance, Averill Park, NY), and then cells were disrupted with 0.1 mm glass beads (GB01; Next Advance, Averill Park, NY). After isolation, purified DNA was suspended in 10 mM Tris (pH 8.5) and stored at −20 °C. DNA concentration and purity was estimated by measuring the A260/A280 ratio with a Nanodrop spectrophotometer (Nanodrop Technologies, Wilmington DE), and integrity of purified DNA was checked using 0.8% agarose gel electrophoresis with ethidium bromide staining.
16S rDNA gene libraries were prepared according to directions by Illumina using AMPure beads (Beckman Coulter Life Sciences, Indianapolis, IN) for PCR cleanup. SequalPrep normalization plates (Invitrogen, Frederick, MD) were used for final DNA normalization of all samples with the exception of the first batch of gut microbiota sequencing on male week 22 mice, where samples were normalized manually by determining the concentration of DNA by Nanodrop spectrophotometry (Nanodrop Technologies, Wilmington DE), then adjusting it appropriately. Paired-end sequencing was performed on the Illumina Hi-Seq 2500 platform in the BYU DNA Sequencing Center. 16S rDNA sequences were analyzed using the QIIME2/2017.10. software package [33]. Read joining, denoising, demultiplexing and feature assignments were accomplished using the Dada2 [34] plug-in. Forward reads were truncated 23 bp to trim amplicon primers. Reverse reads were truncated at 249 and 240 base pairs to insure overlap of reads. Samples from the created BIOM table [35] were then filtered to remove features that appear in less than 2 total samples (singletons), samples that contain less than 10 features, and features not assigned to at least the phyla level. Phylogenetic distances were computed using q2-feature-classifier [36] with naïve-bayes fit [37]. Alpha and beta diversity were calculated using core metrics rarefied to a sampling depth of 8000. Principle coordinate analysis (PCoA) visualizations were created using EMPeror [38,39]. Permutational Multivariate Analysis of Variance (PERMANOVA) [40] was used to compare differences in beta diversity between groups. Alpha diversity was calculated using Faith’s Phylogenetic Diversity (PD) and Kruskal-Wallis one-way analysis of variance [41,42]. Taxonomy was assigned using q2-feature-classifier plug-in [43] using Greengenes13_8 85% OTUs trained with the following primer sequences: F-CCTACGGGNGGCWGCAG R- GACTACHVGGGTATCTAATCC.
Triglyceride assays: Mouse liver samples were homogenized in 5% NPS- water using the Next Advance Bullet Blender Storm (Next Advance, Averill Park, NY) with 0.9–2 mm stainless steel beads (SSB32; Next Advance, Averill Park, NY). Hepatic triglyceride levels were measured using the BioVision (Milpitas, CA, USA) Triglyceride Quantification Colorimetric/Fluorometric Kit (K622) according to the manufacturer’s protocol, and absorbance was measured at 530–590 nm. Protein concentration was determined using the Pierce Coomassie Plus (Bradford) Assay Reagent (ThermoFisher Scientific, Waltham, MA, USA).
Immunoblotting: Colon and skeletal muscle samples were lysed in 2X RIPA buffer volume/sample volume, with 10 µL/mL protease and phosphatase inhibitor cocktail (#78440, Thermo Fisher, Rockford, IL, USA). All samples were homogenized using the Bullet Blender Storm 24 (Next Advance, Averill Park, NY, USA), using 0.9–2 mm stainless steel beads. Following homogenization and lysis, samples were centrifuged at 16,000 rcf for 10 min and the supernatant was collected and stored at −80 °C. Protein levels were quantified using the Pierce BCA Assay Kit (Thermo Fisher, Rockford, IL, USA) and a microplate reader (BioTek, Minooski, VT, USA). Equal amounts of protein from colon lysates were combined with 5× Lane Marker Sample Buffer (Thermo Fisher, Rockford, IL, USA), heated in a boiling water bath for 5 min and then loaded onto a 4–15% SDS-PAGE gradient mini-PROTEAN TGX gel,15 µL/well volume (Bio-Rad, Hercules, CA, USA) for separation. Muscle samples were treated with 2× Laemmli Sample Buffer (Bio-Rad, Hercules, CA, USA), heated for 5 min in boing water and loaded onto an Any kD mini-PROTEAN TGX gel, 20 µL/well volume.
An internal standard (WT-NCD) was included on every gel for normalization comparison between gels. Semi-dry electrotransfer of proteins to a 0.45 µm nitrocellulose membrane in transfer buffer (20% methanol in tris/glycine buffer) was performed using the Bio-Rad Trans-Blot Turbo (Invitrogen, Carlsbad, CA, USA) mixed MW midi program. After transfer to the nitrocellulose membrane, non-specific proteins were blocked in a 5% milk solution (non-fat dry milk in 1X tris-buffered saline (TBS)) and washed in TBST (0.05% Tween-20 in TBS). The membrane was then incubated overnight with primary antibodies at 1:1000 dilution (claudin-1, β-Actin, GAPDH, Akt, pAkt(Ser473) Cell Signaling, Danvers, MA, USA), diluted in BSA (2.5 g bovine serum albumin in 50 mL TBST). GAPDH served as the loading control for muscle samples, and β-Actin served as the loading control for liver and colon samples. Following overnight incubation and washing, the membrane was then incubated for 60 min under foil with secondary antibodies, 1:10,000 dilution (IRDye 680RD goat/anti-rabbit, IRDye 800CW donkey/anti-mouse LI-COR, Lincoln, NE) in BSA and washed with TBST. Membranes were scanned on the LI-COR reader using default parameters. Protein expression levels were evaluated and using the LI-COR imaging software. The resulting readings were then normalized against the WT-NCD internal standard. Any samples in which the loading control was <0.7 or >1.3 relative to the internal standard were discarded.
Statistical Analysis: All data are shown as mean ± SEM using GraphPad Prism 7.0. Factorial ANOVA was performed using JMP Pro vesion14 SAS Institute Inc., Cary, NC, 1989–2019 with Tukey post-hoc test for three-factor and two-factor interaction analysis or Dunnetts post hoc test for comparison with control. Alpha diversity of microbiota data was analyzed using Kruskal-Wallis one-way ANOVA [41]. Permutational Multivariate Analysis of Variance (PERMANOVA) [40] was used to compare differences in beta diversity between groups. Area under the curve was calculated with a baseline of 0. Tertiles were assigned by sorting each group sequentially and dividing the rankings into thirds.
3. Results
3.1. PASK−/− Deletion Does Not Protect Against Weight Gain on A Hfhs Diet, but Does Protect Against Hepatic Triglyceride Accumulation in Male Mice
Male PASK-deficient mice were previously reported as resistant to weight gain, liver triglyceride accumulation and insulin resistance when placed on a high-fat diet [31]. In addition, we recently reported protection from triglyceride accumulation of male PASK-deficient mice on a western-style diet-one high in both fats and sugars (HFHS) [28], from which this study is an extension. For mice in this study, male WT-HFHS (p = 0.012) and PASK−/−-HFHS (p = 0.002) both had significantly higher final body weights as well as weights at most time points after 11 weeks when compared to WT-NCD (Figure 1A). In addition, female WT and PASK−/−displayed greater weights on the HFHS diet compared to the NCD, despite the smaller weight gains than males, with PASK−/−-HFHS mice having significantly or very near significantly greater weight gains relative to WT-NCD after 16 weeks on the HFHS diet (Figure 1A). When analyzed by factorial ANOVA, these final weight differences were due to an interaction between both diet and genotype. However, neither male nor female mice displayed significant differences between genotypes in total weight gain (Figure 1A&B). Thus, both male and female PASK-deficient mice were not protected from the HFHS diet, but instead had trending increases in weights. The PASK-deficient female mice did however display significantly lower weights on the normal chow diet at two time points (week 1 and week 12, p-value = 0.0476 and 0.0438). In contrast, relative weights of male gonadal (GFP) (WT p = 0.0346, PASK−/− p = 0.0198) and retroperitoneal fat pads (RFP) (WT p = 0.0015, PASK−/− p = 0.0002) showed differences reflective of diet, not genotype (Figure 1C). Female mice, on the other hand, displayed no significant increase in GFP on the HFHS diet, but PASK-deficient females displayed a 2-fold increase in RFP on the HFHS diet (p-value = 0.0074, Figure 1D). This observation of significant differences in the bodyweight and RFP weight is the first report of what appears to be dyslipidemia in the female PASK-deficient mice.
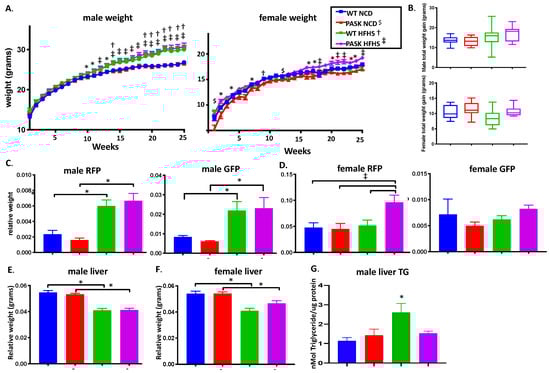
Figure 1.
Diet, influenced by genotype, alters body and tissue weight of WT and Per-Arnt-Sim kinase (PASK)-deficient mice. (A) Weekly body weight of male and female mice displays weight gain in response to HFHS diet, influenced by genotype. (B) No significant difference in total weight gain of male and female mice. Relative tissue weights of male (C) and female (D) gonadal fat pad (GFP) and retroperitoneal fat pad (RFP) at dissection expressed as tissue weight/final body weight. (E) Male liver weight is influenced by diet, whereas female liver weight (F) is influenced by both diet and genotype, with PAS kinase-deficiency protecting against hepatic weight loss in response to HFHS diet. (G) PAS kinase-deficiency protects male mice against diet-induced hepatic triglyceride accumulation. All data is expressed as mean ± SE. All groups n = 13–19 with the exception of male liver TG (n = 4–8). Factorial ANOVA (JMP Pro version 14) statistical analysis was performed on male and female mice individually because statistical differences were observed for both sexes at all time points. Significant differences obtained through post hoc LSMeans Dunnett analysis using WT NCD as control or between other groups by post hoc Tukey HSD are shown; p-value less than or equal to 0.06 are shown as diet only (*) or interaction between diet and genotype (NCD with PASK $, HFHS with WT †, HFHS with PASK ‡).
We have previously shown that male but not female mice are protected from liver triglyceride accumulation on a HFHS diet [28], and others have shown dramatic protection of male mice on a HF diet [31]. We analyzed both liver weights as well as male liver triglyceride accumulation at dissection. The weight of the livers of both male and female mice were significantly reduced in response to the HFHS diet (p < 0.0001). No significant difference was seen between the WT and PASK−/− male mice. However, the weight of the livers of female PASK−/− mice were not as reduced as the WT mice on the HFHS diet (Figure 1E,F, p = 0.0697). Despite the lack of protection against weight gain, the results of liver triglyceride resistance were consistent with our previous study of these mice on a HFHS diet or other studies with the HF diet, with male PASK−/−-HFHS mice displaying levels of liver triglycerides similar to the NCD mice, while WT mice display elevated triglycerides p = 0.0124 (Figure 1G). Due to the increased weight gain and persistence of the liver triglyceride phenotype in male mice, male mice were used for the remainder of this study.
3.2. PASK Deletion Does Not Significantly Alter Blood Glucose Levels
Previous research has shown deletion of PASK−/− imparts a protective effect against high-fat diet-induced insulin resistance [31,37], however there have been no reports on the effects of a HFHS diet. Significant differences in the glucose response or area under the curve at 15 weeks were seen in the combined mice on the HFHS diet versus the NCD (p-value = 0.0414, for all mice), with significant differences between the WT (p-value = 0.0420) but not PASK−/− mice (p-value = 0.3946) only when each genotype is analyzed by ANOVA separately for diet differences (Figure 2A,B). The opposite pattern is solidified at the final time point when each genotype is analyzed separately, 23 weeks (WT p-value = 0.3655, PASK−/− p-value = 0.0197). For ITT the combined mice once again displayed an effect due to the HFHS diet at 16 weeks (p-value 0.0170) (Figure 2C). When each genotype was analyzed, PASK−/− mice display an altered response to insulin when on the HFHS diet by one-way ANOVA of all cohorts with post hoc Tukey analysis (p = 0.0288) or by factorial ANOVA with post hoc Dunnett using PASK−/− NCD as control (p = 0.0481). No significant differences in ITT was observed in any of the cohorts at 24 weeks (Figure 2D).
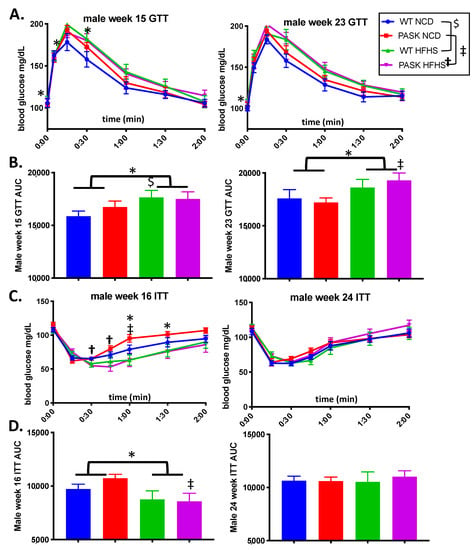
Figure 2.
The high fat high sugar (HFHS) diet affects both glucose tolerance testing (GTT) and insulin tolerance testing (ITT) responses. (A) Blood glucose levels during IP glucose tolerance testing (GTT) at 15 weeks and 23 weeks on the HFHS diet. (B) Area under the curve (AUC) from (A). (C) Blood glucose levels during IP insulin tolerance testing (ITT) at 16 weeks and 24 weeks on the HFHS diet. (D) Area under the curve (AUC) for (C). All data was analyzed by one factor ANOVA within genotype (HFHS versus NCD) followed by post hoc Tukey analysis and by Factorial ANOVA of the entire data set with post hoc Dunnetts analysis to investigate interactions between diet and genotype in JMP Pro version 14. “$” indicates differences between the NCD versus the HFHS diet in WT mice, and “‡” indicated differences between the two diets in PASK−/− mice, “†” indicates a significant difference for the PASK−/−-HFHS cohort compared to all others, * indicates differences due to diet (all mice on NCD versus all mice on HFHS diet). p-value < 0.06. All groups n = 7.
3.3. Claudin-1 Expression Is Dependent on Diet
A high-fat diet has been shown to increase intestinal permeability [16] and significantly decrease levels of tight junction proteins, including claudin [44]. Bacterial lipopolysaccharide (LPS), also known as endotoxins, can pass through the intestinal epithelium into the bloodstream when tight junctions between epithelial cells are disrupted. Claudin-1, zonula occludens-1 and occludin are proteins in the epithelial barrier that play a crucial role in the regulation of intestinal permeability. [45] To better understand the increased weight gain, decreased hepatic triglycerides and effects on insulin response seen on the HFHS diet, protein levels of claudin-1 were measured in colon tissue by using immunoblotting. Colon claudin-1 expression significantly decreased in WT-HFHS mice compared to WT-NCD mice (Figure 3A, p = 0.0005), confirming previous reports of decrease in response to a high sugar diet. As with the hepatic triglyceride accumulation, PASK−/−-HFHS mice displayed resistance to this decrease in claudin-1 expression when compared to WT-HFHS mice (Figure 3A, p-value 0.0473). Factorial ANOVA confirmed these differences to be due to an interaction between genotype and diet.
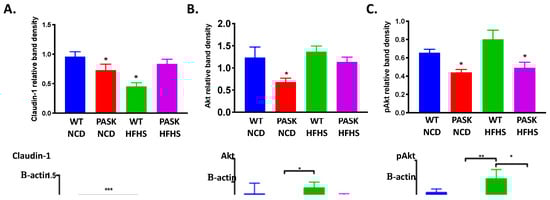
Figure 3.
Diet and genotype induced changes in protein levels. (A) Colon claudin-1 levels are decreased in WT but not PASK-deficient mice on a HFHS diet. N = 5–7 per group. (B) Muscle Akt levels are decreased in PASK−/− mice on a NCD. N = 3–5 per group, (C) Muscle pAkt(ser473) levels are decreased in PASK−/− mice. N = 4–5 per group. Statistical analysis was performed using factorial ANOVA in JMP Pro version 14 with post hoc Dunnet analysis (* indicates p-value < 0.05). Representative immunoblots are shown.
Current research suggests the mechanism by which the gut microbiota influences levels of tight junction proteins is via the Protein Kinase B (Akt) signaling pathway. LPS from gram-negative bacteria binds to toll like receptor-4 on the surface of a cell, which triggers the production of inflammatory cytokines including tumor necrosis factor α (TNF-α) and NFκB [46,47]. In intestinal epithelial cells, NFκB activates inflammatory cytokines which inhibit the Akt/mTOR signaling pathway. Inhibition of the Akt signaling pathway reduces levels of tight junction protein expression [48,49]. Overall Akt levels in the skeletal muscle show a decreasing trend in PASK−/−-NCD when compared to all other mice, with factorial ANOVA suggesting the difference is due to interactions between genotype and diet (Figure 3B, p = 0.008). Relative levels of activated Akt (pAkt ser473) also decreased in PASK−/− mice to ~65% of WT with no dependence on diet (Figure 3C, p = 0.009), conflicting with the Claudin-1 results as well as previously published liver data from high-fat fed PASK−/− mice [50]. These differences may reflect tissue differences, since Claudin-1 levels were measured in the colon and AKT in the muscle, and previous studies of AKT levels were reported for liver tissue [50]. The AKT levels in liver tissue were therefore measured, however no difference was seen between the mice, suggesting these differences lie elsewhere, such as differences in the diet (data not shown).
3.4. Gut Microbiota Composition Is Determined by An Interaction between Diet and Genotype
To study the effects of PASK−/− and diet on the gut microbiota, fecal samples collected at 15 as well as 22 weeks on the diet were selected for bacterial DNA isolation and sequencing. These time points were chosen for maximum GTT/ITT difference (15 weeks, Figure 2), maximum length of time on the diet as well as the longest amount of time after blood glucose testing (2 weeks) to minimize any effects of stress. Preliminary results of the unweighted Unifrac principle coordinate analysis (PCoA) plot showed a clear separation by diet with the NCD mice closely clustered together (Figure 4A, blue dots). Genotype did not appear to influence the overall separation of the samples, with both genotypes equally dispersed among diet groups (Figure 4B).
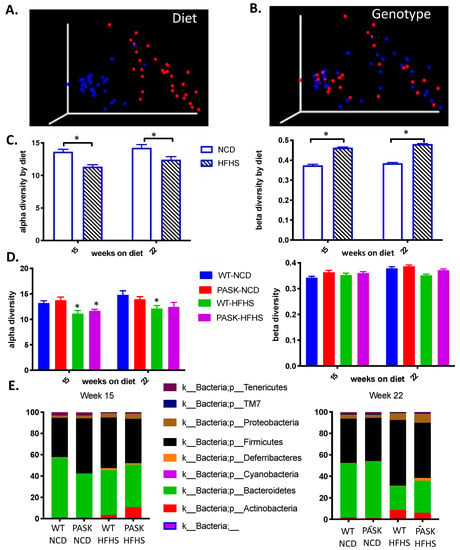
Figure 4.
Diet, influenced by genotype, alters gut microbial diversity. (A) Comparison of unweighted UniFrac distances between NCD (blue) and HFHS (red). (B) Comparison of unweighted UniFrac distances between WT (blue) and PASK−/- (red). (C) Comparison of alpha and beta diversity between NCD and HFHS. (D) Comparison of alpha and beta diversity by diet and genotype. (E) Relative abundance at phyla level in week 15 samples and week 22 samples. Alpha diversity is expressed as mean plus SEM, distances to NCD with Kruskal-Wallis follow-up. Beta diversity is expressed as mean plus SEM with PERMANOVA comparison.
Diet played a significant role in shaping differences in alpha (15-week n = 21–25, p = 0.00002 H = 18.2, q = 0.0002. 22-week n = 27–29, p = 0.002 H = 9.55) and beta (15-week p = 0.001, 22-week p = 0.001) diversity after both 15 and 22 weeks on the diet (Figure 4C). When comparing genotype alone, samples taken after both 15 and 22 weeks on the diet showed no differences in alpha diversity (Faith’s Phylogenetic Diversity) [42] (15-week HFHS n = 12–13, p = 0.586; NCD n = 10–11, p = 0.324. 22-week NCD n = 13–16, p = 0.93. HFHS n = 12–15, p = 0.96) (Figure 4C) or beta diversity (unweighted Unifrac) [51] (15-week NCD p = 0.314, HFHS p = 0.672. 22-week NCD p = 0.183, HFHS p = 0.579). These results suggest that diet played the determinative role in the composition of the gut microbiota; however, factorial ANOVA indicated that diet differences are due to an interaction with genotypes as well. When analyzing the alpha diversity, a post hoc Dunnett’s test using WT-NCD as a control reveals a significant change with only WT-HFHS (week 15 p-value 0.0360, week 22 p-value = 0.0340), whereas PASK−/−-HFHS is close to significance at week 22 (p-value = 0.0708) but not at week 15. When PASK−/−-NCD was placed as the control in the post hoc Dunnett test, both the PASK−/−-HFHS (p-value 0.0154) and the WT-HFHS (p-value 0.00350) displayed significant differences at week 15, but no differences were seen at week 22. Thus, most differences appear to be due to diet, with an apparent interaction between diet and genotype leading to some subtle differences between the genotypes explored further below.
3.5. Bacterial Composition Is Associated with Weight Gain and Glucose Tolerance in Mice on a HFHS Diet
To further study the roles diet and microbiota composition played in the development of obesity and glucose intolerance on the HFHS diet, we analyzed Unweighted Unifrac Principle Coordinate Analysis (PCoA) results by body weight at the time of microbiome analysis. The mice on a HFHS diet fell into two apparent microbiome groups termed the upper and lower clusters at week 22 but not week 15, suggesting the microbiota shift in the HFHS developed over time (Figure 5A, oval outlines at week 22). This shift in the microbiome is reflected in Unweighted Unifrac distances between the first and second tertile of final body weight in HFHS week 22 samples (p = 0.003) with the heaviest mice (1st tertile, triangles) all belonging in the lower cluster (Figure 5B). Accordingly, the HFHS lower cluster had significantly higher final body weights (Figure 5C) when compared to the WT-NCD (p = 0.0478), whereas the HFHS upper cluster did not (p = 0.1854). These data suggest the microbiota shift that occurred in a subset of mice on the HFHS diet was a factor in the development of obesity. The shift in the 22-week HFHS lower cluster displayed higher levels of several Phyla, including Firmicutes, Bacteroidetes, Actinobacteria, Proteobacteria and Defferibacteres (Figure 5D).
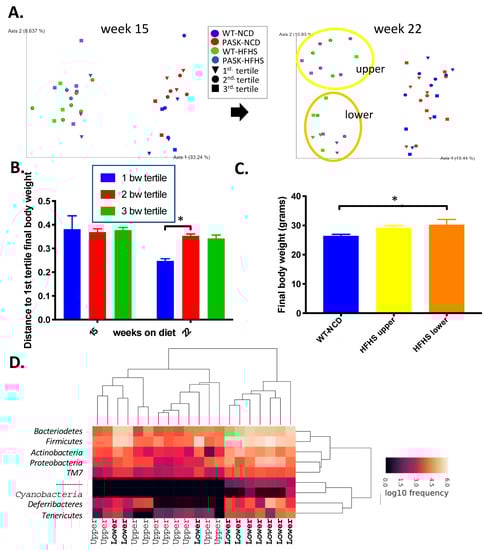
Figure 5.
Gut microbial composition influences weight gain on a HFHS diet. (A) Unweighted UniFrac PCoA plot of week 15 samples and week 22 samples coded by final body weight tertile per group, with oval outline of the HFHS lower cluster (orange) and upper cluster (yellow). (B) Comparison of unweighted UniFrac distances by final body weight tertile of HFHS males at 15 and 22 weeks. (C) Final body weights of HFHS mice divided by unweighted UniFrac PCoA cluster compared to the WT-NCD. (D) Heatmap of week 22 male HFHS samples with the upper or lower cluster indicated on the x-axis. ANOVA from JMP Pro version14 software was used to determine significance followed by post hoc Tukey analysis (* indicates p-value < 0.05).
Comparison of glucose responses (GTT) between the two clusters at week 15, 19 and 22 revealed no difference between the clusters at week-15, but once again a shift to impaired glucose response was detected in the lower cluster at week 19 (p = 0.0028) and week-23 (p = 0.0099) (Figure 6A,B). When GTT results were divided into tertiles, mice whose week 19 GTT AUC results were in the top (worst) tertile for their group were all in the lower gut microbiota cluster and their gut microbiota showed a separation from the middle tertile reflected in unweighted UniFrac distances (Figure 6C, p = 0.015). In contrast, ITT results were not correlated with microbiota composition (Figure 6D).
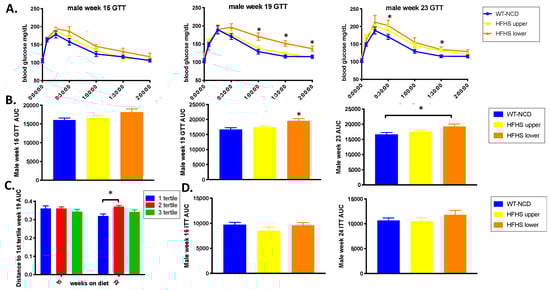
Figure 6.
Gut microbial composition influences glucose response. (A) Week 15, 19 and 23 glucose tolerance test (GTT). (B) Area under the curve (AUC) of the GTT shown in (A) (n = 8–14). (C) Comparison of unweighted UniFrac distances between week-19 AUC tertiles (n = 15–28). (D) Week 16 and 24 insulin tolerance test (ITT) (n = 10–13). ANOVA in JMP Pro version 14 was used to analyze significance with post hoc Tukey analysis to obtain the p-value (* indicates p-value < 0.05).
3.6. Genotype Influences Bacterial Composition and An Interplay between both Is Associated with Glucose Response in HFHS Mice
To determine whether the genotype played any role in the gut microbiota divergence and associated phenotypes, the upper and lower clusters were compared by genotype for weight gain, liver triglyceride accumulation, claudin-1 expression and glucose tolerance. When separated by genotype and microbiome cluster, a HFHS diet significantly increased the final body weight of the PASK−/−-HFHS lower cluster mice, while WT-HFHS lower cluster mice showed a significant increase (p = 0.0451) in triglycerides with the WT-HFHS upper mice nearing significance (p = 0.0738) (Figure 7 A,B). These results suggested altered lipidomics in the WT and PASK−/− lower cluster mice, favoring triglyceride accumulation for WT and fat production for PASK−/− mice in response to the HFHS diet. The HFHS diet decreased claudin-1 expression in both WT upper (p = 0.0113) and lower (p = 0.0305) as well as the PASK−/− lower group (p = 0.0317) when compared to WT-NCD (Figure 7C). Interestingly, however, the PASK−/−-HFHS upper group was once again protected and displayed claudin-1 levels similar to WT-NCD (p = 0.9004), just as this cohort was protected from weight gain. The factorial ANOVA performed suggested these effects were once again due to an interaction between genotype, diet and microbiome cluster, supporting the differences between WT and PASK−/− and suggesting a protective effect provided by PASK-deficiency which could be overcome by the microbiota in the lower cluster but not by the microbiota in the upper cluster.
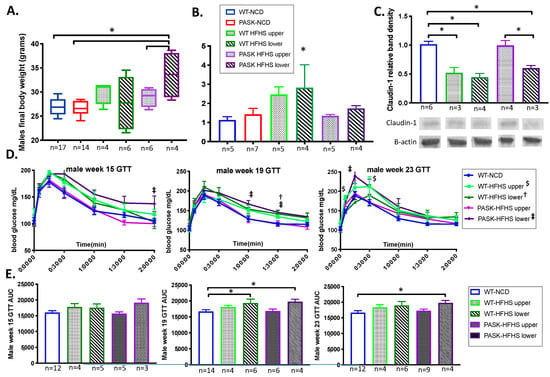
Figure 7.
An interplay between genotype and microbial composition influences weight and glucose response. (A) Comparison of weight gain, (B) triglyceride accumulation and (C) claudin-1 expression on the high fat high sugar diet by unweighted UniFrac PCoA cluster and genotype. Representative western blots for claudin-1 are shown. (D) Glucose tolerance(GTT) tests at week 15, 19 and 22. (E) Area under the curve (AUC) of the GTT’s shown in (D). Factorial ANOVA was performed on all samples, including individual GTT time points (symbols †, ‡, $ for p-value < 0.051) as well as the AUC (* is used for p-value < 0.051) using JMP Pro version 14 and significant time points suggested an interaction between diet, genotype and upper or lower cluster. Sample number is provided (n).
The glucose response by genotype in the upper and lower clusters was also compared (Figure 7D,E). At 15 weeks there were no AUC differences between the groups based on the genotype that achieved statistical significance when using full factorial ANOVA; however, the final datapoint of the GTT was significantly different and the PASK−/−-HFHS lower group AUC trended high (p = 0.0885). At week 19 both the PASK−/−-HFHS lower group (p = 0.0363), and the WT-HFHS lower group (p = 0.0335) had greater AUC when compared to the total WT-NCD group by using full factorial ANOVA, which suggested the effects were due to an interaction between diet, genotype and the HFHS cluster. At the 23-week timepoint, only the PASK−/−-HFHS lower group was significantly different from the WT-NCD group (p = 0.0534), with the WT-HFHS differences becoming less apparent (p = 0.1123). These results support a genotypic effect and suggest that the PASK−/−-HFHS mice showed a greater susceptibility to the shift in the microbiota, showing more dramatic shifts than WT-HFHS at weeks 15 and 23.
4. Discussion
Rates of obesity, hypertriglyceridemia and insulin resistance are alarming and on the rise in the United States, necessitating better animal models to better understand influencing factors. Deletion of PAS kinase (PASK) has previously been shown to protect mice against high fat diet-induced weight gain, triglyceride accumulation and insulin resistance [27,31,37], suggesting that it is a key regulator of these pivotal pathways. The microbiome has also been correlated with these phenotypes in several studies, yet no studies have investigated the combined effects of microbiome and PASK-deficiency. Herein, the role of PAS kinase was examined on a western-style HFHS diet rather than a high fat diet, including effects on weight gain, triglyceride accumulation, glucose sensitivity and insulin resistance as well as microbiome composition. Although all mice displayed an expected shift to lower alpha diversity and increased beta diversity on the HFHS diet, a key finding was a remarkable forked separation of microbiome composition observed in both wild type and PASK−/− mice on the HFHS diet. Two discrete microbiomes emerged, with the “lower” cluster containing elevated levels of Firmicutes, Bacteroidetes, Actinobacteria, Proteobacteria and Defferibacteres when compared to the “upper” cluster (Figure 5D). These upper and lower clusters were also associated with key differences in weight gain, liver triglyceride accumulation as well as glucose intolerance.
Contrary to previously published studies, although mice on the western-style HFHS gained weight, deletion of PAS kinase did not protect mice from weight gain (Figure 1A,B). An examination of the microbiota clusters revealed that none of the mice in the upper cluster were in the highest tertile of body weight, suggesting the microbiota may play a protective role in weight gain. When the upper and lower clusters were examined based on their genotype, only the PASK−/−-HFHS lower cluster mice displayed a significant increase in body weight, suggesting that they contributed most to the weight significance of the lower cluster. In contrast, when analyzing liver triglyceride by their cluster, only the WT lower cluster displayed significant increases, supporting PASK-deficiency protection from liver triglyceride accumulation (Figure 7A,B). Thus, both weight and liver triglyceride accumulation are associated with the lower cluster microbiome, with key differences due to the wild type and PASK−/− mice favoring liver triglyceride accumulation or weight gain, respectively.
Mice in the lower microbiota cluster also displayed significantly poorer glucose tolerance after both 19 and 23 weeks on the HFHS diet, whereas mice in the upper microbiota cluster on the same diet showed a glucose response that was indistinguishable from that of wild type mice on a healthy NCD (Figure 6A,B). When analyzed based on their genotype, the WT and PASK−/− lower cluster mice showed poor glucose tolerance (AUC) at 19 weeks, with only PASK−/− AUC remaining significant at 23 weeks (Figure 7E); however, several individual time points were significant for the HFHS upper cluster (Figure 7D). Full factorial ANOVA suggested the effects were due to an interaction between diet, genotype and the HFHS cluster, supporting true genotypic and microbiome differences.
The exact mechanisms by which gut bacteria influence weight gain, hepatic triglyceride levels and insulin resistance are unknown but may be related to the inflammatory response triggered by lipopolysaccharide (LPS), an endotoxin from the cell walls of gram-negative bacteria. Dietary sugar has been shown to lead to increased hepatic fat and translocation of LPS from the intestines into the bloodstream of mice [52]. This circulating LPS is also correlated with obesity and insulin resistance [16,17]. LPS can pass through the intestinal epithelium into the bloodstream when tight junctions between epithelial cells are disrupted. Claudin-1, zonula occludens-1 and occludin are proteins in these epithelial barriers, which play a crucial role in the regulation of intestinal permeability [45]. A high-fat diet has been shown to increase intestinal permeability [16] and significantly decrease levels of tight junction proteins, including claudin [44]. Both diet and genotype also influenced expression of the tight-junction protein claudin-1. In wild type mice, the HFHS diet led to significantly less claudin-1 in the colon, whereas PASK−/− mice were protected against a HFHS-induced claudin-1 decrease (Figure 7C). Decreased levels of tight-junction proteins in the gut have been shown to correlate with increased gut permeability, systemic inflammation and insulin resistance [16,17]. Thus, claudin-1 increases may in part explain the differences in glucose tolerance reported herein, along with the previously described regulation of insulin production and secretion by PAS kinase [29,30]. Even though PASK−/− mice were not protected against all of the harmful effects of the HFHS diet in this study (weight gain in the lower cluster), they did show some metabolic advantages over wild type mice (glucose tolerance, resistance to triglyceride accumulation and increased claudin-1 expression in the upper cluster).
The cause of the divergence in microbiota composition between the two clusters is unknown; however, maternal influences are unlikely due to the similarity of the HFHS microbiota at 15 weeks. All the mice were on the HFHS diet, and both clusters contained a mix of wild type and PASK−/− mice. It is possible that the microbiota shift happened in some mice due to stress, which is a known disrupter of the gut microbiota [53] and tight junction protein expression [49,54,55]. However, a key observation of this study is that no gut microbiota divergence was detected in mice on the healthy NCD. This finding suggests that a healthy diet confers protection against potentially harmful disruptions to the gut microbiota, whereas the western-style diet left mice vulnerable to such disruption. Further studies controlling for stress as a variable, sequencing of additional timepoints between 15 and 22 weeks as well as examining individual bacterial species and strains to determine which contributed to the harmful effects of the lower cluster gut microbiota may better explain the clustering seen in the HFHS mice. Such studies have the potential to lead to better microbial interventions in the treatment of metabolic disease.
Author Contributions
Conceptualization, J.H.G. and L.C.B.; methodology, J.H.G., J.J.F. and L.C.B.; formal analysis, J.H.G., J.J.F. and L.C.B., investigation, J.H.G., J.J.F. and K.W.L.; resources, J.H.G. and L.C.B.; writing—original draft preparation, J.H.G. and J.J.F.; writing—review and editing, L.C.B.; supervision, J.H.G. and L.C.B. project administration, L.C.B.; funding acquisition, J.H.G. and L.C.B.
Funding
This research was funded by National Institutes of Health Grant R15 GM100376-02 (J.H.G.), the BYU Gerontology Program (L.C.B.), BYU ORCA Environments for Mentoring Grants (L.C.B.) and the BYU College of Life Sciences and Department of Microbiology and Molecular Biology (J.H.G and L.C.B.).
Acknowledgments
We thank the BYU DNA Sequencing Center for the microbiome sequencing. We also thank Brigham Young University students who aided with care of the mice including Haley Burrell, Andrew Rees, Alistair Hilton, Nidhi Choksi and Kai Li Ong.
Conflicts of Interest
The funders of the study herein had no role in the design of the study; in the collection, analyses or interpretation of data; in the writing of the manuscript, or in the decision to publish the results. One author (J.H.G.) owns shares of a company developing pharmaceutical inhibitors of PAS kinase.
References
- Kasuga, M.; Karlsson, F.A.; Kahn, C.R. Insulin stimulates the phosphorylation of the 95,000-dalton subunit of its own receptor. Science 1982, 215, 185–187. [Google Scholar] [CrossRef] [PubMed]
- Bryant, N.J.; Govers, R.; James, D.E. Regulated transport of the glucose transporter GLUT4. Nat. Rev. Mol. Cell Biol. 2002, 3, 267–277. [Google Scholar] [CrossRef] [PubMed]
- Mokdad, A.H.; Ford, E.S.; Bowman, B.A.; Dietz, W.H.; Vinicor, F.; Bales, V.S.; Marks, J.S. Prevalence of obesity, diabetes, and obesity-related health risk factors, 2001. JAMA 2003, 289, 76–79. [Google Scholar] [CrossRef]
- Mendola, N.D.; Chen, C.T.; Gu, Q.; Eberhardt, M.S.; Saydah, S. Prevalence of Total, Diagnosed, and Undiagnosed Diabetes among Adults: United States, 2013–2016; NCHS Data Brief, No 322; National Center for Health Statistics: Hyattsville, MD, USA, 2018. [Google Scholar]
- National Diabetes Statistics Report, 2017; Centers for Disease Control and Prevention, U.S. Dept of Health and Human Services: Atlanta, GA, USA, 2017.
- Fryar, C.D.; Hughes, J.P.; Herrick, K.A.; Ahluwalia, N. Fast Food Consumption among Adults in the United States, 2013–2016; NCHS Data Brief, No 322; National Center for Health Statistics: Hyattsville, MD, USA, 2018. [Google Scholar]
- Yang, Q.; Zhang, Z.; Gregg, E.W.; Flanders, W.D.; Merritt, R.; Hu, F.B. Added sugar intake and cardiovascular diseases mortality among US adults. JAMA Intern. Med. 2014, 174, 516–524. [Google Scholar] [CrossRef]
- Stanhope, K.L. Sugar consumption, metabolic disease and obesity: The state of the controversy. Crit. Rev. Clin. Lab. Sci. 2016, 53, 52–67. [Google Scholar] [CrossRef] [PubMed]
- Moreno, L.A.; Rodríguez, G.; Fleta, J.; Bueno-Lozano, M.; Lázaro, A.; Bueno, G. Trends of Dietary Habits in Adolescents. Crit. Rev. Food Sci. Nutr. 2010, 50, 106–112. [Google Scholar] [CrossRef]
- Qin, J.; Li, R.; Raes, J.; Arumugam, M.; Burgdorf, K.S.; Manichanh, C.; Nielsen, T.; Pons, N.; Levenez, F.; Yamada, T.; et al. A human gut microbial gene catalogue established by metagenomic sequencing. Nature 2010, 464, 59–65. [Google Scholar] [CrossRef]
- Sommer, F.; Bäckhed, F. Know your neighbor: Microbiota and host epithelial cells interact locally to control intestinal function and physiology. BioEssays 2016, 38, 455–464. [Google Scholar] [CrossRef]
- Macfarlane, G.T.; Macfarlane, S. Fermentation in the human large intestine: Its physiologic consequences and the potential contribution of prebiotics. J. Clin. Gastroenterol. 2011, 45, S120–S127. [Google Scholar] [CrossRef]
- Grenham, S.; Clarke, G.; Cryan, J.F.; Dinan, T.G. Brain–Gut–Microbe Communication in Health and Disease. Front. Physiol. 2011, 2, 94. [Google Scholar] [CrossRef]
- Ley, R.E.; Backhed, F.; Turnbaugh, P.; Lozupone, C.A.; Knight, R.D.; Gordon, J.I. Obesity alters gut microbial ecology. Proc. Natl. Acad. Sci. USA 2005, 102, 11070–11075. [Google Scholar] [CrossRef] [PubMed]
- Moreno-Indias, I.; Sanchez-Alcoholado, L.; Garcia-Fuentes, E.; Cardona, F.; Queipo-Ortuno, M.I.; Tinahones, F.J. Insulin resistance is associated with specific gut microbiota in appendix samples from morbidly obese patients. Am. J. Transl. Res. 2016, 8, 5672–5684. [Google Scholar] [PubMed]
- Cani, P.D.; Bibiloni, R.; Knauf, C.; Waget, A.; Neyrinck, A.M.; Delzenne, N.M.; Burcelin, R. Changes in Gut Microbiota Control Metabolic Endotoxemia-Induced Inflammation in High-Fat Diet–Induced Obesity and Diabetes in Mice. Diabetes 2008, 57, 1470–1481. [Google Scholar] [CrossRef] [PubMed]
- Martinez-Medina, M.; Denizot, J.; Dreux, N.; Robin, F.; Billard, E.; Bonnet, R.; Darfeuille-Michaud, A.; Barnich, N. Western diet induces dysbiosis with increased E coliin CEABAC10 mice, alters host barrier function favouring AIEC colonisation. Gut 2014, 63, 116–124. [Google Scholar] [CrossRef]
- Bäckhed, F.; Manchester, J.K.; Semenkovich, C.F.; Gordon, J.I. Mechanisms underlying the resistance to diet-induced obesity in germ-free mice. Proc. Natl. Acad. Sci. USA 2007, 104, 979–984. [Google Scholar] [CrossRef]
- Fei, N.; Zhao, L. An opportunistic pathogen isolated from the gut of an obese human causes obesity in germfree mice. ISME J. 2013, 7, 880–884. [Google Scholar] [CrossRef]
- Turnbaugh, P.J.; Ley, R.E.; Mahowald, M.A.; Magrini, V.; Mardis, E.R.; Gordon, J.I. An obesity-associated gut microbiome with increased capacity for energy harvest. Nature 2006, 444, 1027. [Google Scholar] [CrossRef]
- Available online: https://www.nature.com/articles/nature05414#supplementary-information (accessed on 1 October 2018).
- Shin, N.-R.; Lee, J.-C.; Lee, H.-Y.; Kim, M.-S.; Whon, T.W.; Lee, M.-S.; Bae, J.-W. An increase in the Akkermansia spp. population induced by metformin treatment improves glucose homeostasis in diet-induced obese mice. Gut 2014, 63, 727–735. [Google Scholar] [CrossRef]
- Zhao, L.; Zhang, F.; Ding, X.; Wu, G.; Lam, Y.Y.; Wang, X.; Fu, H.; Xue, X.; Lu, C.; Ma, J.; et al. Gut bacteria selectively promoted by dietary fibers alleviate type 2 diabetes. Science 2018, 359, 1151–1156. [Google Scholar] [CrossRef]
- Everard, A.; Belzer, C.; Geurts, L.; Ouwerkerk, J.P.; Druart, C.; Bindels, L.B.; Guiot, Y.; Derrien, M.; Muccioli, G.G.; Delzenne, N.M.; et al. Cross-talk between Akkermansia muciniphila and intestinal epithelium controls diet-induced obesity. Proc. Natl. Acad. Sci. USA 2013, 110, 9066–9071. [Google Scholar] [CrossRef]
- Karlsson, C.L.; Onnerfalt, J.; Xu, J.; Molin, G.; Ahrne, S.; Thorngren-Jerneck, K. The microbiota of the gut in preschool children with normal and excessive body weight. Obesity 2012, 20, 2257–2261. [Google Scholar] [CrossRef] [PubMed]
- Backhed, F.; Ding, H.; Wang, T.; Hooper, L.V.; Koh, G.Y.; Nagy, A.; Semenkovich, C.F.; Gordon, J.I. The gut microbiota as an environmental factor that regulates fat storage. Proc. Natl. Acad. Sci. USA 2004, 101, 15718–15723. [Google Scholar] [CrossRef] [PubMed]
- Rutter, J.; Michnoff, C.H.; Harper, S.M.; Gardner, K.H.; McKnight, S.L. PAS kinase: An evolutionarily conserved PAS domain-regulated serine/threonine kinase. Proc. Natl. Acad. Sci. USA 2001, 98, 8991–8996. [Google Scholar] [CrossRef] [PubMed]
- da Silva Xavier, G.; Farhan, H.; Kim, H.; Caxaria, S.; Johnson, P.; Hughes, S.; Bugliani, M.; Marselli, L.; Marchetti, P.; Birzele, F.; et al. Per-arnt-sim (PAS) domain-containing protein kinase is downregulated in human islets in type 2 diabetes and regulates glucagon secretion. Diabetologia 2011, 54, 819–827. [Google Scholar] [CrossRef] [PubMed]
- Pape, J.A.; Newey, C.R.; Burrell, H.R.; Workman, A.; Perry, K.; Bikman, B.T.; Bridgewater, L.C.; Grose, J.H. Per-Arnt-Sim Kinase (PASK) Deficiency Increases Cellular Respiration on a Standard Diet and Decreases Liver Triglyceride Accumulation on a Western High-Fat High-Sugar Diet. Nutrients 2018, 10. [Google Scholar] [CrossRef]
- Zhang, D.D.; Zhang, J.G.; Wang, Y.Z.; Liu, Y.; Liu, G.L.; Li, X.Y. Per-Arnt-Sim Kinase (PASK): An Emerging Regulator of Mammalian Glucose and Lipid Metabolism. Nutrients 2015, 7, 7437–7450. [Google Scholar] [CrossRef]
- DeMille, D.; Grose, J.H. PAS kinase: A nutrient sensing regulator of glucose homeostasis. IUBMB Life 2013, 65, 921–929. [Google Scholar] [CrossRef]
- Hao, H.-X.; Cardon, C.M.; Swiatek, W.; Cooksey, R.C.; Smith, T.L.; Wilde, J.; Boudina, S.; Abel, E.D.; McClain, D.A.; Rutter, J. PAS kinase is required for normal cellular energy balance. Proc. Natl. Acad. Sci. USA 2007, 104, 15466–15471. [Google Scholar] [CrossRef]
- Godon, J.J.; Zumstein, E.; Dabert, P.; Habouzit, F.; Moletta, R. Molecular microbial diversity of an anaerobic digestor as determined by small-subunit rDNA sequence analysis. Appl. Environ. Microbiol. 1997, 63, 2802–2813. [Google Scholar] [CrossRef]
- Caporaso, J.G.; Kuczynski, J.; Stombaugh, J.; Bittinger, K.; Bushman, F.D.; Costello, E.K.; Fierer, N.; Pena, A.G.; Goodrich, J.K.; Gordon, J.I.; et al. QIIME allows analysis of high-throughput community sequencing data. Nat. Methods 2010, 7, 335–336. [Google Scholar] [CrossRef]
- Callahan, B.J.; McMurdie, P.J.; Rosen, M.J.; Han, A.W.; Johnson, A.J.; Holmes, S.P. DADA2: High-resolution sample inference from Illumina amplicon data. Nat. Methods 2016, 13, 581–583. [Google Scholar] [CrossRef] [PubMed]
- McDonald, D.; Clemente, J.C.; Kuczynski, J.; Rideout, J.R.; Stombaugh, J.; Wendel, D.; Wilke, A.; Huse, S.; Hufnagle, J.; Meyer, F.; et al. The Biological Observation Matrix (BIOM) format or: How I learned to stop worrying and love the ome-ome. GigaScience 2012, 1, 7. [Google Scholar] [CrossRef] [PubMed]
- Bokulich, N.A.; Kaehler, B.D.; Rideout, J.R.; Dillon, M.; Bolyen, E.; Knight, R.; Huttley, G.A.; Gregory Caporaso, J. Optimizing taxonomic classification of marker-gene amplicon sequences with QIIME 2′s q2-feature-classifier plugin. Microbiome 2018, 6, 90. [Google Scholar] [CrossRef]
- Pedregosa, F.; Varoquaux, G.; Gramfort, A.; Michel, V.; Thirion, B.; Grisel, O.; Blondel, M.; Prettenhofer, P.; Weiss, R.; Dubourg, V.; et al. Scikit-learn: Machine Learning in Python. J. Mach. Learn. Res. 2011, 12, 2825–2830. [Google Scholar]
- Vazquez-Baeza, Y.; Pirrung, M.; Gonzalez, A.; Knight, R. EMPeror: A tool for visualizing high-throughput microbial community data. GigaScience 2013, 2, 16. [Google Scholar] [CrossRef] [PubMed]
- Vazquez-Baeza, Y.; Gonzalez, A.; Smarr, L.; McDonald, D.; Morton, J.T.; Navas-Molina, J.A.; Knight, R. Bringing the Dynamic Microbiome to Life with Animations. Cell Host Microbe 2017, 21, 7–10. [Google Scholar] [CrossRef]
- Anderson, M.J. A new method for non-parametric multivariate analysis of variance. Austral Ecol. 2001, 26, 32–46. [Google Scholar] [CrossRef]
- Kruskal, W.H.; Wallis, W.A. Use of ranks in one-criterion variance analysis. J. Am. Stat. Assoc. 1952, 47, 583–621. [Google Scholar] [CrossRef]
- Faith, D.P. Conservation evaluation and phylogenetic diversity. Biol. Conserv. 1992, 61, 1–10. [Google Scholar] [CrossRef]
- Perez-Garcia, A.; Dongil, P.; Hurtado-Carneiro, V.; Blazquez, E.; Sanz, C.; Alvarez, E. High-fat diet alters PAS kinase regulation by fasting and feeding in liver. J. Nutr. Biochem. 2018, 57, 14–25. [Google Scholar] [CrossRef]
- Lim, S.-M.; Jeong, J.-J.; Woo, K.H.; Han, M.J.; Kim, D.-H. Lactobacillus sakei OK67 ameliorates high-fat diet–induced blood glucose intolerance and obesity in mice by inhibiting gut microbiota lipopolysaccharide production and inducing colon tight junction protein expression. Nutr. Res. 2016, 36, 337–348. [Google Scholar] [CrossRef] [PubMed]
- Ashida, H.; Ogawa, M.; Kim, M.; Mimuro, H.; Sasakawa, C. Bacteria and host interactions in the gut epithelial barrier. Nat. Chem. Biol. 2011, 8, 36–45. [Google Scholar] [CrossRef] [PubMed]
- Guo, S.; Nighot, M.; Al-Sadi, R.; Alhmoud, T.; Nighot, P.; Ma, T.Y. Lipopolysaccharide Regulation of Intestinal Tight Junction Permeability Is Mediated by TLR4 Signal Transduction Pathway Activation of FAK and MyD88. J. Immunol. 2015, 195, 4999–5010. [Google Scholar] [CrossRef] [PubMed]
- Amar, J.; Chabo, C.; Waget, A.; Klopp, P.; Vachoux, C.; Bermúdez-Humarán, L.G.; Smirnova, N.; Bergé, M.; Sulpice, T.; Lahtinen, S.; et al. Intestinal mucosal adherence and translocation of commensal bacteria at the early onset of type 2 diabetes: Molecular mechanisms and probiotic treatment. EMBO Mol. Med. 2011, 3, 559–572. [Google Scholar] [CrossRef] [PubMed]
- Wang, H.; Ji, Y.; Wu, G.; Sun, K.; Sun, Y.; Li, W.; Wang, B.; He, B.; Zhang, Q.; Dai, Z.; et al. l-Tryptophan Activates Mammalian Target of Rapamycin and Enhances Expression of Tight Junction Proteins in Intestinal Porcine Epithelial Cells. J. Nutr. 2015, 145, 1156–1162. [Google Scholar] [CrossRef]
- Yan, H.; Ajuwon, K.M. Butyrate modifies intestinal barrier function in IPEC-J2 cells through a selective upregulation of tight junction proteins and activation of the Akt signaling pathway. PLoS ONE 2017, 12, e0179586. [Google Scholar] [CrossRef]
- Pérez-García, A.; Dongil, P.; Hurtado-Carneiro, V.; Blazquez, E.; Sanz, C.; Alvarez, E. PAS Kinase deficiency alters the glucokinase function and hepatic metabolism. Sci. Rep. 2018, 8, 11091–11091. [Google Scholar] [CrossRef]
- Lozupone, C.; Knight, R. UniFrac: A new phylogenetic method for comparing microbial communities. Appl. Environ. Microbiol. 2005, 71, 8228–8235. [Google Scholar] [CrossRef]
- Bergheim, I.; Weber, S.; Vos, M.; Kramer, S.; Volynets, V.; Kaserouni, S.; McClain, C.J.; Bischoff, S.C. Antibiotics protect against fructose-induced hepatic lipid accumulation in mice: Role of endotoxin. J. Hepatol. 2008, 48, 983–992. [Google Scholar] [CrossRef]
- Bridgewater, L.C.; Zhang, C.; Wu, Y.; Hu, W.; Zhang, Q.; Wang, J.; Li, S.; Zhao, L. Gender-based differences in host behavior and gut microbiota composition in response to high fat diet and stress in a mouse model. Sci. Rep. 2017, 7, 10776. [Google Scholar] [CrossRef]
- Demaude, J.; Salvador-Cartier, C.; Fioramonti, J.; Ferrier, L.; Bueno, L. Phenotypic changes in colonocytes following acute stress or activation of mast cells in mice: Implications for delayed epithelial barrier dysfunction. Gut 2006, 55, 655–661. [Google Scholar] [CrossRef] [PubMed]
Publisher’s Note: MDPI stays neutral with regard to jurisdictional claims in published maps and institutional affiliations. |
© 2020 by the authors. Licensee MDPI, Basel, Switzerland. This article is an open access article distributed under the terms and conditions of the Creative Commons Attribution (CC BY) license (https://creativecommons.org/licenses/by/4.0/).