Proceeding Paper

Ceramic Soil Microbial Fuel Cells Sensors for Early Detection of Eutrophication †

by
Lola Gonzalez Olias
1,2,
Alba Rodríguez Otero
1,
Petra J. Cameron
3 and
Mirella Di Lorenzo
1,*
1
Centre for Biosensors, Bioelectronics and Biodevices (C3Bio) and Department of Chemical Engineering, University of Bath, Bath BA2 7AY, UK
2
Water Innovation Research Centre (WIRC), University of Bath, Bath BA2 7AY, UK
3
Department of Chemistry, University of Bath, Bath BA2 7AY, UK
*
Author to whom correspondence should be addressed.
Presented at the 1st International Electronic Conference on Biosensors, 2–17 November 2020; Available online: https://iecb2020.sciforum.net/.
Proceedings 2020, 60(1), 64; https://doi.org/10.3390/IECB2020-07039
Published: 2 November 2020
(This article belongs to the Proceedings of The 1st International Electronic Conference on Biosensors)

Abstract

:
The increasing use of fertilisers rises the risk of eutrophication, a sudden algal bloom that seriously damage ecosystems due to critical oxygen depletion. Continuous monitoring of oxygen in environmental waters could improve the detection of eutrophication and prevent anoxic conditions. However, online and in situ dissolved oxygen sensors are yet to be implemented due to poor portability and power requirements. Here, we propose a ceramic soil microbial fuel cell as a self-powered sensor for algal growth detection via monitoring of dissolved oxygen in water. The sensor signal follows the characteristic photosynthetic cycle, with a maximum day current of 0.18 ± 0.2 mA and a minimum night current of 0.06 ± 0.34 mA, which correlates with dissolved oxygen (R2 = 0.85 (day); R2 = 0.5 (night)) and algal concentration (R2 = 0.63). A saturated design of experiments on seven factors suggests that temperature, dissolved oxygen, nitrates, and pH are the most influential operational factors in the voltage output. Moreover, operating the system at maximum power point (Rext = 2 kΩ) improves the sensor sensitivity. To the best of our knowledge, this is the first proposed MFC-based biosensor for in-field, early detection of eutrophic events.

1. Introduction

Climate change and excessive use of fertilizers in agriculture is intensifying eutrophication of water bodies worldwide. High concentration of nitrates and phosphates in water promote rapid growth of microalgae on surface waters that excrete harmful toxins and produce hypoxia in the subsurface waters, leading to irreversible loss of biodiversity [1]. Early detection of sudden growth of algae could help implement proactive approaches to control the use of fertilisers, reducing the risk of eutrophication [2]. Eutrophication causes oxygen supersaturation during the day and depletion during the night on surface waters, as a consequence of photosynthetic production of oxygen [1].
Current monitoring techniques for detection of algal blooms, based on remote sensing technologies such as radar or satellite, are effective in open sea but have suffered from image interferences due to vegetation and urbanization in inland waters, where the risk of eutrophication is higher [3]. These systems are, in addition, costly, and data analysis is slow, hence not effective as early warning systems (EWS) [4]. Continuous, in-situ and online sensors to monitor algae growth are not readily available yet, due to limitation in portability, autonomy and long-term stability [5].
Microbial fuel cell (MFC)-based biosensors can overcome some of these issues, due to simplicity in the design and low power requirements [6]. Recently, a ceramic, soil-based MFC (CSMFC) sensor was proposed by our group as a portable device for online, in-situ, and real-time readings of dissolved oxygen (DO) in water [7].
In this study, we propose to use the CSMFC technology as an early warning system for eutrophic events, by monitoring the distinctive photosynthetic day/night patterns of dissolved oxygen in water.
To effectively calibrate the sensor, a preliminary analysis on a wide range of possible influential factors should be done to account for all important variables. This analysis is rarely performed because it involves a large number of experiments, especially when the “one factor at the time” approach is followed. In contrast, design of experiments (DoE) is an efficient tool that maximises the knowledge of a system with minimum number of experiments [8]. Within DoE designs, a resolution III saturated fractional design (RIII) is commonly employed as a preliminary screening to identify the most influential factors on a novel design. In an RIII, the main factors are confounded with second order interactions, meaning that the accuracy of the design is low for prediction purposes. Resolution designs constitute, however, an effective first step to identify the most influential operational and design variables in the response of the system [8].
In this study, the effect of temperature, DO, nitrates, conductivity, pH, external resistance and cathode material on the voltage output is investigated following a RIII design methodology.

2. Materials and Methods
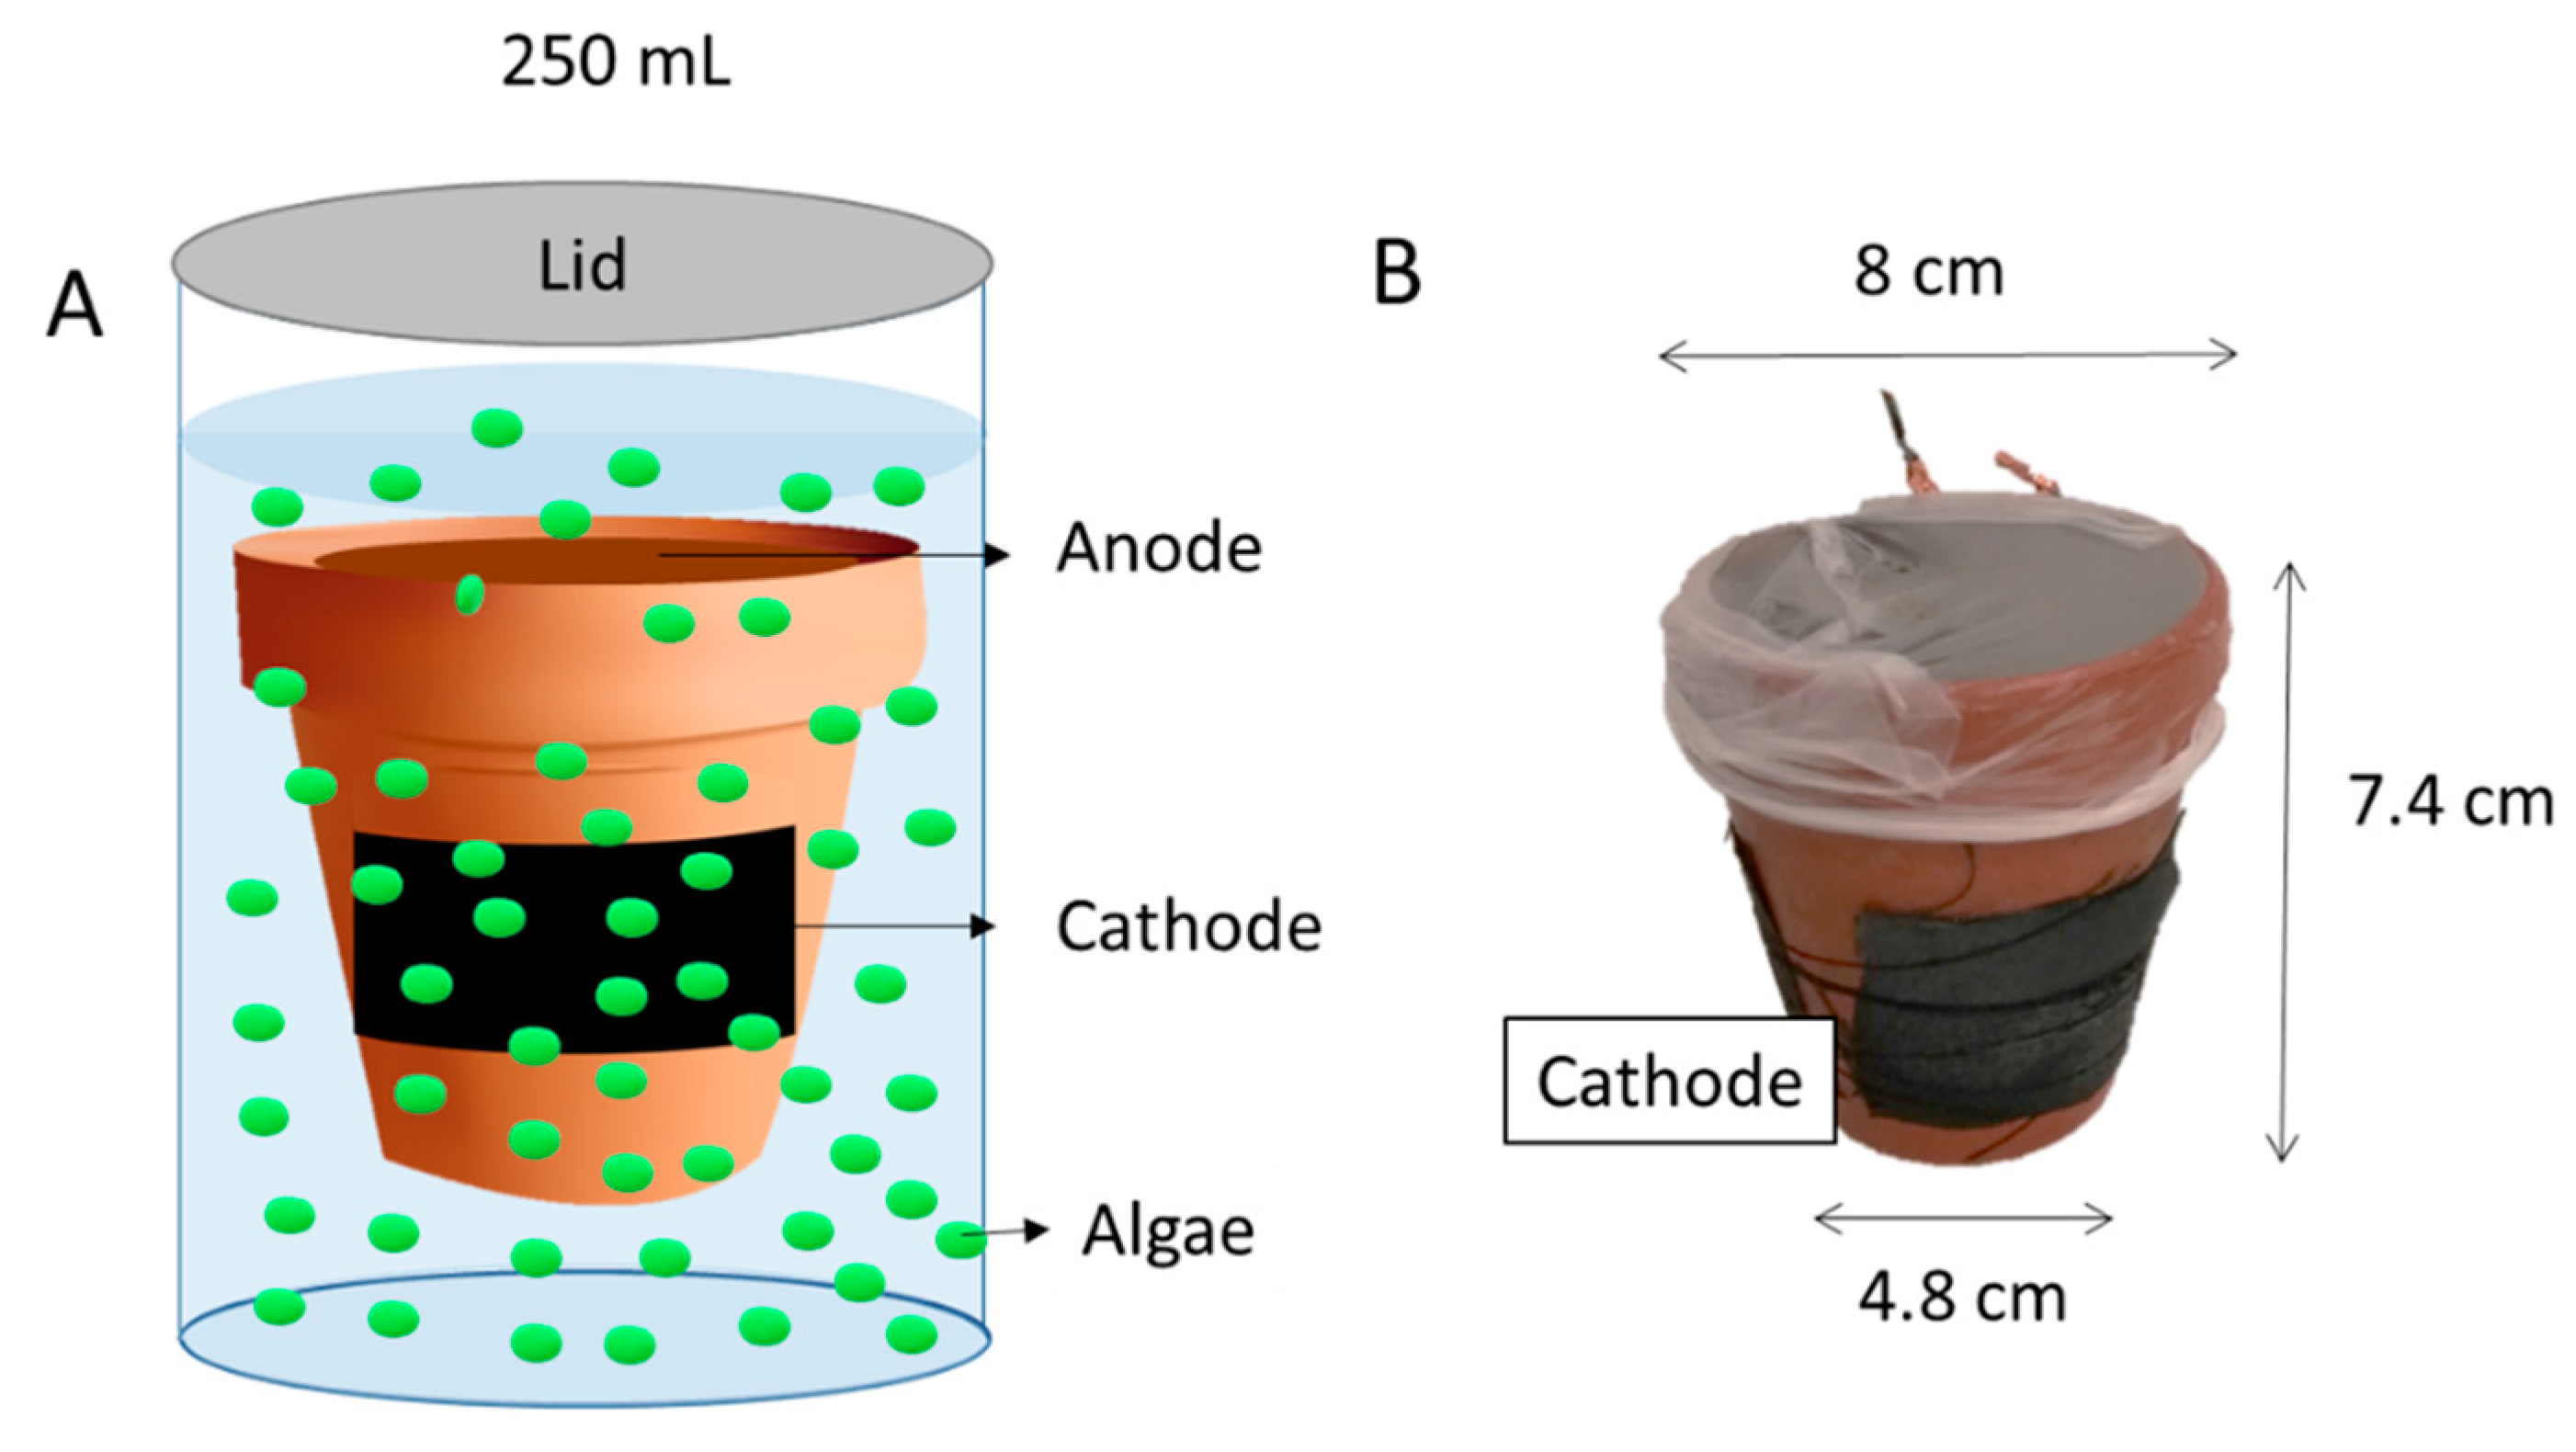
2.1. Materials

All chemicals were purchased from Sigma Aldrich without further purification. Aqueous solutions were prepared with reverse osmosis purified water.
Soil was collected at the outskirts of the University of Bath campus and cleared of branches and leaves prior to be used. The organic content of the soil, measured with the loss of ignition method [9] right after collection, was 16.88 ± 0.91%.
Water with algae was collected from a pond at the University of Bath (51.378294, −2.328439) on the 4th of January of 2019 at 10 am and filtered with a sieve to remove grit and debris. Aliquots of 50 mL of pond water were inoculated for 10 days in 250 mL of Bold Basal Medium (BBM) [10]. The culture was sub-cultured three times for 10 days each time in 250 mL of BBM, to select for photosynthetic species. The resulting culture was maintained in 1 L bottles at an OD750nm between 0.7 and 1. All algal cultures were grown in an incubator at 12 h/12 h light cycle under white light at 5 lm m−1 intensity, at 25 °C and agitation of 180 rpm. The cultures were inoculated in aseptic conditions and maintained on sterile containers with natural airflow.
The pH was measured with a pH-meter (Thermo Scientific Orion ROSS Ultra pH/ATC Triode, Austin, TX, USA). Conductivity was measured with a conductivity benchtop cell (Orion, Thermo Scientific, Austin, TX, USA). Dissolved oxygen was measured with a DO portable meter (RDO Orion 7003, Singapore). Nitrates were measured by using a commercial reagent for high range samples (0–14,000 ppm, HANNA Instruments HI 839800 COD reactor).

2.2. Operation of the CSMFC in Eutrophic Water

The CSMFC consists of a terracotta vessel (Little Bug Crafts, Poole, UK) of dimensions 7.4 cm (height) × 8 cm (upper diameter) × 4.8 cm (bottom diameter) × 0.04 cm (thickness). The anode was made of four pieces (3 × 3 × 0.7 cm3) of graphite felt (GF, Online Furnace Services Ltd., Greenrock, Scotland, UK), acid treated as previously described [11], woven together with Ti wire (25 mm, Advent Research Materials, Oxford, UK). The cathode (6 × 4 cm2) was made of two pieces of carbon cloth (Plain carbon cloth, Etek Cloth A, Fuel Cell Earth US) and one piece of 0.7 × 4 × 6 cm3 for the graphite felt cathode. The CSMFC was assembled as described in our previous study and shown in Figure 1. Anode and cathode terminals were connected to an external resistance (Rext) of 1 kΩ and to a data logger (PicoLog High Resolution Data Logger, Pico Technology) to monitor the voltage every minute. During enrichment, the CSMFCs were placed inside a 250 mL glass vessel containing 200 mL of an algae solution of OD750 nm = 0.06 in BBM with a final pH = 6.4 and conductivity of 750 µS cm−1. The vessels were covered with parafilm to prevent contamination while allowing transport of gases. The set up was operated in a black box on a 12 h/12 h light regime with 60 W adjustable blue and red LEDs (light intensity of 40 mW cm−1). Experiments were run at room temperature of 20 ± 3 °C.

2.3. Electrochemical Characterisation

Polarisation tests were conducted to evaluate the effect of two cathode materials, carbon felt and carbon cloth, used as cathodes materials, hereafter referred to as CSMFC-CC and CSMFC-CF, respectively. The polarisation tests were not performed on the algal solution, because unsteady DO due to photosynthesis will challenge the results interpretation. Instead, new CSMFC were enriched and operated in tap water at DO = 8.6 mg L−1, following the procedure reported in our previous study [7]. The tests were performed by applying an external load within the range of 10 MΩ–100 Ω with a resistance box (RS Components, Northants, UK), starting from open circuit voltage (OCV) and waiting until signal stabilisation in each step. The current (I) was calculated according to Ohm’s Law (I = V/Rext) and power (P) was calculated as P = I × V. Tests were performed in triplicate.
Drifts in the cathodic performance over time were assessed with cyclic voltammetry (CV) using a potentiostat (PalmSens4, Palmsense) and a 3-electrode system where the algal cathode served as the working electrode, an array of four stainless-steel meshes (4 × 4 cm2) as counter electrode and an Ag/AgCl (3 M KCl sat) as reference electrode. The CVs were run at a scan rate of 1 mV s−1 swiping from 0.6 V to −0.6 V vs. Ag/AgCl with 5 s of stabilisation in a 250 mL beaker with 200 mL of BBM as electrolyte without agitation, approximately five hours after the start of the light period. The CV test was performed in duplicate.

2.4. Influence of Factors on the CSMFC Response

A saturated fractional design on seven factors and eight experiments was performed in duplicate to test the effect of DO, nitrates, conductivity, pH, temperature, external resistance, electrode material, with the sensor voltage output as response. For that, new CSMFCs were enriched as previously described, in the absence of algae [7]. Table 1 shows the treatment levels chosen for each factor, which are selected based on typical values for environmental waters ([12]) including high conductivity to mimic operation in seawater. The external resistance was chosen as the optimum value for power generation (Rext = 2 kΩ) and a higher value of 5 kΩ, to slow down the kinetics of organic matter oxidation and extend the sensor’s lifetime [13]. Carbon cloth, CC, and carbon felt, CF, were chosen as electrode materials due to their proved stability in biological systems. Table 2 shows the standard order table for the DoE and Equations (1)–(6) show the confounding pattern of the main factors with second-order interactions. Higher-order interactions are assumed negligible. The detailed aliasing procedure of the factors to obtain the confounding pattern is described in specialised DoE references [8]. In our case, the aliasing pattern, ignoring third- and fourth-order interactions, is:
M = C × NO3 = DO × pH = T × Rext
C = M × NO3 = DO × T = pH × Rext
DO = M × pH = C × T = NO3 × Rext
NO3 = M × C = DO × Rext = pH × T
T = C × DO = M × Rext = NO3 × T
Rext = DO × NO3 = C × pH = M × T
Coding of factor levels and the experimental runs (Table 2) were performed following the methodology described in our previous study and using the same set-up.
The statistical analyses, model assumptions, and Pareto Plots were performed by using the R software (www.r-project.com), using the code provided in our previous study.

3. Results and Discussion

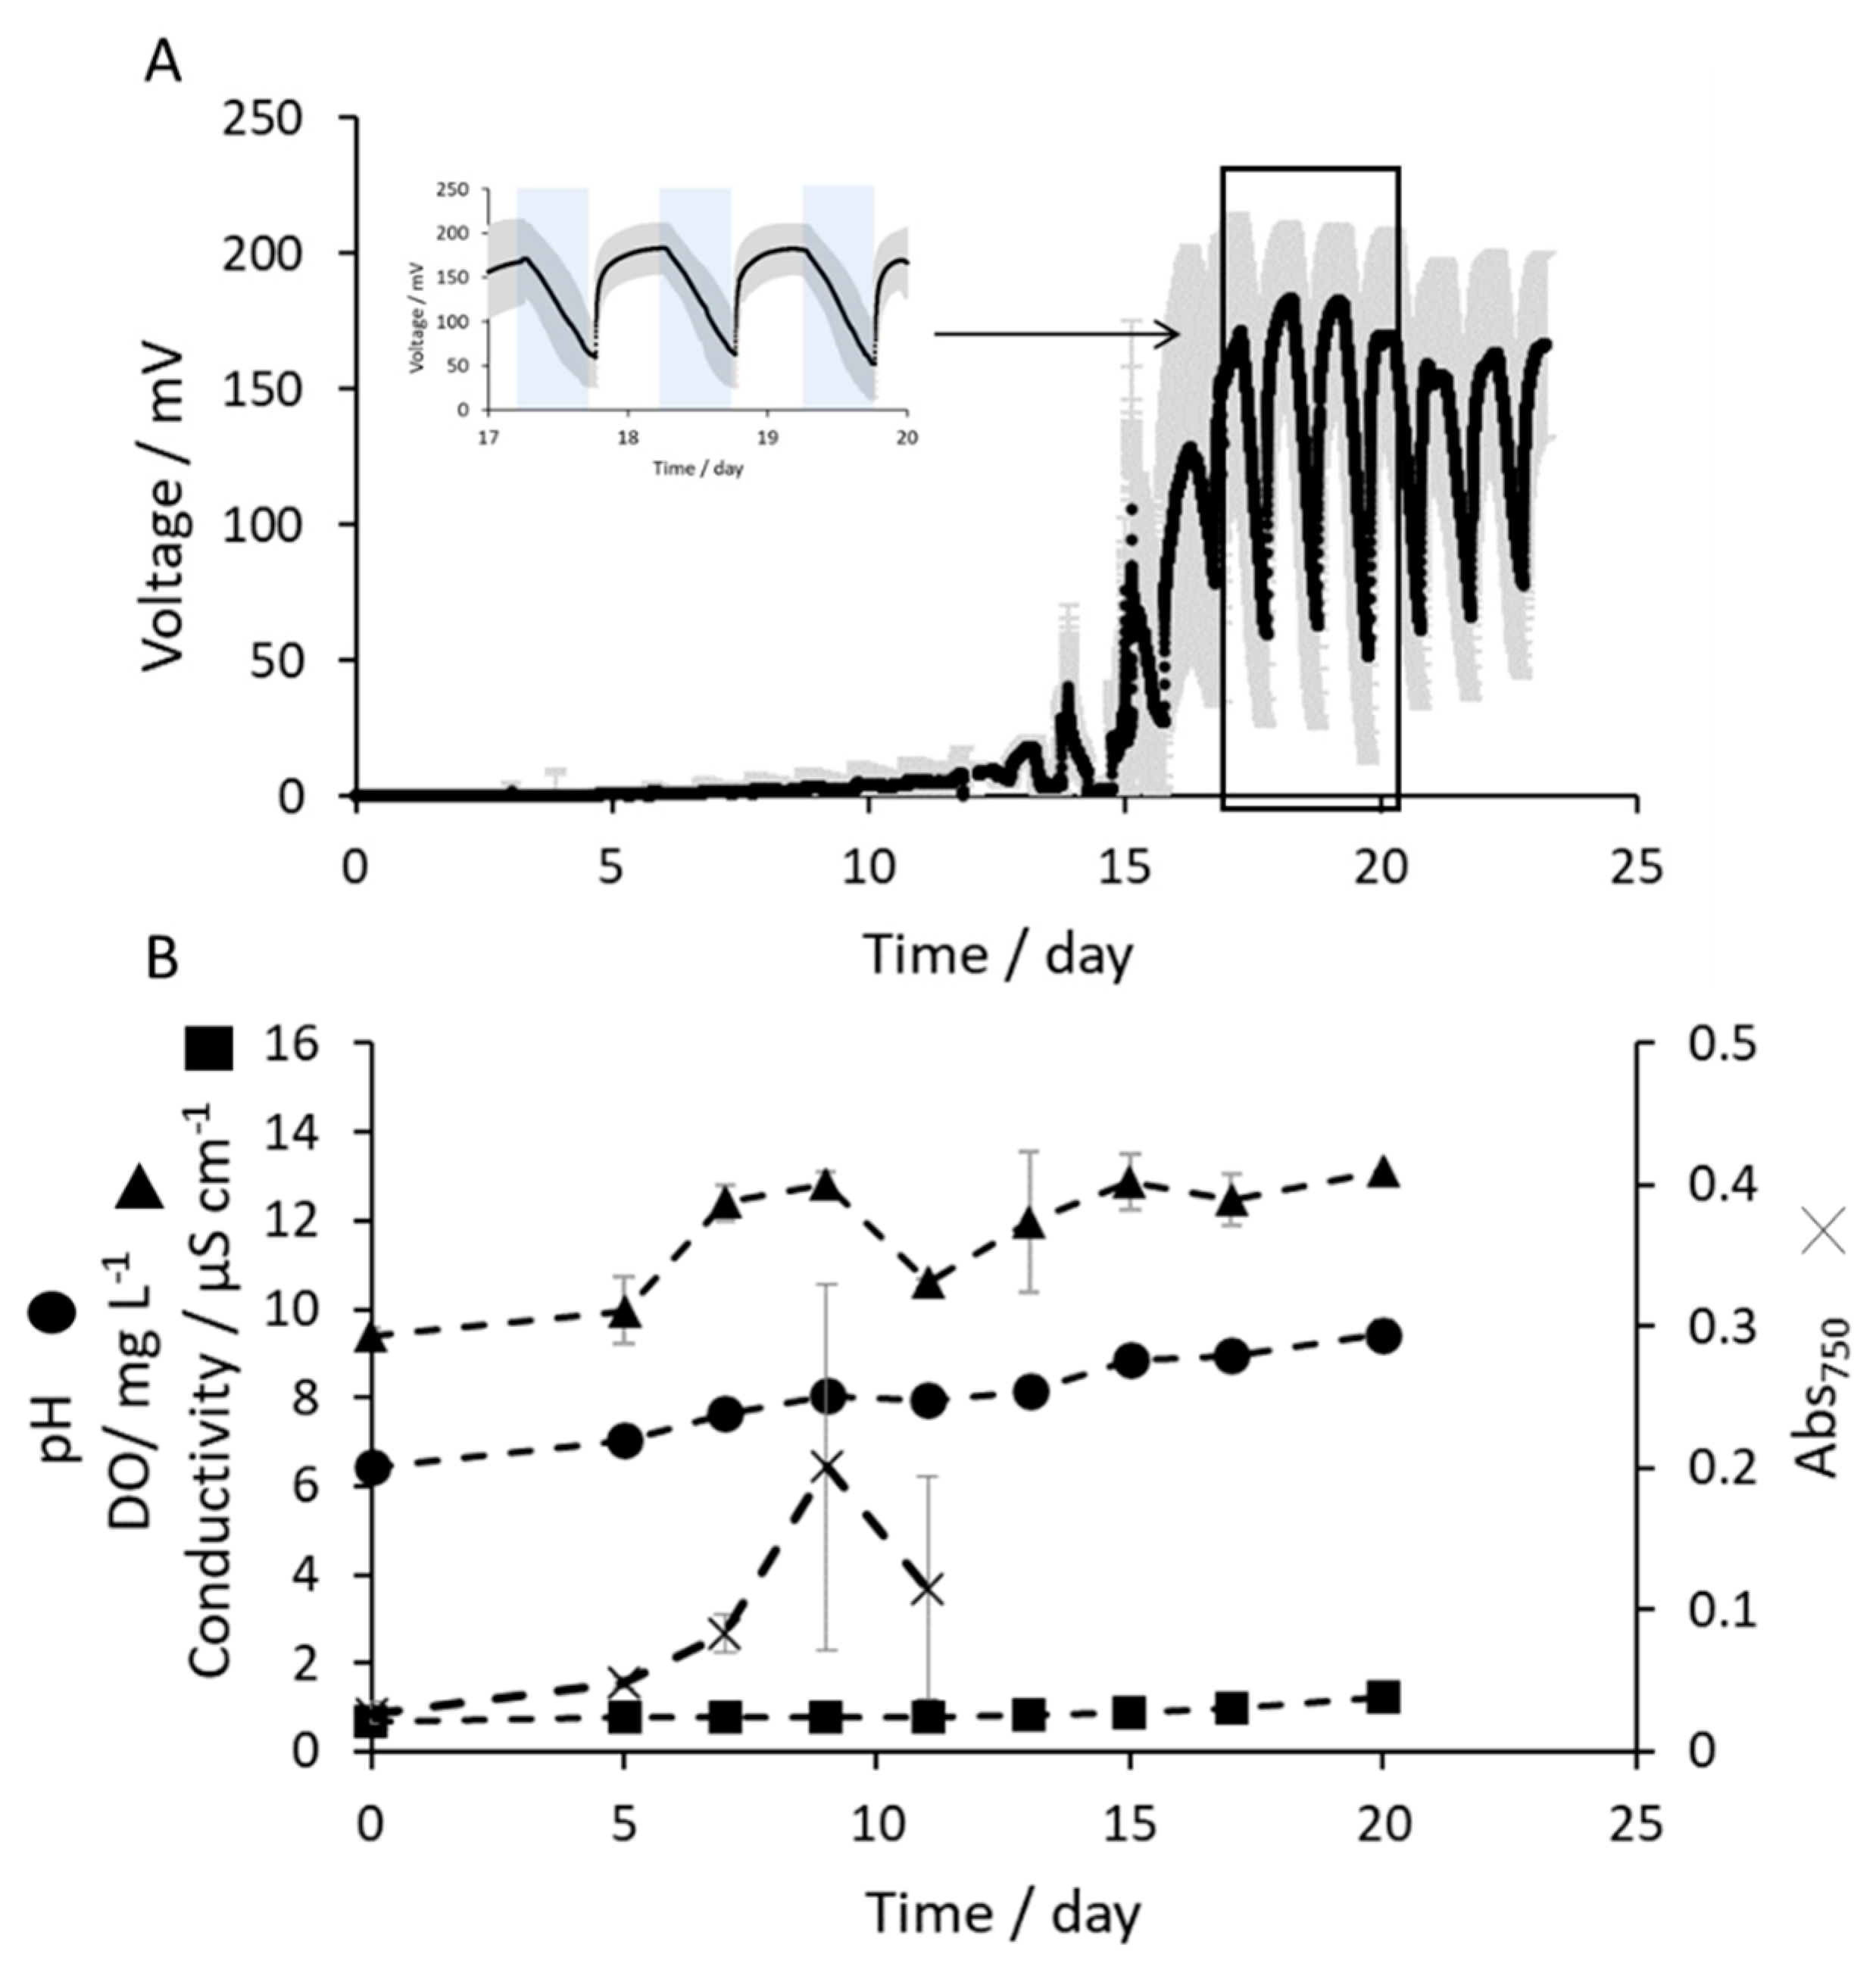
3.1. Enrichment and Operation of CSMFC as DO Sensor in Eutrophic Waters

Figure 2A shows the enrichment (microorganisms colonise the electrodes and form electroactive biofilms) of the CSMFCs. The lag period, during which an output current is not yet detectable, extends up to 10 days, which is longer than reported in other types of MFCs with algal cathodes [14,15,16,17]. This delay could be a consequence of oxygen crossover from the catholyte into the anode chamber that impedes the growth of strict anaerobic electroactive bacteria [18]. Oxygen crossover is indeed an issue in algal assisted sediment MFCs where current is inversely proportional to DO and algal concentration due to the negative effect of oxygen on the coulombic efficiency [16,19]. Figure 2B shows that DO and voltage are positively correlated, suggesting that the performance of the anode is not compromised. Despite the proximity of the electrodes (electrode distance: 3 cm), oxygen crossover is reduced in the CSMFC by the higher organic content of soil. The soil promotes microbial activity and oxygen uptake, thus preventing diffusion of oxygen towards the anode. The soil is also saturated with water, which further limit oxygen diffusion in the anode chamber, enhancing anaerobic conditions at the anode. In addition, the higher area of the anode with respect to the cathode ensures that the cathode limits the signal output, which is therefore independent fromthe anode potential [7,20].
From day 10, the output current follows the typical photosynthetic cycle, with current increasing during the day and decreasing in the night (inset in Figure 2A), as shown in previous studies [15,21]. The steady state is reached after 17 days, with a maximum day voltage of 182.8 ± 27.8 mV (0.18 ± 0.2 mA) and a minimum night voltage of 60.0 ± 34.2 mV (0.06 ± 0.34 mA). The day/night cycle is not observed in CSMFCs enriched in the absence of algae, which suggests that, in the experimental conditions, oxygen reduction is the rate-limiting reaction (data not shown) and dominates the sensor signal.
The pH of the catholyte increases over time (Figure 2B), possibly due to both production of hydroxyl ions and carbonate depletion in the electrolyte. The energy gain in the ORR in basic media is lower than acid media [22], hence the power output of the CSMFC is lower than reported elsewhere on buffered algal-assisted cathodes, operated at neutral pH. Buffer control is nonetheless not practical for real applications [23]. Consequently, the catholyte pH shifts to alkaline enhancing the peroxide pathway, reducing the sensitivity of the sensor to DO [24]. Additionally, the production of reactive oxygen species induce stress on algal metabolism, which could trigger an unwanted metabolic response [25]. Alkaline conditions are often inevitable in eutrophic waters [21] and should be taken into consideration in the evaluating the sensor performance.
The slow increase in conductivity, observed in Figure 2B, is probably due to crossover of ions from the soil to the catholyte. The high conductivity of soil improves migration of ions, particularly relevant in freshwater environments. Algal growth could not be assessed after day 11 days due to clumping and aggregation of algae in the catholyte.
Figure 3 shows that indeed current cycle corresponds to DO variations with a correlation factor of R2 = 0.66 over a time span of 10 hours (R2 = 0.85 in night period and R2 = 0.5 during the day period). The correlation factor is lower than reported in a SMFC sensor monitoring DO in tap water [7]. Possibly, the high DO in the day, up to 13 mg L−1, improves both oxygen crossover and the reaction rate, turning the anode into the limiting electrode.
The correlation coefficient is likely to differ in field applications. Algal activity varies throughout the year caused by changes on light intensity, temperature, and nutrient availability, which affect the photosynthetic activity of algae and the produced oxygen [26].

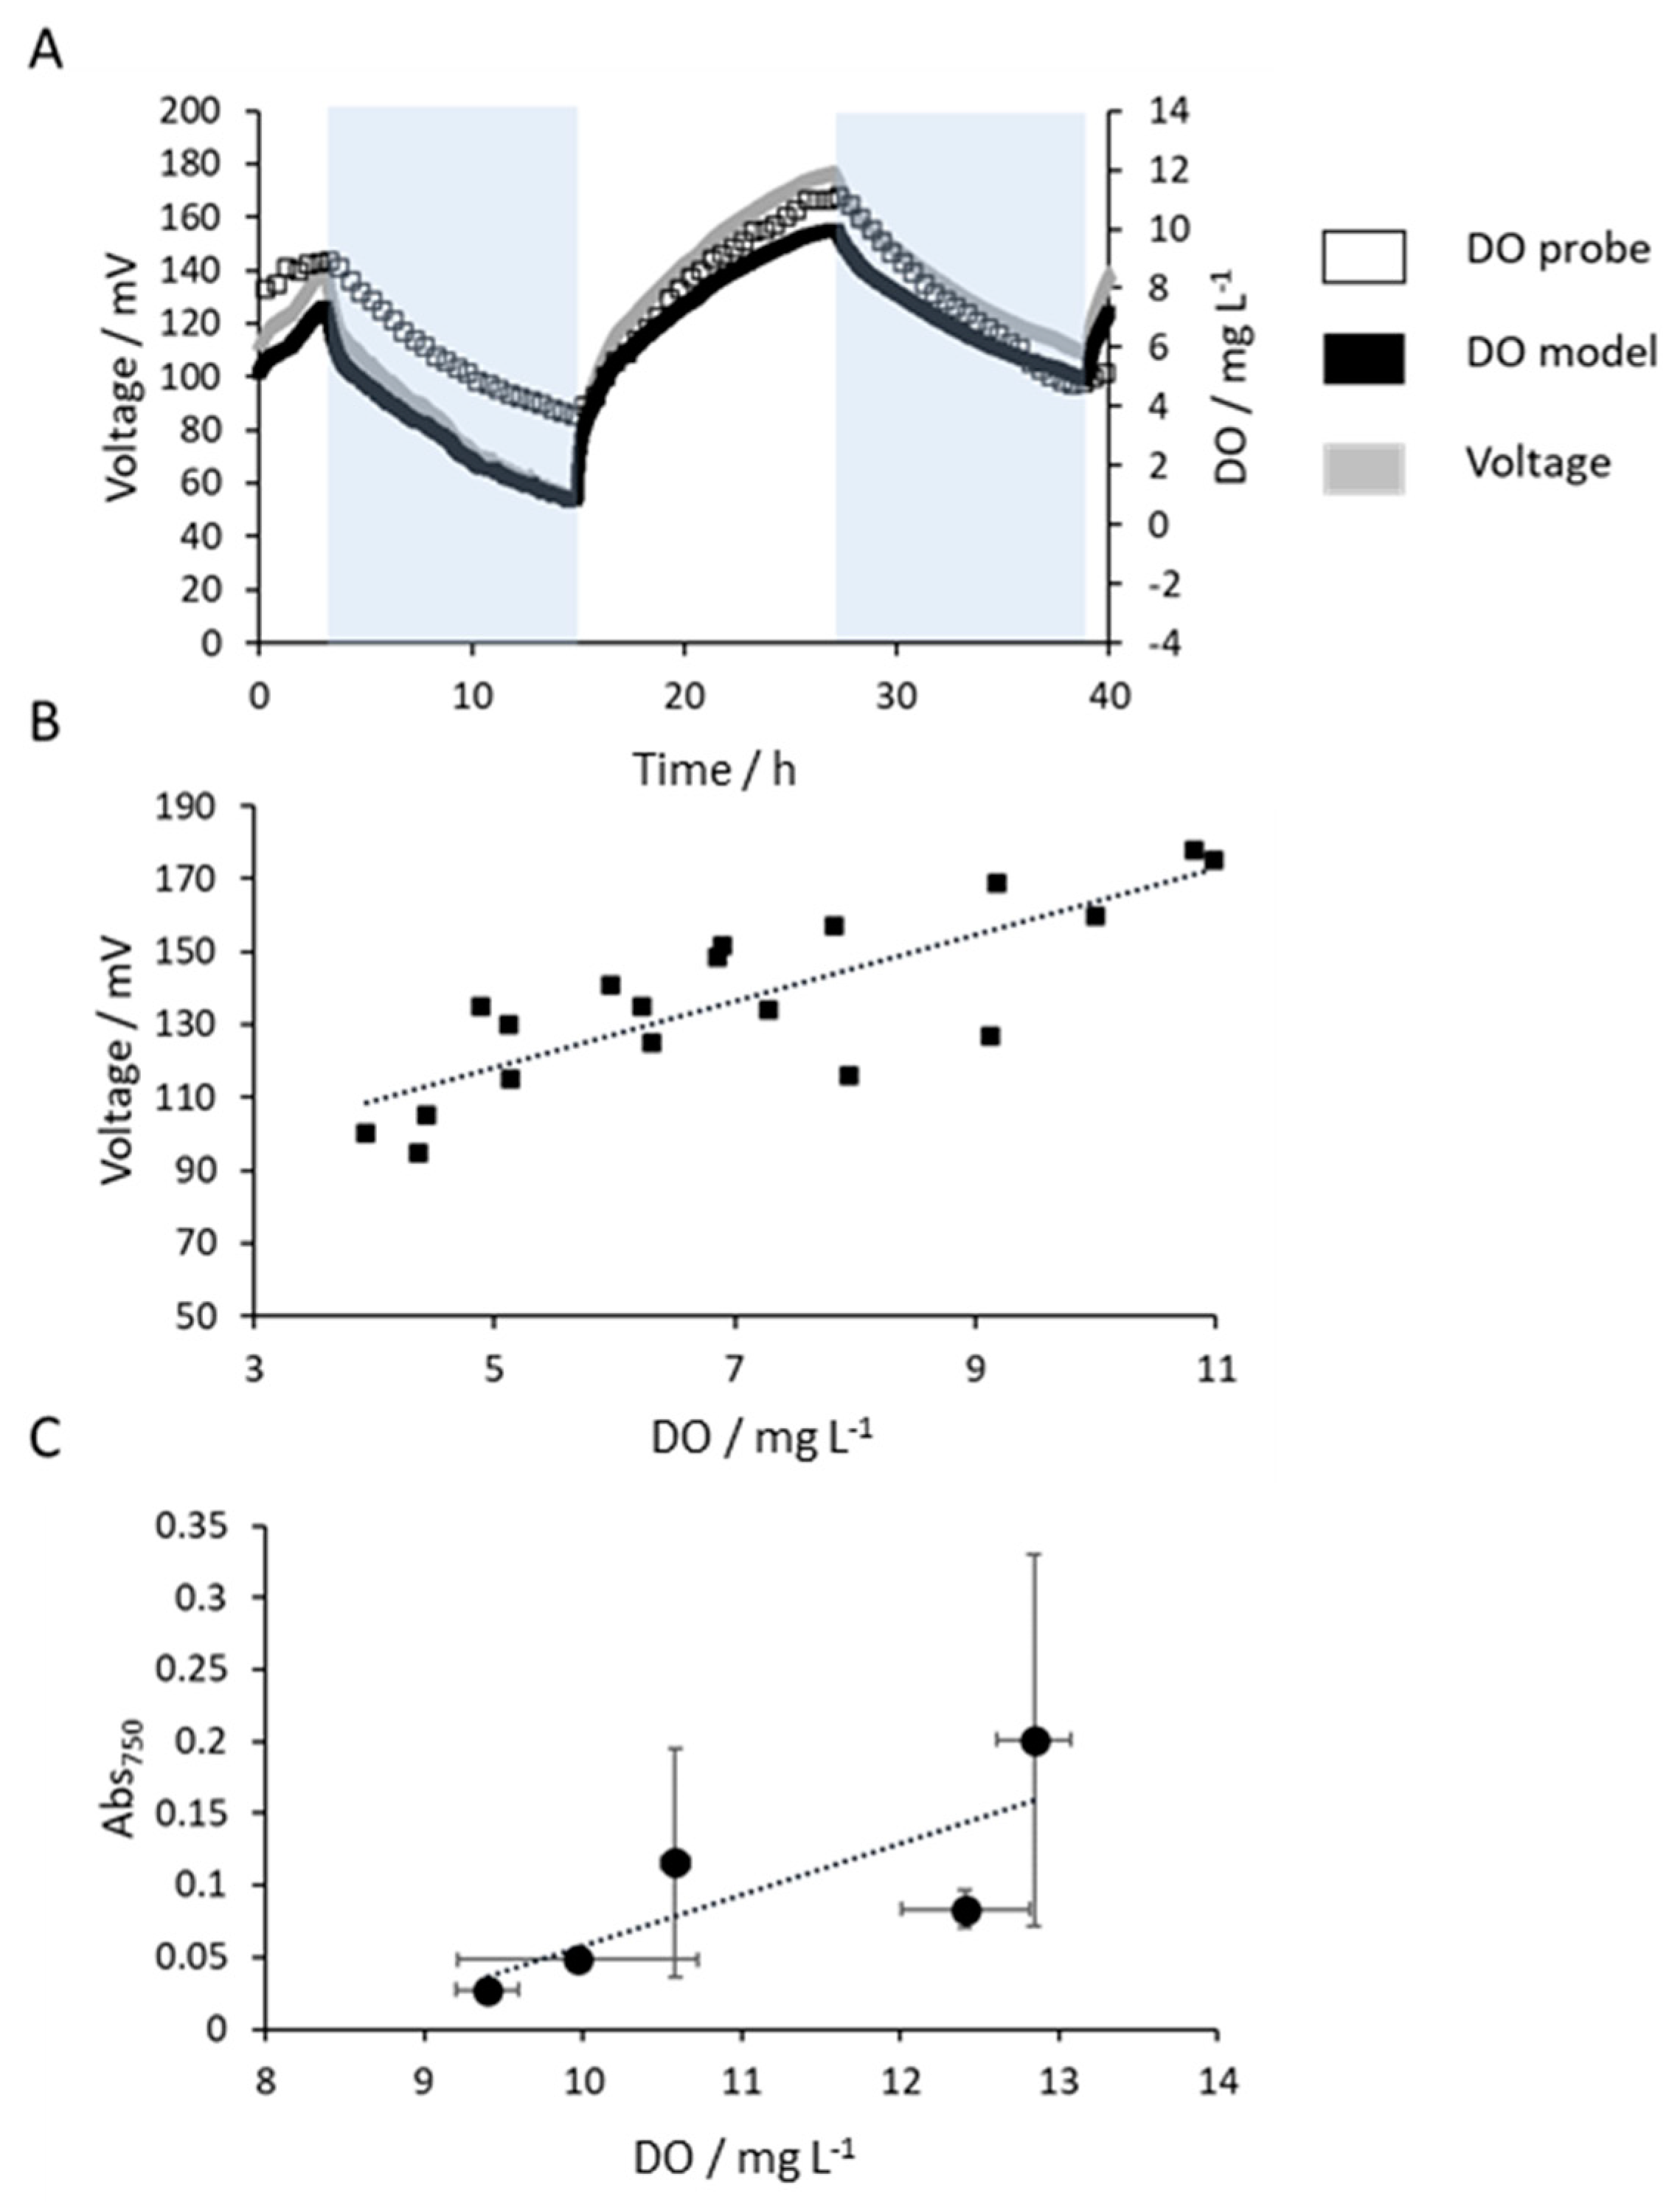
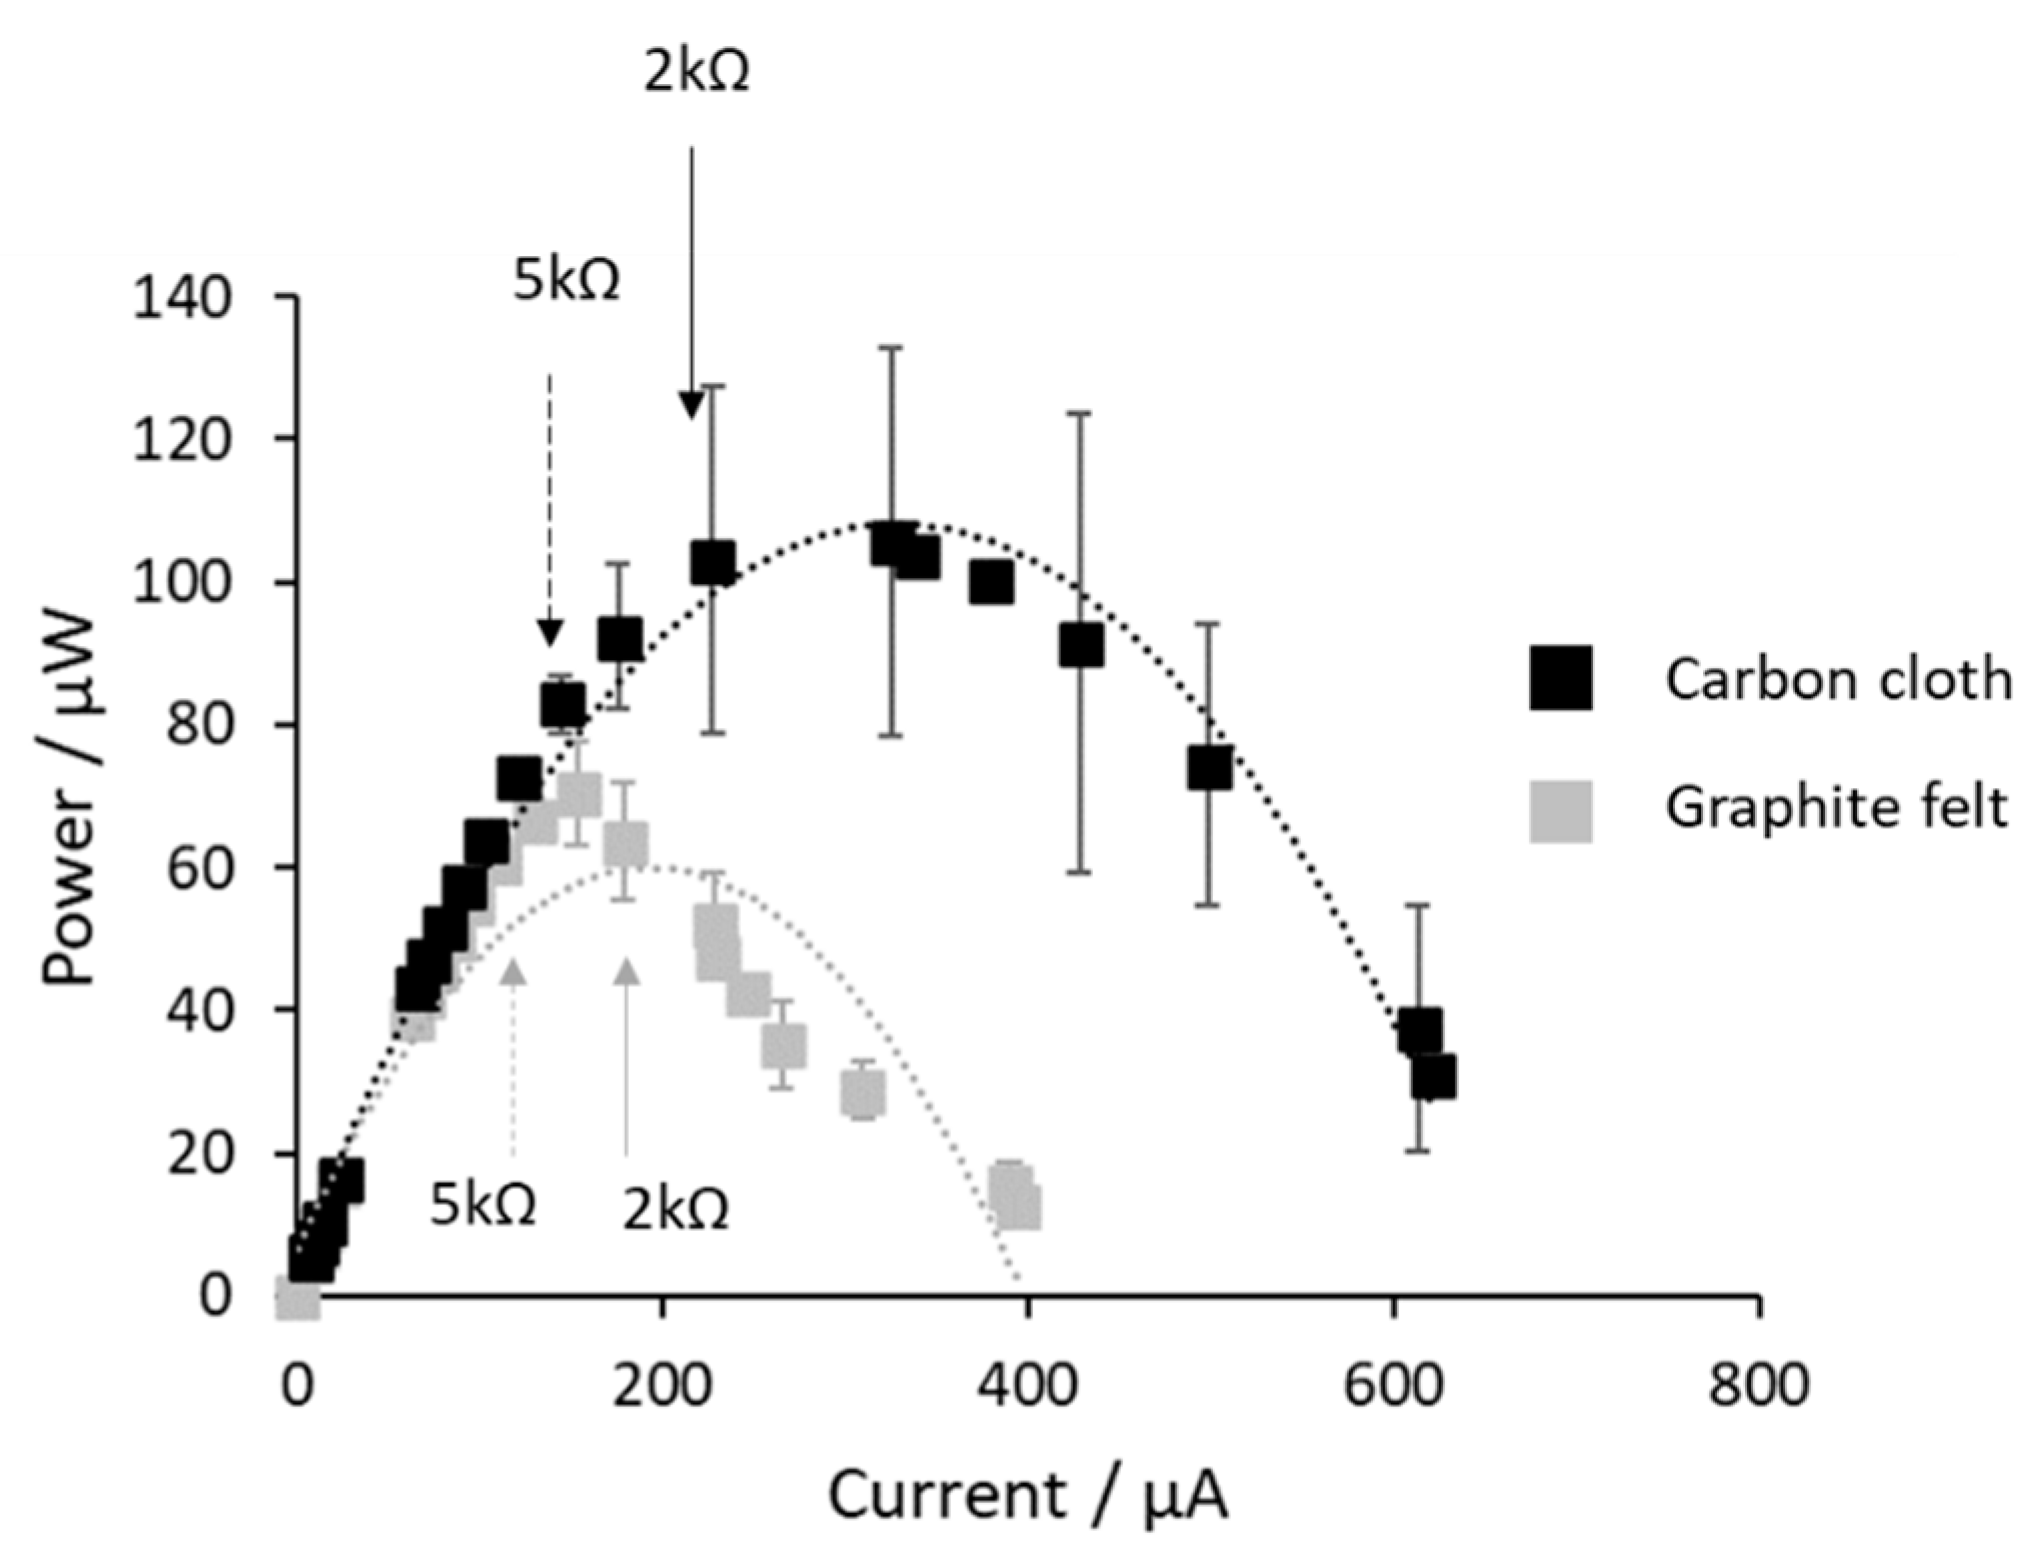
3.2. Calibration of the CSMFC Sensor

The CSMFC voltage output could help in assessing the degree of eutrophication based on algal concentration (given by the R2 = 0.63 of Abs750 and DO, Figure 3C). A general calibration model for a CSMFC-based sensor developed in a previous study [7] (Equation (7)) is applied to this specific case by multiplying the model coefficients to the baseline voltage output at DO = 5.5 mg L−1. Interpolation of the curve in Figure 3 gives a baseline of around 130 mV, leading to Equation (8).
D O C S M F C = y n 1.07 0.18 * T 0.6 + 0.28 * T
D O A l g a l   C S M F C = y 139.1 23.4 * T 78 + 36.4 * T
where y_n is the signal voltage output normalised by the baseline, y is the absolute signal output, in mV, T and DO are temperature and dissolved oxygen in coded values.
The RMSE, defined as the root square of the quadratic sum of distances from each point to the mean [7], is 1.98 mg L−1, which is a low accuracy in comparison with commercial electrochemical sensors (±0.2 mg L−1 or 2% of reading [27]). Nonetheless, it allows to capture the distinctive photosynthetic pattern of eutrophic events. Moreover, the signal response to changes in DO is instantaneous, which is an essential requirement for early detection devices.
Based on these results, the voltage output generated by the CSMFC is correlated with the presence of algae in water. The CSMFC sensor could therefore be used as early warning system for eutrophic events.
However, the lower correlation coefficient obtained in the SCMFC model, operated in algal solution in comparison with tap water, could be caused by an overlooked factor in the algal system. The variability caused by factors not included in the study is attributed to error in the model, which is also higher than in the previous study. It may be possible that nitrates compete as electron acceptor, weakening the correlation between oxygen and the signal output.

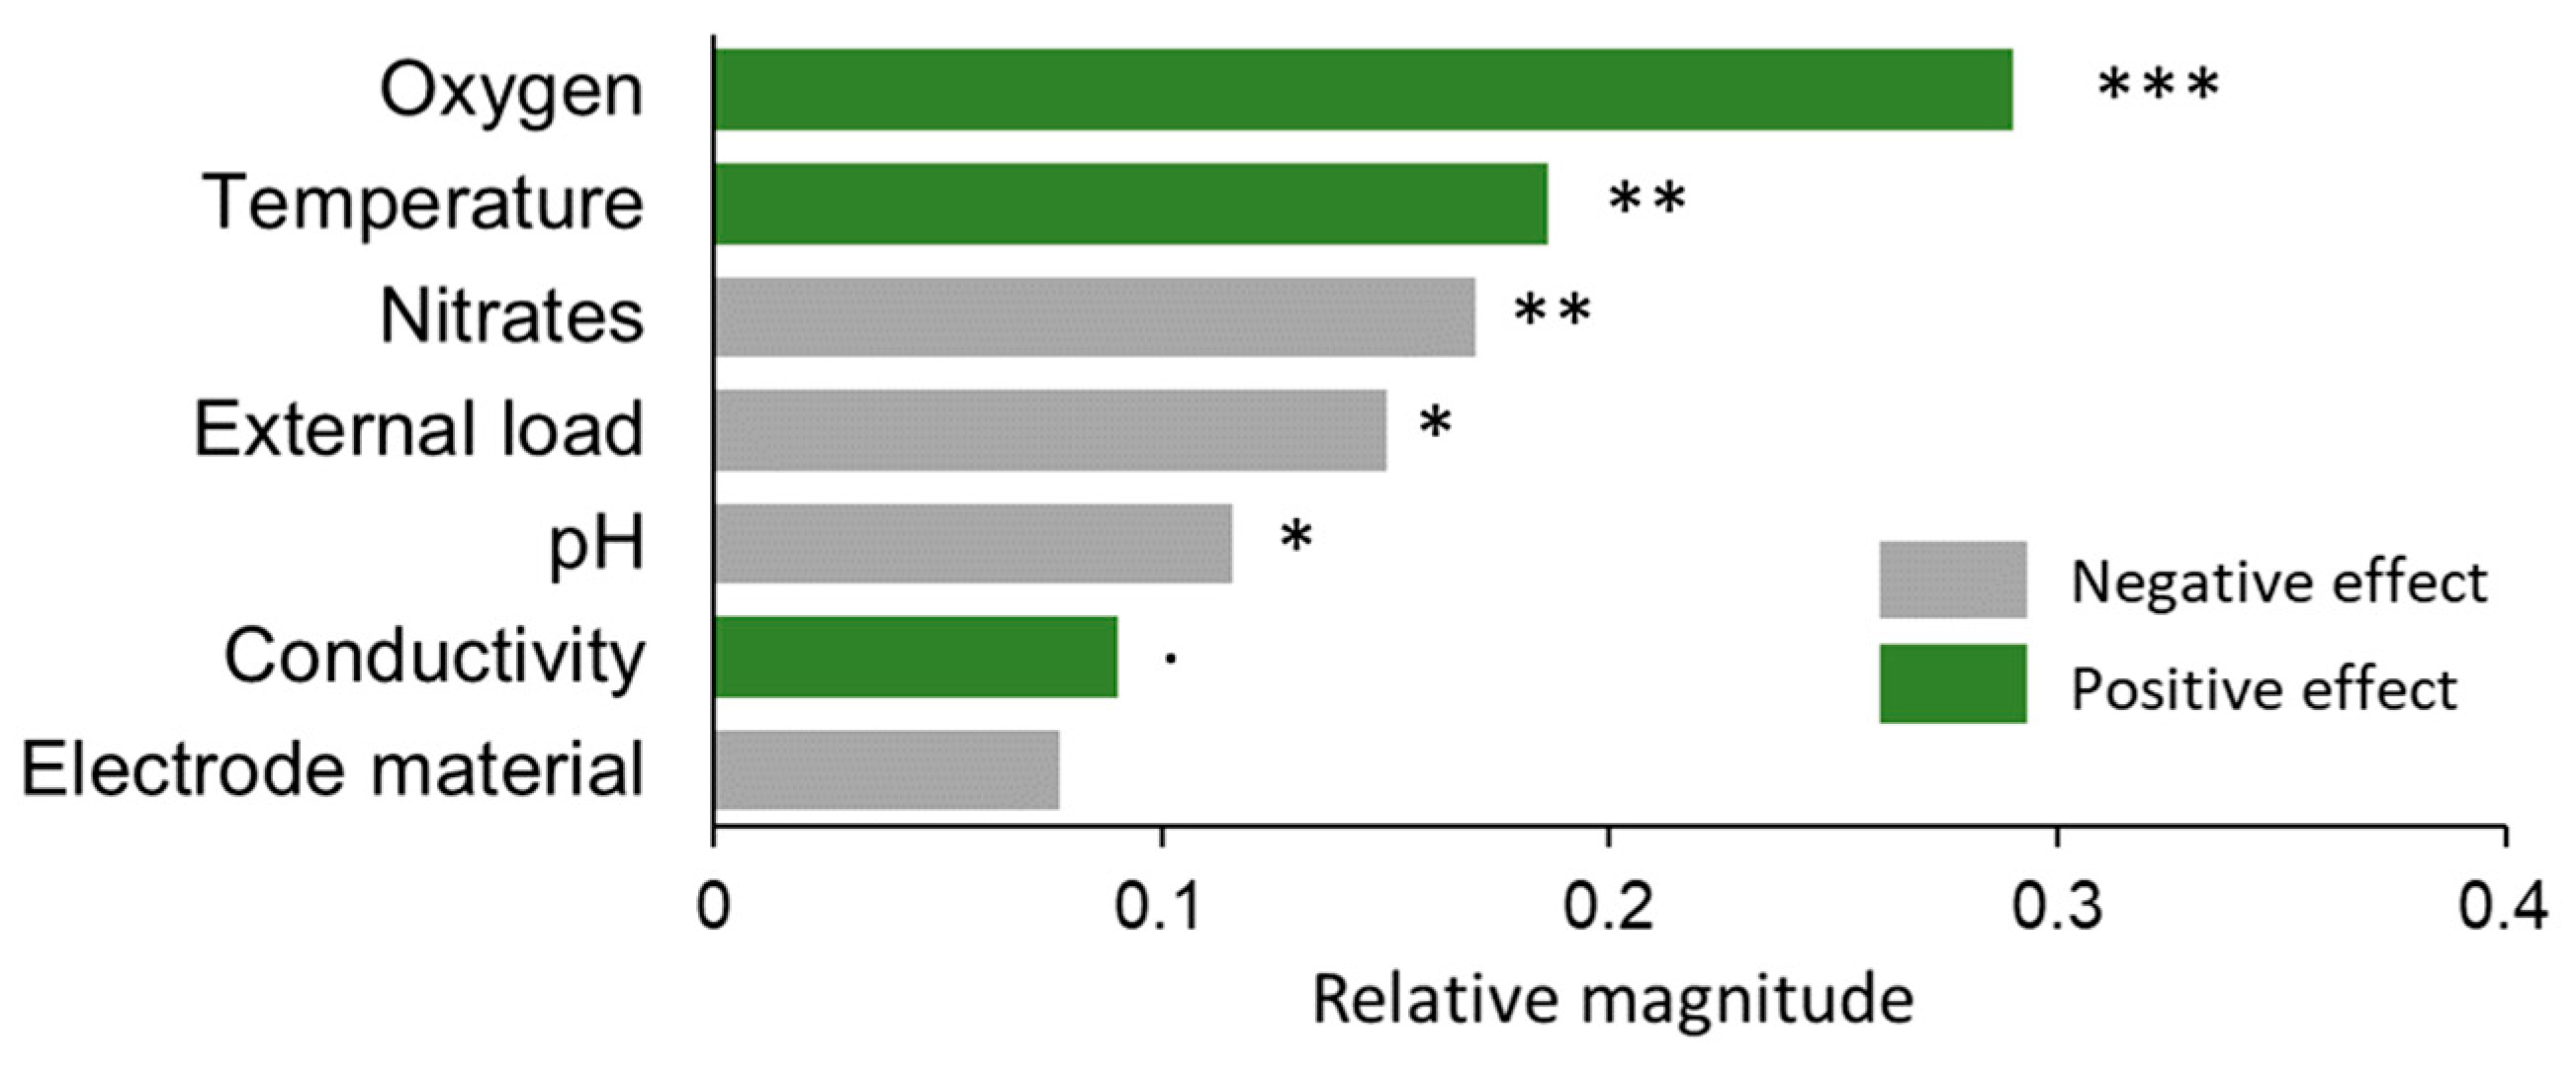
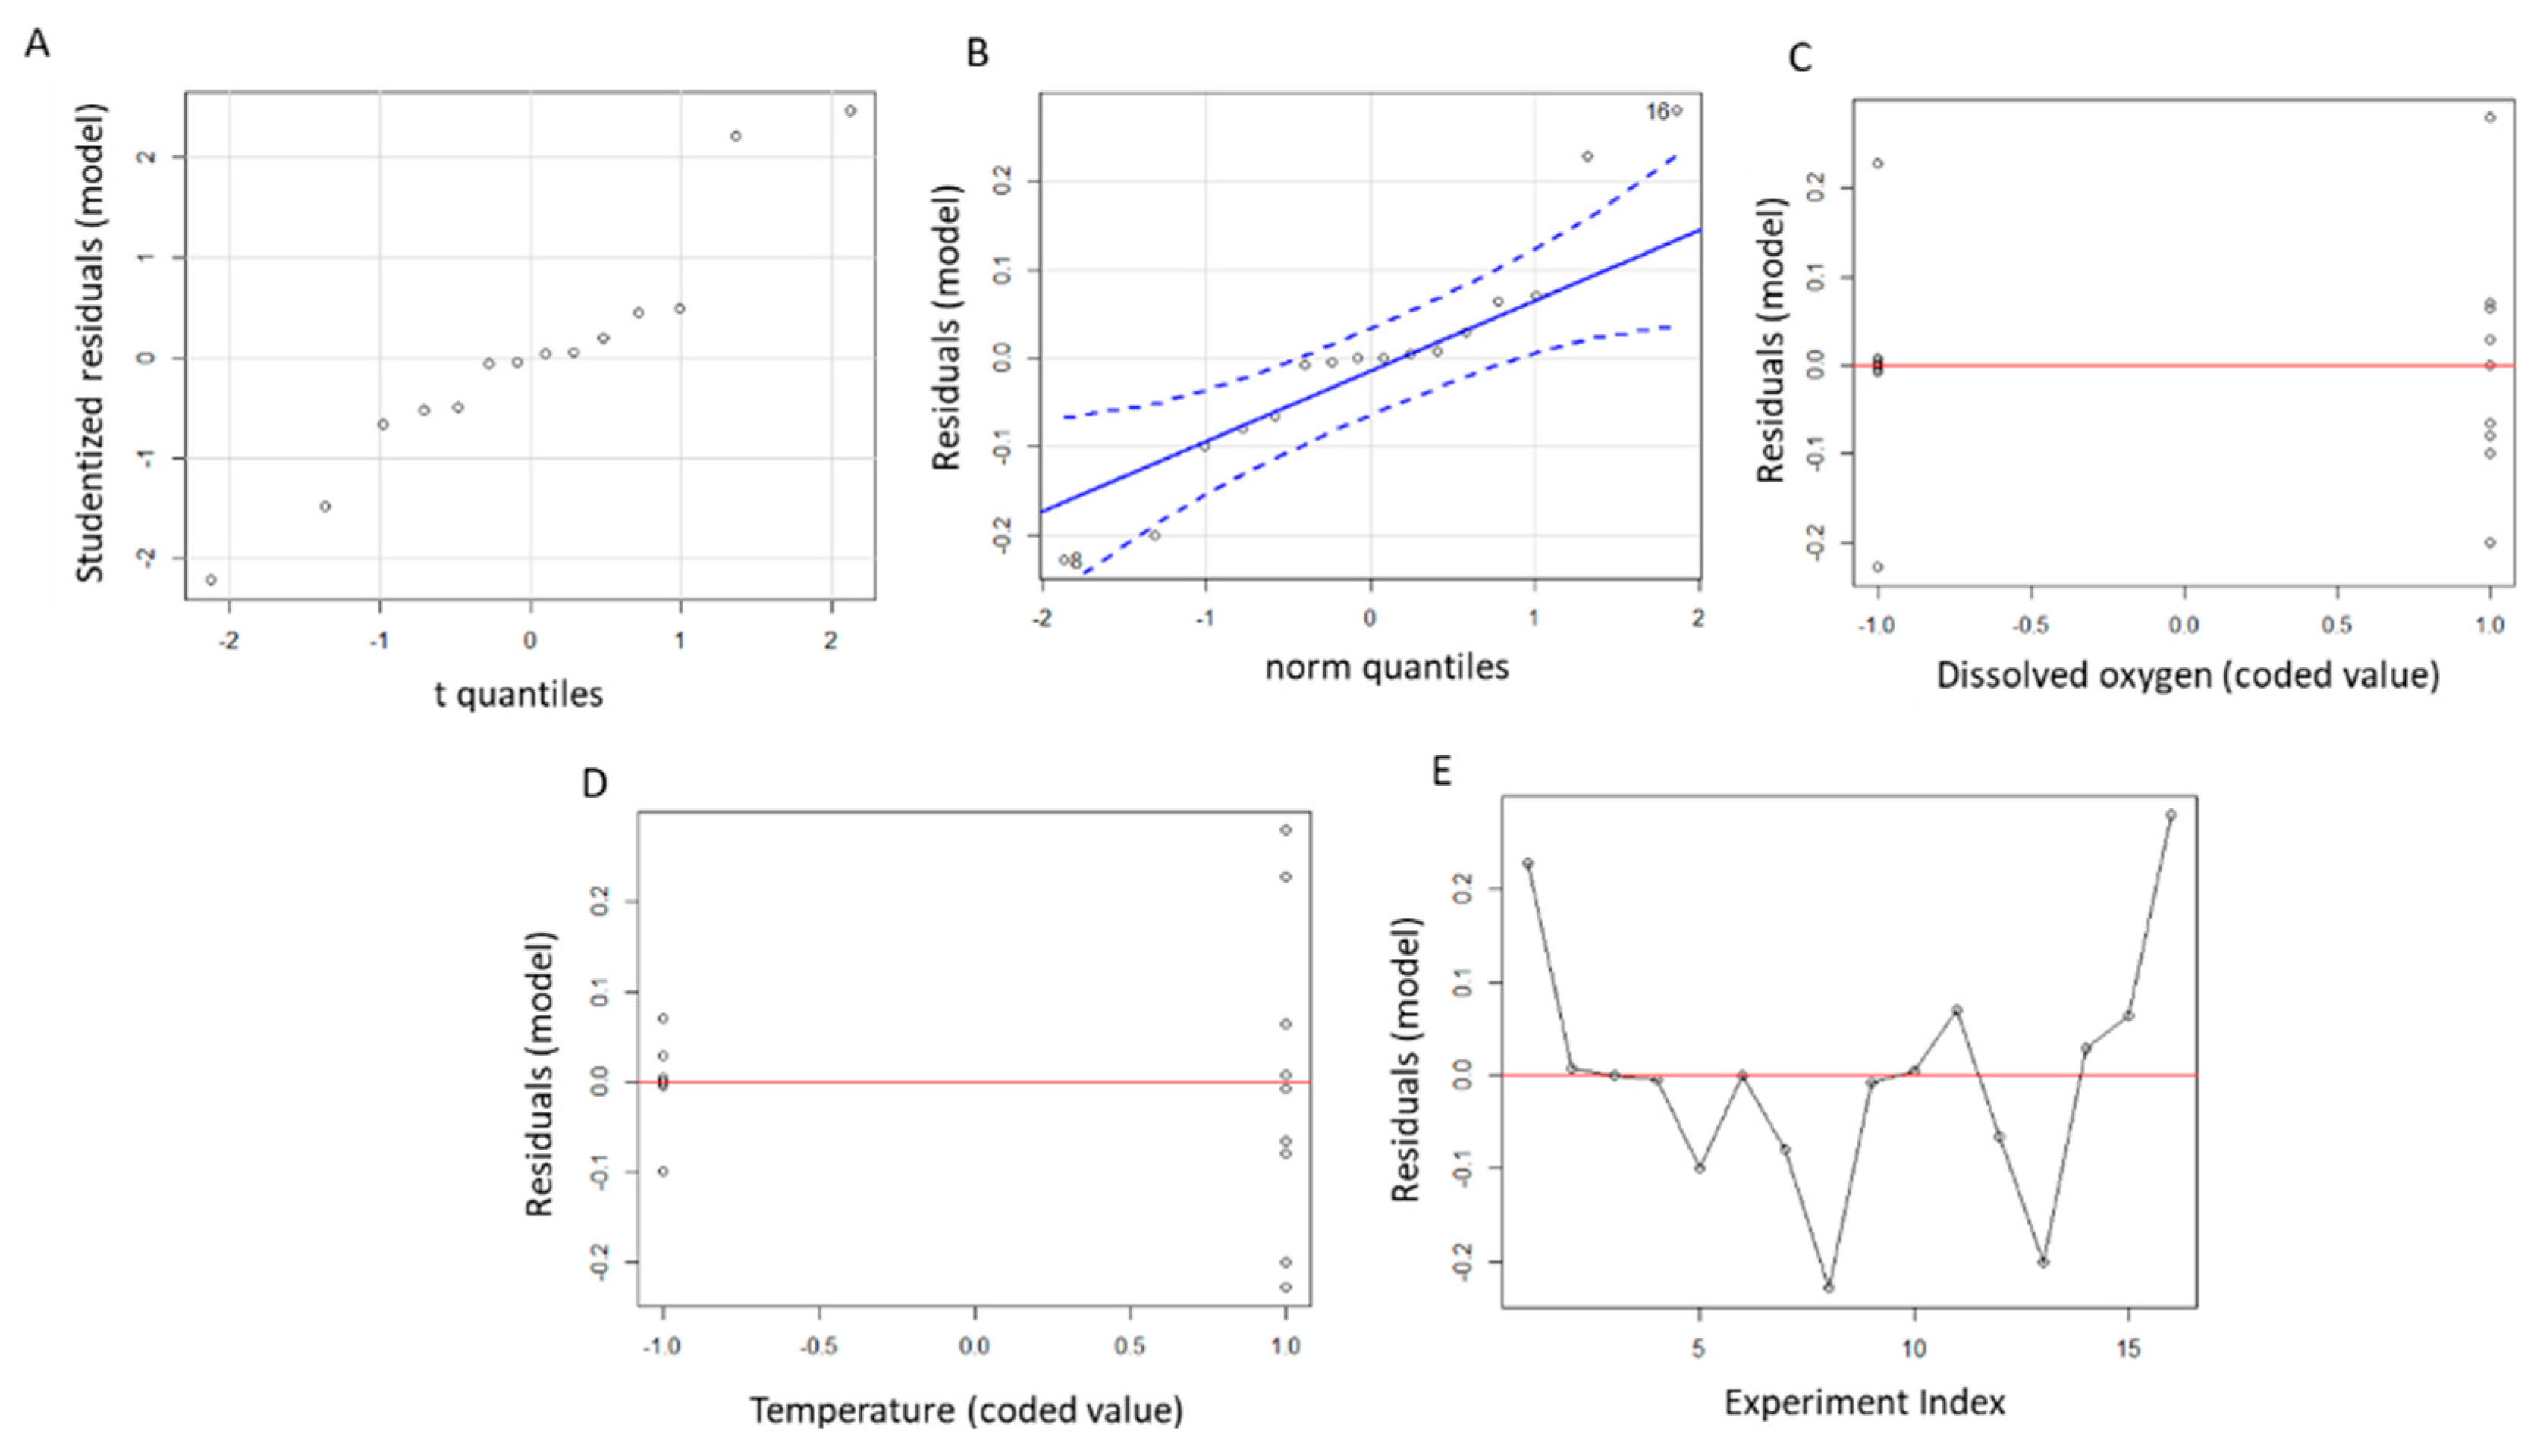
3.3. Evaluation of Relevant Factors on CSMFC Performance

An RIII saturated factorial DoE on temperature (T), dissolved oxygen (DO), nitrates (NO3), conductivity (C), pH, external resistance (Rext) and material (M) was performed according to Table 1 and Table 2.
The Pareto Plot in Figure 4 is a representation of the relative importance of the factors [9]. Dissolved oxygen, temperature and nitrates are the most influential and statistically significant factors. High values of DO improve the reaction rate of oxygen reduction, whereas temperature enhances both kinetics and microbial activity, suggesting that DO mainly affects the cathodic performance, and anodic activity is governed by temperature [28]. Increasing pH from 5 to 9 shifts the cathodic reaction to hydroxyl ions and hydrogen peroxide production, decreasing the magnitude of the signal [22]. Increasing conductivity has a positive impact, probably because of the reduced ohmic resistance, which is important in the system, as concluded from the symmetrical semicircle obtained in the power curves in Figure 4 [29].
Regarding the design factors, an external resistance of 2 kΩ generates a larger signal than 5 kΩ, relative to their respective baseline. The comparison of absolute values would mislead the interpretation of the results because, according to Ohm’s law, the signal increases with Rext and therefore will always be higher at higher Rext. Any trend caused by the factors under study would be within the signal variance. These trends can be detected by reducing the magnitude of the signal in steady state conditions. Normalising the signal by its baseline narrows the output range from 0 to 1 and enhances the sensitivity of the sensor [30].
The effect of the electrode material in the signal output is relatively low. Yet, the higher voltage output of CSMFC-CC over CSMFC-GF suggest that the former has better energy efficiency. This result is not statistically significant but is in agreement with the maximum power output and internal resistance trends obtained by polarisation, with maximum power of 103.6 ± 27.2 µW in CSMFC-CC and 70.5 ± 3.1 µW in CSMFC-GF, and ohmic resistances of 1150 Ω and 1970 Ω, respectively (Figure 5). The power production in CSMFC is similar to other ceramic [31] and membrane-less sediment MFC [24,32] in freshwater, but lower than in seawater [33], further indicating that ohmic limitations are important in the system. Despite having different exposed electrode areas, similar values would be expected with both materials, as the specific surface area is larger for graphite felt (22,100–22,700 m−1 [34]) than carbon cloth (675 m−2 [35]). The porosity of graphite felt could have facilitated bacterial attachment that would block the electrode active sites and consume oxygen.
Comparing the DO coefficient of 0.26 in this study to the DO coefficient in a similar study without nitrates, of 0.46 [7], it can be seen that the difference in values correspond to the nitrates’ coefficient determined in this study, suggesting that nitrates are a competing oxidant for the cathodic reduction [12]. The effect of nitrates is negative because nitrate reduction produces lower current than oxygen reduction. This is because the redox potential of nitrate is lower than oxygen, in the same conditions [36]. Nitrate reduction would increase the current if the system was operated in anaerobic conditions. The relative effect of nitrates has implications for the CSMFC signal operating in the dark, when the oxygen level is <2 mg L−1 (Figure 3A), which weakens the correlation of the signal voltage with DO.
The significance of the factor coefficients indicates that the calibration of the CSMFC for eutrophic environments should, at least, include terms for DO, temperature and nitrates.
Equation (10) shows the complete least squares model resulting from the RIII DoE analysis (R2adj = 0.86). The independent term, or intercept, corresponds to the centre point, calculated at the mid values of the factor ranges (level zero). Normalising the sensor response by the baseline values means that the intercept should be close to the unity, which is, indeed, 1.07.
y = 1.07 + 0.29 D O + 0.19 T 0.15 R e x t 0.17 N O 3 + 0.1 T D O 0.07 T R e x t 0.11 T N O 3
The agreement of the model coefficient with previous designs and theoretical trends suggest that the DoE results in this study are robust. In addition, the assumptions of the model are not heavily violated, except for the constant variance. The model should not be used as a prediction tool but provides meaningful information on the system (Figure 6C,D).

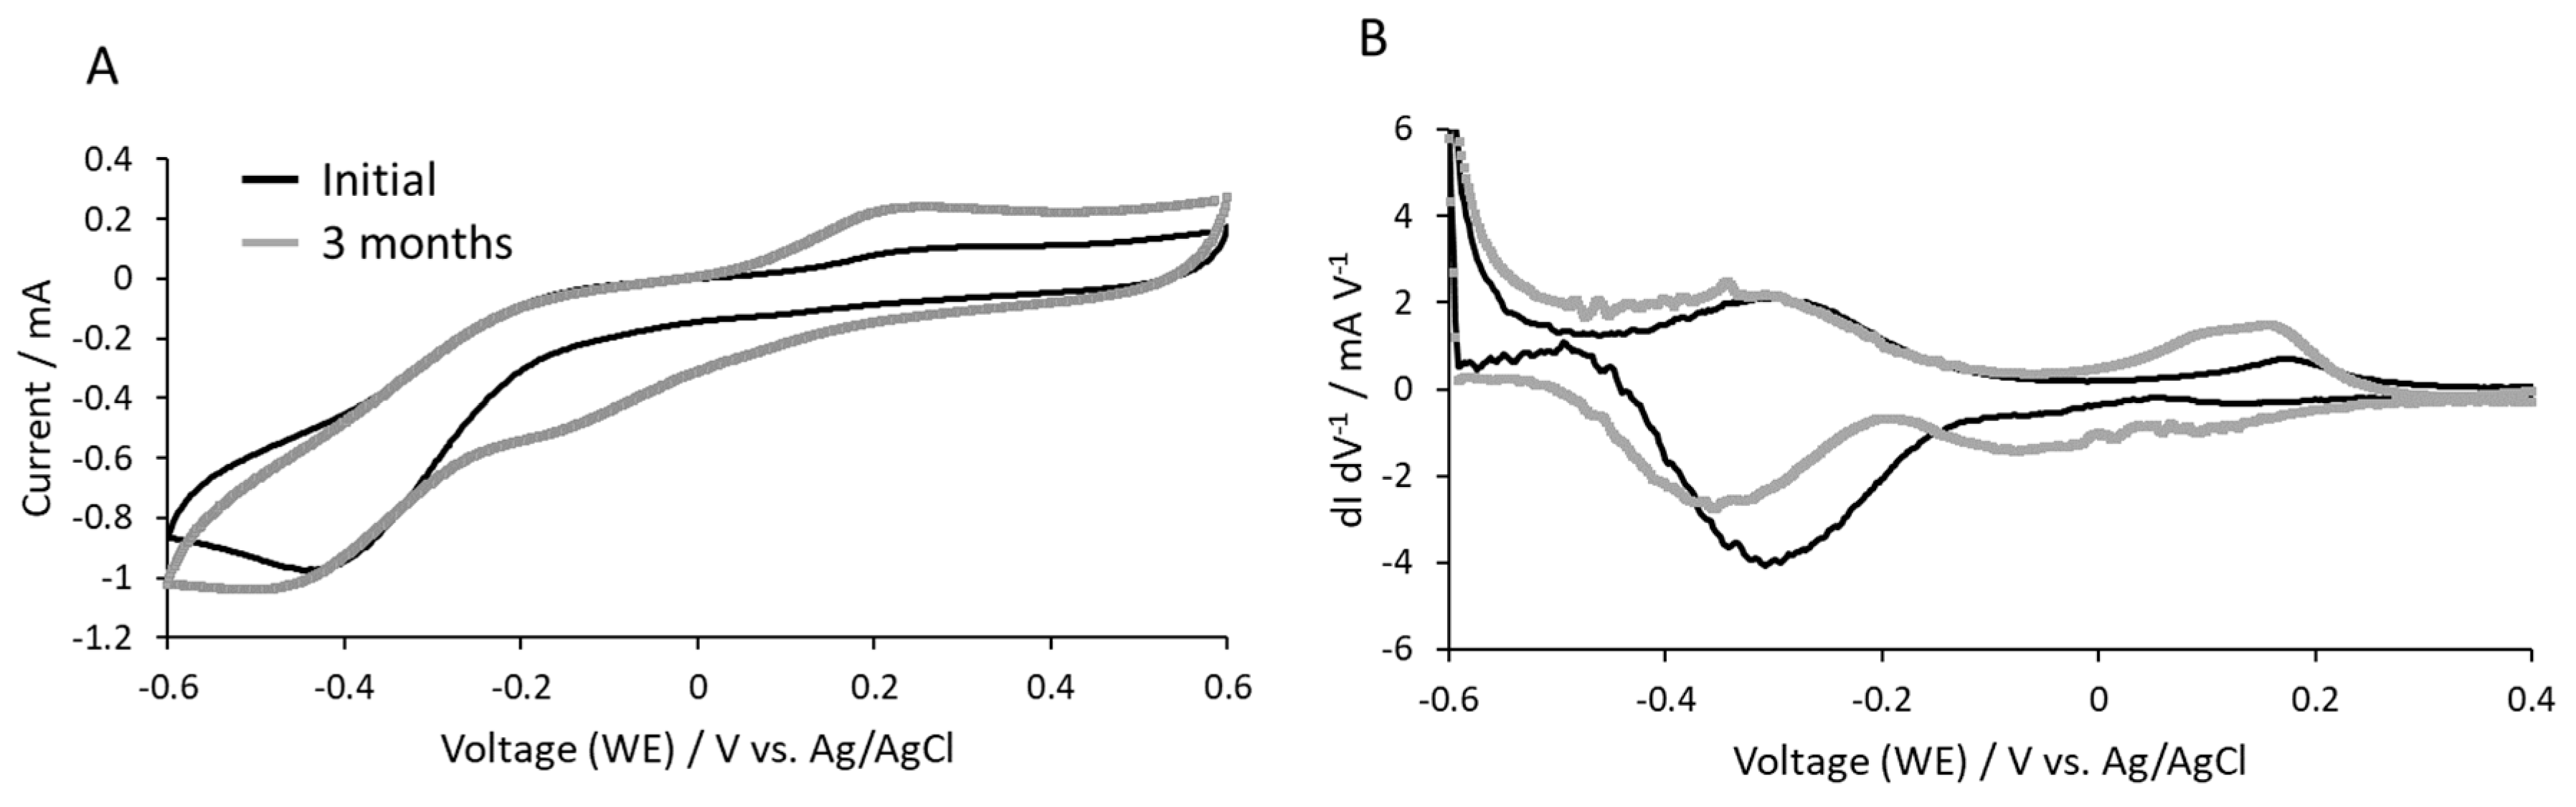
3.4. Cyclic Voltammetry

The electrochemical performance of the cathode electrodes in algal solution was evaluated after three months of operation (Figure 7), to detect any influence of the biofilm in the reaction. A stable onset potential of −0.2 V over time suggests stability of cathodic. The capacitance, on the other hand, increases, probably because of the growth of non-electrogenic species onto the electrode, or adsorption of dissolved species on the electrode surface [37]. A redox couple is observed in the initial voltammogram and develops over time with a formal potential of around 0.2 V vs. Ag/AgCl (pH = 7). This activity could be related to redox compounds in BBM, endogenous redox mediators excreted by the biofilm [38], or soil components like humic acids [39]). In both cases, the limiting current, around 1 mA, is obtained at −0.4 V vs. Ag/AgCl, when the rate of oxygen reduction exceeds the rate of oxygen diffusion to the cathode. This suggests that the biofilm is not providing oxygen or increasing diffusion limitations at the electrode.

4. Conclusions

Eutrophication of environmental waters can seriously compromise ecosystems and could be greatly reduced with early detection of algal blooms. The ceramic soil microbial fuel cell sensor presented in this study could provide a real-time, in situ and early detection of eutrophic events. The sensor signal correlates with dissolved oxygen in water. The development of a cyclic day/night signal, with voltage increasing in the day and decreasing in the night, is a straightforward indication of algal activity. Nitrates, oxygen and temperature are the most relevant variables affecting the signal output whereas optimal resistances improve the sensitivity of the sensor to changes in DO. Biofouling or electrode degradation over three months is not significant, which suggests long-term stability. This work, therefore, sets the ground for unattended, real-time, continuous monitoring of algal blooms via electrochemical oxygen reduction.

Author Contributions

L.G.O.: conceptualization, methodology, investigation, writing—original draft preparation. A.R.O.: investigation. M.D.L.: supervision, project administration, funding acquisition, writing—review. All authors have read and agreed to the published version of the manuscript.

Funding

This work was supported by the UK Engineering and Physical Sciences Research Council (EP/L016214/1) and the Society of Spanish Researchers in the United Kingdom (SRUK).

Conflicts of Interest

The authors declare no conflict of interest.

References

  1. EEA. Nutrient Enrichment and Eutrophication in Europe’s Seas; EEA: Copenhagen, Denmark, 2019. [Google Scholar]
  2. Lürling, M.; Mucci, M. Mitigating eutrophication nuisance: In-lake measures are becoming inevitable in eutrophic waters in the Netherlands. Hydrobiologia 2020, 847, 4447–4467. [Google Scholar] [CrossRef]
  3. NOWPAP. Eutrophication Monitoring Guidelines by Remote Sensing for the NOWPAP Region; CEARAC Rep. UNEP Reg. Sea p. 62s; NOWPAP: Toyama, Japan, 2007. [Google Scholar]
  4. Dai, Z.; Xu, Z.; Wang, T.; Fan, Y.; Liu, Y.; Yu, R.; Zhu, G.; Lu, X.; Li, B. In-situ oil presence sensor using simple-structured upward open-channel microbial fuel cell (UOC-MFC). Biosens. Bioelectron. X 2019, 1, 100014. [Google Scholar] [CrossRef]
  5. Chouler, J.; di Lorenzo, M. Water quality monitoring in developing countries; Can microbial fuel cells be the answer? Biosensors 2015, 5, 450–470. [Google Scholar] [CrossRef] [PubMed]
  6. Kubota, K.; Watanabe, T.; Maki, H.; Kanaya, G.; Higashi, H.; Syutsubo, K. Operation of sediment microbial fuel cells in Tokyo Bay, an extremely eutrophicated coastal sea. Bioresour. Technol. Rep. 2019, 6, 39–45. [Google Scholar] [CrossRef]
  7. Olias, L.G.; Rodr, A.; Cameron, P.J.; di Lorenzo, M. A soil microbial fuel cell-based biosensor for dissolved oxygen. Electrochim. Acta 2020, 362, 137108. [Google Scholar] [CrossRef]
  8. Dunn, K.G. Process Improvement Using Data. Available online: http://learnche.org/pid (accessed on 21 October 2019).
  9. McCrady, M.H. Standard methods for the examination of water and waste-water. Am. J. Public Health Nations Health 2008, 56, 684–684. [Google Scholar] [CrossRef]
  10. Kakarla, R.; Min, B. Photoautotrophic microalgae Scenedesmus obliquus attached on a cathode as oxygen producers for microbial fuel cell (MFC) operation. Int. J. Hydrogen Energy 2014, 39, 10275–10283. [Google Scholar] [CrossRef]
  11. Martinez, S.M.; di Lorenzo, M. Electricity generation from untreated fresh digestate with a cost-effective array of floating microbial fuel cells. Chem. Eng. Sci. 2019, 198, 108–116. [Google Scholar] [CrossRef]
  12. Zhang, Y.; Angelidaki, I. A simple and rapid method for monitoring dissolved oxygen in water with a submersible microbial fuel cell (SBMFC). Biosens. Bioelectron. 2012, 38, 189–194. [Google Scholar] [CrossRef]
  13. Pasternak, G.; Greenman, J.; Ieropoulos, I. Self-powered, autonomous Biological Oxygen Demand biosensor for online water quality monitoring. Sens. Actuators B Chem. 2017, 244, 815–822. [Google Scholar] [CrossRef]
  14. del Campo, A.G.; Cañizares, P.; Rodrigo, M.A.; Fernández, F.J.; Lobato, J. Microbial fuel cell with an algae-assisted cathode : A preliminary assessment. J. Power Sources 2013, 242, 638–645. [Google Scholar] [CrossRef]
  15. Lobato, J.; del Campo, A.G.; Fernández, F.J.; Cañizares, P.; Rodrigo, M.A. Lagooning microbial fuel cells: A first approach by coupling electricity-producing microorganisms and algae. Appl. Energy 2013, 110, 220–226. [Google Scholar] [CrossRef]
  16. He, Z.; Kan, J.; Mansfeld, F.; Angenent, L.T.; Nealson, K.H. Self-sustained phototrophic microbial fuel cells based on the synergistic cooperation between photosynthetic microorganisms and heterotrophic bacteria. Environ. Sci. Technol. 2009, 43, 1648–1654. [Google Scholar] [CrossRef]
  17. Wu, X.Y.; Song, T.S.; Zhu, X.J.; Wei, P.; Zhou, C.C. Construction and operation of microbial fuel cell with Chlorella vulgaris biocathode for electricity generation. Appl. Biochem. Biotechnol. 2013, 171, 2082–2092. [Google Scholar] [CrossRef] [PubMed]
  18. Yousaf, S.; Anam, M.; Saeed, S.; Ali, N. Environmental Technology Reviews Electricigens: Source, enrichment and limitations Electricigens: Source, enrichment and limitations. Environ. Technol. Rev. 2017, 6, 117–134. [Google Scholar] [CrossRef]
  19. Song, X.; Wang, W.; Cao, X.; Wang, Y.; Zou, L.; Ge, X.; Zhao, Y.; Si, Z.; Wang, Y. Chlorella vulgaris on the cathode promoted the performance of sediment microbial fuel cells for electrogenesis and pollutant removal. Sci. Total Environ. 2020, 728, 138011. [Google Scholar] [CrossRef]
  20. Song, N.; Yan, Z.; Xu, H.; Yao, Z.; Wang, C.; Chen, M.; Zhao, Z.; Peng, Z.; Wang, C.; Jiang, H.-L. Development of a sediment microbial fuel cell-based biosensor for simultaneous online monitoring of dissolved oxygen concentrations along various depths in lake water Science of the Total Environment Development of a sediment microbial fuel cell-based bio. Sci. Total Environ. 2019, 673, 272–280. [Google Scholar] [CrossRef]
  21. Olias, L.G.; Cameron, P.J.; di Lorenzo, M. Effect of Electrode Properties on the Performance of a Photosynthetic Microbial Fuel Cell for Atrazine Detection. Front. Energy Res. 2019, 7, 1–11. [Google Scholar]
  22. Mao, J. Oxygen Reduction Reaction. Electrocatalysis 2019, 1, 8785–8789. [Google Scholar]
  23. Wang, C.-T.; Huang, Y.-S.; Sangeetha, T.; Chen, Y.-M.; Chong, W.-T.; Ong, H.-C.; Zhao, F.; Yan, W.-M. Novel bufferless photosynthetic microbial fuel cell (PMFCs) for enhanced electrochemical performance. Bioresour. Technol. 2018, 255, 83–87. [Google Scholar] [CrossRef]
  24. Fu, L.; You, S.J.; Yang, F.L.; Gao, M.M.; Fang, X.H.; Zhang, G.Q. Synthesis of hydrogen peroxide inmicrobial fuel cell. J. Chem. Technol. Biotechnol. 2010, 85, 715–719. [Google Scholar] [CrossRef]
  25. Rezayian, M.; Niknam, V.; Ebrahimzadeh, H. Oxidative damage and antioxidative system in algae. Toxicol. Rep. 2019, 6, 1309–1313. [Google Scholar] [CrossRef] [PubMed]
  26. Mohan, S.V.; Srikanth, S.; Chiranjeevi, P.; Arora, S.; Chandra, R. Algal biocathode for in situ terminal electron acceptor (TEA) production: Synergetic association of bacteria-microalgae metabolism for the functioning of biofuel cell. Bioresour. Technol. 2014, 166, 566–574. [Google Scholar] [CrossRef] [PubMed]
  27. YSI. The Dissolved Oxygen Handbook; YSI: Yellow Springs, OH, USA, 2009; p. 43. [Google Scholar]
  28. Commault, A.S.; Lear, G.; Novis, P.; Weld, R.J. Photosynthetic biocathode enhances the power output of a sediment-type microbial fuel cell. New Z. J. Bot. 2014, 52, 48–59. [Google Scholar] [CrossRef]
  29. Logan, B.E.; Hamelers, B.; Rozendal, R.; Schröder, U.; Keller, J.; Freguia, S.; Rabaey, K. Microbial fuel cells: Methodology and technology. Environ. Sci. Technol. 2006, 40, 5181–5192. [Google Scholar] [CrossRef]
  30. Liao, C.; Wu, J.; Zhou, L.; Li, T.; Du, Q.; An, J.; Wang, X. Optimal set of electrode potential enhances the toxicity response of biocathode to formaldehyde. Sci. Total Environ. 2018, 644, 1485–1492. [Google Scholar] [CrossRef]
  31. Ajayi, F.F.; Weigele, P.R. A terracotta bio-battery. Bioresour. Technol. 2012, 116, 86–91. [Google Scholar] [CrossRef]
  32. Bardarov, I.; Mitov, M.; Ivanova, D.; Hubenova, Y. Light-dependent processes on the cathode enhance the electrical outputs of sediment microbial fuel cells. Bioelectrochemistry 2018, 122, 1–10. [Google Scholar] [CrossRef]
  33. Strycharz-Glaven, S.M.; Glaven, R.H.; Wang, Z.; Zhou, J.; Vora, G.J.; Tender, L.M. Electrochemical investigation of a microbial solar cell reveals a nonphotosynthetic biocathode catalyst. Appl. Environ. Microbiol. 2013, 79, 3933–3942. [Google Scholar] [CrossRef]
  34. González-García, J.; Bonete, P.; Expósito, E.; Montiel, V.; Aldaz, A.; Torregrosa-Maciá, R. Characterization of a carbon felt electrode: Structural and physical properties. J. Mater. Chem. 1999, 9, 419–426. [Google Scholar] [CrossRef]
  35. Thamilselvan, A.; Nesaraj, A.S.; Noel, M.; James, E.J. Effect of chemically treated / untreated carbon cloth: Potential use as electrode materialsin the capacitive deionization process of desalination of aqueous salt solution. J. Electrochem. Sci. Technol. 2015, 6, 139–145. [Google Scholar] [CrossRef]
  36. Ucar, D.; Zhang, Y.; Angelidaki, I. An overview of electron acceptors in microbial fuel cells. Front. Microbiol. 2017, 8, 1–14. [Google Scholar] [CrossRef] [PubMed]
  37. Labelle, E.; Bond, D.R. Cyclic voltammetry of electrode-attached bacteria. In Bio-Electrochemical Systems: From Extracellular Electron Transfer to Biotechnological Application; Wiley-VCH Verlag: Weinheim, Germany, 2005; pp. 1–15. [Google Scholar]
  38. Marsili, E.; Baron, D.B.; Shikhare, I.D.; Coursolle, D.; Gralnick, J.A.; Bond, D.R. Shewanella secretes flavins that mediate extracellular electron transfer. Proc. Natl. Acad. Sci. USA 2008, 105, 6–11. [Google Scholar] [CrossRef]
  39. Struyk, Z.; Sposito, G. Redox properties of humic acids. Geoderma 2001, 102, 329–346. [Google Scholar] [CrossRef]
Figure 1. Sketch of the setup. (A) Ceramic, soil-based microbial fuel cell (CSMFC) in a 250 mL beaker with algal (green circles) solution. (B) Dimensions of the CSMFC device.
Proceedings 60 00064 g001
Figure 2. (A) Enrichment of the CSMFCs in algal catholyte. Shadowed areas correspond to the standard deviation of the mean and the blue areas in the inset correspond to the dark cycle. (B) Evolution of pH (circles), DO (triangles), conductivity (squares) and absorbance (crosses) during the enrichment period. Error bars correspond to the standard deviation of the mean. Data refer to three replicates.
Proceedings 60 00064 g002
Figure 3. (A) CSMFC signal output (grey line) variation with dissolved oxygen (DO) (white squares, commercial probe; dark line calibration model from [7]) during the dark/light cycle. (B) Correlation of DO and voltage in the time span presented in (A) (R2 = 0.63). (C) Correlation of algal concentration and voltage during the first 11 days of operation (R2 = 0.63). Error bars correspond to the standard deviation of the mean of three replicates.
Proceedings 60 00064 g003
Figure 4. Pareto Plot representing the coefficients, centred and scaled, of the factors studied with the resolution III saturated design of experiments (DoE). Significant codes: p < 0 ‘***’; p < 0.001 ‘**’; p < 0.01 ‘*’; p < 0.05 ‘.’; p < 0.1 ‘ ’.
Proceedings 60 00064 g004
Figure 5. Power density curves of CSMFC with graphite felt cathode (CSMFC-GF, grey squares) and with carbon cloth cathode (CSMFC-CC, black squares). Error bars represent the standard deviation of the mean of three replicates.
Proceedings 60 00064 g005
Figure 6. Resolution III saturated design model assumptions: (A) Normality of residuals. (B) Independence of residuals. (C,D) Constancy of variance. (E) Independence of data.
Proceedings 60 00064 g006
Figure 7. (A) Cyclic voltammograms of the carbon cloth cathode at the beginning of the experiment (black line) and after three months of operation in an algal catholyte (grey line). (B) First derivative of current with voltage vs. voltage for data shown in (A).
Proceedings 60 00064 g007
Table 1. Range of study of the factors.
FactorsLevel
+
Temperature, T/°C3010
Dissolved oxygen, DO/mg L−1101
pH/-95
Conductivity, C/µS cm−13000150
Electrode material, MGFCC
Rext/Ω50002000
NO3/mg L−1101
Table 2. Standard order table for the resolution III saturated fractional design (RIII) experimental design. V1 and V2 are normalised by the baseline (pH = 7; DO = 5.5 mg L−1; T = 20 °C).
RunMCDONO3 = M × CpH = M × DOT = C × DORext = M × C × DOV1V2
1CC30011093020001.060.60
2CF3001153050000.960.95
3CC30001191050000.700.99
4CF300011051020000.730.74
5CC300101051050000.881.05
6CF30010191020001.241.01
7CC300010153020001.472.13
8CF3000101093050001.080.96
Publisher’s Note: MDPI stays neutral with regard to jurisdictional claims in published maps and institutional affiliations.

