1. Introduction
The microacoustic methods of biomedical analysis, implemented on piezoelectric crystals and ceramics, are becoming increasingly popular due to the fact of their potential for integration as functional sensor elements into the hybrid analytical devices and laboratories-on-a-chip [
1,
2,
3]. One possible application of such a sensor is an alternative to the identification of bacteria according to the Gram method, which enables to discriminate bacteria according to the composition of their cell walls [
4]. Thus, bacteria, which in a procedure of Gram staining do not decolor after bleeding of dye at a discoloration stage, are classified as Gram-positive (G(+)) [
5]. The protection of the color is due to the thick (20–30 nm) layer of peptidoglycan with a fibrous structure in the bacterial cell wall which retains the coloring agent (
Figure 1). The signature feature of G(+) bacteria is the presence of teichoic and lipoteichoic acids. However, despite a thicker layer of peptidoglycan, G(+) bacteria are more susceptible to antibiotics.
Most of human pathogenic microorganisms are G(+). Thus, six genera of G(+) microorganisms are typical human pathogens: two of them are cocci (streptococci and staphylococci) and the others are bacilli—a rod-like bacteria. The typical members of G(+) bacilli are Bacillus subtilis, Bacillus cereus, Bacillus anthracis, etc.
Gram-negative (G(−)) bacteria are a group of bacteria decolored when stained with crystal violet in the Gram method [
6]. They are characterized with cell walls consisting of a thin layer of peptidoglycan, clamped between the inner membrane of cytoplasmic cells and the outer bacterial membrane (
Figure 2). The signature feature of Gram-negative bacteria is the absence of teichoic and lipoteichoic acids; accordingly, G(−) bacteria cannot retain the purple dye after the decoloration stage. The alcohol used in this stage degenerates the outer membrane of G(−) cells and makes the cell wall more porous and unable to hold crystal violet. The peptidoglycan layer of G(−) bacteria is thinner than that in G(+) bacteria and is clamped between the inner and outer membranes, causing them to insert a contrasting agent (safranin or fuxin) and look red or pink.
The typical members of G(−) bacteria are the proteobacteria (Escherichia coli, Salmonella, Shigella, Pseudomonas, Moraxella, Helicobacter, Stenotrophomonas, Bdellovibrio, Legionella), cyanobacteria, and some types of bacilli (Hemophilus influenzae, Klebsiella pneumoniae, Legionella pneumophila, Pseudomonas aeruginos), etc.
Gram staining is not an absolutely accurate tool to identify bacteria. This method is used for preliminary diagnostics or to determine the number of bacteria in a clinical sample. It cannot identify bacteria at the species level and should not be used as the only way to differentiate bacteria for most diseases. The main disadvantage of Gram staining is the unsuitability of the samples for research after the procedure. In addition, the method is labor intensive. However, it seems useful for additional indicators in the identification of microorganisms, for example, in implementing a new generation hybrid device for microbiological analysis [
2,
3]. This is due to the strong discriminative feature of these two groups of bacteria, i.e., the rigidly of the cell wall, which is the subject of physical methods of measurement.
Therefore, there is a need for an alternative and less time-consuming miniature method of differentiating bacteria by Gram or by rigidity of their cell wall. The acoustic resonance method is a promising approach as an alternative to the classical Gram method, which surpasses it by the speed, and integrability. But there are limitations, which connected with variations in the shapes of bacteria, could contribute into the result [
7].
Thus, in this paper, a method of bacteria discrimination based on their unequal response to different external mechanical influences and their results, which would be a double to the Gram staining method, is discussed.
2. Theoretical Background
An implementation of microacoustic sensor for bacteria needs the selection of an element for the generation of appropriate acoustic fields. A quartz resonator is an electronic device in which the piezoelectric effect and the phenomenon of mechanical resonance are used to construct a high-quality resonant element of an electronic circuit [
8,
9].
On a plate, a thin cylinder, a ring or a bar cut from a quartz crystal with a certain orientation relative to the crystallographic axes of a single crystal, and two or more electrodes are deposited on conductive metal strips made by sputtering in vacuum or by burning a metal film on a given crystal surface [
10].
The resonator is mechanically mounted in the nodes of the working mode of vibration in order to reduce the loss of vibrational energy through the crystal mount. For other modes of vibration, the nodes of natural vibrations are located in other places of the crystal and, therefore, other vibration modes are suppressed. For the working mode of oscillations, the crystal has a certain natural resonant frequency of mechanical vibrations, and at this frequency, the
Q-factor of the mechanical resonator is very high [
11].
When voltage is applied to the electrodes, bending, compression, or shearing occurs due to the piezoelectric effect, depending on how the crystal is cut relative to the crystallographic axes, the configuration of the exciting electrodes, and the location of the attachment points (
Figure 3) [
12].
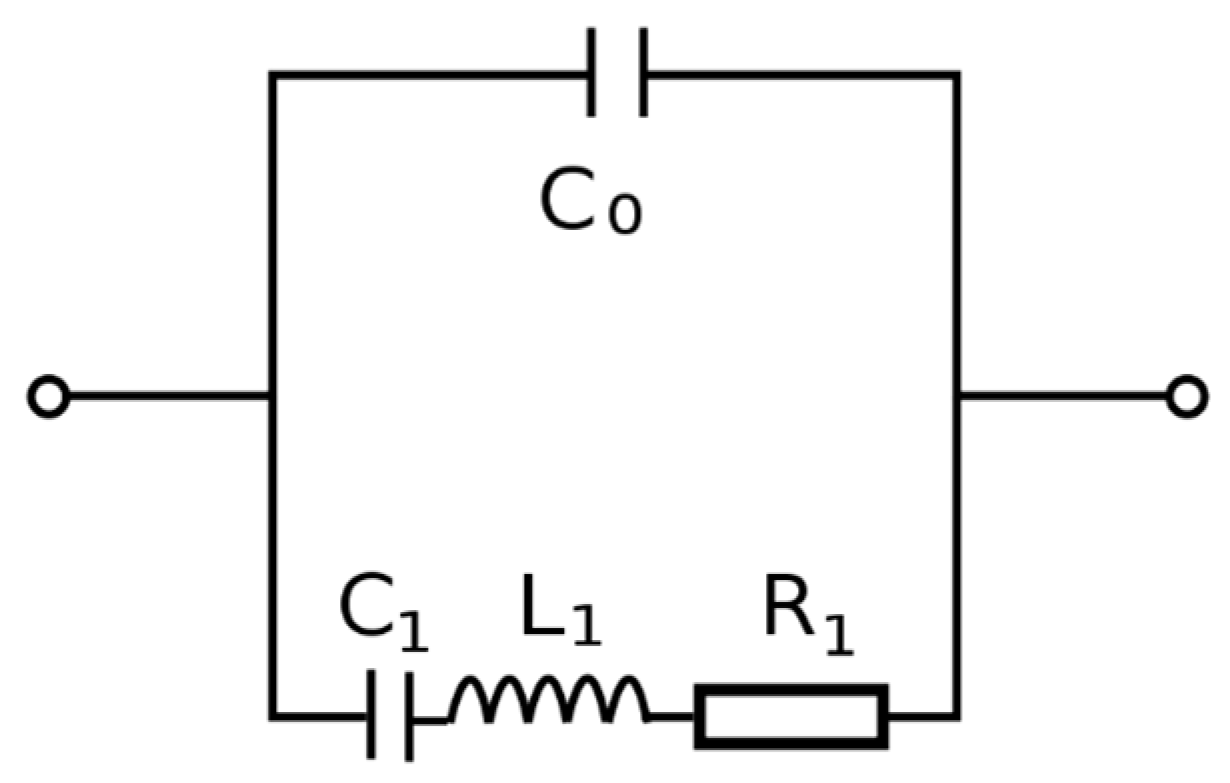
The natural oscillations of the crystal as a result of the inverse piezoelectric effect induce an additional electromotive force,
emf, on the electrodes and, therefore, the quartz resonator behaves electrically like a resonant circuit—an oscillatory circuit composed of capacitors, inductance, and resistor, and the quality factor (
Q-factor) of this equivalent electric circuit is very large and close to the
Q-factor of its own mechanical crystal vibrations [
11].
If the frequency of the applied voltage is equal to or close to the frequency of the intrinsic mechanical vibrations of the plate, the energy consumption for maintaining the plate vibrations is much lower than that with a large difference in frequency. This also corresponds to the behavior of the electric oscillatory circuit [
9].
The advantages of quartz-based resonators include a low loss tangent and very low mechanical losses (i.e., high mechanical Q-factor). In the best samples of a quartz crystal, this can be 10
6–10
7. This feature provides high frequency selectivity of quartz resonators. Due to the fact that the reserves of natural quartz are limited, it is grown artificially using a hydrothermal method [
12]. Crystallization is carried out in high-capacity steel autoclaves from aqueous alkaline solutions at a temperature of 350–400 °C and pressures on the order of 10
8 Pa. Due to the low solubility of silica in aqueous solutions, one growing cycle can last several months [
13].
3. Materials
Suspensions of G(+) and G(−) bacteria were prepared by diluting a dry bacteria sample (5 doses or other) in 1 mL of physiological solution, obtaining thus a stock solution for further dilution.
The following microorganisms were used in experiments:
Lactobacillus fermentum [
14] is a microbial mass of a live, antagonistically active strain of lactobacilli, lyophilized in a culture medium with the addition of a protective sucrose–gelatin–milk drying environment. One dose contains no less than 2 × 10
9 living bacteria, and the protection medium contains (per 1 L of the medium): gelatin up to 8.5% vol.; sugar up to 28% weight; skimmed milk powder up to 14% weight (code EAN: 4602784000076; No LS-002098, 2011-10-25; manufacturer: Scientific Industrial Consortium “Microgen”, 115088, Moscow, 1-st. Dubrovskaya str., house 15, Russia).
The
Escherichia coli M-17 [
15] was from Colibacterin siccum. One dose contained no less than 10 × 10
9 living bacteria. Protection substances in the preparation included gelatin and sugar (manufacturer: Scientific Industrial Consortium “Microgen”, 115088, Moscow, 1-st. Dubrovskaya str., house 15, Russia;
The
Bifidobacterium bifidum [
16] was from Bifidum bacterin. One dose contained no less than 10
7 living bacteria and the protection components included gelatin, sugar, and dry milk (manufacturer: code EAN: 4607006820289, No P N000063/01, 2011-02-21, Vitapharma Ltd., Moscow, Russia);
The Burkholderia cepacian was prepared at the St. Petersburg Pasteur Institute. The growth medium: agar/meat–peptone broth;
The Staphylococcus aureus was prepared at the St. Petersburg Pasteur Institute. The growth medium: agar/meat–peptone broth.
4. Experimental
The experimental setup shown in
Figure 4 comprised an electric oscillation generator (PV6503), an acoustic sensor based on a quartz resonator, and a 1.5 MΩ resistor connected in series to the resonator.
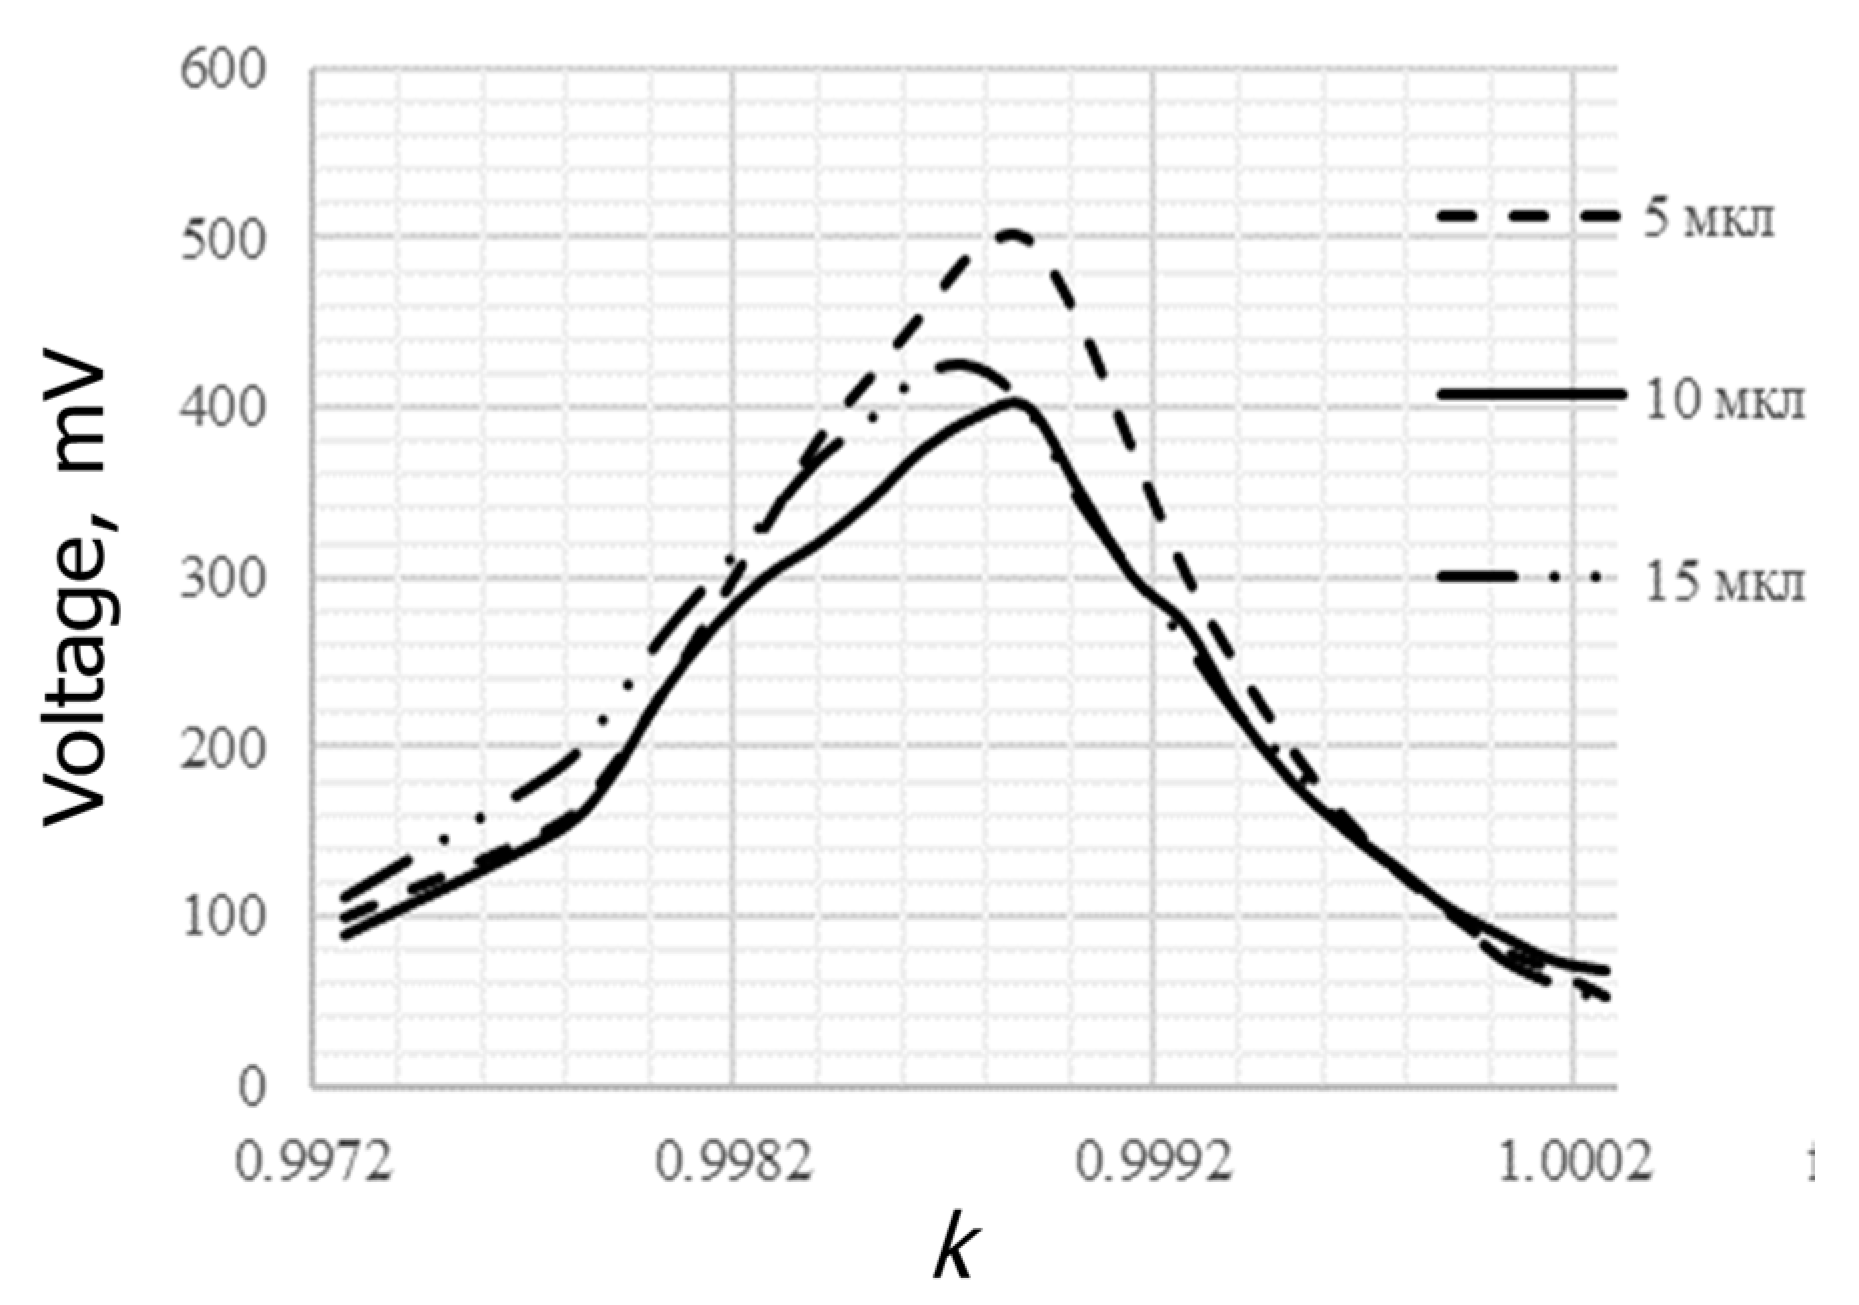
Suspensions of G(+) and G(−) bacteria of different volumes were loaded into the test system to determine the optimal load volume. The suspensions of bacteria were prepared by diluting a stock solution, as described above, using an automatic pipette and physiological saline solution. The loading of suspensions of defined volume was made using a precision, low-volume automatic pipette. The different volumes were 5 μL, 10 μL, and 15 μL.
The procedure for loading samples onto the sensor’s surface was strictly controlled by volume. The volumes were applied on a quartz plate, after which the amplitude–frequency dependence recorded through a frequency meter was recorded on a resistor included in the circuit.
The characteristics of the measured samples according to Gram classification are presented in
Table 1.
5. Results and Discussion
Before the start of the experiments, the quartz resonator was calibrated with a nominal resonant frequency of 4 MHz, and the amplitude–frequency spectra (ASF) were recorded for the decoupled resonator. It was found that its resonant frequency was 3.9989 MHz.
Then, ASF measurements were made for the resonator loaded with water and alcohol (
Figure 3) in order to check the influence of the sample’s viscosity, which differs for water and alcohol. The results are presented for reduced values,
k = f/fres, where
f is the measured frequency and
fres is the resonance frequency of the quarts resonator.
Similar experiments were carried out with suspensions of microorganisms.
Figure 5 shows that with an increase in the suspension volume as applied to G(+) Lactobacillus fermentum, the position of the resonance peak slightly shifted to the region of lower frequencies relative to the value of the resonance frequency for the empty resonator.
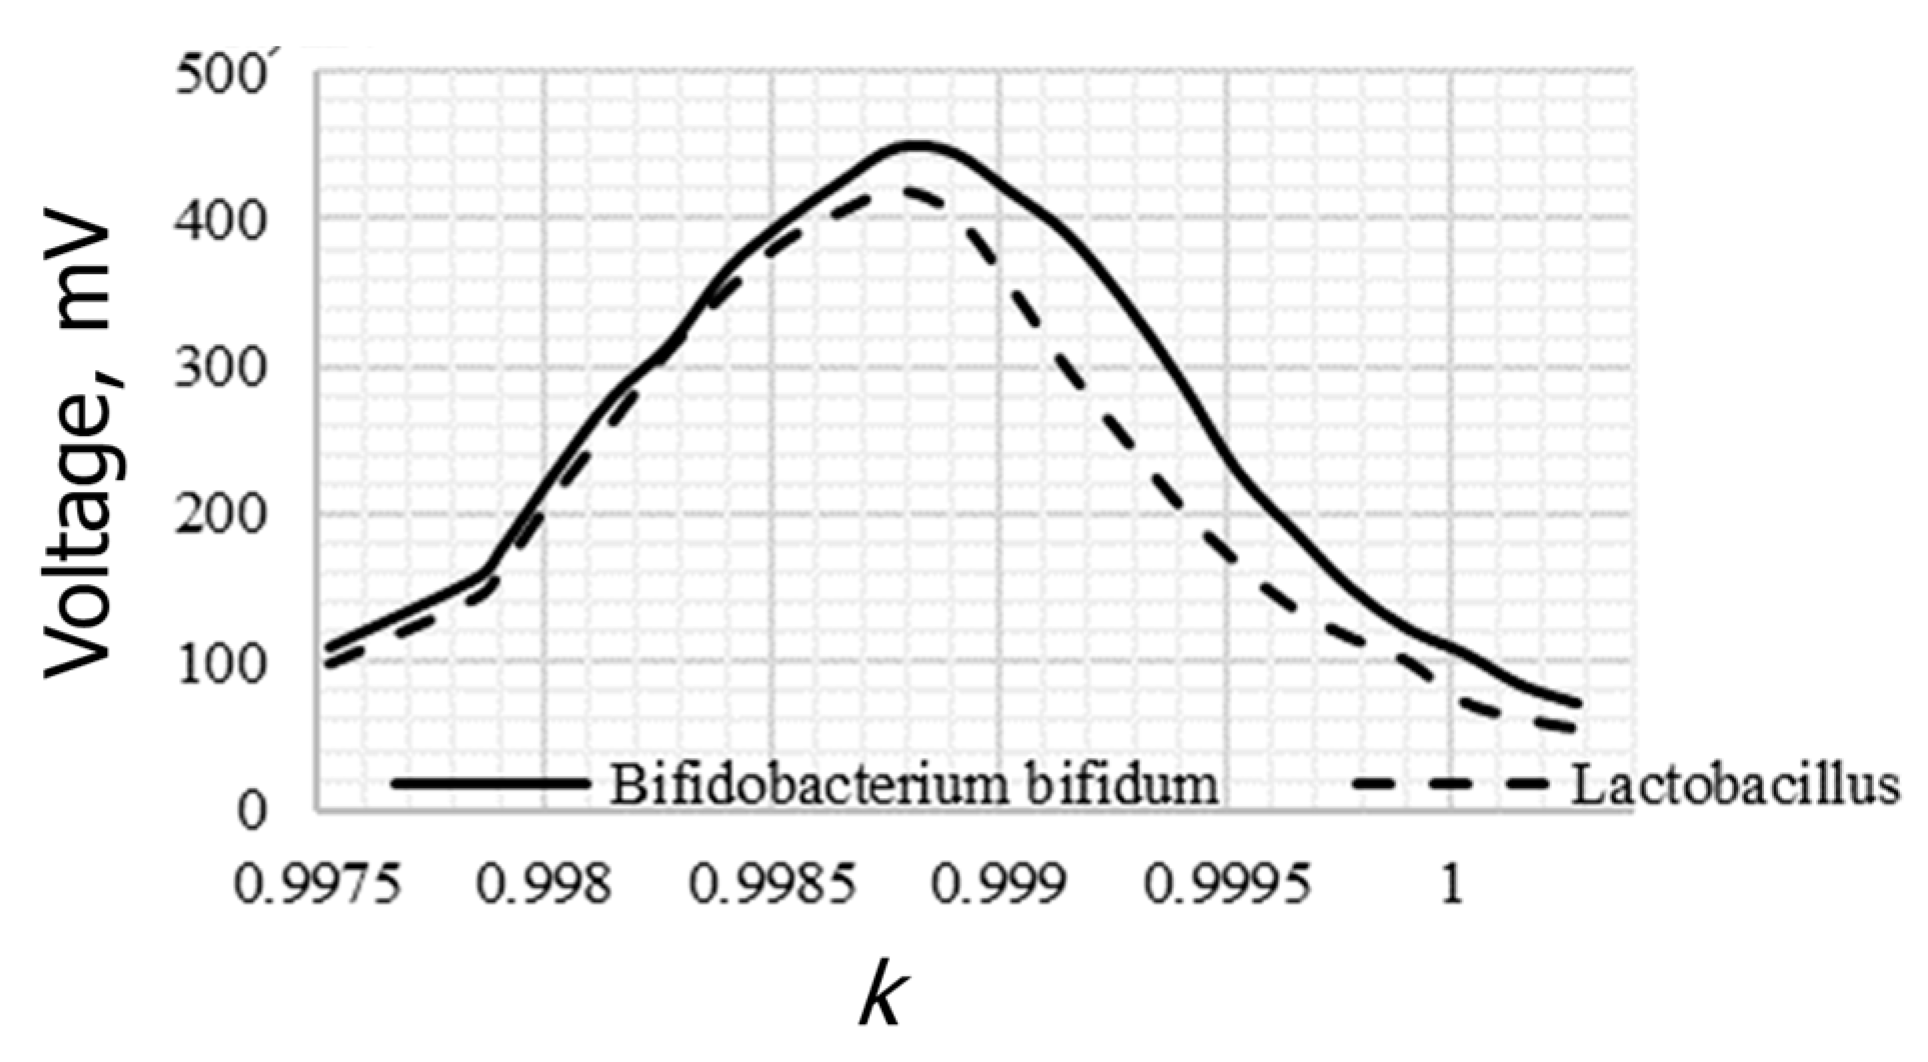
In
Figure 6 it can be seen that with an increase in the volume of the suspension in the study of gram-positive lactobacillus, a shift in the position of the resonance peak to the region of lower frequencies is observed relative to the value of the resonance frequency for an empty resonator.
Figure 7 shows that for G(+) bacteria, a slightly shifted peak maximum corresponding to the resonant frequency was characteristic.
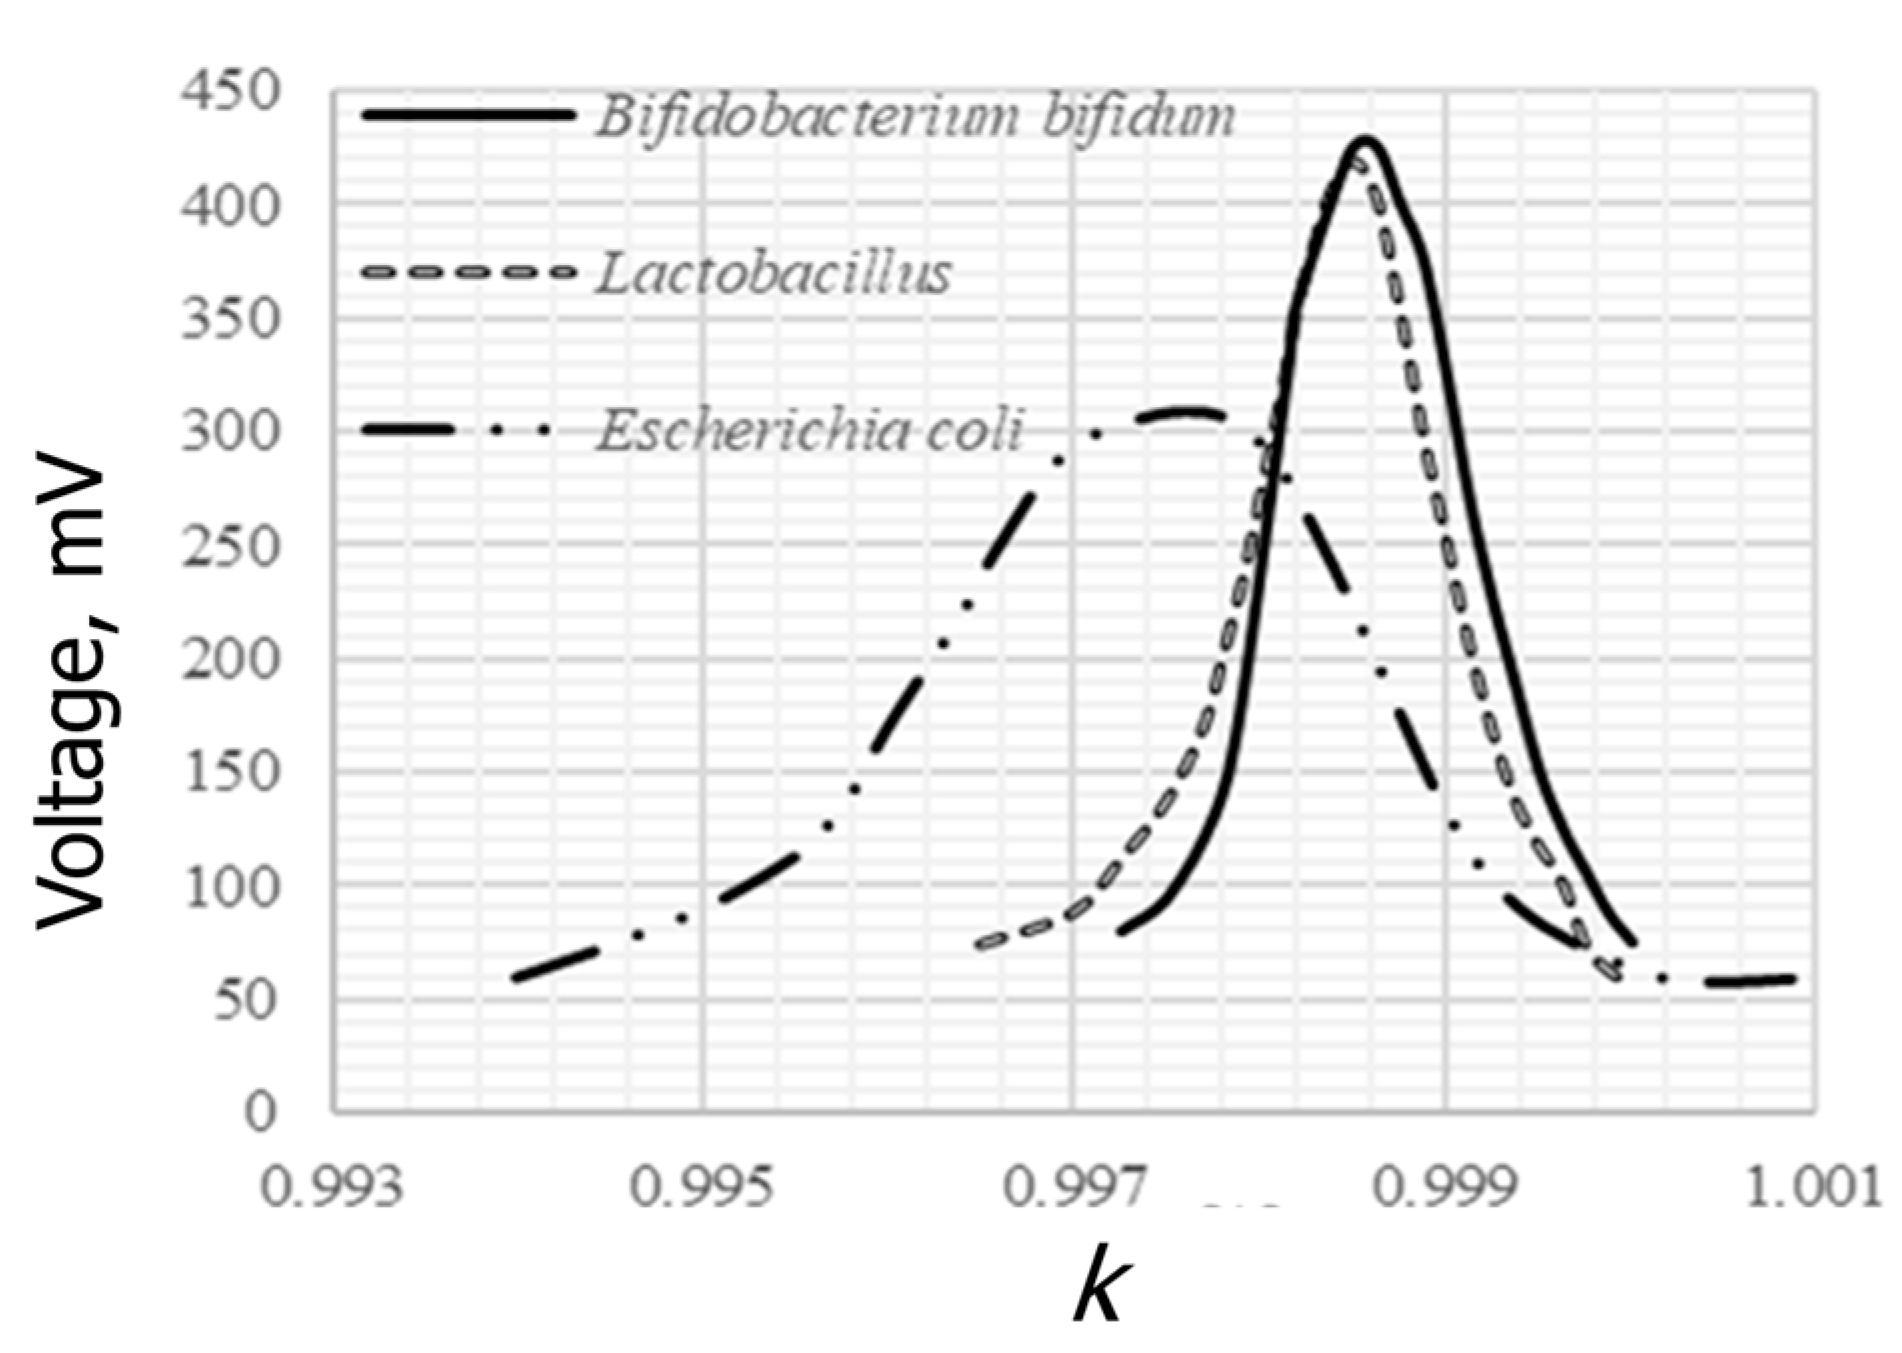
Testing of G(+) and G(−) bacilli showed that the resonance frequency peak position for G(−)
E. coli shifted considerably to the region of lower frequencies, relative to both Gram-positive bacteria,
Bifidobacterium bifidum and
Lactobacillus fermentum, and the empty resonator (
Figure 8).
Moreover, the G(−) bacterium was characterized by a significant increase in the bandwidth of AFC, which indicates a sharp decrease in the
Q-factor of the system (
Figure 9).
The observed relations demonstrate that suspensions of bacteria add such an element to the resonance system in which energy dissipation occurs during the propagation of acoustic waves. The observed energy dissipation during the propagation of acoustic waves in a thin quartz disk cannot be explained solely by the different viscosities of the studied suspensions, since according to Einstein’s law [
17], the viscosity of a suspension of smooth spheres depends on the volume concentration of solids and does not depend on the particle size. It could be concluded that differences in the values of the amplitudes of the reduced frequencies for G(+) and G(+) bacteria were mostly associated with the peculiarities of the chemical structure of the bacterial membranes and their rigidity.
The spherical G(+) and rod-shaped G(−) bacteria were tested to compare the shifts in the resonance frequency.
Figure 7 shows that for this type of bacteria, the shift to lower frequencies for both types of bacteria remained, but there was no significant difference between the value of this shift and the bandwidth for
Staphylococcus aureus, G(+), and
Burkholderia cepacian, G(−). This may be directly related to the differences in the rigidity of their cell walls and the shape.
Staphylococcus aureus belongs to spherical bacteria (cocci) and
Burkholderia cepacia to rod-shaped (bacilli) bacteria. The simultaneous effect of both factors decreased the selectivity of the method based on the effect of the resonance frequency shift.
6. Conclusions
This study showed that, due to the different structure of cell walls, Gram-positive and Gram-negative bacteria react differently to external disturbance. For G(−) bacteria, a sharp decrease in the quality factor of the resonator–suspension system and a shift of the resonance curve to lower frequencies were observed; for Gram-positive bacteria, a shift in the resonance curve was also observed but to a lower extent than for G(−) bacteria, and the bandwidth was practically unchanged.
However, these trends were observed for bacteria of the same shape—the bacteria studied in the first part of the experiment (Bifidobacterium bifidum, Lactobacillus fermentum, and Escherichia coli) were rod-shaped bacilli. When comparing bacteria of different shapes: spherical Staphylococcus aureus and rod-shaped Burkholderia cepacia, characteristic shifts in the resonance curves were also observed, but no significant changes in the bandwidth were noted. These results were obtained for the resonator with a resonance frequency of 4 MHz.
The experimental results obtained demonstrated that the acoustic resonance method is suitable for differentiation of bacteria, being discriminated by Gram, and it is particularly valid for bacteria of a similar shape. These results were confirmed for quarts resonator with the resonance frequency of 4 MHz. To further increase the selectivity of the method, it is important to test the wide range of resonators with the resonant frequencies in the range at least from 1 MHz to 100 MHz, which would enable the selection of the conditions most sensitive to the cell wall rigidity rather than for the shape of the total cell. This will create a background for the development of integrable elements for laboratories-on-a-chip and miniature diagnostic devices [
18].


