Electronic Eye for Identification of Tequila Samples †


Abstract
:1. Introduction
2. Materials and Methods
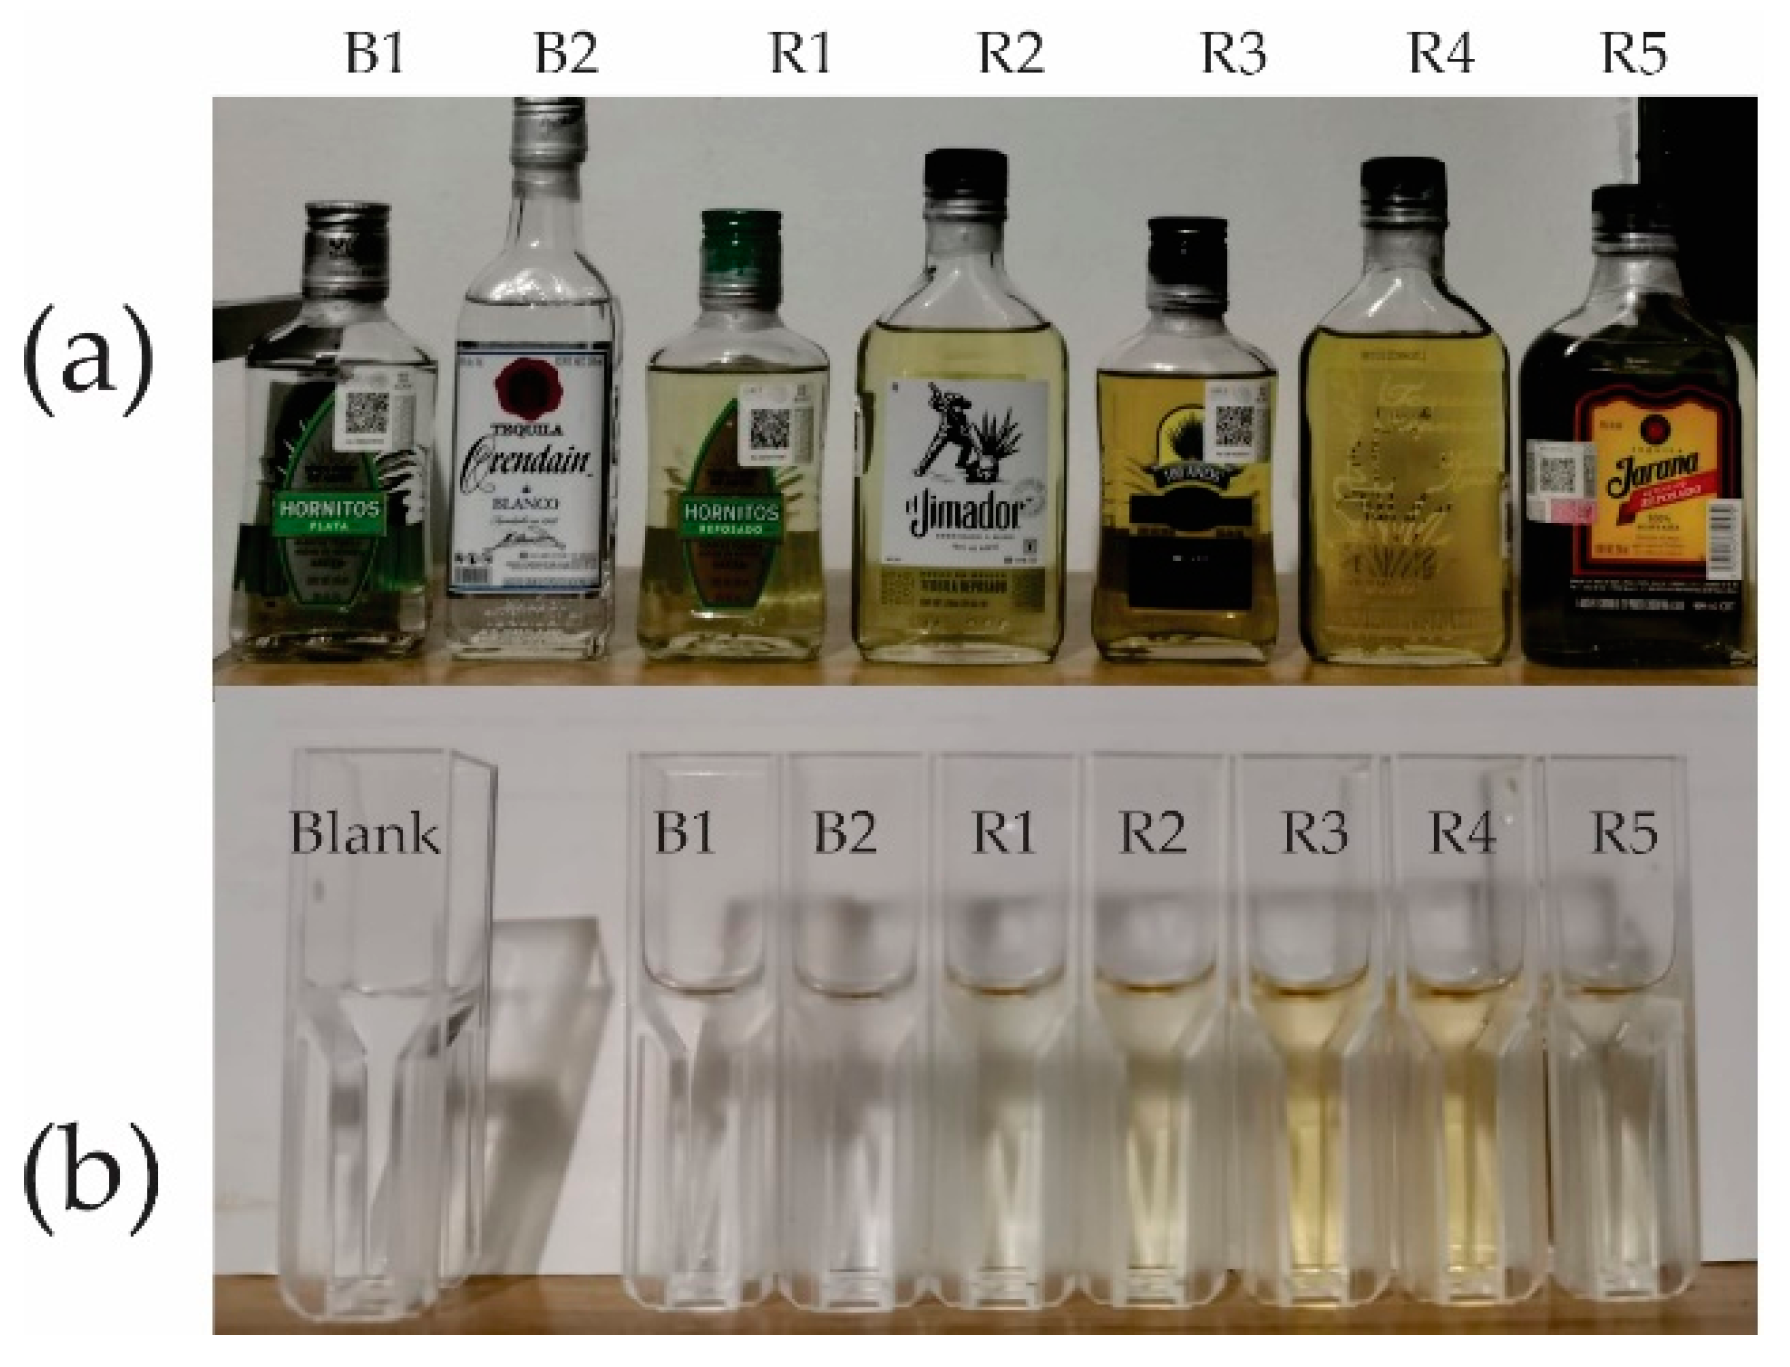
2.1. Samples of Tequila
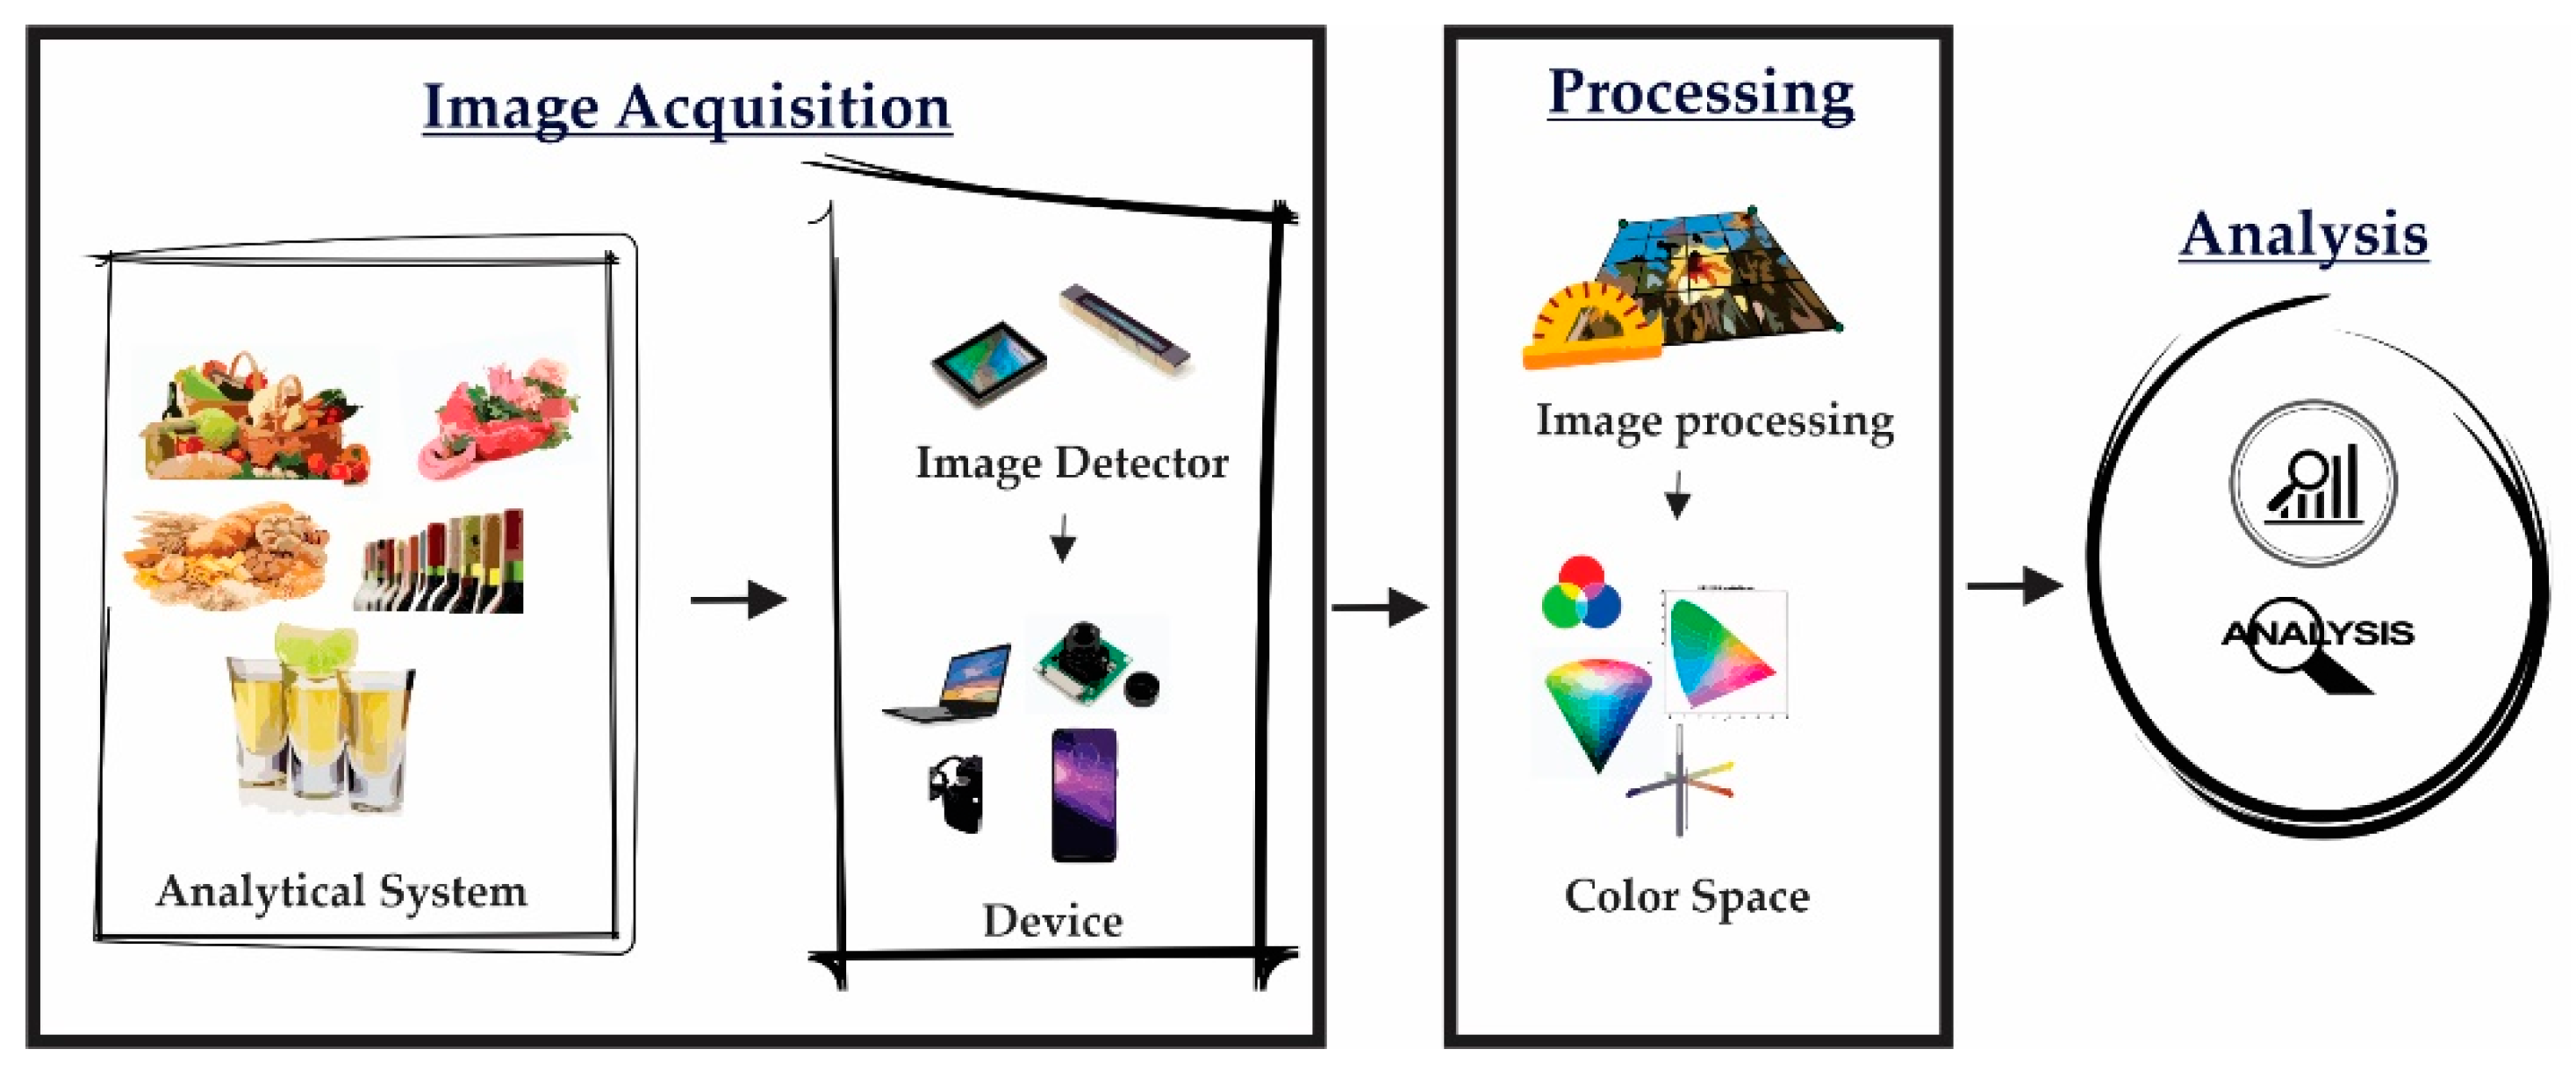
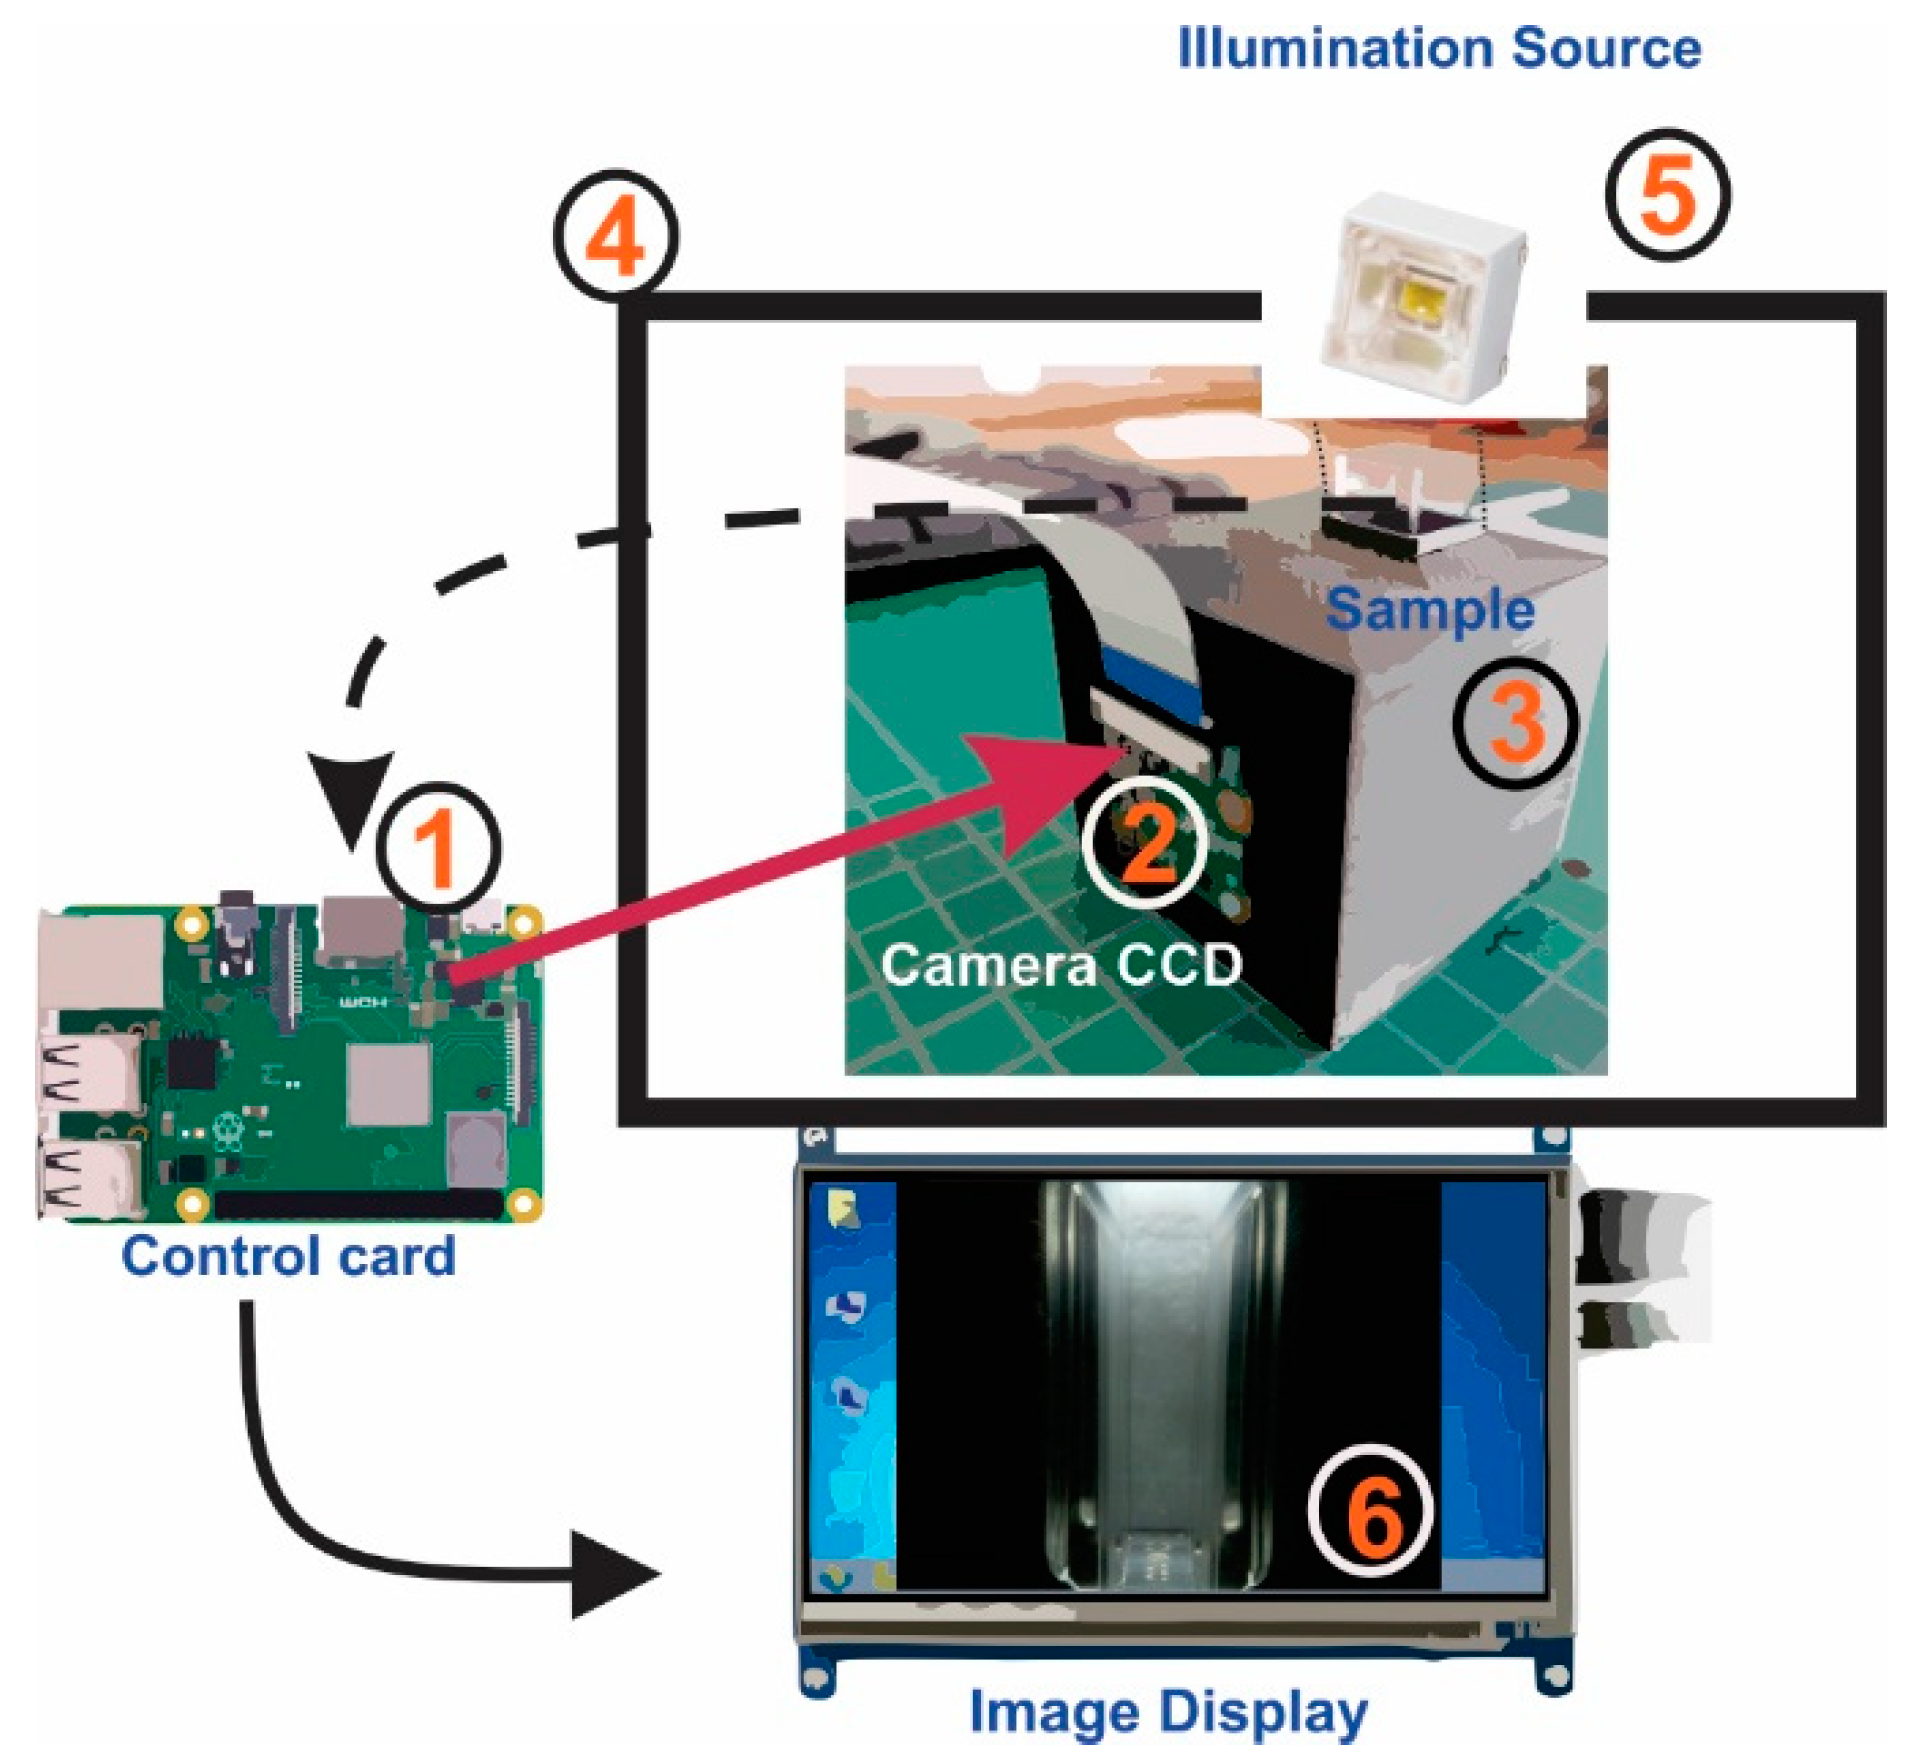
2.2. Electronic Eye Design General Features
2.3. Experimental
2.4. Apparatus and Software
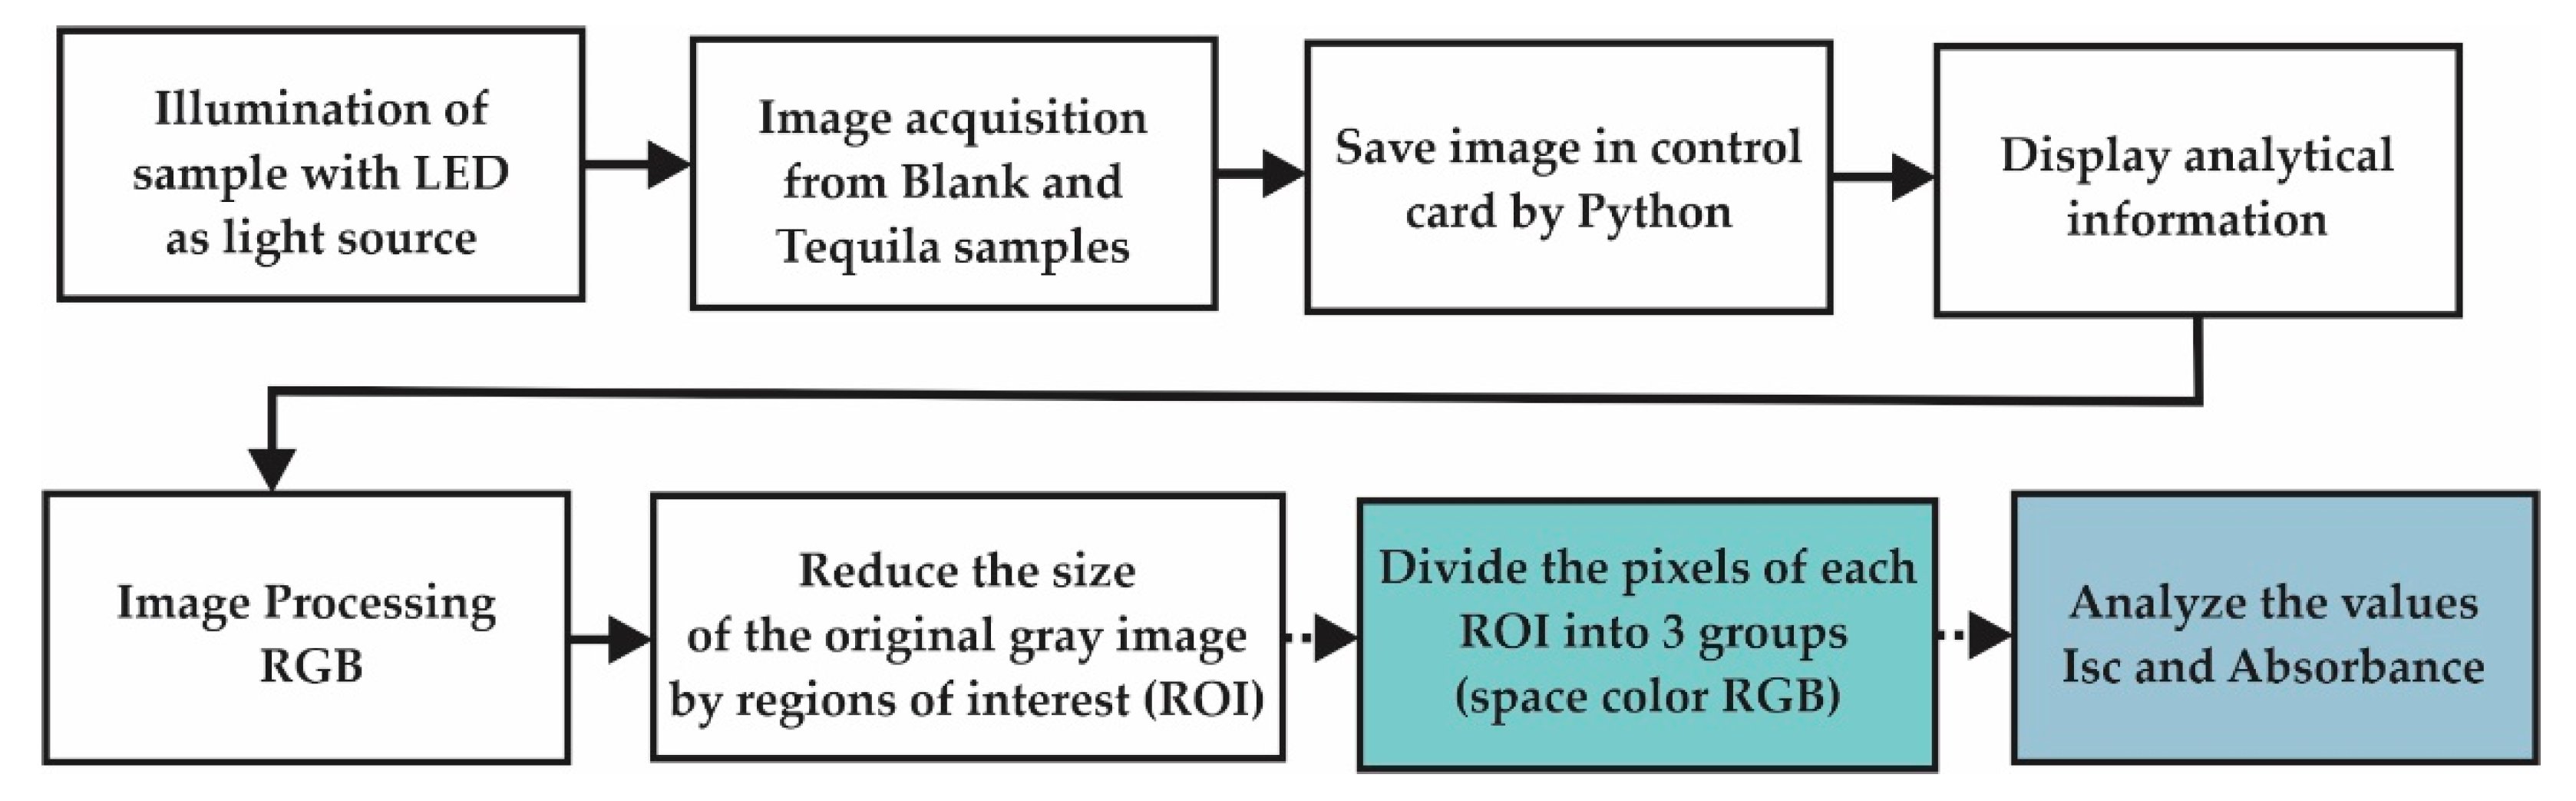
2.5. Image Acquisition
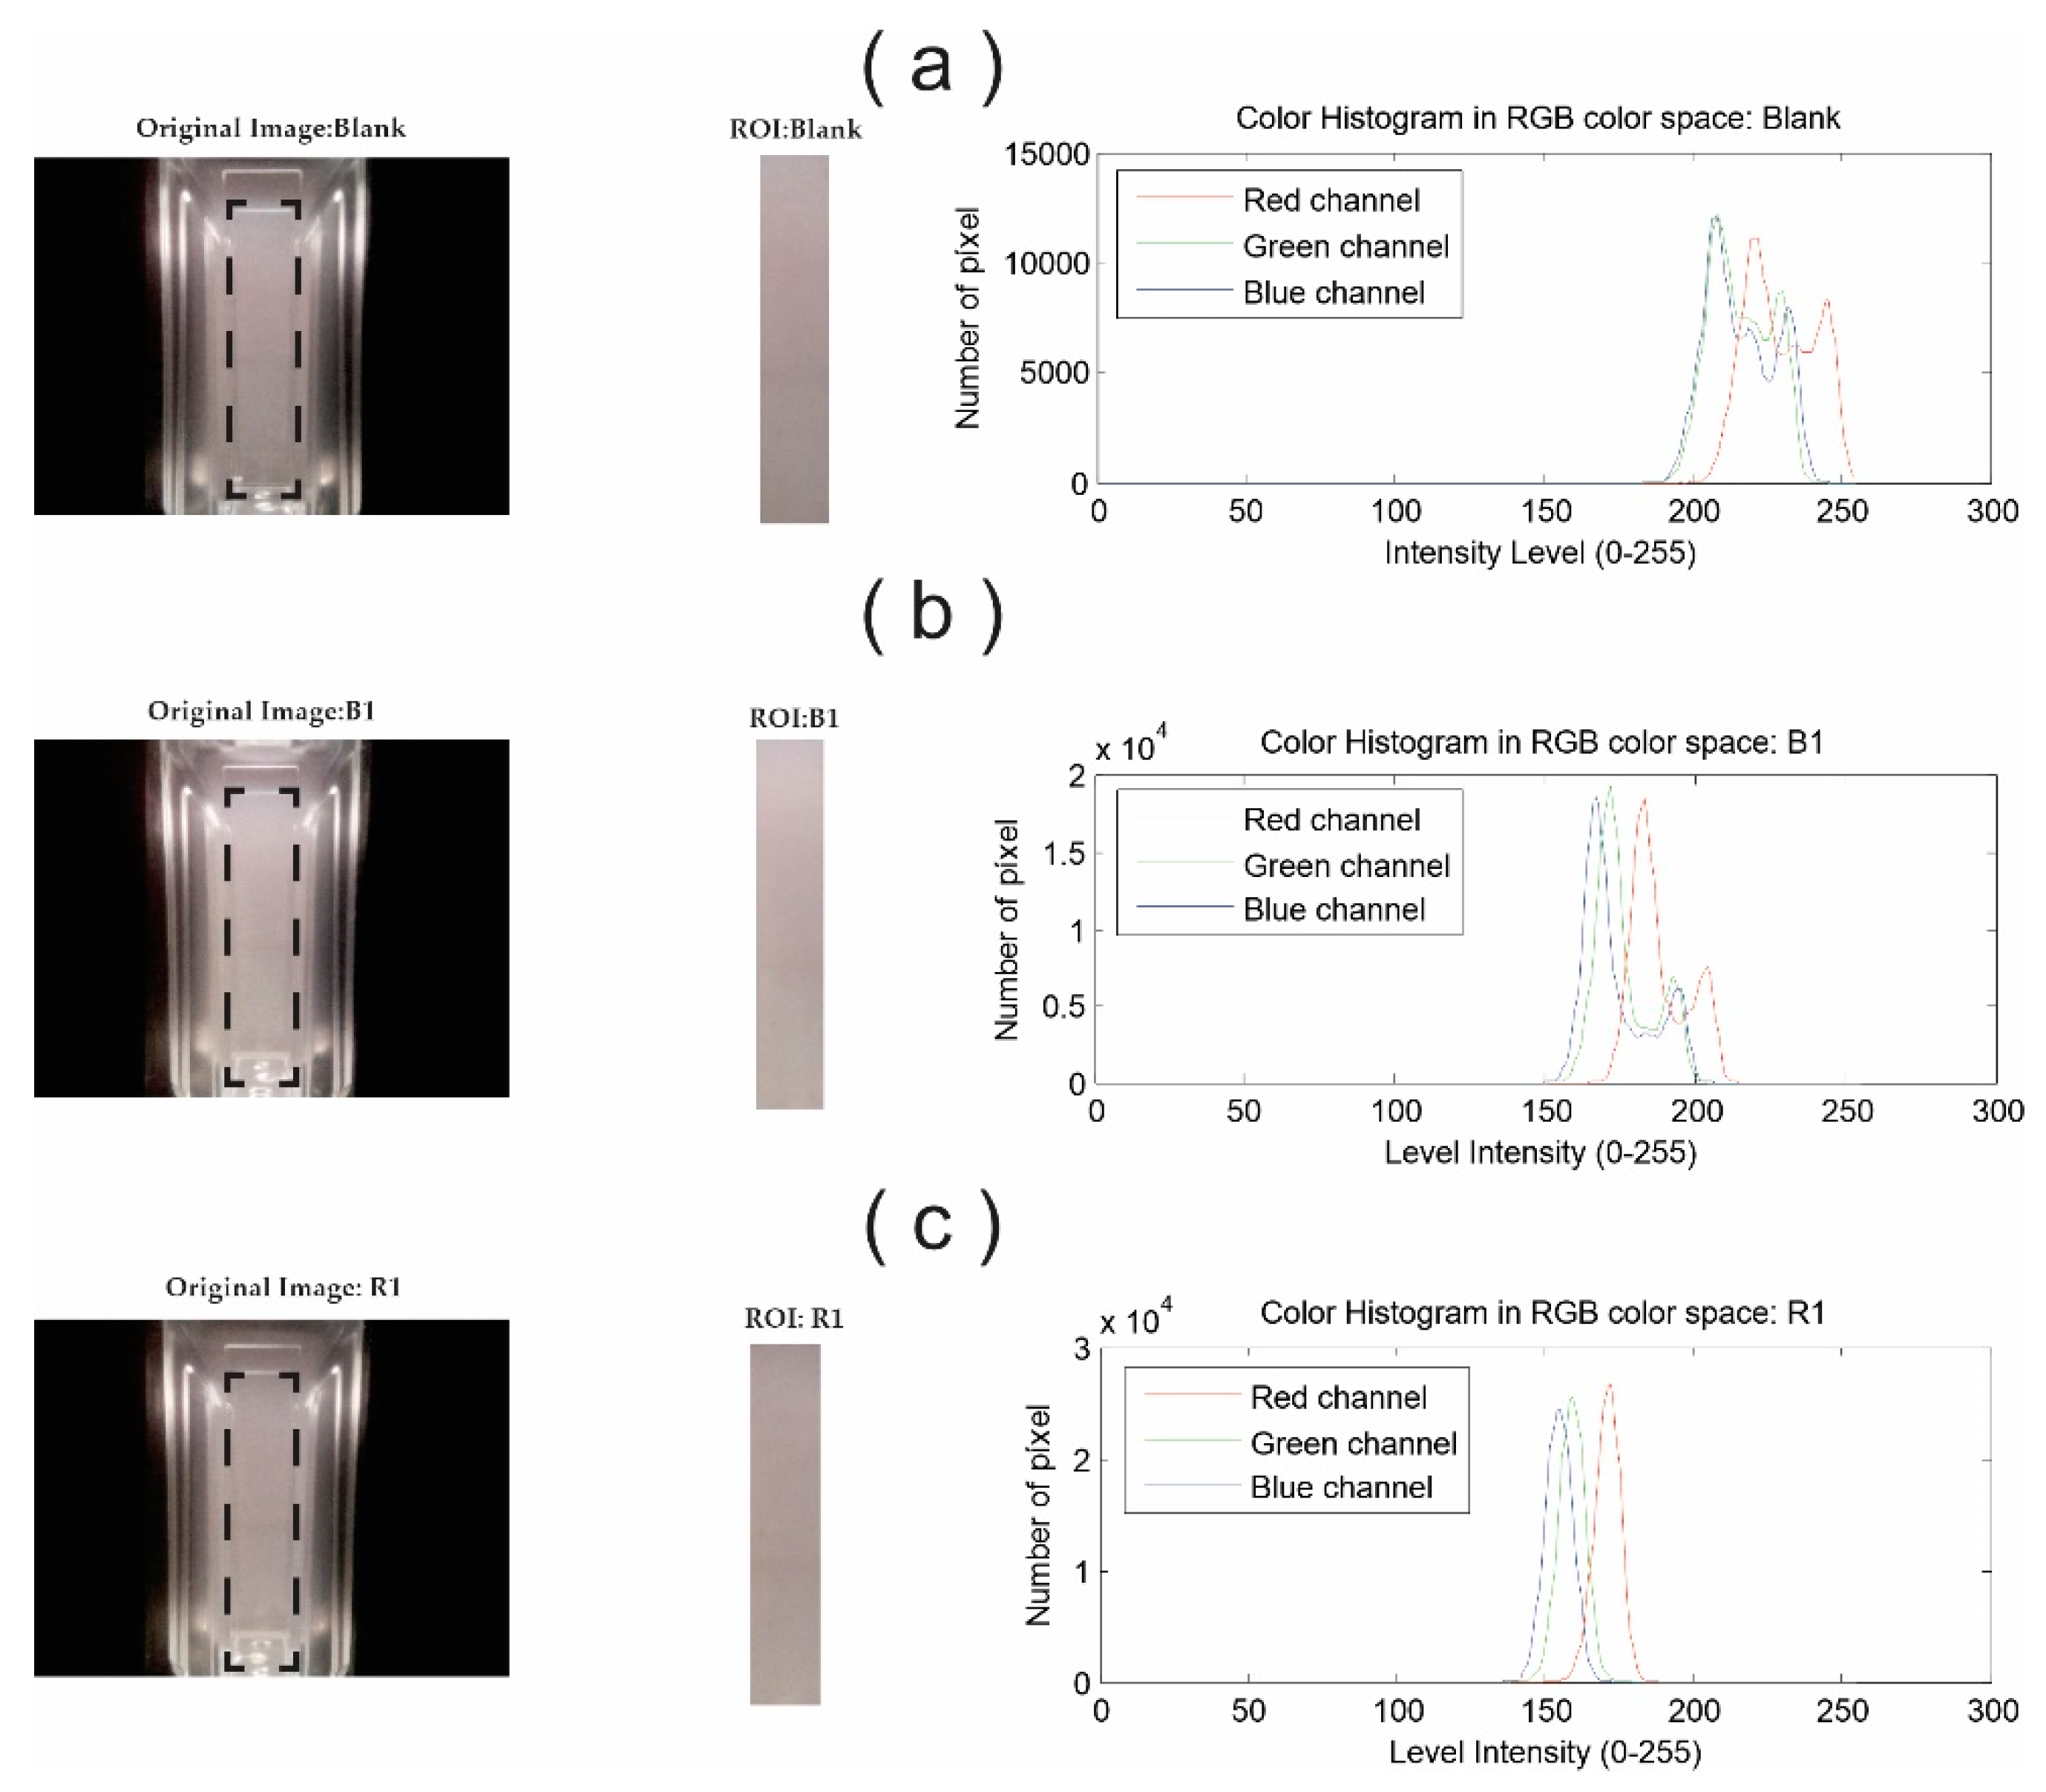
2.6. Digital Image Analysis
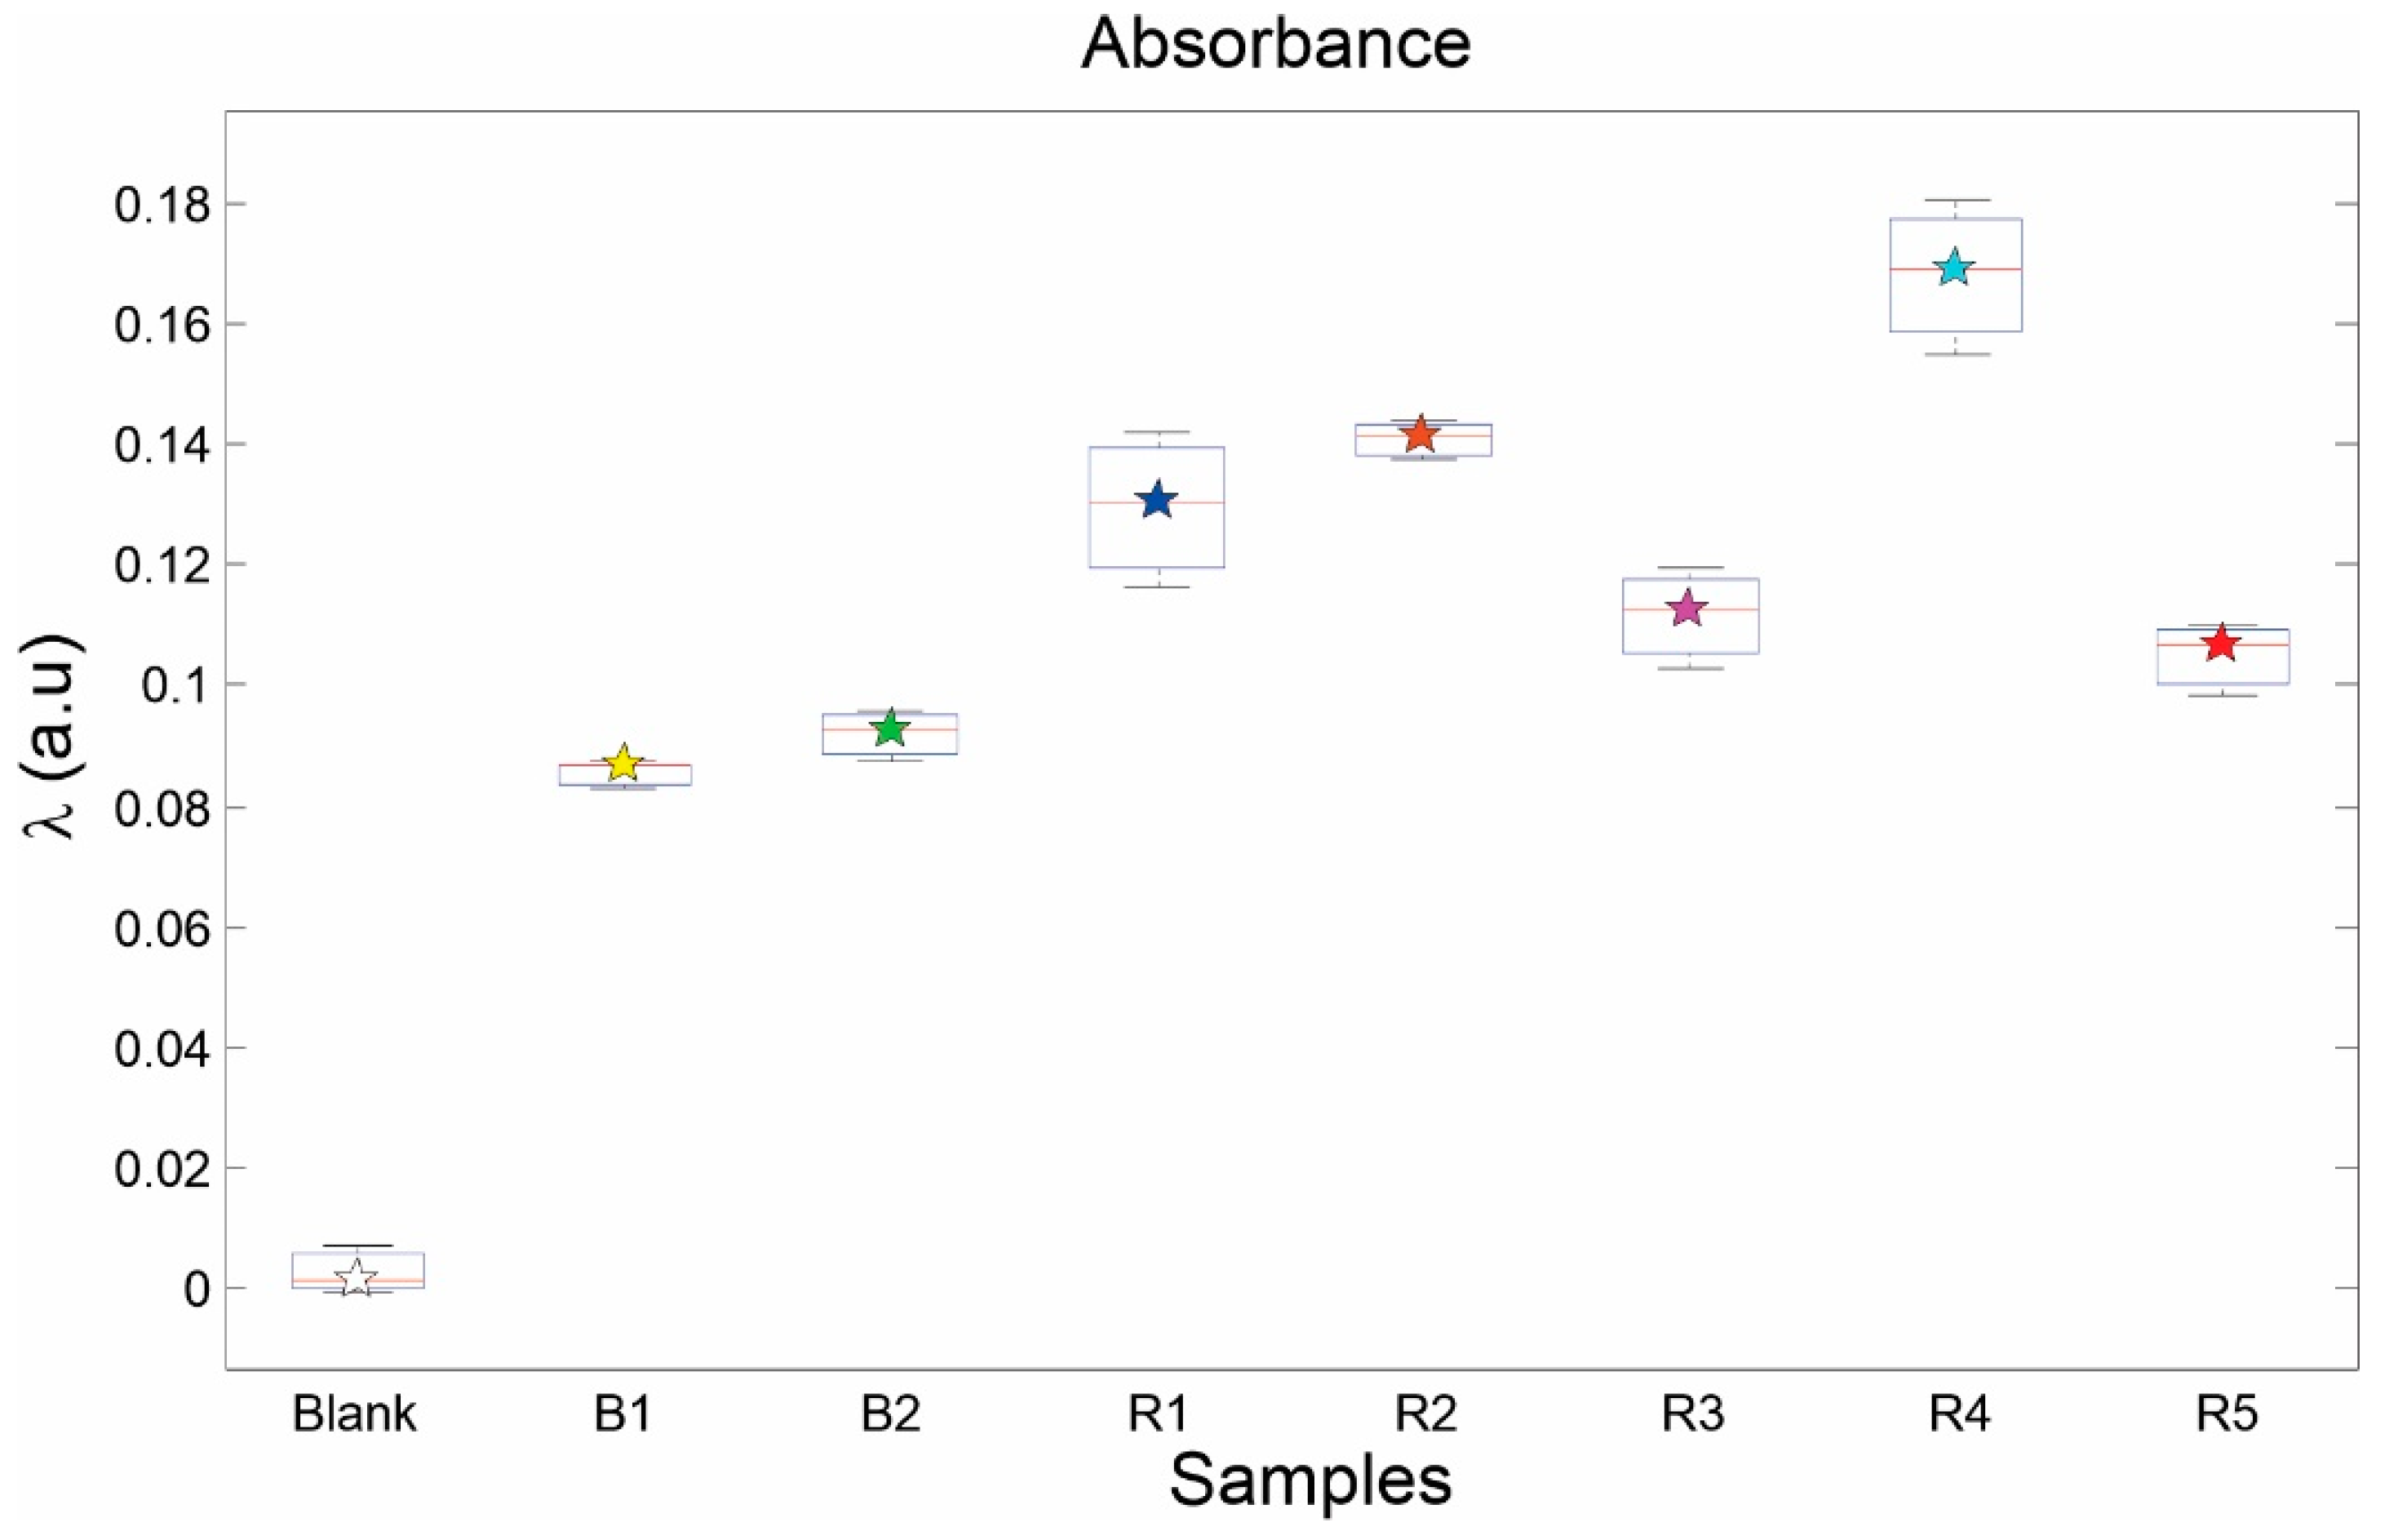
3. Results
4. Discussion
5. Conclusions
Author Contributions
Acknowledgments
Conflicts of Interest
References
- Consejo Regulador del Tequila. Available online: https://www.crt.org.mx/index.php/en/pages-2/proteccion-del-tequila-a-nivel-internacional (accessed on 12 October 2020).
- Norma Oficial Mexicana. In NOM-006-SCFI-2012. 2012. Available online: https://www.google.com.hk/url?sa=t&rct=j&q=&esrc=s&source=web&cd=&ved=2ahUKEwjNitD-05rtAhXSIqYKHfFKD_IQFjAAegQIBBAC&url=http%3A%2F%2Fwww.dof.gob.mx%2Fnota_detalle.php%3Fcodigo%3D5282165&usg=AOvVaw3bdv7GSVb4Wt2Fm0dxYk5x (accessed on 2 November 2020).
- Electronic Code of Federal Regulations. In Title 27, 5.22(g) Class 7; Agave Spirits. 1973. Available online: https://www.ecfr.gov/cgi-bin/text-idx?c=ecfr;sid=79589a2ef2d093ed0b73152fc7935f1b;rgn=div5;view=text;node=27%3A1.0.1.1.2;idno=27;cc=ecfr (accessed on 2 November 2020).
- Council of the European Union. Agreement between the European Community and the United Mexican States on the Mutual Recognition and Protection of Designations for Spirit Drinks; Council of the European Union: Brussels, Belgium, 1997. [Google Scholar]
- Villanueva-Rodríguez, S.J.; Rodríguez-Garay, B.; Prado-Ramírez, R.; Gschaedler, A. Tequila: Raw Material, Classification, Process, and Quality Parameters. In Encyclopedia of Food and Health; Caballero, B., Finglas, P.M., Toldrá, F., Eds.; Academic Press: Oxford, UK, 2016; pp. 283–289. [Google Scholar] [CrossRef]
- Prado-Jaramillo, N.; Estarrón-Espinosa, M.; Escalona-Buendía, H.; Cosío-Ramírez, R.; Martín-del-Campo, S.T. Volatile compounds generation during different stages of the Tequila production process. A preliminary study. LWT 2015, 61, 471–483. [Google Scholar] [CrossRef]
- Wu, D.; Sun, D.-W. Colour measurements by computer vision for food quality control—A review. Trends Food Sci. Technol. 2013, 29, 5–20. [Google Scholar] [CrossRef]
- Gomes, J.F.S.; Leta, F.R. Applications of computer vision techniques in the agriculture and food industry: A review. Eur. Food Res. Technol. 2012, 235, 989–1000. [Google Scholar] [CrossRef]
- Orlandi, G.; Calvini, R.; Pigani, L.; Foca, G.; Vasile Simone, G.; Antonelli, A.; Ulrici, A. Electronic eye for the prediction of parameters related to grape ripening. Talanta 2018, 186, 381–388. [Google Scholar] [CrossRef]
- Orlandi, G.; Calvini, R.; Foca, G.; Ulrici, A. Automated quantification of defective maize kernels by means of Multivariate Image Analysis. Food Control 2018, 85, 259–268. [Google Scholar] [CrossRef]
- Wu, D.; Sun, D.W. Food colour measurement using computer vision. In Instrumental Assessment of Food Sensory Quality; Kilcast, D., Ed.; Woodhead Publishing: Cambridge, UK, 2013. [Google Scholar] [CrossRef]
- Jia, J.; Wu, M.; Wang, S.; Wang, X.; Hu, Y.; Chen, H.; Yu, Y.; Shen, C.; Fu, H.; She, Y. Colorimetric sensor array based on silver deposition of gold nanorods for discrimination of Chinese white spirits. Sens. Actuators B Chem. 2020, 320, 128256. [Google Scholar] [CrossRef]
- Pessoa, K.D.; Suarez, W.T.; dos Reis, M.F.; de Oliveira Krambeck Franco, M.; Moreira, R.P.L.; dos Santos, V.B. A digital image method of spot tests for determination of copper in sugar cane spirits. Spectrochim. Acta A Mol. Biomol. Spectrosc. 2017, 185, 310–316. [Google Scholar] [CrossRef]
- Fu, L.; Duan, J.; Zou, X.; Lin, G.; Song, S.; Ji, B.; Yang, Z. Banana detection based on color and texture features in the natural environment. Comput. Electron. Agric. 2019, 167, 105057. [Google Scholar] [CrossRef]
- Fan, S.; Li, J.; Zhang, Y.; Tian, X.; Wang, Q.; He, X.; Zhang, C.; Huang, W. On line detection of defective apples using computer vision system combined with deep learning methods. J. Food Eng. 2020, 286, 110102. [Google Scholar] [CrossRef]
- Bhargava, A.; Bansal, A. Fruits and vegetables quality evaluation using computer vision: A review. J. King Saud Univ. Comp. Inf. Sci. 2018. [Google Scholar] [CrossRef]
- Zhao, Y.; Gong, L.; Zhou, B.; Huang, Y.; Liu, C. Detecting tomatoes in greenhouse scenes by combining AdaBoost classifier and colour analysis. Biosyst. Eng. 2016, 148, 127–137. [Google Scholar] [CrossRef]
- Wang, W.; Li, C. A multimodal machine vision system for quality inspection of onions. J. Food Eng. 2015, 166, 291–301. [Google Scholar] [CrossRef]
- Chen, S.; Xiong, J.; Guo, W.; Bu, R.; Zheng, Z.; Chen, Y.; Yang, Z.; Lin, R. Colored rice quality inspection system using machine vision. J. Cereal Sci. 2019, 88, 87–95. [Google Scholar] [CrossRef]
- Mebatsion, H.K.; Paliwal, J.; Jayas, D.S. Automatic classification of non-touching cereal grains in digital images using limited morphological and color features. Comput. Electron. Agric. 2013, 90, 99–105. [Google Scholar] [CrossRef]
- Tomasevic, I.; Tomovic, V.; Milovanovic, B.; Lorenzo, J.; Đorđević, V.; Karabasil, N.; Djekic, I. Comparison of a computer vision system vs. traditional colorimeter for color evaluation of meat products with various physical properties. Meat Sci. 2019, 148, 5–12. [Google Scholar] [CrossRef]
- Trinderup, C.H.; Dahl, A.; Jensen, K.; Carstensen, J.M.; Conradsen, K. Comparison of a multispectral vision system and a colorimeter for the assessment of meat color. Meat Sci. 2015, 102, 1–7. [Google Scholar] [CrossRef]
- Dowlati, M.; Mohtasebi, S.S.; Omid, M.; Razavi, S.H.; Jamzad, M.; De La Guardia, M. Freshness assessment of gilthead sea bream (Sparus aurata) by machine vision based on gill and eye color changes. J. Food Eng. 2013, 119, 277–287. [Google Scholar] [CrossRef]
- Balaban, M.Ö.; Alçiçek, Z. Use of polarized light in image analysis: Application to the analysis of fish eye color during storage. LWT 2015, 60, 365–371. [Google Scholar] [CrossRef]
- Balaban, M.O.; Misimi, E.; Ayvaz, Z. Quality Evaluation of Seafoods. In Computer Vision Technology for Food Quality Evaluation, 2nd ed.; Elsevier: Amsterdam, The Netherlands, 2016; pp. 243–270. [Google Scholar] [CrossRef]
- Leme, D.S.; da Silva, S.A.; Barbosa, B.H.G.; Borém, F.M.; Pereira, R.G.F.A. Recognition of coffee roasting degree using a computer vision system. Comput. Electron. Agric. 2019, 156, 312–317. [Google Scholar] [CrossRef]
- Rodríguez, J.P.; Corrales, D.C.; Aubertot, J.N.; Corrales, J.C. A computer vision system for automatic cherry beans detection on coffee trees. Pattern Recognit. Lett. 2020, 136, 142–153. [Google Scholar] [CrossRef]
- Huang, F.; Qi, Y.; Wang, C.; Wan, X. Show me the color in your mind: A study of color-flavor associations in virtual reality. Food Qual. Prefer. 2020, 85, 103969. [Google Scholar] [CrossRef]
- Jiang, H.; Xu, W.; Chen, Q. Determination of tea polyphenols in green tea by homemade color sensitive sensor combined with multivariate analysis. Food Chem. 2020, 319. [Google Scholar] [CrossRef] [PubMed]
- Buratti, S.; Malegori, C.; Benedetti, S.; Oliveri, P.; Giovanelli, G. E-nose, e-tongue and e-eye for edible olive oil characterization and shelf life assessment: A powerful data fusion approach. Talanta 2018, 182, 131–141. [Google Scholar] [CrossRef] [PubMed]
- Apetrei, C.; Apetrei, I.M.; Villanueva, S.; de Saja, J.A.; Gutierrez-Rosales, F.; Rodriguez-Mendez, M.L. Combination of an e-nose, an e-tongue and an e-eye for the characterisation of olive oils with different degree of bitterness. Anal. Chim. Acta 2010, 663, 91–97. [Google Scholar] [CrossRef] [PubMed]
- Spence, C. On the changing colour of food & drink. Int. J. Gastron. Food Sci. 2019, 17. [Google Scholar] [CrossRef]
- Mendoza, F.; Dejmek, P.; Aguilera, J.M. Calibrated color measurements of agricultural foods using image analysis. Postharvest Biol. Technol. 2006, 41, 285–295. [Google Scholar] [CrossRef]
- Xu, C. Electronic eye for food sensory evaluation. In Evaluation Technologies for Food Quality; Zhong, J., Wang, X., Eds.; Woodhead Publishing: Cambridge, UK, 2019; pp. 37–59. [Google Scholar] [CrossRef]
- Martínez-Hipatl, C.; Muñoz-Aguirre, S.; Muñoz-Guerrero, R.; Castillo-Mixcóatl, J.; Beltrán-Pérez, G.; Gutiérrez-Salgado, J.M. Optical system based on a CCD camera for ethanol detection. Meas. Sci. Technol. 2013, 24, 105003. [Google Scholar] [CrossRef]
- Capitán-Vallvey, L.F.; López-Ruiz, N.; Martínez-Olmos, A.; Erenas, M.M.; Palma, A.J. Recent developments in computer vision-based analytical chemistry: A tutorial review. Anal. Chim. Acta 2015, 899, 23–56. [Google Scholar] [CrossRef]
- Ware, C. Chapter Four—Color. In Information Visualization, 4th ed.; Ware, C., Ed.; Morgan Kaufmann: Burlington, MA, USA, 2021; pp. 95–141. [Google Scholar] [CrossRef]
- Bueno, D.; Valdez, L.F.; Gutiérrez Salgado, J.M.; Marty, J.L.; Muñoz, R. Colorimetric Analysis of Ochratoxin A in Beverage Samples. Sensors 2016, 16, 1888. [Google Scholar] [CrossRef]
- Gomez, A.I.; Gutiérrez, J.M.; Muñoz, R. Design of an optical portable system for detection of pH. In Proceedings of the 2018 Global Medical Engineering Physics Exchanges/Pan American Health Care Exchanges (GMEPE/PAHCE), Porto, Portugal, 19–24 March 2018; pp. 1–6. [Google Scholar]
- Anh Bui, D.; Hauser, P.C. Absorbance measurements with light-emitting diodes as sources: Silicon photodiodes or light-emitting diodes as detectors? Talanta 2013, 116, 1073–1078. [Google Scholar] [CrossRef]
- O’Toole, M.; Diamond, D. Absorbance based light emitting diode optical sensors and sensing devices. Sensors 2008, 8, 2453–2479. [Google Scholar] [CrossRef] [PubMed]
- Palencia, M.; Lerma, T.; Palencia, V. Description of fouling, surface changes and heterogeneity of membranes by color-based digital image analysis. J. Membr. Sci. 2016, 510, 229–237. [Google Scholar] [CrossRef]


| Type | Brand | Brand Tag | Alcoholic Strength (vol %) |
|---|---|---|---|
| Blanco | Hornitos | B1 | 38 |
| Blanco | Orendain | B2 | 38 |
| Reposado | Hornitos | R1 | 38 |
| Reposado | Jimador | R2 | 35 |
| Reposado | 100 años Agave Azul | R3 | 35 |
| Reposado | Don Ramón | R4 | 35 |
| Reposado | Jarana | R5 | 35 |
| Average Components of RGB Vector | Average Intensity (RGB) | Absorbanceλ | |||
|---|---|---|---|---|---|
| Brand Tag | R | G | B | ||
| Blank | 255 | 251 ± 4.0970 | 253 ± 3.4674 | 253 | 0.0016 ± 0.0038 |
| B1 | 214 ± 0.91 | 204 ± 0.8581 | 206 ± 1.2337 | 208 ± 1.006 | 0.0867 ± 0.0021 |
| B2 | 214 ± 1.9303 | 205 ± 1.8688 | 196 ± 2.077 | 205 ± 1.9589 | 0.0928 ± 00.42 |
| R1 | 196 ± 5.9285 | 187 ± 5.1556 | 181 ± 5.6821 | 188 ± 5.5887 | 0.1304 ± 0.129 |
| R2 | 192 ± 1.3674 | 180 ± 1.5104 | 178 ± 1.3740 | 183 ± 1.4172 | 0.1415 ± 0.0034 |
| R3 | 210 ± 4.144 | 194 ± 3.8391 | 185 ± 3.2486 | 196 ± 3.7440 | 0.1125 ± 0.0083 |
| R4 | 190 ± 6.0422 | 172 ± 4.7693 | 154 ± 4.3530 | 172 ± 5.0548 | 0.1688 ± 0.0128 |
| R5 | 209 ± 2.4598 | 199 ± 2.5813 | 188 ± 3.0035 | 199 ± 2.6815 | 0.1066 ± 0.0059 |
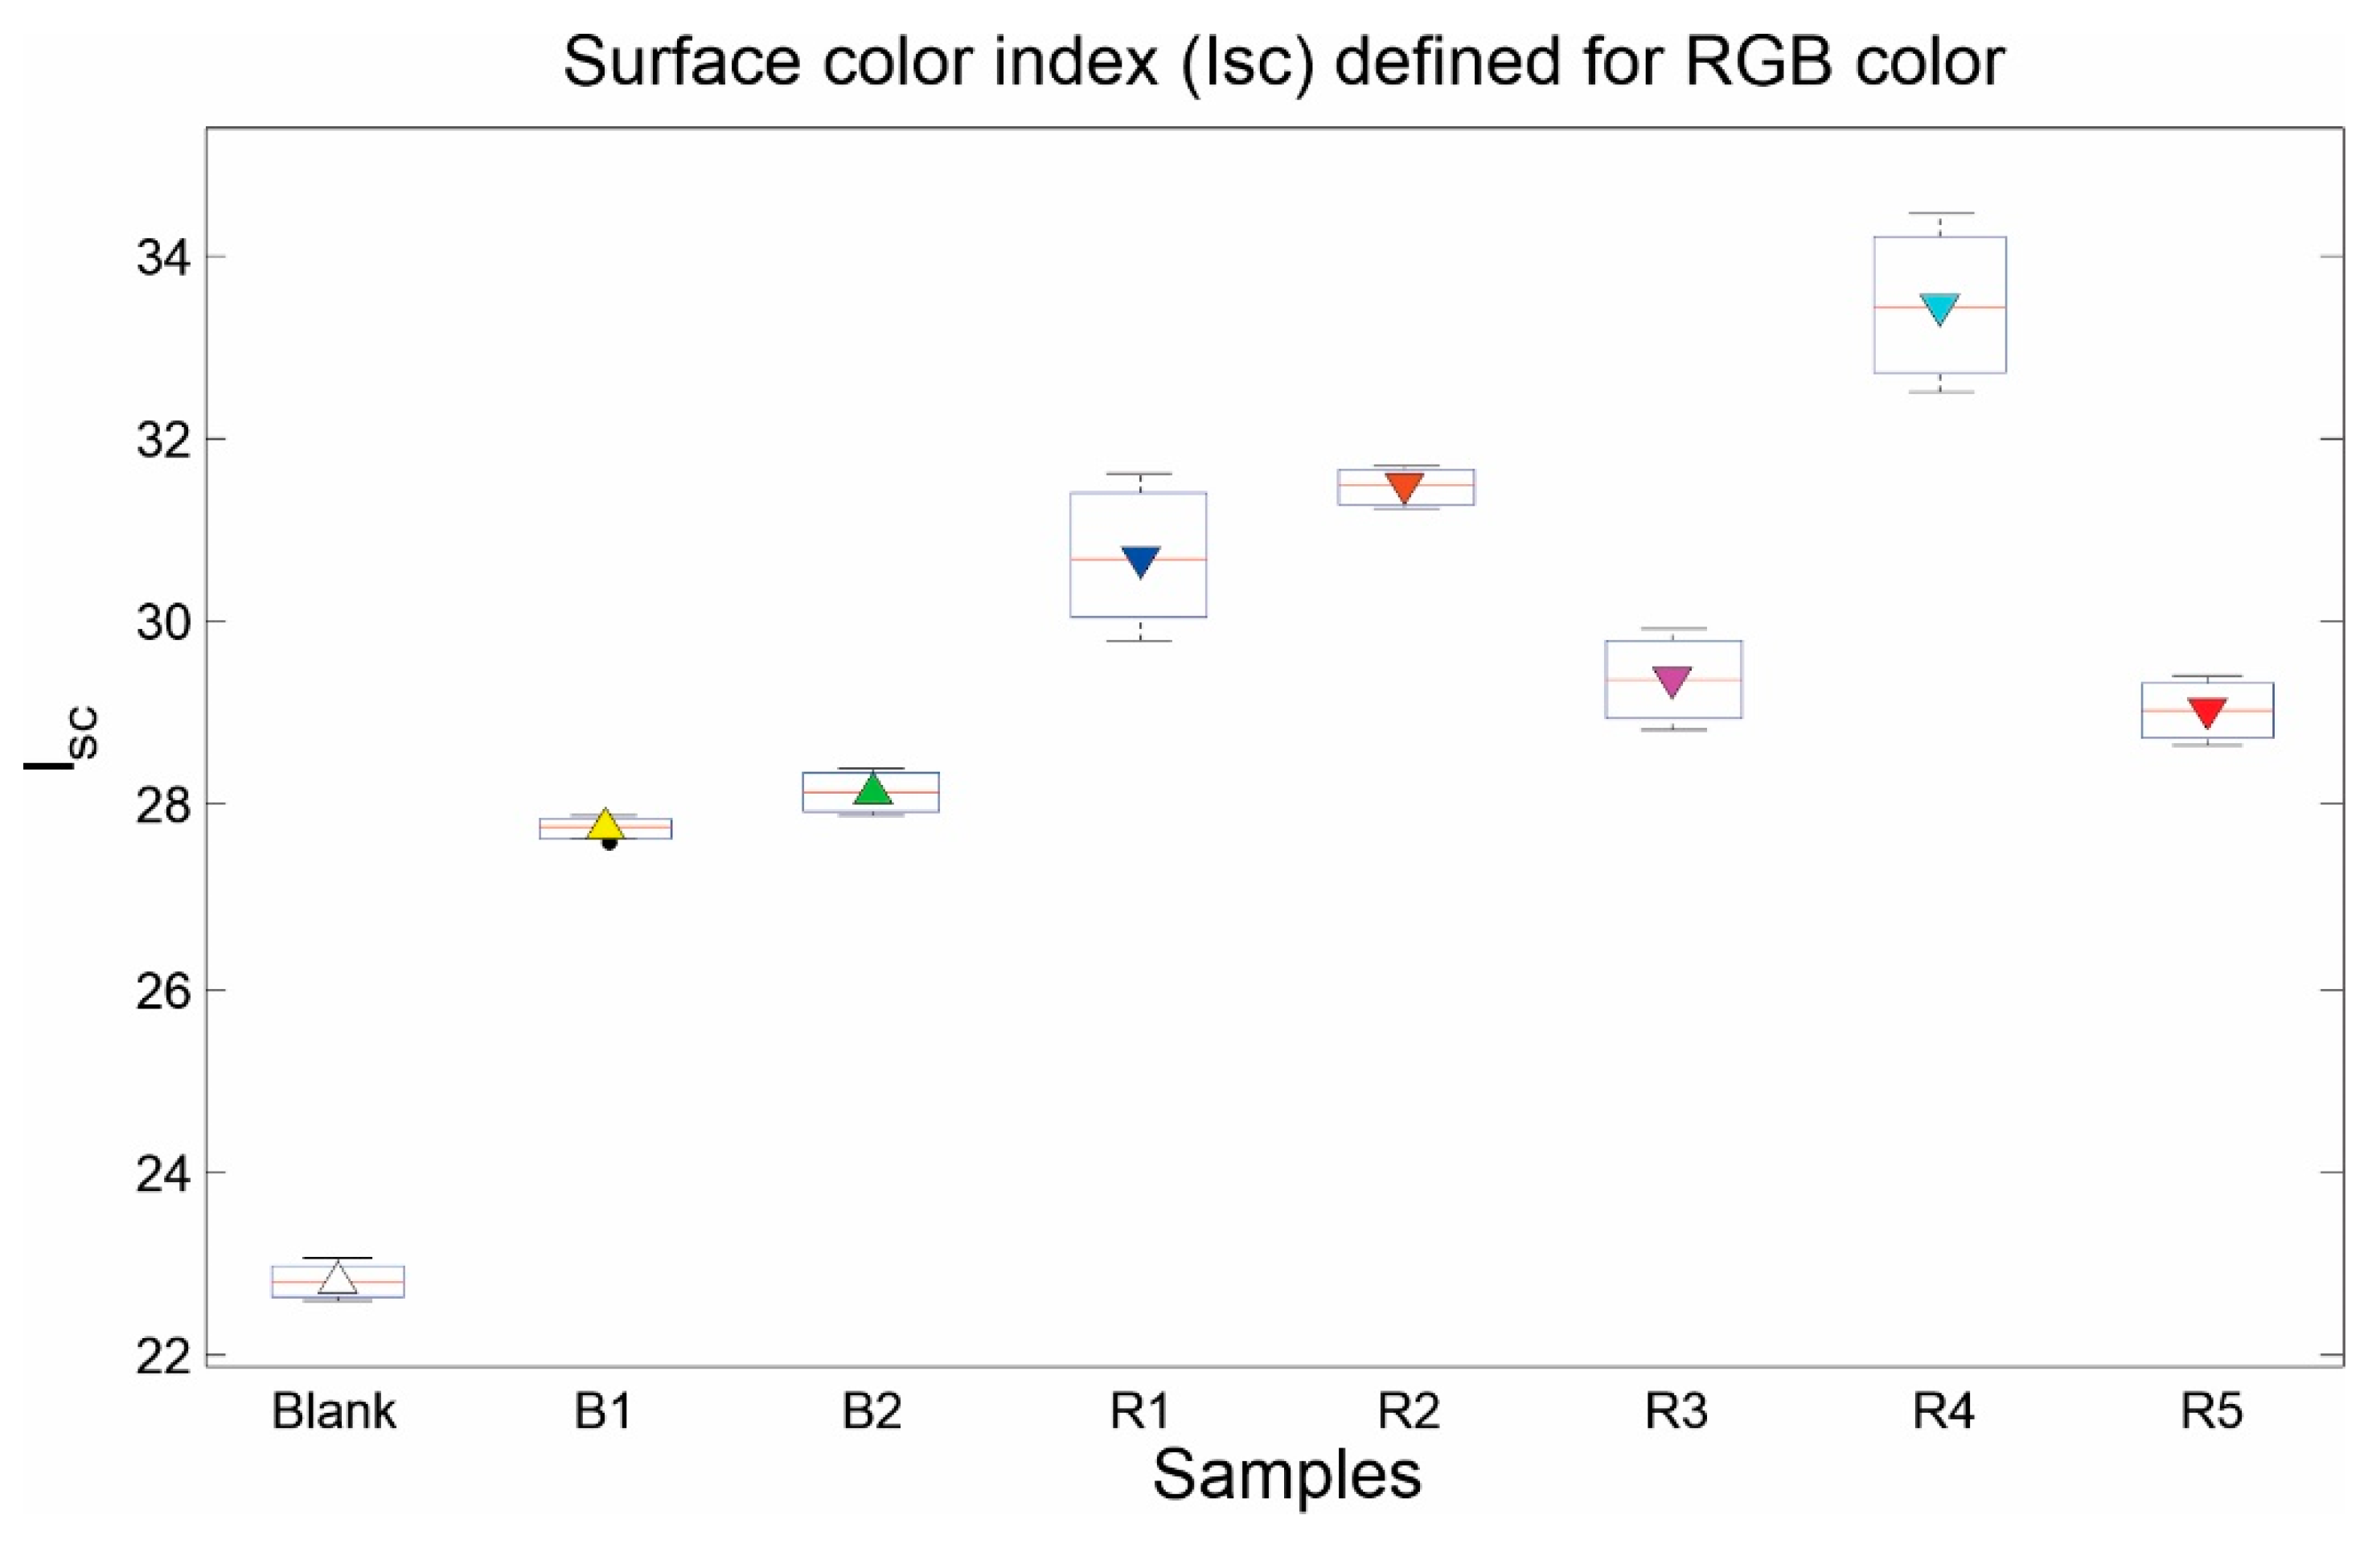
| Average Components of RGB Vector | Isc | |||
|---|---|---|---|---|
| Brand Tag | R | G | B | |
| Blank | 255 | 251 ± 4.0970 | 253 ± 3.4674 | 0.0016 ± 0.0038 |
| B1 | 214 ± 0.91 | 204 ± 0.8581 | 206 ± 1.2337 | 27.8 ± 1.3335 |
| B2 | 214 ± 1.9303 | 205 ± 1.8688 | 196 ± 2.077 | 28.1 ± 2.6833 |
| R1 | 196 ± 5.9285 | 187 ± 5.1556 | 181 ± 5.6821 | 30.7 ± 9.1298 |
| R2 | 192 ± 1.3674 | 180 ± 1.5104 | 178 ± 1.3740 | 31.5 ± 2.4289 |
| R3 | 210 ± 4.144 | 194 ± 3.8391 | 185 ± 3.2486 | 29.4 ± 5.6141 |
| R4 | 190 ± 6.0422 | 172 ± 4.7693 | 154 ± 4.3530 | 33.4 ± 9.8801 |
| R5 | 209 ± 2.4598 | 199 ± 2.5813 | 188 ± 3.0035 | 29.0 ± 3.8982 |
Publisher’s Note: MDPI stays neutral with regard to jurisdictional claims in published maps and institutional affiliations. |
© 2020 by the authors. Licensee MDPI, Basel, Switzerland. This article is an open access article distributed under the terms and conditions of the Creative Commons Attribution (CC BY) license (https://creativecommons.org/licenses/by/4.0/).
Share and Cite
Gómez, A.; Bueno, D.; Gutiérrez, J.M. Electronic Eye for Identification of Tequila Samples. Proceedings 2020, 60, 44. https://doi.org/10.3390/IECB2020-07073
Gómez A, Bueno D, Gutiérrez JM. Electronic Eye for Identification of Tequila Samples. Proceedings. 2020; 60(1):44. https://doi.org/10.3390/IECB2020-07073
Chicago/Turabian StyleGómez, Anais, Diana Bueno, and Juan Manuel Gutiérrez. 2020. "Electronic Eye for Identification of Tequila Samples" Proceedings 60, no. 1: 44. https://doi.org/10.3390/IECB2020-07073
APA StyleGómez, A., Bueno, D., & Gutiérrez, J. M. (2020). Electronic Eye for Identification of Tequila Samples. Proceedings, 60(1), 44. https://doi.org/10.3390/IECB2020-07073