Abstract
Silver nanoclusters (AgNCs) generated on DNA templates belong to a new class of fluorescent tags showing excellent brightness, photostability and biocompatibility. Thus, AgNCs-DNA has been applied in various applications, from the detection of DNA/RNA and environmental monitoring to bioimaging and cancer therapy. In this work, we report fluorescent AgNCs synthesized using two 1,3-diaza-2-oxophenothiazine (tC)-modified oligonucleotides that contain RET-related sequence CCCCGCCCCGCCCCGCCCCA. The communication compares the absorption and emission properties of the obtained systems with silver nanoclusters synthesized on the unmodified oligonucleotide. First, we showed the optimal conditions for AgNCs-DNA synthesis on three DNA templates: (1) RET20 with the sequence 5′-CCC CGC CCC GCC CCG CCC CA-3′; (2) RET19tC with the sequence 5′-CCC CGC CCC GCC CCG CCC tCA-3′; and (3) RET14tC with the sequence 5′-CCC CGC CCC GCC CtCG CCC CA-3′. Next, the silver nanoclusters were characterized by UV/Vis absorption, fluorescence and circular dichroism spectroscopy. Silver nanoclusters RET19tC-AgNCs and RET14tC-AgNCs indicated several times higher fluorescence intensities in the long-wave emission spectra as compared to RET20-AgNCs. Moreover, silver nanoclusters on tC-modified oligonucleotides showed higher stability over time. The possibility of using the silver nanoclusters RET19tC-AgNCs for monitoring pH changes will be also tested.
1. Introduction
In recent years, enormous progress has been made in the development of new fluorescent nanomaterials such as quantum dots (QDs) [1], nanodiamonds (NDs) [2], carbon nanodots (C-dots) [3], graphene oxide (GO) [4], carbon nanotubes (CNTs) [5], lanthanide-based upconversion nanoparticles (UCNPs) [6], luminescent metal organic frameworks (MOFs) [7], molecularly imprinted polymers (MIPs) [8], aggregation-induced emission dots (AIE dots) [9] or metal nanoclusters (NCs) [10].
The creation of metal nanoclusters requires an appropriate scaffold/matrix, the role of which can be played by peptides, proteins, dendrimers, polymers, thiols and DNA fragments [10]. Due to the high binding affinity of Ag+ ions to nucleobases (especially cytosines) [11,12], DNA oligonucleotides are successfully used as a template for the synthesis of silver nanoclusters [13,14,15]. The facile synthesis of silver nanoclusters (AgNCs) on DNA templates as well as their excellent brightness, good photostability and biocompatibility, and small size compared to other fluorophores such as quantum dots or organic dyes make them the subject of extensive research [16,17]. Moreover, AgNCs-DNA has been applied in various applications, from the detection of metal ions, small biomolecules (for example, ATP, adenosine, biological thiols and theophylline), DNA/RNA and environmental monitoring to bioimaging and cancer therapy [10,15,16].
The aim of our research was to verify the influence of the fluorescent 1,3-diaza-2-oxophenothiazine, tC on the absorption and emission properties of AgNCs synthesized by using tC-modified oligonucleotides that contain RET-related sequence CCCCGCCCCGCCCCGCCCCA [18]. In the presented work, we compare the absorption and emission properties of the obtained systems with silver nanoclusters synthesized on the unmodified oligonucleotide with the RET-related sequence. The oligonucleotides of choice are able to form four-stranded DNA structures called i-motifs [18,19,20]. The implications coming from fact using the folded i-motif structure as a template for the synthesis of silver nanoclusters will be also presented and discussed.
2. Materials and Methods
The oligonucleotides used in this study were synthesized and purified by Future Synthesis (Poznan, Poland) using high-performance liquid chromatography (Prominence HPLC) (Shimadzu, Kyoto, Japan). All other reagents were purchased from Sigma Aldrich (St. Louis, MO, USA) and were used as received. Milli-Q ultrapure water was used in all experiments.
Silver nanoclusters were synthesized following the literature procedure [14]. First, the 2.0 μM solution of the chosen oligonucleotide was prepared in advance in 10 mM Tris-acetate (pH 7.5 or 5.5). Then, the appropriate volume of 10 mM AgNO3 solution was added into the prepared oligonucleotide solution (1:1, Ag+/C base, molar ratio or indicated as different). Next, after incubating at 4 °C for 15 min, the freshly prepared NaBH4 solution was added to the above mixture and shaken vigorously for 1 min (1:1, Ag+/NaBH4, molar ratio) to reduce silver ions and to form AgNCs on DNA. Finally, the obtained solution was further stored in the dark at 4 °C for at least 1h to prepare stable DNA-AgNCs.
Spectroscopy measurements of fluorescent DNA-AgNCs were performed at 25 °C using 2 µM solutions of RET-related oligonucleotides in 10 mM Tris-acetate buffer (pH 7.5 or 5.5) as follows:
Absorption spectra of samples were recorded in the spectral range of 200–800 nm by means of Jasco V-750 spectrophotometer (Jasco, Tokyo, Japan).
Circular dichroism (CD) spectra of samples were recorded on a Jasco J-820 spectropolarimeter (Jasco, Tokyo, Japan) with a connected temperature controller (PTC-423L). The CD spectra were obtained by taking the average of three scans in the range of 400–200 nm, with a scan rate of 500 nm/min.
Fluorescence spectra were measured on a Jasco spectrofluorimeter FP-8200 (Jasco, Tokyo, Japan) with 10 nm excitation and 10 nm emission slits and were carried out using 0.4 × 1 cm quartz cuvettes containing 1 ml of solution. Emission and excitation spectra of samples were recorded in the 270–750 nm range using λex = 260 nm, λex = 395 nm, λex = 550 nm and λem = 605 nm, respectively.
3. Results
The DNA template used for the synthesis of silver nanoclusters (AgNCs) was cytosine-rich (C-rich) oligonucleotide related to the RET sequence: 5′-CCCCGCCCCGCCCCGCCCCA-3′ (RET20) [18]. In this work, we also report fluorescent AgNCs synthesized on tC-modified oligonucleotides that contain the same RET-related sequence: 5′-CCCCGCCCCGCCCCGCCCtCA-3′ (RET19tC) and 5′-CCCCGCCCCGCCCtCGCCCCA-3′ (RET14tC) [20]. 1,3-diaz-2-oxophenoxazine, tC is a tricyclic cytosine analog, which is a highly fluorescent marker with an absorption maximum at 385 nm and an emission maximum at 500 nm [21]. Each C-rich oligonucleotide of choice for this study is able to form a four-stranded structure (an i-motif) in acidic solutions. In our previous work, we indicated that the pH value of conformational transition (pHT) of RET20 (unmodified) is equal to 7.1 [20]. Therefore, we performed the optimization of RET20 silver nanoclusters (RET20-AgNCs) synthesis in buffer solutions, pH 7.5.
3.1. Optimization Conditions of RET20-AgNCs Synthesis
The first synthesis of AgNCs on a DNA template rich in cytosine bases (5′-AGGTCGCCGCCC-3′) was performed by Dickson et al. in 2004 [13]. Since then it has been proven that DNA-AgNCs emission can be controlled by changing the experimental conditions (i.e., pH, type of buffer, salt addition and concentration of reagents) [22,23] or using DNA sequences that differ in length, composition and structure [24,25]. We synthesized the RET20-AgNCs nanoclusters by adding sodium borohydride to the mixture of silver nitrate and the oligonucleotide with RET-related sequence CCCCGCCCCGCCCCGCCCCA under air, as described in the literature [14]. The formation of the nanoclusters during the reduction step was evident from the appearance of a yellowish color. Several electronic transitions were also observed in the absorption spectra of the RET20-AgNCs nanoclusters (Figure 1a). A primary distinguishing feature of the nanoclusters is their strong peak at 440 nm that is red-shifted and narrower relative to the plasmon transition of the nanoparticles, which only displays one broad peak with a maximum at 405 nm [14]. Figure 1b shows the emission spectra of the as-prepared RET20-AgNCs with excitation at 260 nm, which is near the absorption maxima of DNA bases. Initially, the spectrum is dominated by the red emission with an apparent maximum at λmax ca. 600 nm and a shoulder at lower wavelengths (black line, Figure 1b). Moreover, the evaluation of the emission spectra over time indicates that “red emission” is decreasing in contrary to “green emission”. Two bands with different spectral parameters (“green” and “red” emitters) have been previously observed and assigned to small silver nanoclusters according to theoretical and experimental studies [14,26,27,28].
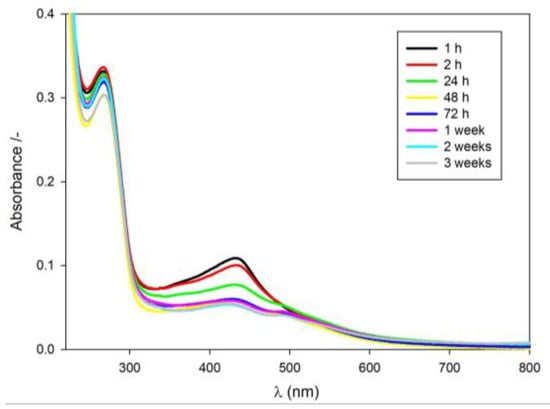
Figure 1.
Spectroscopic spectra of RET20-AgNCs prepared using different Ag+ to cytosine ratio: (a) absorption spectra, 1:1 Ag+/C; (b) emission spectra, 1:1 Ag+/C; (c) emission spectra, 0.5:1 Ag+/C; (d) emission spectra, 2:1 Ag+/C. Excitation wavelength set at λex = 260 nm. The samples were prepared in Tris-acetate buffer solution (10 mM, pH 7.5).
Knowing that the Ag+/DNA molar ratio determines the fluorescence intensity [22,29,30,31], we tested the three different Ag+/DNA molar ratios for preparation of the RET20-AgNCs nanoclusters. The RET20-AgNCs were prepared at 1:1, 0.5:1, 2:1 molar ratios of Ag+/cytosine (C) bases. As expected, the Ag+/C molar ratio influenced RET20-AgNCs fluorescence intensity as well as the proportion between “red” and “green” emission (compare black lines in Figure 1b–d). Moreover, the emission spectra of RET20-AgNCs with excitation at 550 nm revealed that nanoclusters prepared at a 1:1 Ag+/C molar ratio showed the highest fluorescence intensity values after 24 since reduction comparing with the ones prepared at 0.5:1 or 2:1 molar ratio (Ag+/C).
As mentioned, depending on the preparation conditions, the AgNCs on a DNA template can exhibit different photoluminescence characteristics. Therefore, we not only tested the effect of the Ag+/DNA molar ratio on spectral properties of RET20-AgNCs but also the effects of:
The Ag+ to sodium nitrate molar ratio;
The time gap between the addition of Ag+ and sodium nitrate to RET20 in buffer solution;
RET20 concentration.
As a result, the following conditions were selected: DNA/Ag+ 1:1 molar ratio; 2 µM DNA; and Ag+/BH4-1 1:1 molar ratio with a 15-minute gap time between the addition of AgNO3 and NaBH4 to DNA template solution. After selecting the optimal synthesis conditions, we conducted the experiments to assess the effect of tC (1,3-diaza-2-oxophenothiazine) substitution position (modified sequences) on the formation and emission of RET20-AgNCs.
3.2. Effect of tC on RET20-AgNCs Nanoclusters
For our purpose, we used two tC-modified fluorescent oligonucleotides containing RET-related sequence CCCCGCCCCGCCCCGCCCCA. The oligonucleotides are named RET14tC and RET19tC due to the position of the tC analog in the chain.
3.2.1. Monitoring the Formation of Nanoclusters on RET-Related Templates
We measured circular dichroism (CD) and UV/Vis absorption spectra to prove the formation of silver nanoparticles templated by tC-modified RET20 oligonucleotides. CD spectra provide diagnostic signatures for the presence of secondary structures in the single-stranded DNA sequence [32]. A characteristic positive peak at ~288 nm and a negative peak at ~263 nm, with crossover at ~273 nm, indicate the formation of an i-motif structure (Figure 2a) [32,33,34]. As seen in Figure 2c,d, the absorption spectra of freshly prepared AgRET19tC-AgNCs and RET14tC-AgNCs exhibit the peak with a local maximum at 440 nm and 425 nm, respectively. In both cases, the long-wave absorption band at ~500 nm is observed within 24 h after the reduction step. These bands are all considered indicative of genuine nanoclusters because they are not present in the case of silver nanoparticles formation, which only absorb with one broad peak at λmax = 405 nm [14]. Moreover, in the case of RET19tC-AgNCs, the intensity of the band at a wavelength of about 400 nm has increased within time and after another 24h is even higher than the band at 425 nm nanoclusters. Analogous to the evolution of the absorption spectra, the CD spectra also change upon reduction of the Ag+ (Figure 2). The differences between the spectra in Figure 2 indicate that the silver nanoclusters induce different structural changes in RET20, RET14tC and RET19 tC samples than does Ag+. First, the CD spectra of RET20, RET14tC and RET19 tC in buffer solution pH 7.5 (black line, Figure 2b,d,f) show the positive peak around 280 nm coming from predominantly unstructured cytosine oligonucleotides [33,35]. Binding of Ag+ with the cytosines significantly affects the DNA conformation, which manifests as two strong peaks with negative ellipticity developed at 220 nm and 265 nm and positive peak shifted to 290 nm (red line, Figure 2b,d,f). These results are consistent with our previous studies upon silver nanoclusters templated on oligonucleotides containing twelve cytosines [31]. The reduction of Ag+ ions by BH4-1 only gives a decrease in the intensity of negative bands (220 nm and 265 nm) (green line, Figure 2b,d,f). These elliptical changes suggest that nanoclusters retain the chirality of the DNA template.
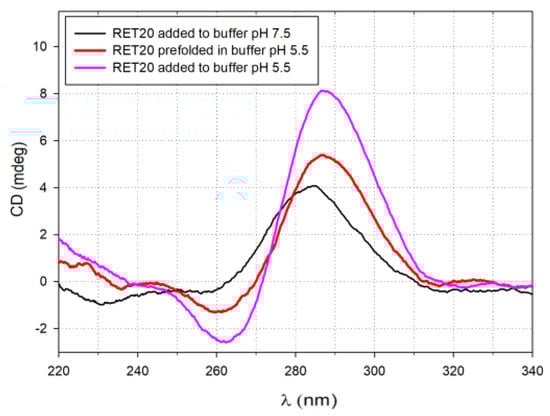
Figure 2.
Monitoring the structural changes during the formation of AgNCs: (a) circular dichroism (CD) spectra of RET20 in acidic and alkaline buffers; (b) CD spectra of RET20-AgNCs; (c) absorption spectra of RET19tC-AgNCs; (d) CD spectra of RET19tC-AgNCs; (e) absorption spectra of RET14tC-AgNCs; (f) CD spectra of RET14tC-AgNCs. All AgNCs were prepared in Tris-acetate buffer solution (10 mM, pH 7.5) using 1:1 Ag+/C.
3.2.2. Fluorescence Properties of Nanoclusters on RET-Related Templates
The excitation of tC-modified RET20 in slightly basic solution by using 260 nm results in fluorescence with two strong emission bands with λmax = 348 nm and λmax = 509 nm (Figure 3a,c). It is also worth noting that the fluorescence intensities of RET19tC-AgNCs and RET14tC-AgNCs are several times higher than RET20-AgNCs (compare Figure 3a or c with Figure 1b). Except for the major peak situated at λmax = 509 nm in emission spectra of RET19tC-AgNCs (Figure 3a), one can notice a shoulder at higher wavelengths that confirms the presence of “red” fluorescence as well. The small amount of “red” fluorescence was also detected in the emission spectra of RET14tC-AgNCs excited directly at 550 nm (data not shown). All tested AgNCs were also excited at λex = 395 nm, as this wavelength is absorbed by tC. The obtained emission spectra indicated that the strong fluorescence of RET19tC-AgNCs as well as of RET14tC-AgNCs coming from excited tC is affected by the addition of Ag+ (red line, Figure 3b,d). In both cases, the binding of Ag+ causes a slight redshift and a decrease of tC emission spectra. These results are in good agreement with previous results indicating that protonation of tC fluorophore (tC-H+) is accompanied by a redshift as well as a decrease in fluorescence intensity. Further reduction of Ag+ to Ag0 and nanoclusters formation is accompanied by the quenching fluorescence emission of tC (green line, Figure 3b,d). Comparing the emission spectra of RET14tC-AgNCs (exciting at 395 nm or 260 nm) with RET20-AgNCs, it seems that in the case of RET14tC-AgNCs the “green” fluorescence comes rather from Ag0/tC than from Ag0/cytosines nanoclusters. The same hypothesis can be assigned to RET19tC-AgNCs.
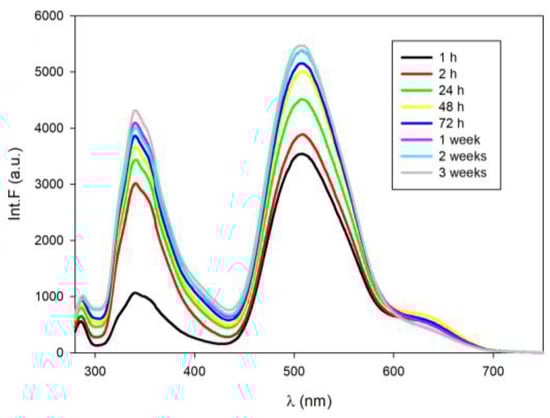
Figure 3.
Fluorescence spectra of AgNCs obtained on tC-modified RET20 oligonucleotides: (a) emission spectra of RET19tC-AgNCs, excited at 260 nm; (b) emission spectra of RET19tC-AgNCs, excited at 395 nm; (c) emission spectra of RET14tC-AgNCs, excited at 260 nm; (d) emission spectra of RET14tC-AgNCs, excited at 395nm. The samples were prepared in Tris-acetate buffer solution (10 mM, pH 7.5).
3.3. I-Motif as Template for Silver Nanoclusters
The synthesis of fluorescent silver nanoclusters on RET20 as well as RET19tC template was proceeded by the i-motifs formation in acidic conditions (buffer solution pH 5.5). As previously, the AgNCs formation was manifested by the observable color change of the solution from transparent into yellowish within just a few hours after the addition of AgNO3 and NaBH4 as reducing agents to the folded i-motifs. I-motif-templated silver nanoclusters fluoresce as several emission bands were clearly seen upon excitation at 260 nm wavelength. Therefore, a few emission bands with λmax ca. = 338 nm, λmax ca. 415 nm and λmax ca. 525 nm with a shoulder at ca. 605 nm were obtained for freshly prepared RET20-AgNCs (Figure 4a); whereas for RET19tC-AgNCs only two emission bands were seen with λmax ca. 348 nm and λmax ca. 509 nm (Figure 4c). Importantly, the overall fluorescence of RET19tC-AgNCs is several times higher than that of RET20-AgNCs regardless of the initial secondary structure used (please compare Figure 1a with Figure 3a or Figure 4a with Figure 4c). Both RET20-AgNCs and RET19tC-AgNCs nanoclusters (in buffer pH 5.5) were excited at λex = 395 nm, which is the wavelength absorbed by the fluorescent cytosine derivative tC (Figure 4b,d). As expected, tC-modified RET20 in acidic solution showed an emission band with λmax = 520 nm coming from tC-H+ fluorophore (black line, Figure 4d) [20]. Note that the addition of Ag+ causes a slight blueshift and remarkable enhancement (four times higher intensity) of tC emission spectrum (red line, Figure 4d). These results also indicate that Ag+ replaces H+ bound to tC fluorophore, which is in good agreement with previous results indicating that protonation of tC fluorophore (tC-H+) is accompanied by a redshift and decreasing in fluorescence intensity [20]. Further reduction of Ag+ to Ag0 and RET19tC-AgNCs nanoclusters formation is manifested by quenching fluorescence emission almost to the initial level, however without a redshift. Comparing the emission spectra of RET19tC-AgNCs (excited at 395 nm or 260 nm) with RET20-AgNCs, it seems that in the case of RET19tC-AgNCs only a slight amount of “green” fluorescence comes from Ag0/cytosines nanoclusters.
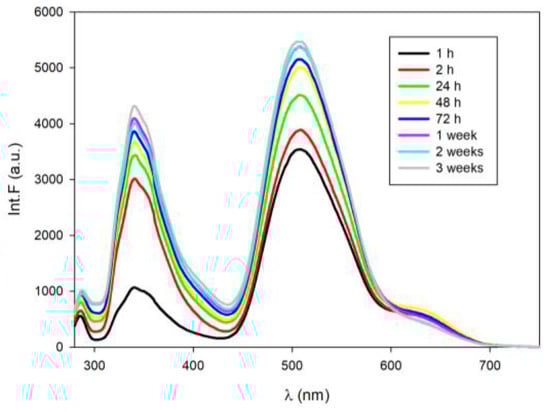
Figure 4.
Fluorescence spectra of AgNCs obtained on i-motifs: (a) emission spectra of RET20-AgNCs, excited at 260 nm; (b) emission spectra of RET20-AgNCs, excited at 395 nm; (c) emission spectra of RET19tC-AgNCs, excited at 260 nm; (d) emission spectra of RET19tC-AgNCs, excited at 395 nm. The i-motifs were folded a day before, in Tris-acetate buffer solution (10 mM, pH 5.5). All AgNCs were prepared using 1:1 Ag+/C.
4. Discussion
DNA-AgNCs silver nanoclusters were synthesized on three single-stranded DNA (ssDNA) templates with the RET-related sequence C4GC4GC4GC4A, two of which contained the single cytosine fluorescent analog 1,3-diaza-2-oxophenothiazine (tC) substituted at the 14th or 19th position from the 5′ end. The presence of tC in the oligonucleotide sequence has a significant influence not only on the spectroscopic properties of RET-AgNCs but also on their stability. After the addition of NaBH4 to the Ag+-RET complex, the high reduction capacity of the solution promotes the formation of reduced silver nanoclusters with “green” as well as “red” emission. The red fluorescence intensities of RET20-AgNCs prepared at slightly alkaline pH are higher than the ones obtained in an acidic environment and regardless of the buffer solution pH, the population of “red” emitting RET20-AgNCs (605 nm) decreases contrary to the increasing population of “green” emitting RET20-AgNCs (520 nm). The emission spectra of RET19tC-AgNCs and RET14tC-AgNCs exhibited fluorescence several times higher in the long-term range than RET20-AgNCs. The reduction of Ag+ to Ag0 in RET14tC-Ag+ or RET19tC –Ag+ complexes leads to the nanoclusters formation, which is manifested by fluorescence quenching. Comparing the emission spectra of RET14tC-AgNCs or RET19tC–AgNCs (excited at 395 nm or 260 nm) with RET20-AgNCs, it seems that in the case of AgNCs templated on tC-modified ssDNA only a slight amount of “green” fluorescence comes from Ag0/cytosines nanoclusters.
Taking into account our previous studies revealing that the analytical response of probes based on RET14tC as well as RET19tC oligonucleotides to pH changes depends on the difference between fluorescence quantum yield of tC in ssDNA and in i-motif [20], we decided to test the ability of silver nanoclusters templated on the mentioned oligonucleotides to serve as pH probe. Therefore, AgNCs obtained on RET19tC template, prefolded in acidic buffer solution, were titrated with 0.5 M NaOH. The preliminary results indicate that the system is not sensitive to small pH changes, however, an increase in the fluorescence signal was observed in a clearly higher pH value. In order to learn more about the synthesized AgNCs and to evaluate their potential as a sensor, additional experiments should be performed, such as the measurement of subsequent absorption, fluorescence and CD spectra of RET19tC-AgNCs and RET14tC-AgNCs in different temperatures and pH solutions (dynamic approach).
What is important, we observed that the presence of tC in RET oligonucleotides results in the highest stability of RET19tC-AgNCs. In view of these advantages, it is worth introducing the tC tag into the oligonucleotide sequence as it will not disturb the original structure. This means that the stability of DNA-AgNCs can be preserved and even better regardless of the fact that cytosine has been replaced by tC.
5. Conclusions
Further studies concerning the influence of the position of the fluorescent cytosine analog (for example, tC) in cytosine-rich ssDNA template (especially folded into i-motif) on the stability as well as the distribution of “green” and “red” emitting population of fluorescent silver nanoclusters should be undertaken.
Author Contributions
A.D. conceived and designed the study. A.D. and A.Ś. supervised the project. A.B. carried out experiments and prepared the first version of the figures. All authors analyzed the data. A.D. interpreted data and wrote the manuscript. All authors approved the final version of the manuscript. All authors have read and agreed to the published version of the manuscript.
Acknowledgments
Authors thank Patrycja Bielecka for providing oligonucleotides used in this study.
Conflicts of Interest
The authors declare no conflict of interest.
References
- Petryayeva, E.; Algar, W.R.; Medintz, I.L. Quantum Dots in Bioanalysis: A Review of Applications across Various Platforms for Fluorescence Spectroscopy and Imaging. Appl. Spectrosc. 2013, 67, 215–252. [Google Scholar] [CrossRef] [PubMed]
- Mochalin, V.N.; Shenderova, O.; Ho, D.; Gogotsi, Y. The Properties and Applications of Nanodiamonds. Nat. Nanotechnol. 2012, 7, 11–23. [Google Scholar] [CrossRef] [PubMed]
- Baker, S.N.; Baker, G.A. Luminescent Carbon Nanodots: Emergent Nanolights. Angew. Chem. Int. Ed. 2010, 49, 6726–6744. [Google Scholar] [CrossRef] [PubMed]
- Loh, K.P.; Bao, Q.L.; Eda, G.; Chhowalla, M. Graphene Oxide as a Chemically Tunable Platform for Optical Applications. Nat. Chem. 2010, 2, 1015–1024. [Google Scholar] [CrossRef]
- Wu, H.C.; Chang, X.L.; Liu, L.; Zhao, F.; Zhao, Y.L. Chemistry of Carbon Nanotubes in Biomedical Applications. J. Mater. Chem. 2010, 20, 1036–1052. [Google Scholar] [CrossRef]
- Wang, F.; Banerjee, D.; Liu, Y.S.; Chen, X.Y.; Liu, X.G. Upconversion Nanoparticles in Biological Labeling, Imaging, and Therapy. Analyst 2010, 135, 1839–1854. [Google Scholar] [CrossRef]
- Zhu, S.-Y.; Yan, B. A novel sensitive fluorescent probe of S2O82− and Fe3+ based on covalent post-functionalization of a zirconium(IV) metal–organic framework. Dalton Trans. 2018, 47, 11586–11592. [Google Scholar] [CrossRef]
- Wang, J.; Wang, Y.; Qiu, H.; Sun, L.; Dai, X.; Pan, J.; Yan, Y. A Novel Sensitive Luminescence Probe Microspheres for Rapid and Efficient Detection of τ-Fluvalinate in Taihu Lake. Sci. Rep. 2017, 7, 46635. [Google Scholar] [CrossRef]
- Li, H.; Wang, C.; Hou, T.; Li, F. Amphiphile-Mediated Ultrasmall Aggregation Induced Emission Dots for Ultrasensitive Fluorescence Biosensing. Anal. Chem. 2017, 89, 9100–9107. [Google Scholar] [CrossRef]
- Zhang, Q.; Yang, M.; Zhu, Y.; Mao, C. Metallic Nanoclusters for Cancer Imaging and Therapy. Curr. Med. Chem. 2018, 25, 1379–1396. [Google Scholar] [CrossRef]
- Soto-Verdugo, V.; Metiu, H.; Gwinn, E. The Properties of Small Ag Clusters Bound to DNA Bases. J. Chem. Phys. 2010, 132, 195102. [Google Scholar] [CrossRef] [PubMed]
- Ono, A.; Cao, S.; Togashi, H.; Tashiro, M.; Fujimoto, T.; Machinami, T.; Oda, S.; Miyake, Y.; Okamoto, I.; Tanaka, Y. Specific Interactions between Silver(i) Ions and Cytosine-Cytosine Pairs in DNA Duplexes. Chem. Commun. 2008, 39, 4825–4827. [Google Scholar] [CrossRef]
- Petty, J.T.; Zheng, J.; Hud, N.V.; Dickson, R.M. DNA Templated AgAg Nanocluster Formation. J. Am. Chem. Soc. 2004, 126, 5207–5212. [Google Scholar] [CrossRef] [PubMed]
- Ritchie, C.M.; Johnsen, K.R.; Kiser, J.R.; Antoku, Y.; Dickson, R.M.; Petty. J.T. Ag Nanocluster Formation Using a Cytosine Oligonucleotide Template. J. Phys. Chem. C 2007, 111, 175–181. [Google Scholar] [CrossRef] [PubMed]
- Yuan, Z.; Chen, Y.-C.; Li, H.-W.; Chang, H.-T. Fluorescent silver nanoclusters stabilized by DNA scaffolds. Chem. Commun. 2014, 50, 9800–9815. [Google Scholar]
- Chen, Y.; Phipps, L.M.; Werner, J.H.; Chakraborty, S.; Martinez, J.S. DNA Templated Metal Nanoclusters: From Emergent Properties to Unique Applications. Acc. Chem. Res. 2008, 51, 12756–12763. [Google Scholar] [CrossRef]
- New, S.Y.; Lee, S.T.; Su, X.D. DNA-templated silver nanoclusters: Structural correlation and fluorescence modulation. Nanoscale 2016, 8, 17729–17746. [Google Scholar] [CrossRef]
- Guo, K.; Pourpak, A.; Beetz-Rogers, K.; Gokhale, V.; Sun, D.; Hurley, L.H. Formation of Pseudosymmetrical G-Quadruplex and i-Motif Structures in the Proximal Promoter Region of the RET Oncogene. J. Am. Chem. Soc. 2007, 129, 10220–10228. [Google Scholar] [CrossRef]
- Dembska, A.; Bielecka, P.; Juksowiak, B. pH-Sensing fluorescence oligonucleotide probes based on an i-motif scaffold: A review. Anal. Methods 2017, 9, 6092–6106. [Google Scholar] [CrossRef]
- Bielecka, P.; Dembska, A.; Juskowiak, B. Monitoring of pH Using an i-Motif-Forming Sequence Containing a Fluorescent Cytosine Analogue, tC. Molecules 2019, 24, 952. [Google Scholar] [CrossRef]
- Preus, S.; Kilså, K.; Wilhelmsson, L.M.; Albinsson, B. Photophysical and structural properties of the fluorescent nucleobase analogues of the tricyclic cytosine (tC) family. Phys. Chem. Chem. Phys. 2010, 12, 8881–8892. [Google Scholar] [CrossRef]
- Deng, H.; Yu, H.T. A Mini Review on Controlling the Size of Ag Nanoclusters by Changing the Stabilizer to Ag Ratio and by Changing DNA Sequence. Adv. Nat. Sci. 2015, 8, 1–9. [Google Scholar]
- Xie, Y.-P.; Shen, Y.-L.; Duan, G.-X.; Han, J.; Zhang, L.-P.; Lu, X. Silver nanoclusters: Synthesis, structures and photoluminescence. Mater. Chem. Front. 2020, 4, 2205–2222S. [Google Scholar] [CrossRef]
- Copp, M.; Schultz, D.E.; Swasey, S.; Gwinn, E.G. Atomically precise arrays of fluorescent silver clusters: A modular approach for metal cluster photonics on DNA nanostructures. ACS Nano 2015, 9, 2303–2310. [Google Scholar] [CrossRef]
- O’Neill, P.R.; Young, K.; Schiffels, D.; Fygenson, D.K. Few-atom fluorescent silver clusters assemble at programmed sites on DNA nanotubes. Nano Lett. 2012, 12, 5464–5469. [Google Scholar] [CrossRef] [PubMed]
- Rabin, I.; Schulze, W.; Ertl, G. Light emission during the agglomeration of silver clusters in noble gas matrixes. J. Chem. Phys. 1998, 108, 5137–5142. [Google Scholar] [CrossRef]
- Fedrigo, S.; Harbich, W.; Buttet, J. Optical response of Ag2, Ag3, Au2, and Au3 in argon matrixes. J. Chem. Phys. 1993, 99, 5712–5717. [Google Scholar] [CrossRef]
- Bonacic-Koutecky, V.; Pittner, J.; Boiron, M.; Fantucci, P. An accurate relativistic effective core potential for excited states of Ag atom: An application for studying the absorption spectra of Agn and Agn(+) clusters. J. Chem. Phys. 1999, 110, 3876–3886. [Google Scholar] [CrossRef]
- Lan, G.-Y.; Huang, C.-C.; Chang, H.-T. Silver nanoclusters as fluorescent probes for selective and sensitive detection of copper ions. Chem. Commun. 2010, 46, 1257–1259. [Google Scholar] [CrossRef]
- Richards, C.I.; Choi, S.; Hsiang, J.C.; Antoku, Y.; Vosch, T.; Bongiorno, A.; Tzeng, Y.L.; Dickson, R.M. Oligonucleotide stabilized Ag nanocluster fluorophore. J. Am. Chem. Soc. 2008, 130, 5038–5039. [Google Scholar] [CrossRef] [PubMed]
- Dembska, A.; Switalska, A.; Fedoruk-Wyszomirska, A.; Juskowiak, B. Development of fluorescence oligonucleotide probes based on cytosine- and guanine-rich sequences. Sci. Rep. 2020, 10, 11006. [Google Scholar] [CrossRef] [PubMed]
- Kypr, J.; Kejnovská, I.; Renciuk, D.; Vorlícková, M. Circular dichroism and conformational polymorphism of DNA. Nucleic Acids Res. 2009, 37, 1713–1725. [Google Scholar] [CrossRef] [PubMed]
- Simonsson, T.; Pribylova, M.; Vorlickova, M. A Nuclease Hypersensitive Element in the Human c-myc Promoter Adopts Several Distinct i-Tetraplex Structures. Biochem. Biophys. Res. Commun. 2000, 278, 158–166. [Google Scholar] [CrossRef] [PubMed]
- Benabou, S.; Avino, A.; Eritja, R.; Gonzalez, C.; Gargallo, R. Fundamental aspects of the nucleic acid i-motif structures. RSC Adv. 2014, 51, 26956–26980. [Google Scholar] [CrossRef]
- Manzini, G.; Yathindra, N.; Xodo, L.E. Evidence for intramolecularly folded i-DNA structures in biologically relevant CCCrepeat sequences. Nucleic Acids Res. 1994, 22, 4634–4640. [Google Scholar] [CrossRef]
Publisher’s Note: MDPI stays neutral with regard to jurisdictional claims in published maps and institutional affiliations. |
© 2020 by the authors. Licensee MDPI, Basel, Switzerland. This article is an open access article distributed under the terms and conditions of the Creative Commons Attribution (CC BY) license (https://creativecommons.org/licenses/by/4.0/).