Detection of Listeria innocua by Acoustic Aptasensor †


Abstract
:1. Introduction
1.1. Bacteria and Detection Methods
1.2. Standard Methods of Bacteria Detection
1.3. Biosensors and Their Application
1.4. Aptamers and Their Application for Bacteria Detection
2. Materials and Methods
2.1. Chemicals
2.2. Standard Methods of Foodborne Pathogens Detection
2.3. Preparation of Bacteria Samples (Listeria innocua)
2.4. Preparation of the Aptasensor
2.5. Detection of Bacteria by QCM Method
3. Results and Discussion
3.1. Determination of the Concentration of Bacteria by the Standard Method
3.2. QCM Measurement with Listeria innocua
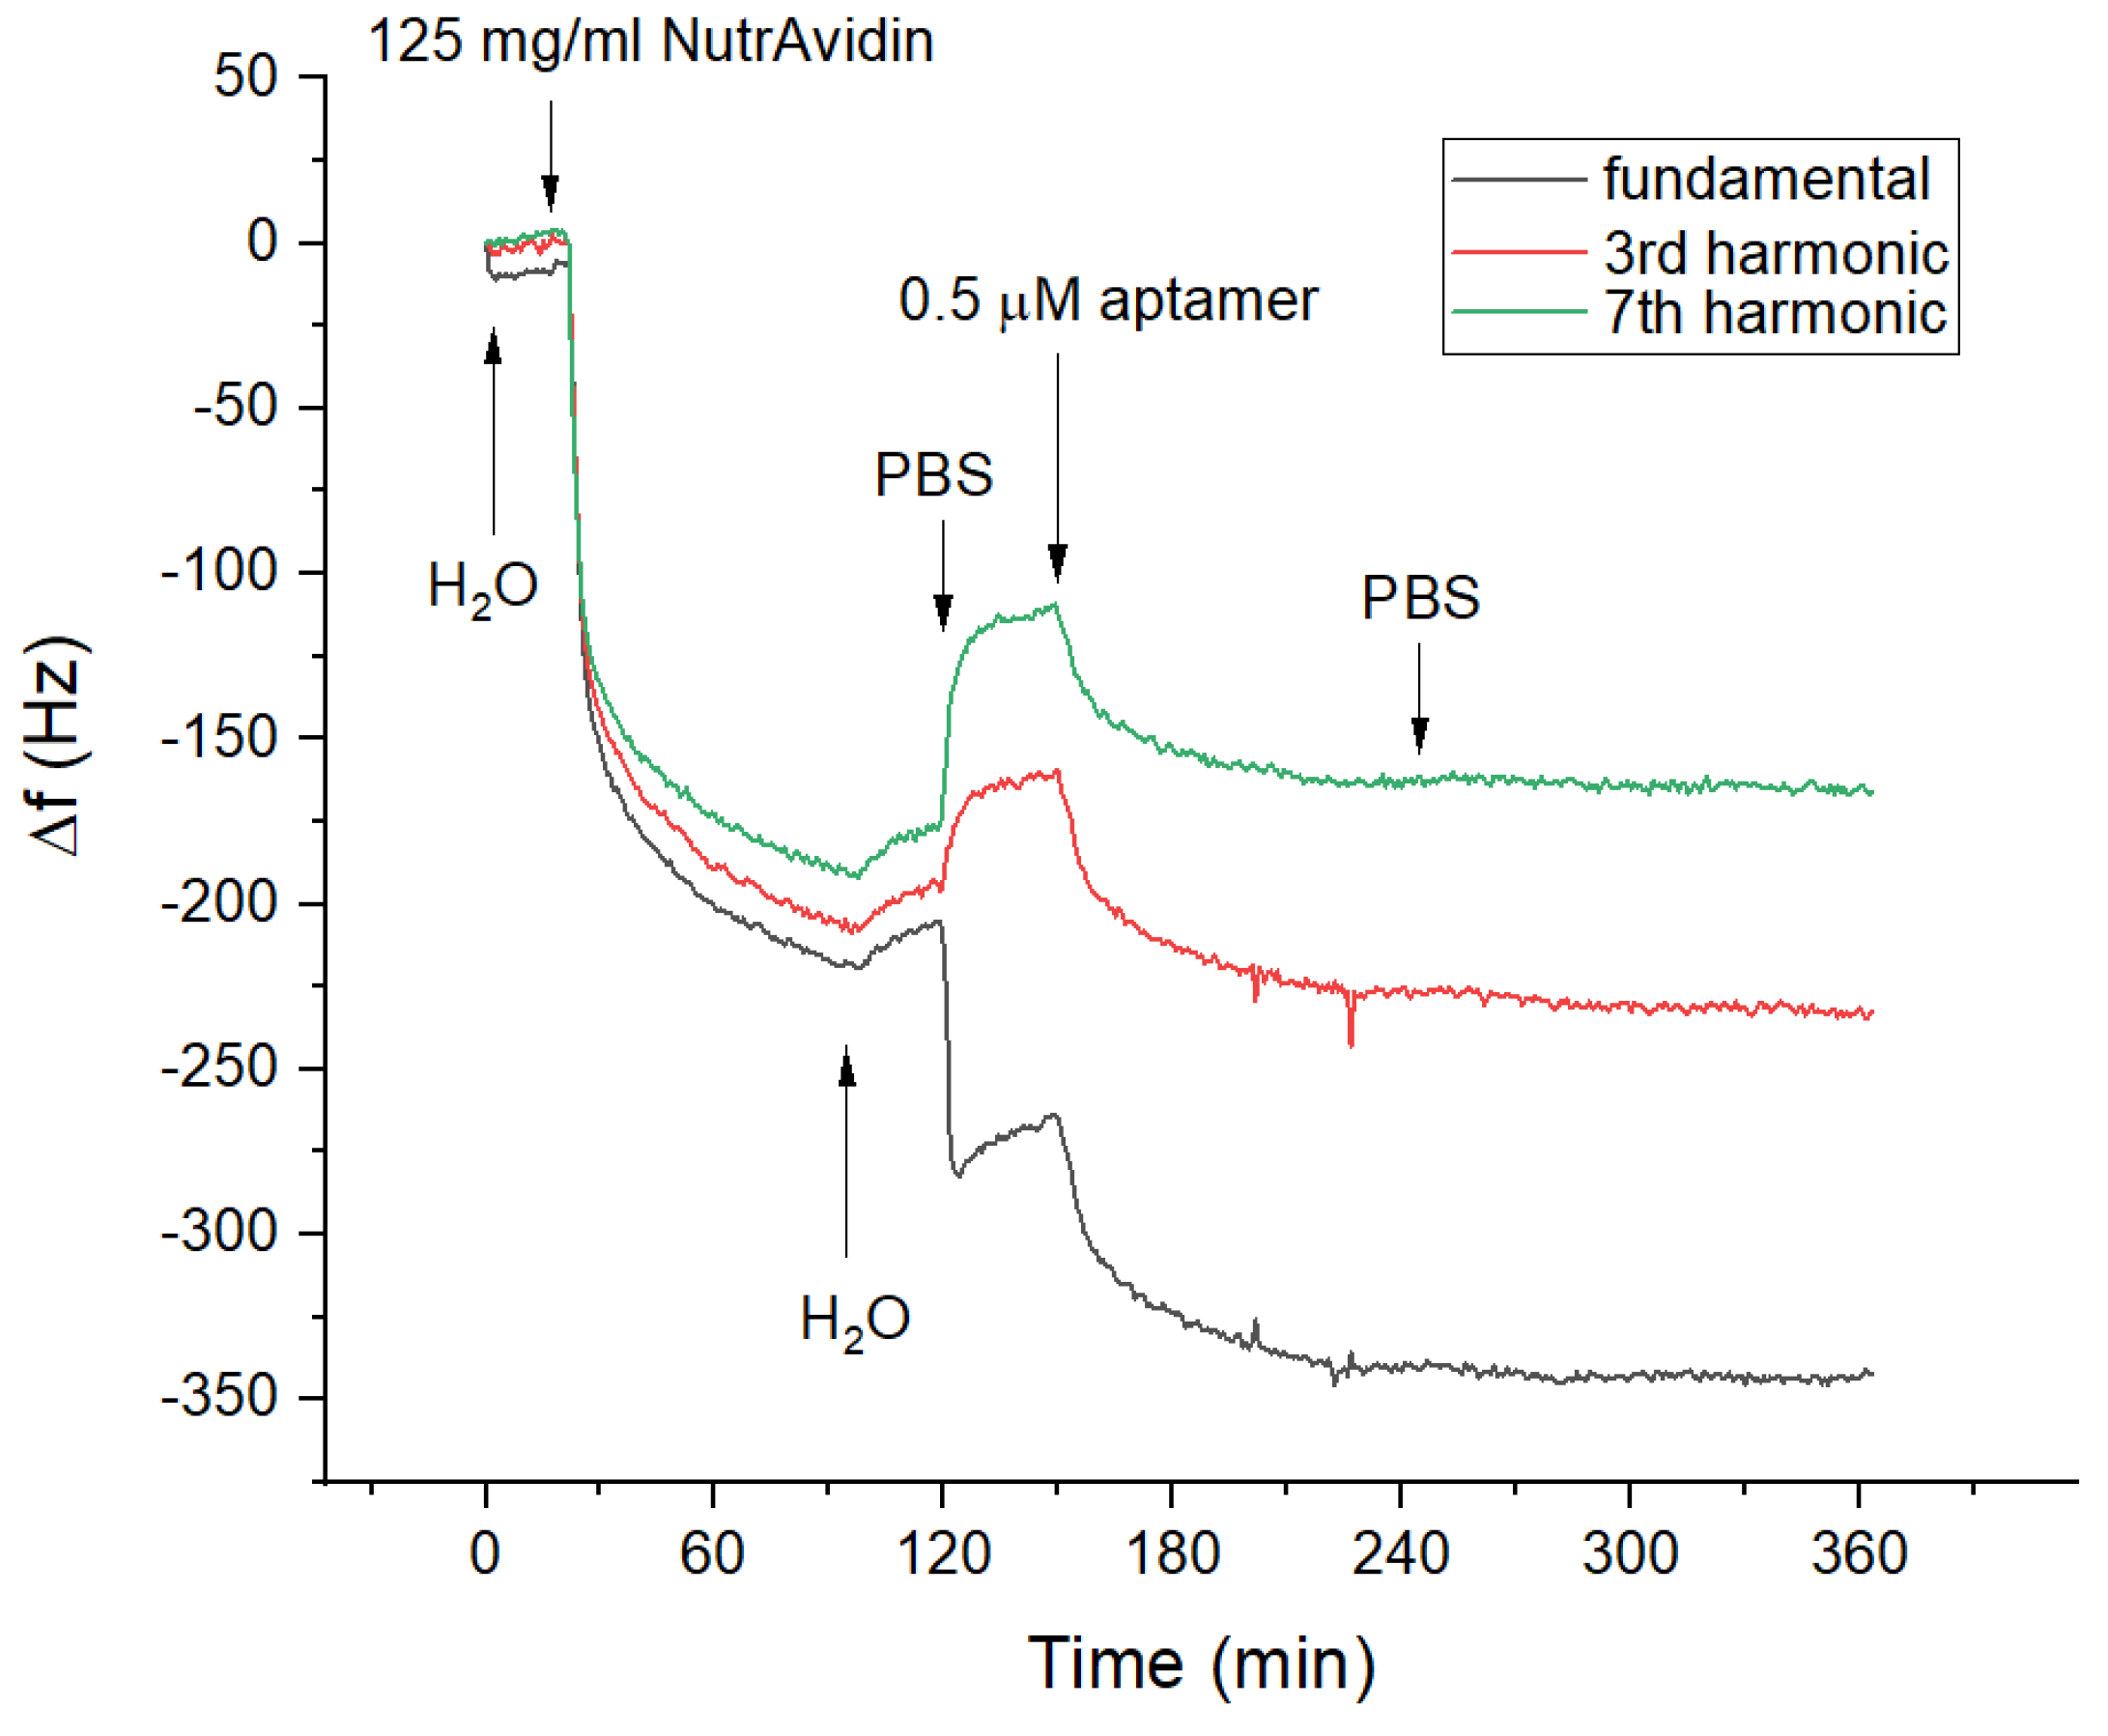
3.2.1. Formation of Aptamer Layer
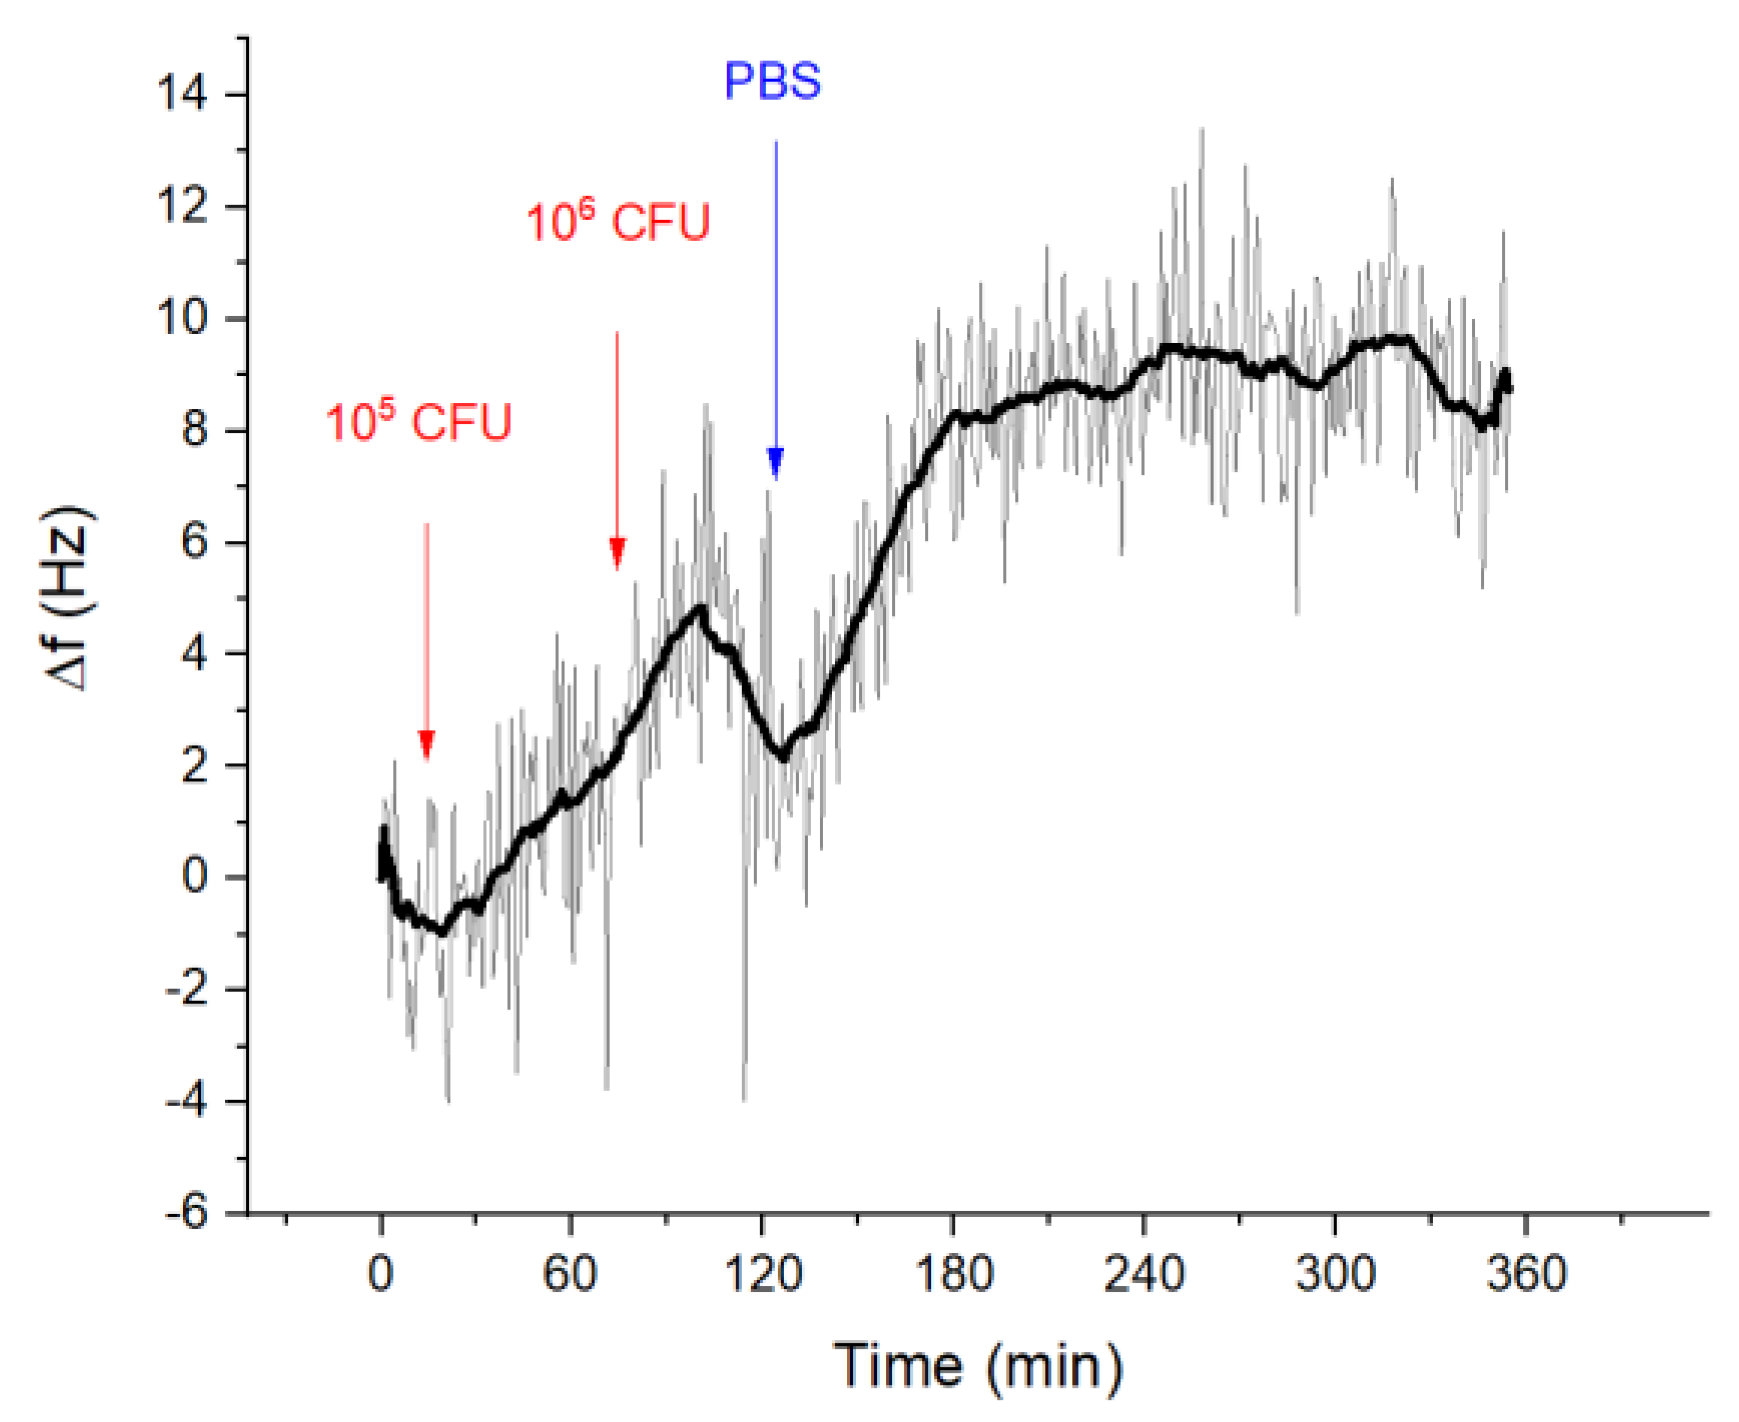
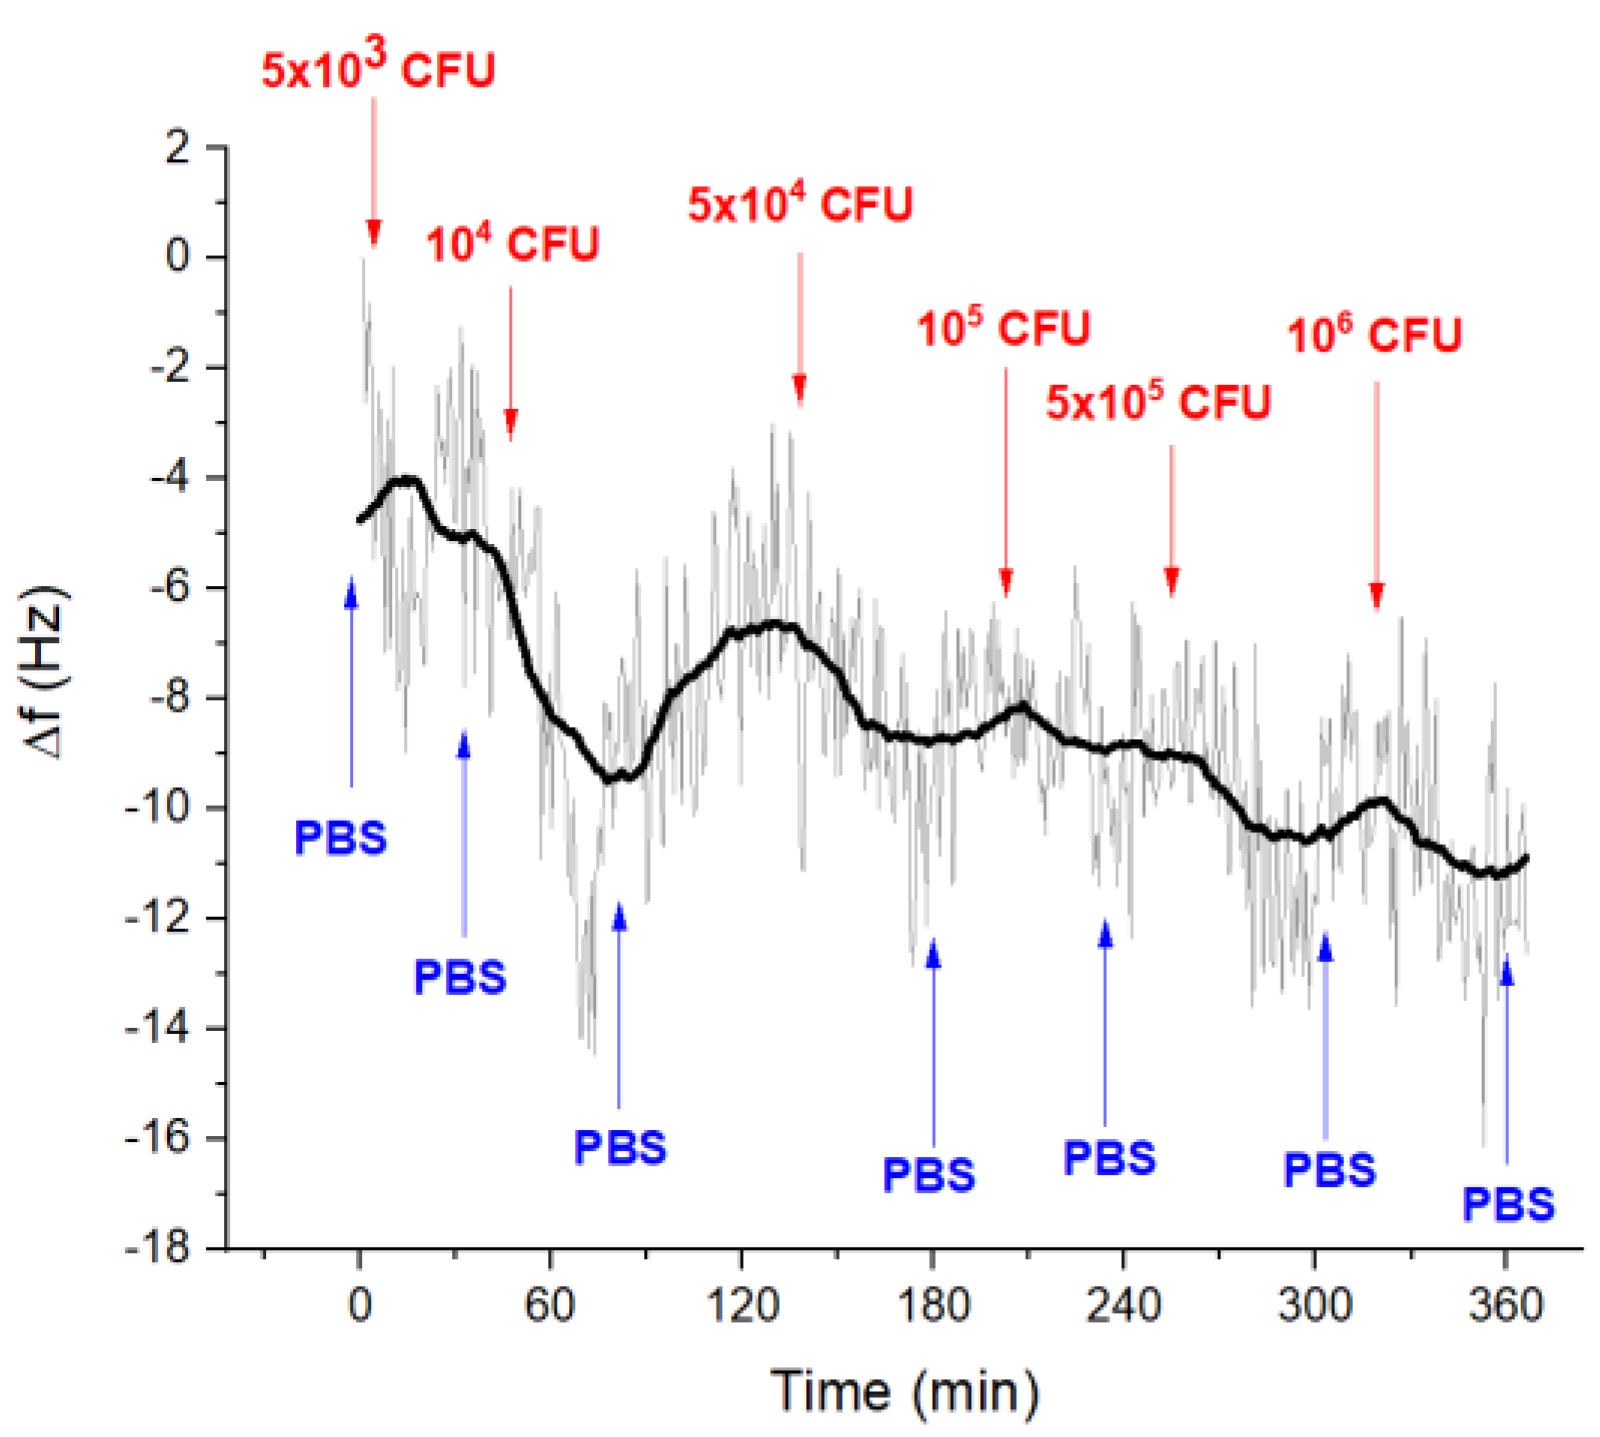
3.2.2. Detection of Listeria innocua
3.2.3. Aptamer Specificity Testing with E. coli
4. Conclusions
Author Contributions
Funding
Acknowledgments
Conflicts of Interest
References
- Jadhav, S.R.; Shah, R.M.; Karpe, A.V.; Morrison, P.D.; Kouremenos, K.; Beale, D.J.; Palombo, E.A. Detection of foodborne pathogens using proteomics and metabolomics-based approaches. Front. Microbiol. 2018, 9, 3132. [Google Scholar] [CrossRef] [PubMed]
- Zhao, X.; Lin, C.W.; Wang, J.; Oh, D.H. Advances in rapid detection methods for foodborne pathogens. J. Microbiol. Biotechnol. 2014, 24, 297–312. [Google Scholar] [CrossRef]
- Oliver, S.P.; Jayarao, B.M.; Almeida, R.A. Foodborne pathogens in milk and the dairy farm environment: Food safety and public health implications. Foodborne Pathog. Dis. 2005, 2, 115–129. [Google Scholar] [CrossRef] [PubMed]
- Scallan, E.; Hoekstra, R.M.; Angulo, F.J.; Tauxe, R.V.; Widdowson, M.A.; Roy, S.L.; Jones, J.L.; Griffin, P.M. Foodborne illness acquired in the United States-major pathogens. Emerg. Inf. Dis. 2011, 17, 7–15. [Google Scholar] [CrossRef] [PubMed]
- Mandal, P.; Biswas, A.K.; Choi, K.; Pal, U.K. Methods for rapid detection of foodborne pathogens: An overview. Am. J. Food Technol. 2011, 6, 87–102. [Google Scholar] [CrossRef]
- Rouger, A.; Tresse, O.; Zagorec, M. Bacterial Contaminants of poultry meat: Sources, species, and dynamics. Microorganisms 2017, 5, 50. [Google Scholar] [CrossRef]
- Rajapaksha, R.; Elbournea, A.; Gangadoo, S.; Brownc, R.; Cozzolinob, D.; Chapman, J. A review of methods for the detection of pathogenic microorganisms. Analyst 2019, 144, 396–411. [Google Scholar] [CrossRef]
- Foddai, A.C.G.; Grant, I.R. Methods for detection of viable foodborne pathogens: Current state-of-art and future prospects. Appl. Microbiol. Biotechnol. 2020, 104, 4281–4288. [Google Scholar] [CrossRef]
- Ivnitski, D.; Abdel-Hamid, I.; Atanasov, P.; Wilkins, E. Biosensors for detection of pathogenic bacteria. Biosens. Bioelectr. 1999, 14, 599–624. [Google Scholar] [CrossRef]
- Law, J.F.; Ab Mutalib, N.S.; Chan, K.G.; Lee, L.H. Rapid methods for the detection of foodborne bacterial pathogens: Principles, applications, advantages and limitations. Front. Microbiol. 2015, 5, 770. [Google Scholar] [CrossRef]
- Thévenot, D.; Toth, K.; Durst, R.; Wilson, G. Electrochemical biosensors: Recommended definitions and classifications. Biosens. Bioelectr. 2001, 34, 121–131. [Google Scholar] [CrossRef]
- Choi, W.; Chae, J. A microfluid biosensor based on competitive protein absorption for thyroglobuli detection. Biosens. Bioelectron. 2009, 25, 118–123. [Google Scholar] [CrossRef] [PubMed]
- Karunakaran, C.H.; Rajkumar, R.; Bhargava, K. (Eds.) Chapter 1—Introduction to Biosensors. In Biosensors and Bioelectronics, 1st ed.; Elsevier: Amsterdam, The Netherland, 2015; pp. 1–68. [Google Scholar]
- Salami, M.; Abadi, M.H.S.; Sawan, M.; Abadi, N.S.K. BioFET-based integrated platform for accurate and rapid detection of E. coli bacteria: A review. Biosens. Bioelectron. 2019, 10, 266. [Google Scholar]
- Berlincourt, D. Piezoelectric Crystals and Ceramics. In Ultrasonic Transducer Materials. Ultrasonic Technology (A Series of Monographs); Mattiat, O.E., Ed.; Springer: Boston, MA, USA, 1971; Volume 3, pp. 63–124. [Google Scholar]
- Bayramoglu, G.; Ozalp, V.C.; Oztekin, M.; Arica, Y.A. Rapid and label-free detection of Brucella melitensis in milk and milk products using an aptasensor. Talanta 2019, 200, 263–271. [Google Scholar] [CrossRef]
- Yu, X. Rapid and Sensitive Detection of Escherichia Coli O157:H7 Using a QCM Sensor Based on Aptamers Selected by Whole-Bacterium SELEX and a Multivalent Aptamer System. Ph.D. Thesis, University of Arkansas, Fayetteville, NC, USA, 2018; pp. 70–71. [Google Scholar]
- Wang, J.; Wang, R.; Chen, F.; Jiang, T.; Wang, H.; Slavik, M.; Wei, H.; Li, Y. QCM-based aptamer selection and detection of Salmonella Typhimurium. Food Chem. 2017, 221, 776–782. [Google Scholar] [CrossRef] [PubMed]
- Tuerk, C.; Gold, L. Systematic Evolution of Ligands by Exponential Enrichment: RNA Ligands to Bacteriophage T4 DNA Polymerase. Science 1990, 249, 505–510. [Google Scholar] [CrossRef]
- Ellington, A.D.; Szostak, J.W. In vitro selection of RNA molecules that bind specific ligands. Nature 1990, 346, 818–822. [Google Scholar] [CrossRef]
- Yu, X.; Chen, F.; Wang, R.; Li, Y. Whole-bacterium SELEX of DNA aptamers for rapid detection of E. coli O157:H7 using a QCM sensor. J. Biotechnol. 2018, 266, 39–49. [Google Scholar] [CrossRef]
- Ohk, S.; Koo, O.K.; Sen, T.; Yamamoto, C.M.; Bhunia, A.K. Antibody-aptamer functionalized fibre-optic biosensor for specific detection of Listeria monocytogenes from food. J. Appl. Microbiol. 2010, 109, 808–817. [Google Scholar] [CrossRef]
- Wu, S.; Duan, N.; Ma, X.; Xia, Y.; Wang, H.; Wang, Z.; Zhang, Q. Multiplexed fluorescence resonance energy transfer aptasensor between upconversion nanoparticles and graphene oxide for the simultaneous determination of mycotoxins. Anal. Chem. 2012, 84, 6263–6270. [Google Scholar] [CrossRef]
- Wu, S.; Duan, N.; Wang, Z.; Wang, H. Aptamer-functionalized magnetic nanoparticle-based bioassay for the detection of ochratoxin a using upconversion nanoparticles as labels. Analyst 2011, 136, 2306–2314. [Google Scholar] [CrossRef]
- Poturnayova, A.; Buríková, L.; Bizík, J.; Hianik, T. DNA aptamers in the detection of leukemia cells by the thickness shear mode acoustics method. ChemPhysChem 2019, 20, 545–554. [Google Scholar] [CrossRef] [PubMed]
- Minunni, M.; Tombelli, S.; Gullotto, A.; Luzi, E.; Mascini, M. Development of biosensors with aptamers as bio-recognition element: The case of HIV-1 Tat protein. Biosens. Bioelectron. 2004, 20, 1149–1156. [Google Scholar] [CrossRef] [PubMed]
- Kudłak, B.; Wieczerzak, M. Aptamer based tools for environmental and therapeutic monitoring: A review of developments, applications, future perspectives. Environ. Sci. Technol. 2020, 50, 816–867. [Google Scholar] [CrossRef]
- Vaughan, R.D.; O’Sullivan, C.K.; Guilbault, G.G. Development of a quartz crystal microbalance (QCM) immunosensor for the detection of Listeria monocytogenes. Enzym. Microb. Technol. 2001, 29, 635–638. [Google Scholar] [CrossRef]
- Sharma, H.; Mutharasan, R. Rapid and sensitive immunodetection of Listeria monocytogenes in milk using a novel piezoelectric cantilever sensor. Biosens. Bioelectron. 2013, 45, 158–162. [Google Scholar] [CrossRef]
- Duan, N.; Ding, X.; He, L.; Wu, S.; Wei, Y.; Wang, Z. Selection, identification and application of a DNA aptamer against Listeria monocytogenes. Food Control 2013, 33, 239–243. [Google Scholar] [CrossRef]
- Ottaviani, F.; Ottaviani, M.; Agosti, M. Differential agar medium for Listeria monocytogenes. In Quimper-Froid Symposium Proceedings; P6 ADRIA: Quimper, France, 1997. [Google Scholar]
- Bednář, M.; Fraňková, V.; Schindler, J.; Souček, A.; Vávra, J. Lekářska Mikrobiologie; Triton: Prague, Czech Republic, 1996; pp. 221–223. ISBN 8594031505280. [Google Scholar]
- Hazan, R.; Que, Y.-A.; Maura, D.; Rahme, L.G. A method for high throughput determination of viable bacteria cell counts in 96-well plates. BMC Microbiol. 2012, 12, 259. [Google Scholar] [CrossRef]
- Freitag, S.; Le Trong, I.; Klumb, L.; Styton, P.S.; Stenkamp, R.E. Structural studies of the streptavidin binding loop. Protein Sci. 1997, 6, 1157–1166. [Google Scholar]
- Tassew, N.; Thompson, M. Kinetic characterization of TAR RNA-Tat peptide and neomycin interactions by acoustic wave biosensor. Biophys. Chem. 2003, 106, 241–252. [Google Scholar] [CrossRef]
- Hianik, T. Detection of protein-aptamer interactions by means of electrochemical indicators and transverse shear mode method. In Aptamer in Bioanalysis; John Wiley & Sons, Inc.: Hoboken, NJ, USA, 2009; p. 313. [Google Scholar]
- Grimshaw, S. Quartz crystal thin-film monitoring forges ahead. Photonics Spectra 2003, 37, 82–88. [Google Scholar]
- Sauerbrey, G. Verwendung von schwingquarzen zur wägung dünner schichten und zur mikrowägung. Zeitschrift für Physik 1959, 155, 206–222. [Google Scholar] [CrossRef]
- Lowe, C.H.R. Overview of Biosensor and Bioarray Technologies. In Handbook of Biosensors and Biochips; Part One; Marks, R., Lowe, C.H.R., Cullen, D.C., Weetall, H.H., Karube, I., Eds.; John Wiley and Sons: London, UK, 2007; pp. 1–16. [Google Scholar]
- Skládal, P. Piezoelectric biosensors. Trends Anal. Chem. 2016, 79, 127–133. [Google Scholar] [CrossRef]
- Dizon, M.; Tatarko, M.; Hianik, T. Advances in analysis of milk proteases activity at surfaces and in a volume by acoustic methods. Sensors 2020, 20, 5594. [Google Scholar] [CrossRef]
- Poturnayova, A.; Castillo, G.; Subjakova, V.; Tatarko, T.; Snejdarkova, M.; Hianik, T. Optimization of cytochrome c detection by acoustic and electrochemical methods based on aptamer sensors. Sens. Actuators B Chem. 2017, 238, 817–827. [Google Scholar] [CrossRef]
- Ellis, J.S.; Thompson, M. Acoustic coupling at multiple interfaces and the liquid phase response of the thickness shear-mode acoustic wave sensor. Chem. Commun. 2004, 11, 1310–1311. [Google Scholar] [CrossRef]
- Tatarko, M. Diagnostics of Oncologic Markers on Cell Surface. Bachelor’s Thesis, Comenius University in Bratislava, Bratislava, Slovakia, 2013. [Google Scholar]
- Patocka, F.; Menciková, E.; Seeliger, H.P.R.; Jirasek, A. Neurotropic activity of a strain of Listeria innocua in suckling mice. Zentralblatt fur Bakteriologie Parasitenkunde Infektionskrankheiten und Hygiene 1979, 243, 490–498. [Google Scholar]


| Sample | Dilution | Number of Colonies on Agar | Average Number [pcs] | SD | RD | Final CFU/mL | ||
|---|---|---|---|---|---|---|---|---|
| A | B | C | ||||||
| 1. L. innocua | 10−5 | 272 | 294 | 297 | 288 | 13.7 | 5% | 2.91 × 10⁸ |
| 10−6 | 33 | 32 | 32 | 32 | 0.6 | 2% | ||
| 2. E. coli | 10−5 | 382 | 358 | 368 | 369 | 12.1 | 3% | 3.71 × 10⁸ |
| 10−6 | 44 | 46 | 26 | 39 | 11.0 | 28% | ||
| 3. L. innocua | 10−5 | 290 | 346 | 311 | 316 | 28.3 | 9% | 3.24 × 10⁸ |
| 10−6 | 34 | 58 | 30 | 41 | 15.1 | 37% | ||
| Listeria innocua, CFU/mL | Frequency Changes, Δfs, [Hz] |
|---|---|
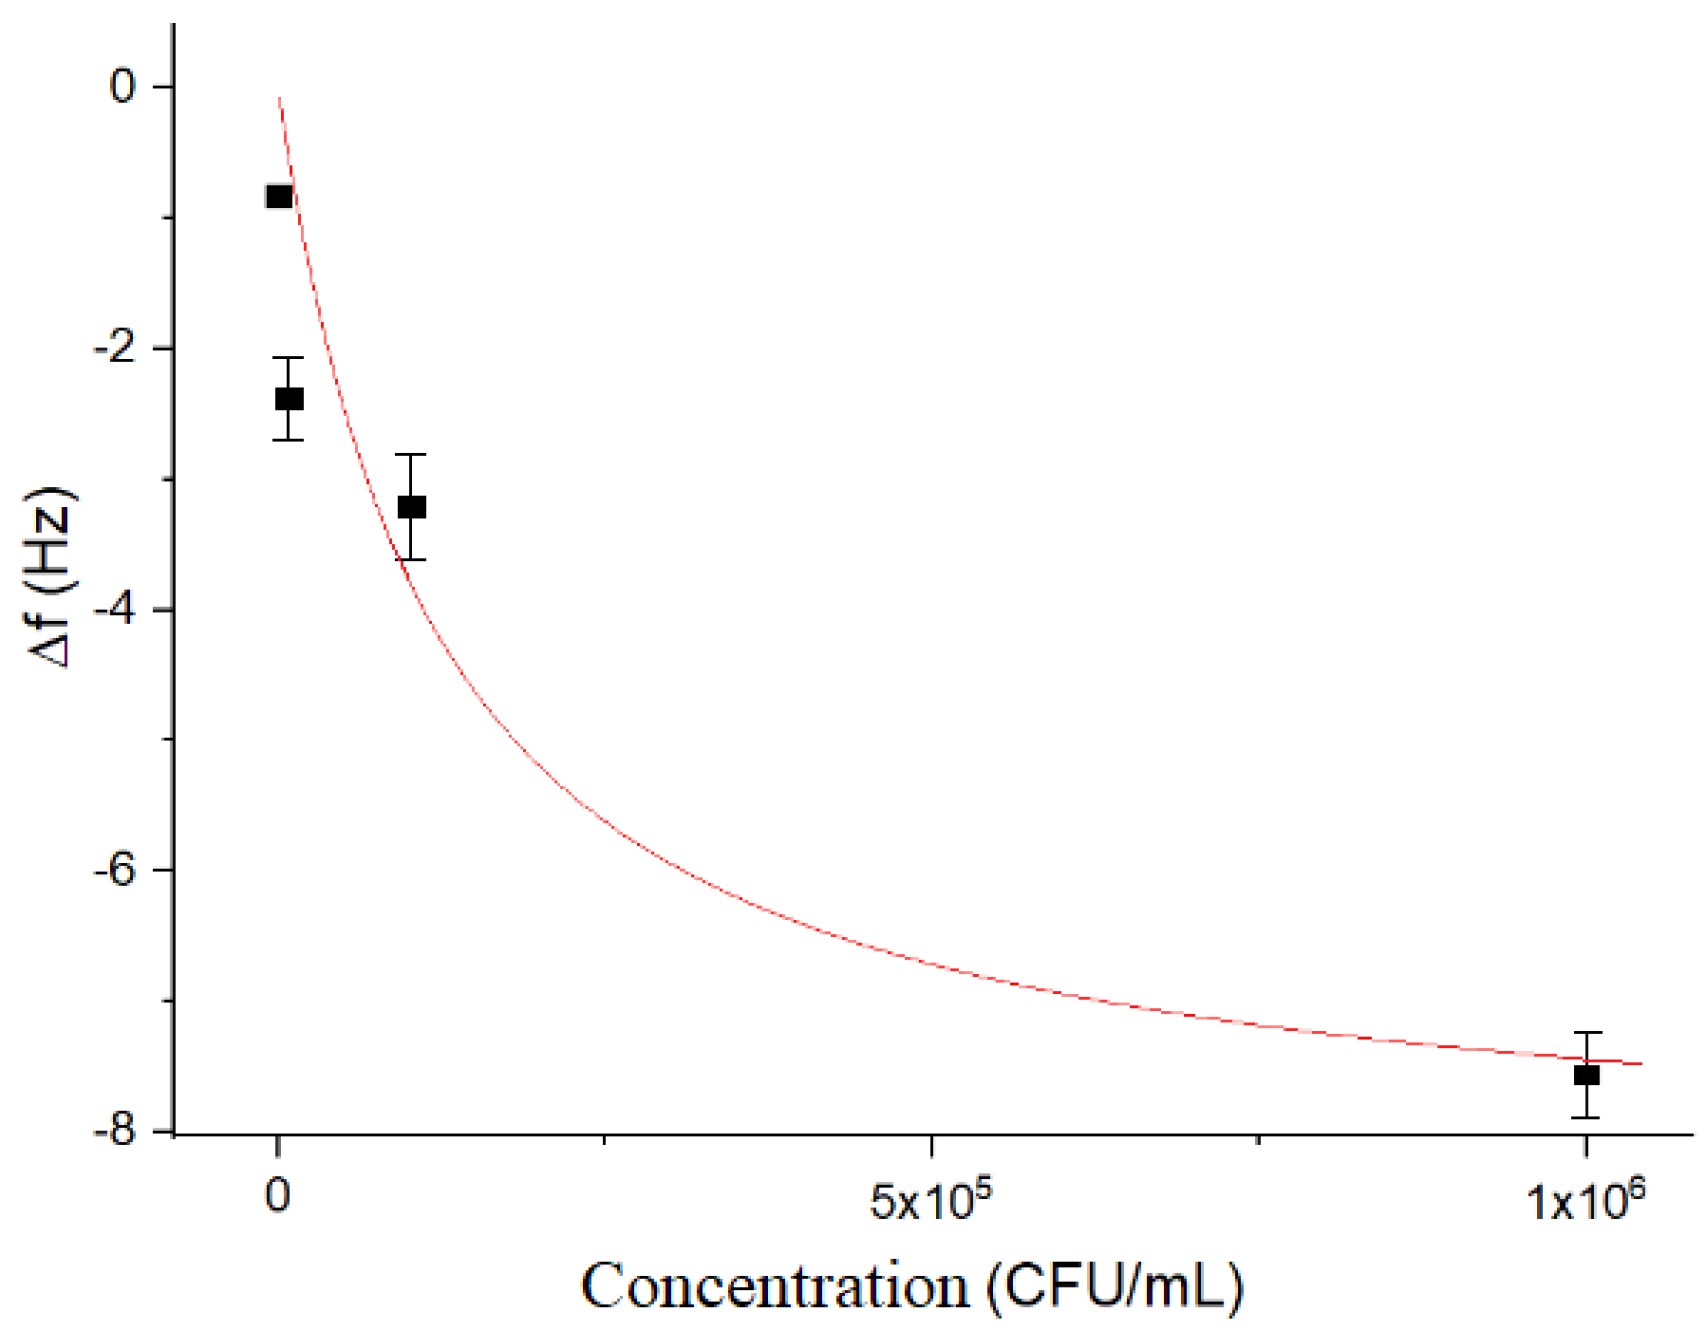
| 103 | −0.840 ± 0.003 |
| 104 | −2.392 ± 0.311 |
| 105 | −3.198 ± 0.411 |
| 106 | −7.575 ± 0.333 |
Publisher’s Note: MDPI stays neutral with regard to jurisdictional claims in published maps and institutional affiliations. |
© 2020 by the authors. Licensee MDPI, Basel, Switzerland. This article is an open access article distributed under the terms and conditions of the Creative Commons Attribution (CC BY) license (https://creativecommons.org/licenses/by/4.0/).
Share and Cite
Oravczová, V.; Tatarko, M.; Süle, J.; Hun, M.; Kerényi, Z.; Hucker, A.; Hianik, T. Detection of Listeria innocua by Acoustic Aptasensor. Proceedings 2020, 60, 18. https://doi.org/10.3390/IECB2020-07079
Oravczová V, Tatarko M, Süle J, Hun M, Kerényi Z, Hucker A, Hianik T. Detection of Listeria innocua by Acoustic Aptasensor. Proceedings. 2020; 60(1):18. https://doi.org/10.3390/IECB2020-07079
Chicago/Turabian StyleOravczová, Veronika, Marek Tatarko, Judit Süle, Milan Hun, Zoltán Kerényi, Attila Hucker, and Tibor Hianik. 2020. "Detection of Listeria innocua by Acoustic Aptasensor" Proceedings 60, no. 1: 18. https://doi.org/10.3390/IECB2020-07079
APA StyleOravczová, V., Tatarko, M., Süle, J., Hun, M., Kerényi, Z., Hucker, A., & Hianik, T. (2020). Detection of Listeria innocua by Acoustic Aptasensor. Proceedings, 60(1), 18. https://doi.org/10.3390/IECB2020-07079