Proceeding Paper

Electrochemical Impedance Spectroscopy Characterization of Label-Free Biosensors for the Detection of HER2 in Saliva †

1
Faculty of Arts and Sciences, Holy Spirit University of Kaslik, Jounieh 446, Lebanon
2
Institut des Sciences Analytiques, Université de Lyon, Claude Bernard Lyon 1, UMR 5280, CNRS–5, rue de la Doua, 69100 Villeurbanne, France
*
Authors to whom correspondence should be addressed.
Presented at the 1st International Electronic Conference on Biosensors, 2–17 November 2020; Available online: https://iecb2020.sciforum.net/.
Proceedings 2020, 60(1), 17; https://doi.org/10.3390/IECB2020-07081
Published: 2 November 2020
(This article belongs to the Proceedings of The 1st International Electronic Conference on Biosensors)

Abstract

:
Breast cancer is the leading cancer type for women with two million new yearly infections and more than half a million dead worldwide. Human Epidermal Receptor 2 (HER2) is a prominent breast cancer biomarker that indicates aggressive cancer and is often associated with a bad prognosis and low survival rates. However, current detection methods for HER2 are often time-consuming, expensive, and require a high level of expertise. Biosensors are devices that turn biological interaction into a readable electronic signal; they are known for their high specificity and selectivity for low concentration, as well as their low cost and ease of use, thus making them a better alternative to traditional methods. Also, saliva is becoming a better alternative to blood for the detection of biomarkers due to its non-invasive collection in large quantities with simple collection methods with a richness in disease biomarkers including HER2. Thus, this project aims to develop a label-free, low cost, electrochemical biosensor for the detection of HER2 in saliva. This was done by first depositing diazonium salt onto a screen-printed electrode (SPE) through cyclic voltammetry, then immobilizing anti-HER2 antibodies on the activated SPE using 1-ethyl-3-(3-dimethylamino) propyl carbodiimide/N-hydroxysuccinimide. HER2 biomarker concentrations were detected using electrochemical impedance spectroscopy inside a microfluidic system. The biosensor showed a higher linear detection of HER2 (Y = 0.0062X + 0.1066/R2 = 0.9909) in its physiological concentration range of 5 and 40 pg/mL when compared to other interference proteins: Epidermal Growth Factor Receptor (Y = 0.0016X + 0.0188/R2 = 0.8072) and Human Epidermal Receptor 3 (Y = (0.0035X + 0.0225/R2 = 0.1302). The biosensor was then used to detect 10 pg/mL of HER2 concentration in real saliva using the standard addition methods (Y = 0.0118X + 0.1282/R2 = 0.9876).

1. Introduction

With two million new cases in 2018, Breast cancer is the leading type of cancer for women worldwide [1,2,3].
Human epithelial receptor 2 (HER2, ErbB2) is a receptor protein typically found on the surface of the cells, it consists of three functional domains: the extracellular domain (ECD) can bind with other members of the HER family; a lipophilic transmembrane domain, and the intracellular domain containing tyrosine kinase activity. HER2 is amplified in nearly 20% of breast cancer patients and it is an indicator for a worse prognosis. Regardless, anti-HER2 therapy (trastuzumab or lapatinib) is administered to improve patient’s survival. HER2 concentrations are determined using immunohistochemistry (IHC) or fluorescent in situ hybridization (FISH) on tumor tissue following biopsy. However, this detection method is fraught with problems, first, due to biopsy’s complex nature, false negative or positive results are an issue with these techniques, and, biopsy is extremely invasive technique that carries a lot of risks [4,5,6,7].
A solution to the above-mentioned problem is the use a different biological medium for the detection of HER2; this is possible due to the detachability of the extracellular part into the extracellular matrix due to proteolytic cleavage that occur on the cell’s surface [8], and while blood is usually the favored medium for the detection of biomarkers, saliva is seen as a great alternative [9,10,11,12]; saliva has several advantages on other biomarker rich biological mediums due to its availability in large quantities, its richness in biomarkers and its ease of collection without needles [13,14]. A few of the hurdles facing salivary detection have unfortunately hindered their use for clinical detection of a large number of diseases; from the low concentration of HER2 within the fM range [15,16,17], to issues and difficulties with the salivary matrix [18]. However, above all, the lack of a technique for the low cost HER2 detection that is optimized for the detection in the salivary matrix [11].
Biosensors are devices whose function is to turn biological signals into a physical one; biosensors have shown to exhibit high specificity and selectivity toward their target biomarker in low concentrations while remaining cost effective and easy to use, making them a better alternative to traditional techniques for biomarker detection [11,19].
Of all the techniques used in biosensors for the recognition of biomarkers, Electrochemical impedance spectroscopy (EIS) seems to be one of its most prominent. Its ability to investigate both bulk and interfacial electrical properties of three electrode systems have been used to determine quantitative biorecognition in different biosensors [20,21]. The mechanism of which EIS is used in biosensor detection is rather simple in principle: if biorecognition of the biomarker occurs at the adapted electrode’s surface, the electrochemical interfacial properties of said electrode changes thus providing a fingerprint of the above-mentioned change, creating a detection signal [22,23,24].
One of the techniques used to create the above-mentioned electrodes used for EIS detection involves deposition layer-by-layer of a paste or an ink containing electrochemically conductive materials (gold, silver, carbon, etc.) on a solid surface (ceramic, plastic, etc.) through a screen or a mesh with a well-defined geometry. Electrodes made with this technique are known as Screen-Printed electrode (SPE) and they offers a promising approach toward creating easy to use electrochemical biosensors [25].
In this paper, we present the development of an electrochemical biosensor for the detection of HER2 in human saliva using a biofunctionalized gold integrated SPE; The SPE was functionalized using Cyclic voltammetry (CV) and EIS was used in HER2 detection. The biosensor managed to detect HER2 within the range of 5 to 40 pg/mL in phosphate-buffered saline (PBS), which is within the detection range of previous articles, all the while showing higher sensitivity toward HER2 when compared to the detection of other interferences (epidermal growth factor receptor (EGFR) and HER3), and finally, HER2 was then detected in real saliva using the standard addition method.

2. Materials and Method

2.1. Chemical Products

The reagents used in this research are 4-aminobenzoic acid (ABA), sodium nitrite (NaNO2), hydrochloric acid (HCl), N-hydroxysuccinimide (NHS),
N-(3-dimethylaminopropyl)-N-ethyl-carbodiimide hydrochloride (EDC), ethanolamine, phosphate-buffered saline (PBS), and (Fe2+Fe3+) were purchased from Sigma Aldrich (Beirut, Lebanon). HER2, epidermal growth factor receptor (EGFR), and Human epidermal receptor 3 (HER3) antigens and anti-HER2 antibody were purchased from R&D System (Beirut, Lebanon).

2.2. Antibodies (Ab) and Antigen (Ag) Solutions

As per the supplier’s protocol, the antibodies and the antigens were diluted in PBS (pH 7.4) to acquire a stock solution with a final concentration of 10 µg/mL. for the antigens (HER2, EGFR, HER3) and 0.5 mg/mL for anti-HER2 antibody (anti-HER2), which were then divided into aliquots and stored at −20 °C. The stock solutions for HER2 was then further diluted in PBS to form the standard solutions used in the analysis. The standard solutions of HER2 were prepared by diluting the appropriate amount of a stock solution (50 µg/mL) in PBS in order to obtain the necessary concentrations of HER, EGFR, and HER3 (5, 10, 20, 40 pg/mL).

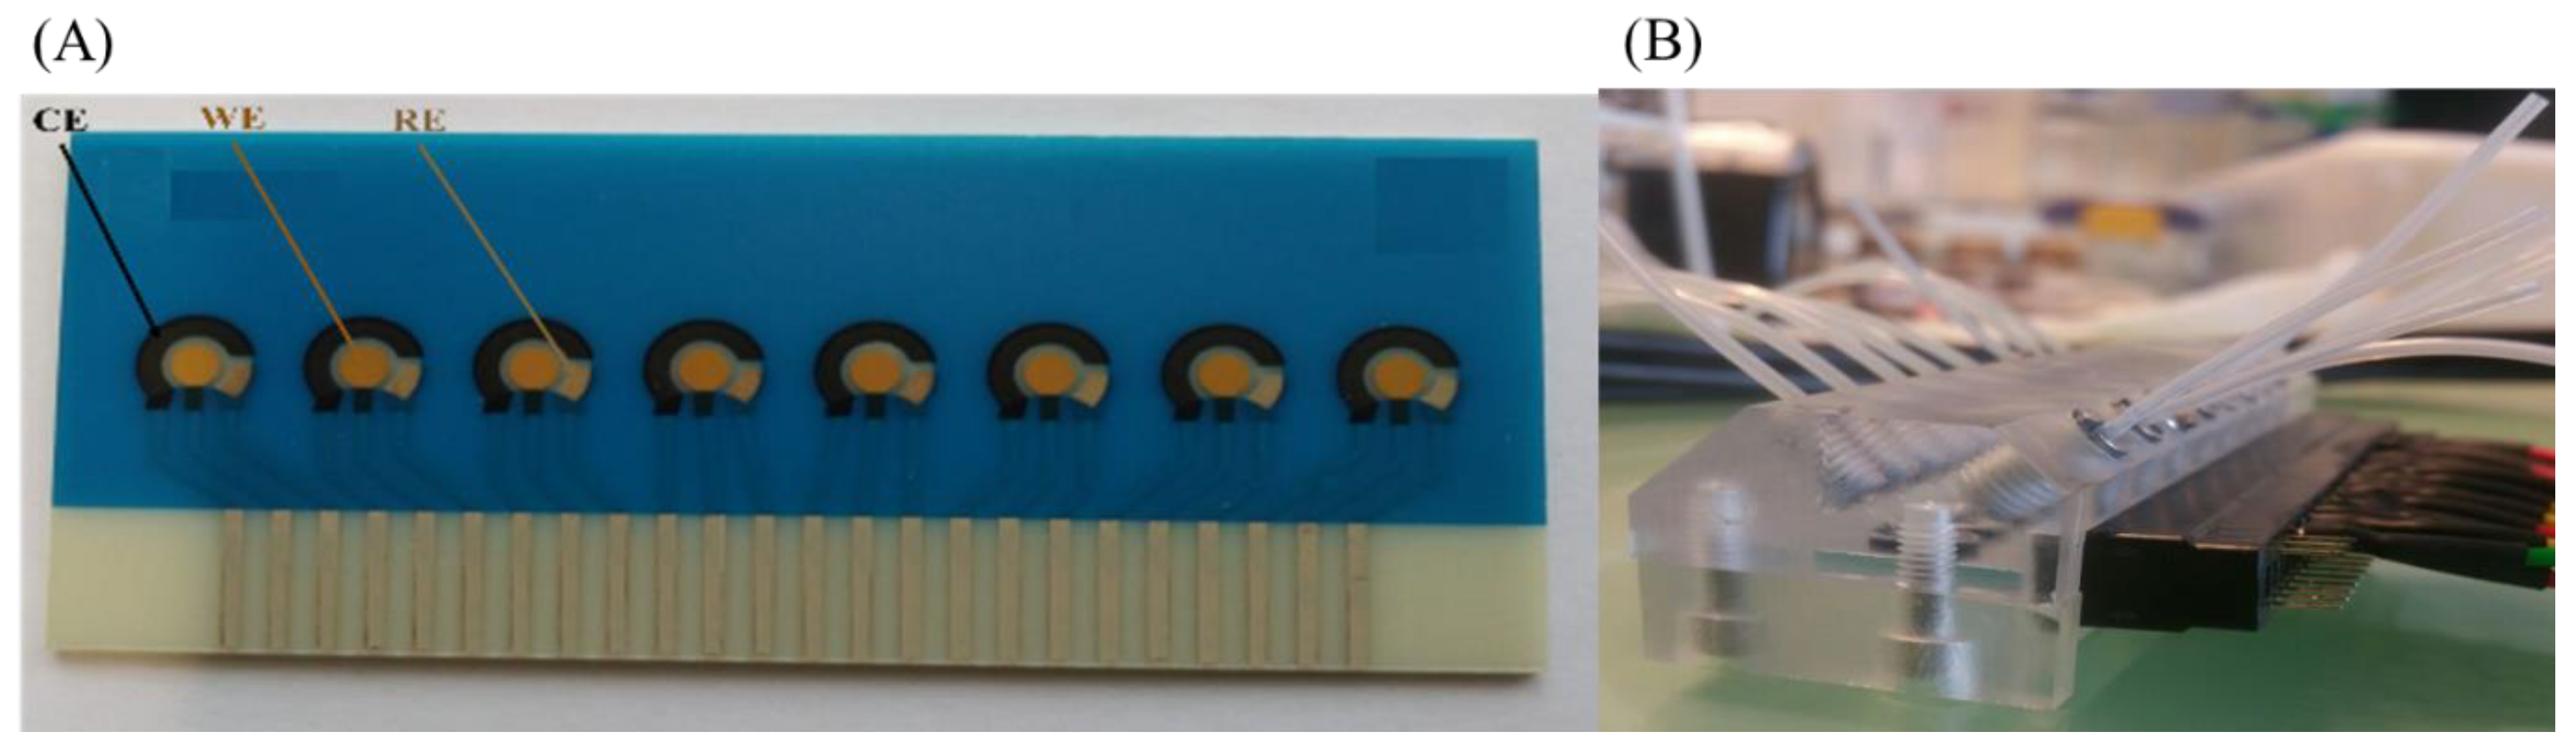
2.3. Screen-Printed Electrodes

The biosensor platform that was used for the detection of HER2 is a lab-on-chip made by Micrux, Spain, with eight units of integrated SPE that make up a contained electrochemical system of one gold working electrode, one silver/silver chloride reference electrode and one carbon counter electrode. These chips were previously fabricated and characterized for detection in complex mediums; an image of it can be seen in Figure 1A [26]. A microfluidic system is then used to place the chips in for ease of use as seen in Figure 1B.

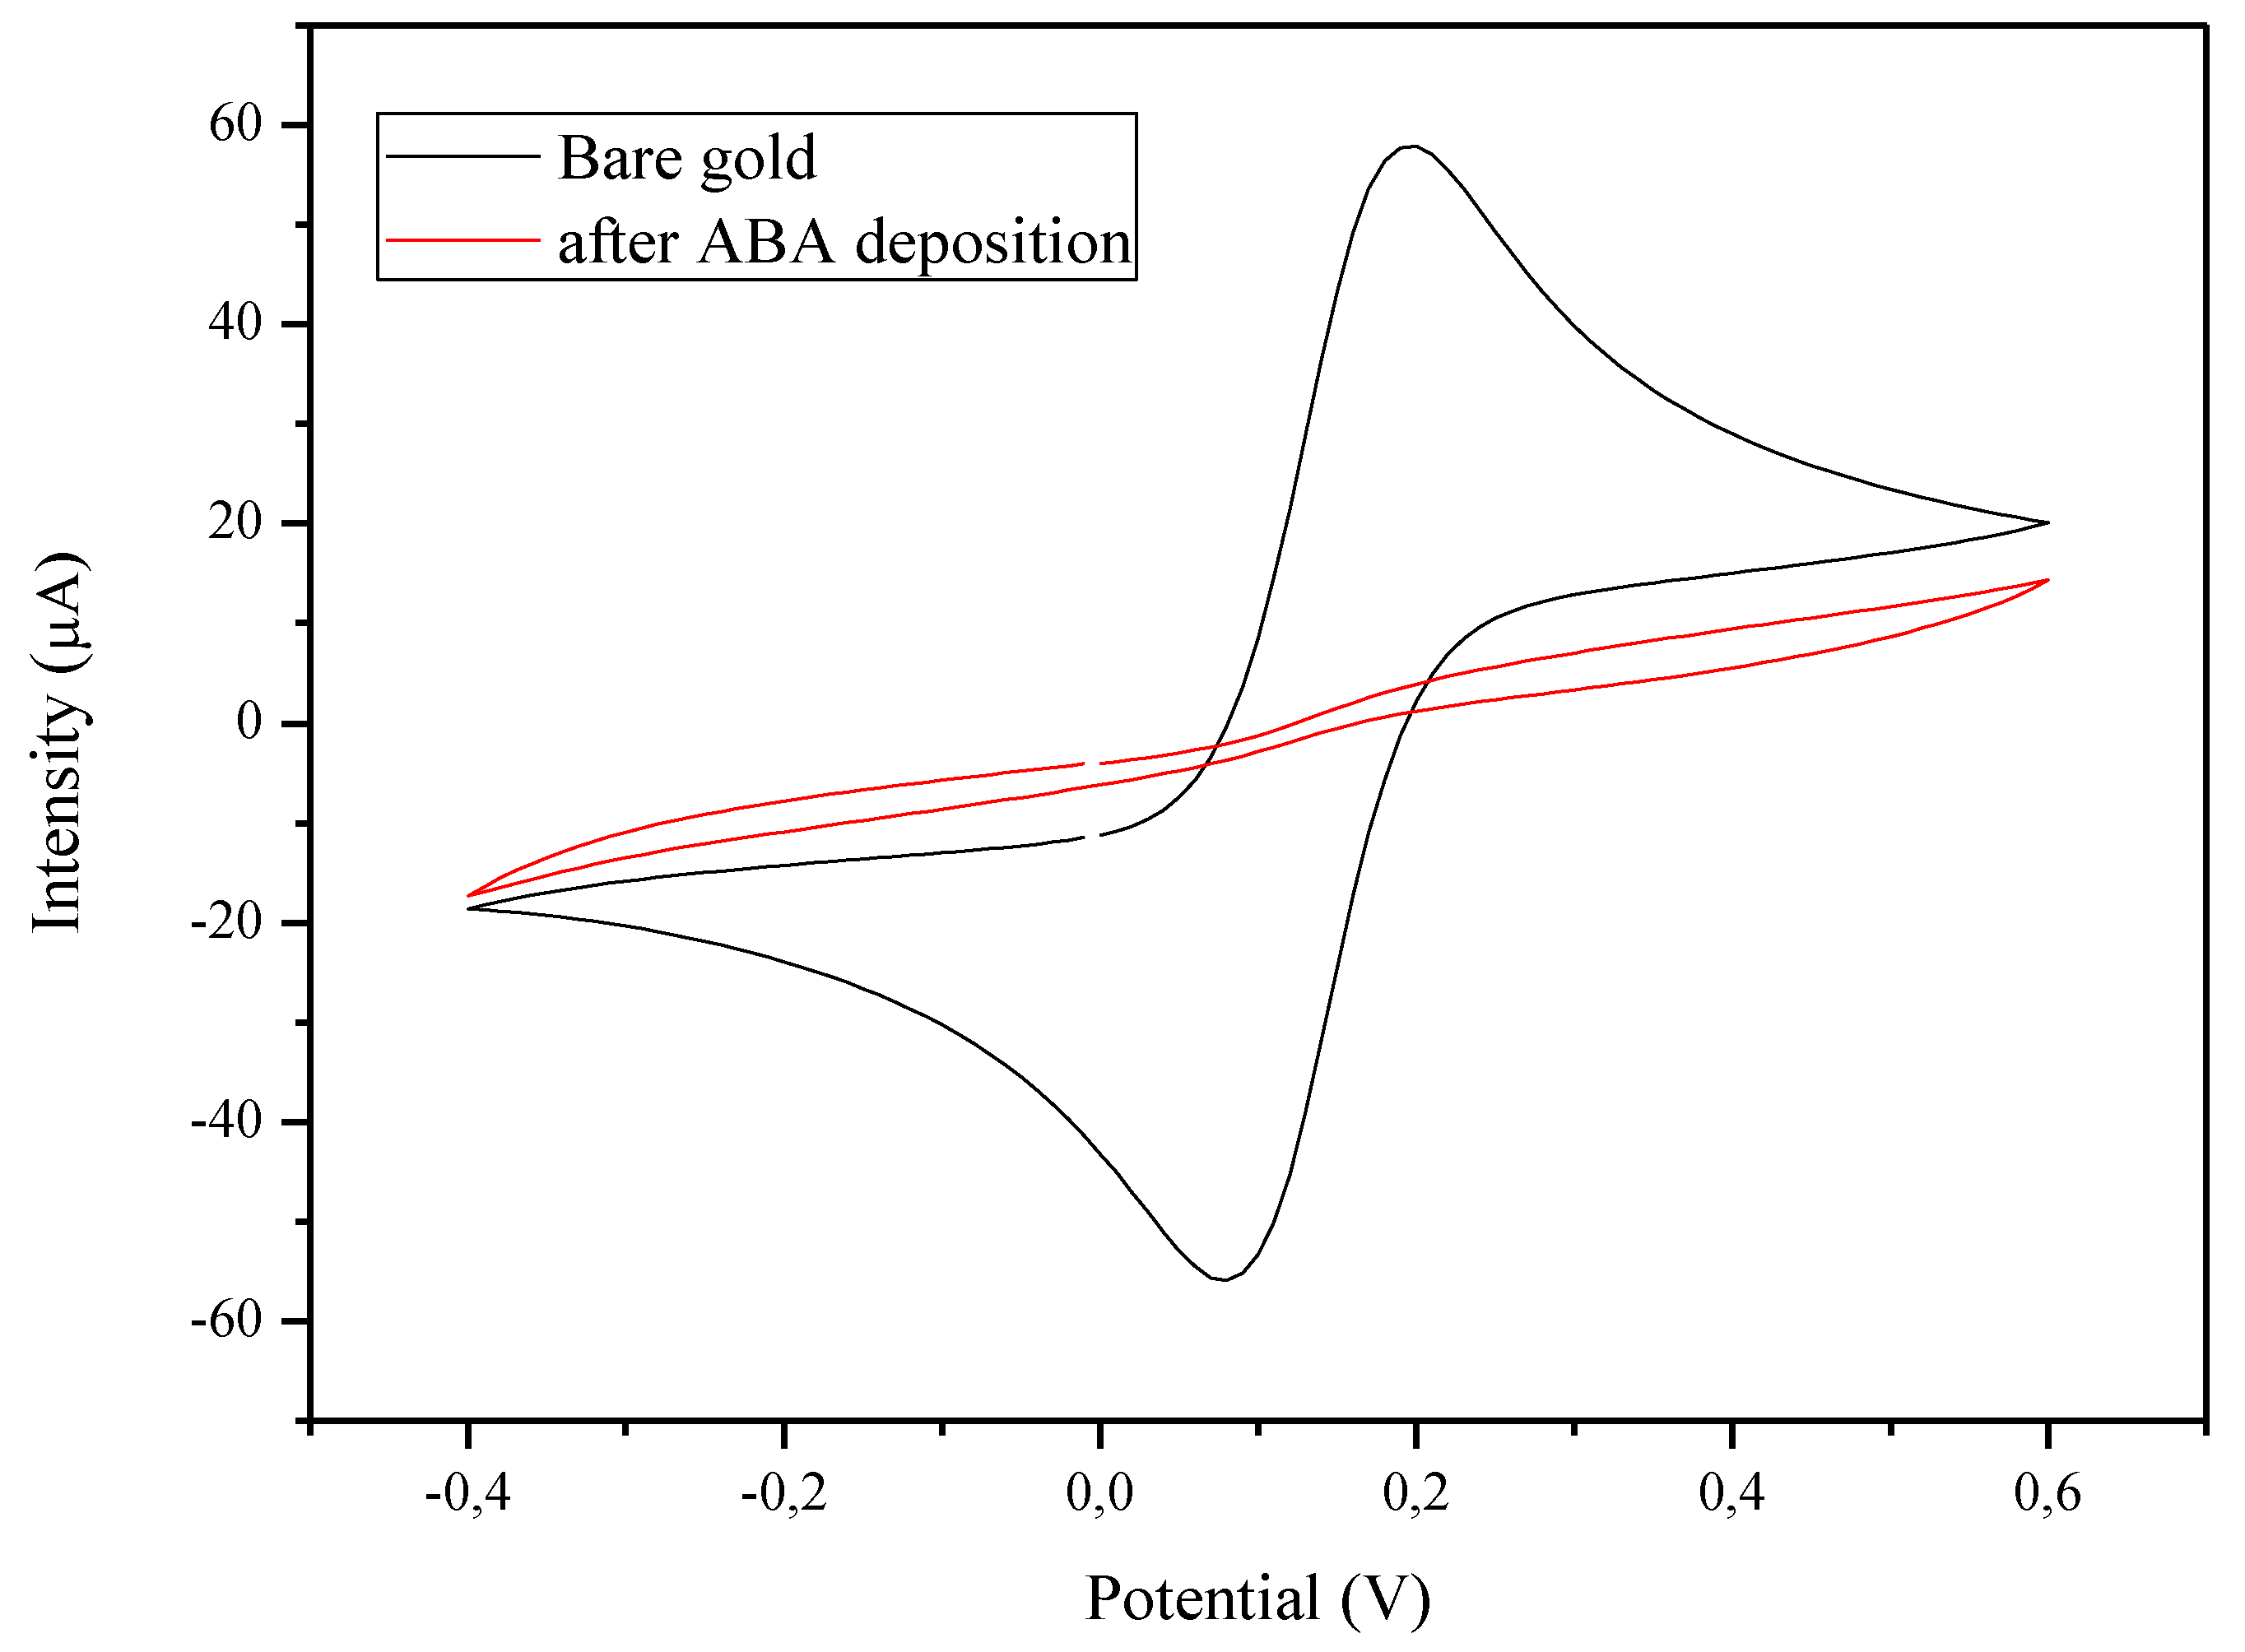
2.4. Electrochemical Characterization

All measurements were done at room temperature (25 ± 2 °C) in a Faraday box using a PalmSense 4 potentiostat (Palmsense B.V., Houten, Netherlands) the software used is PSTrace (version 5.7, Palmsense B.V., Houten, The Netherlands).
CV was used to characterize the SPE using the probe 5 mM of K3[Fe(CN)6]/K4[Fe(CN)6] in PBS buffer at pH = 7.4. The scan rate was 60 mV/s with a window of −0.4 to 0.6 V and was repeated for three scans.
EIS was used to characterize the electrochemical properties of the SPE during the measurement of HER2 concentrations, this was done in 5 mM of K3[Fe(CN)6]/K4[Fe(CN)6] in PBS buffer at pH7.4. The applied potential was kept at 0.174 V versus the integrated reference electrode, an alternative potential of 10 mV, and a frequency window between 0.5 to 10000 Hz. Data analysis was accomplished using the open access software EIS spectrum analyzer.

2.5. Bio-Functionalization of the WE

Biofunctionalization of the WE was carried out in two major steps, the first is the electrodeposition of ABA on the gold surface, the second is the immobilization of the antibody anti-HER2 on the –COOH group of the electrodeposited ABA.
To observe the effects of ABA electrodeposition, CV was used in the parameters that were mentioned in part 2.4 in order to characterize the working electrode before and after deposition. Electrodeposition of ABA was carried out by first: 1 mM ABA solution was dissolved in 0.5 M HCl through 1 min of sonification, then 1 mM NaNO2 was added and the solution was kept on ice for 5 min to form the diazonium radicals. This is directly followed by ABA electrodeposition using CV with the following parameters: 15 scan cycles with a scan rate of 0.1 V/s from −0.4 to 0.4 [27,28]. The resulting electrodeposition caused the blocking of the gold surface with ABA, creating a weak electron kinetic transfer. This results in the disappearance of the oxydoreduction peaks of Fe2+/Fe3+ that are present in the solution upon characterization of the SPE using CV as seen in Figure 2.
Anti-HER2 was then immobilized on top of the ABA by first activating the carboxylic acid groups of ABA molecules with EDC/NHS coupling agents through incubating them (electrodes) in EDC (0.4 M)/NHS (0.1 M) in water for 40 min. Afterwards the device was washed with PBS to eliminate excess EDC/NHS, and immediately incubated with the antibody anti-HER2 in PBS (10 µg/mL) for 40 min at room temperature, afterwards the remaining carboxylic groups were deactivated by incubating the SPE in ethanolamine solution (1‰ in PBS) at room temperature for 30 min [29].

2.6. HER2 Detection in Real Saliva

To perform the detection in real saliva, 1 µg/mL HER2 stock solution was dissolved in 1 mL of a real saliva; the real saliva was taken from a healthy male subject aged 28 years at 10 a.m. after breakfast. This created a solution of real saliva with an HER2 concentration of 1 ng/mL HER2. This step is followed by dissolving the above-mentioned saliva solution in equal volume in four different aliquots, then diluting in each aliquot different volumes of the stock HER2 solution of 10 µg/mL in each aliquot to create the range of concentration (0, 5, 10, 20, and 40 pg/mL of added standard HER2 concentration).

3. Results

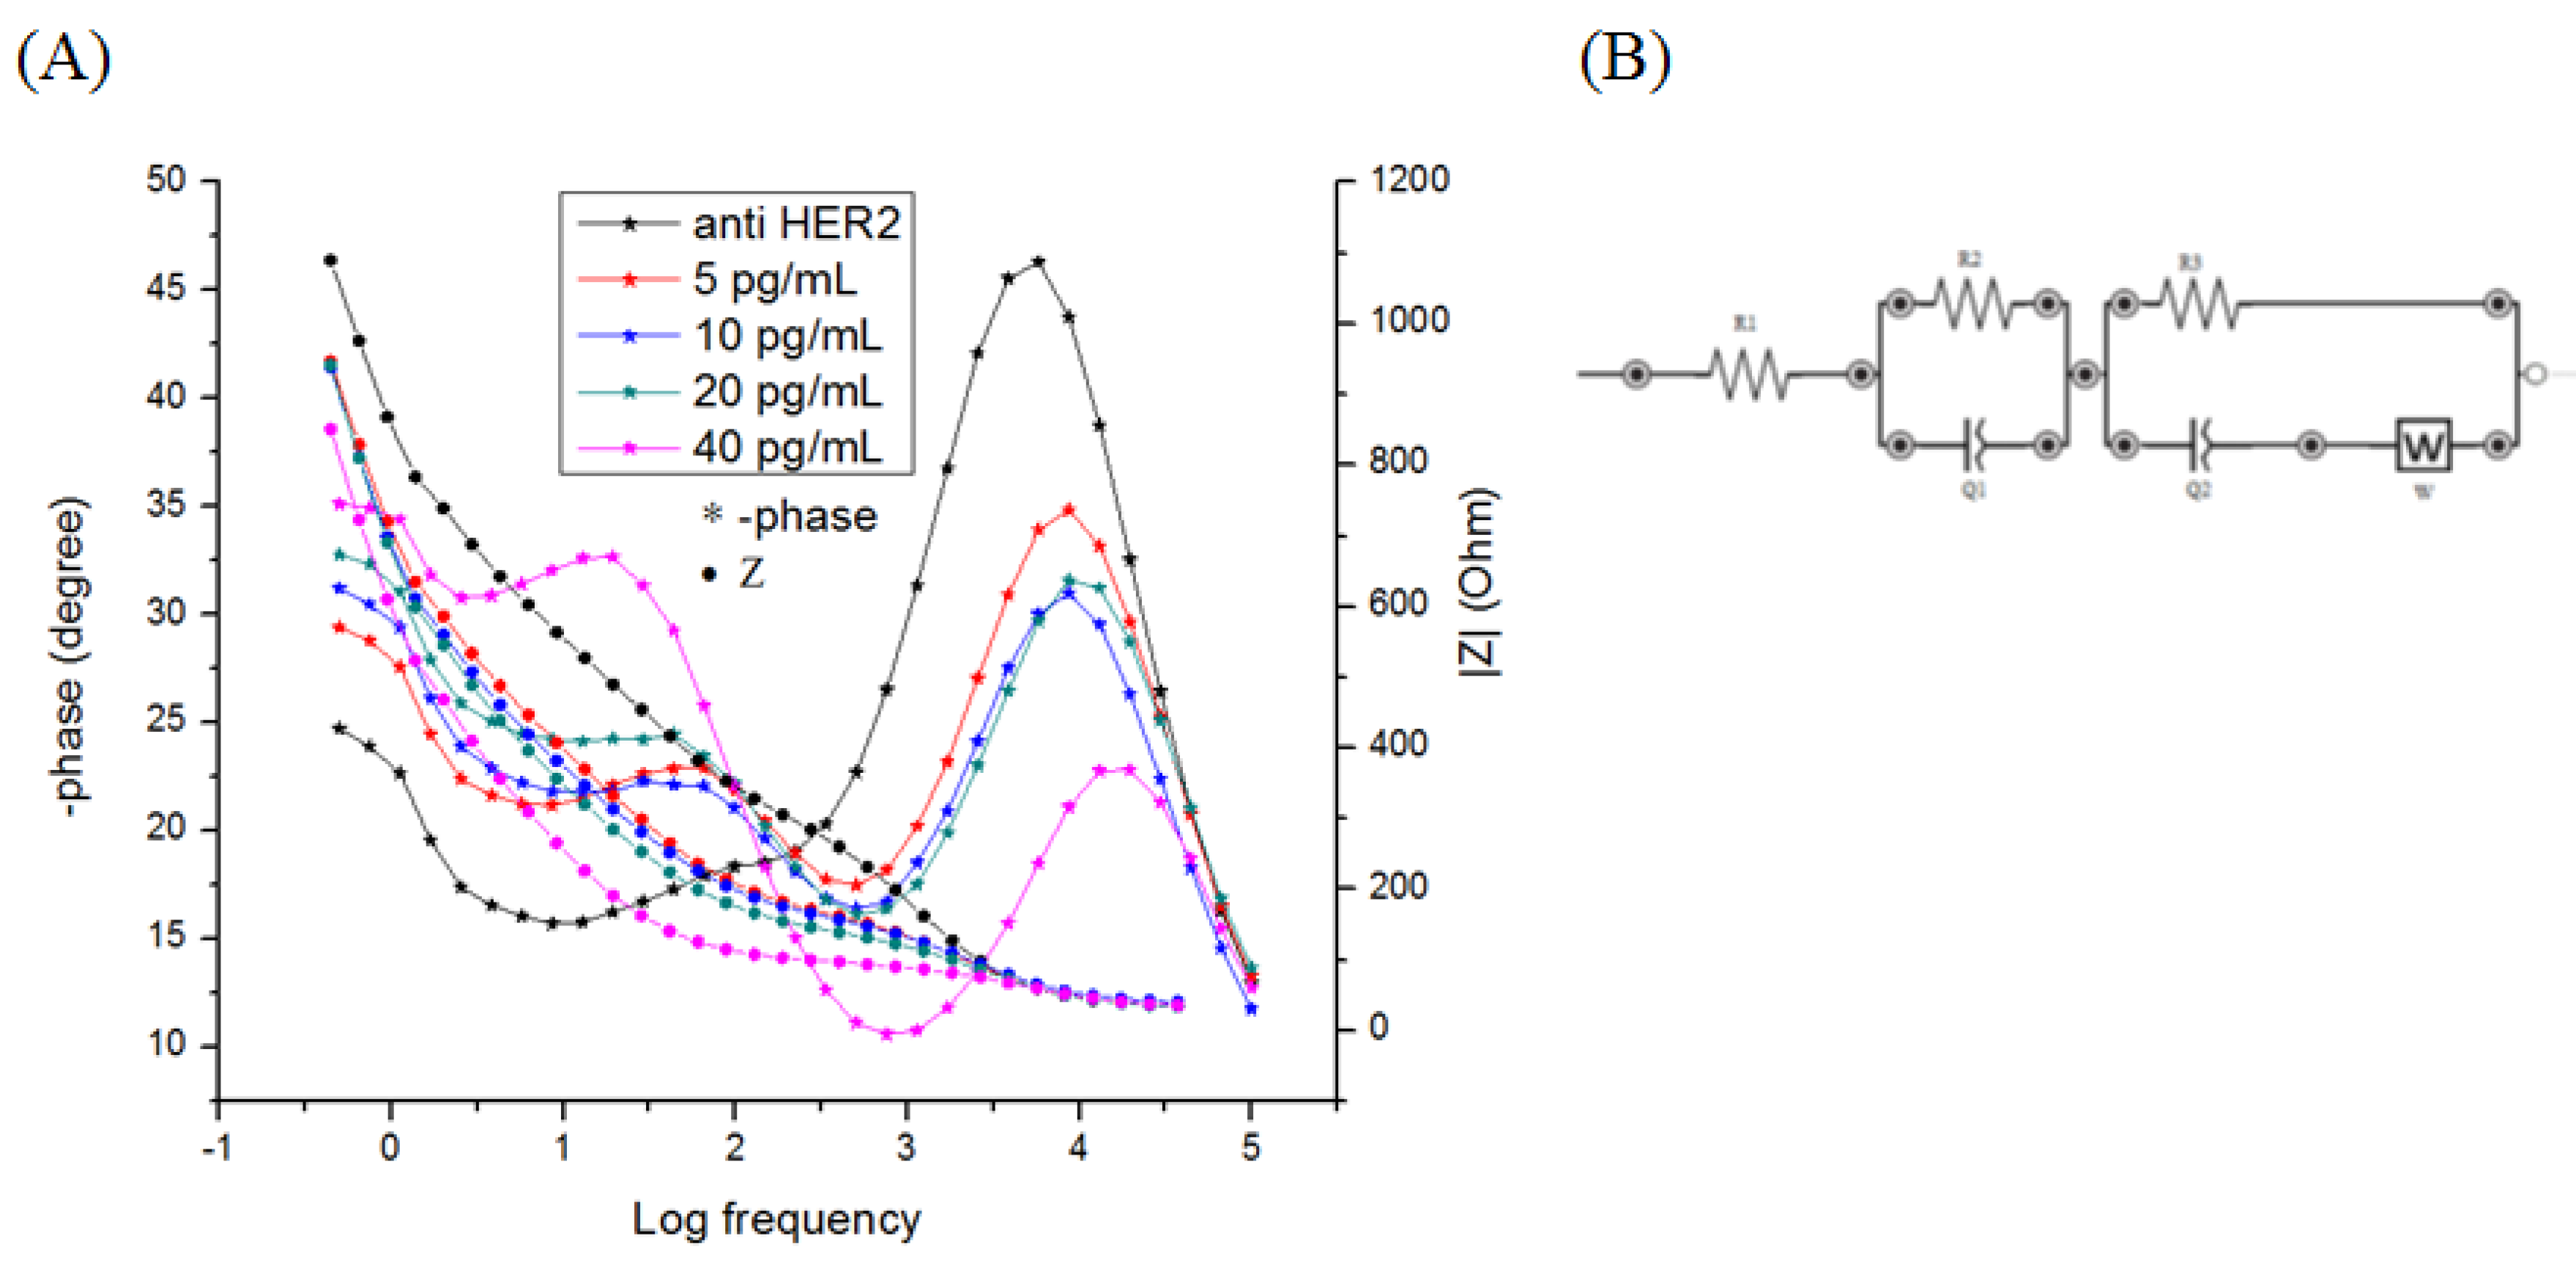
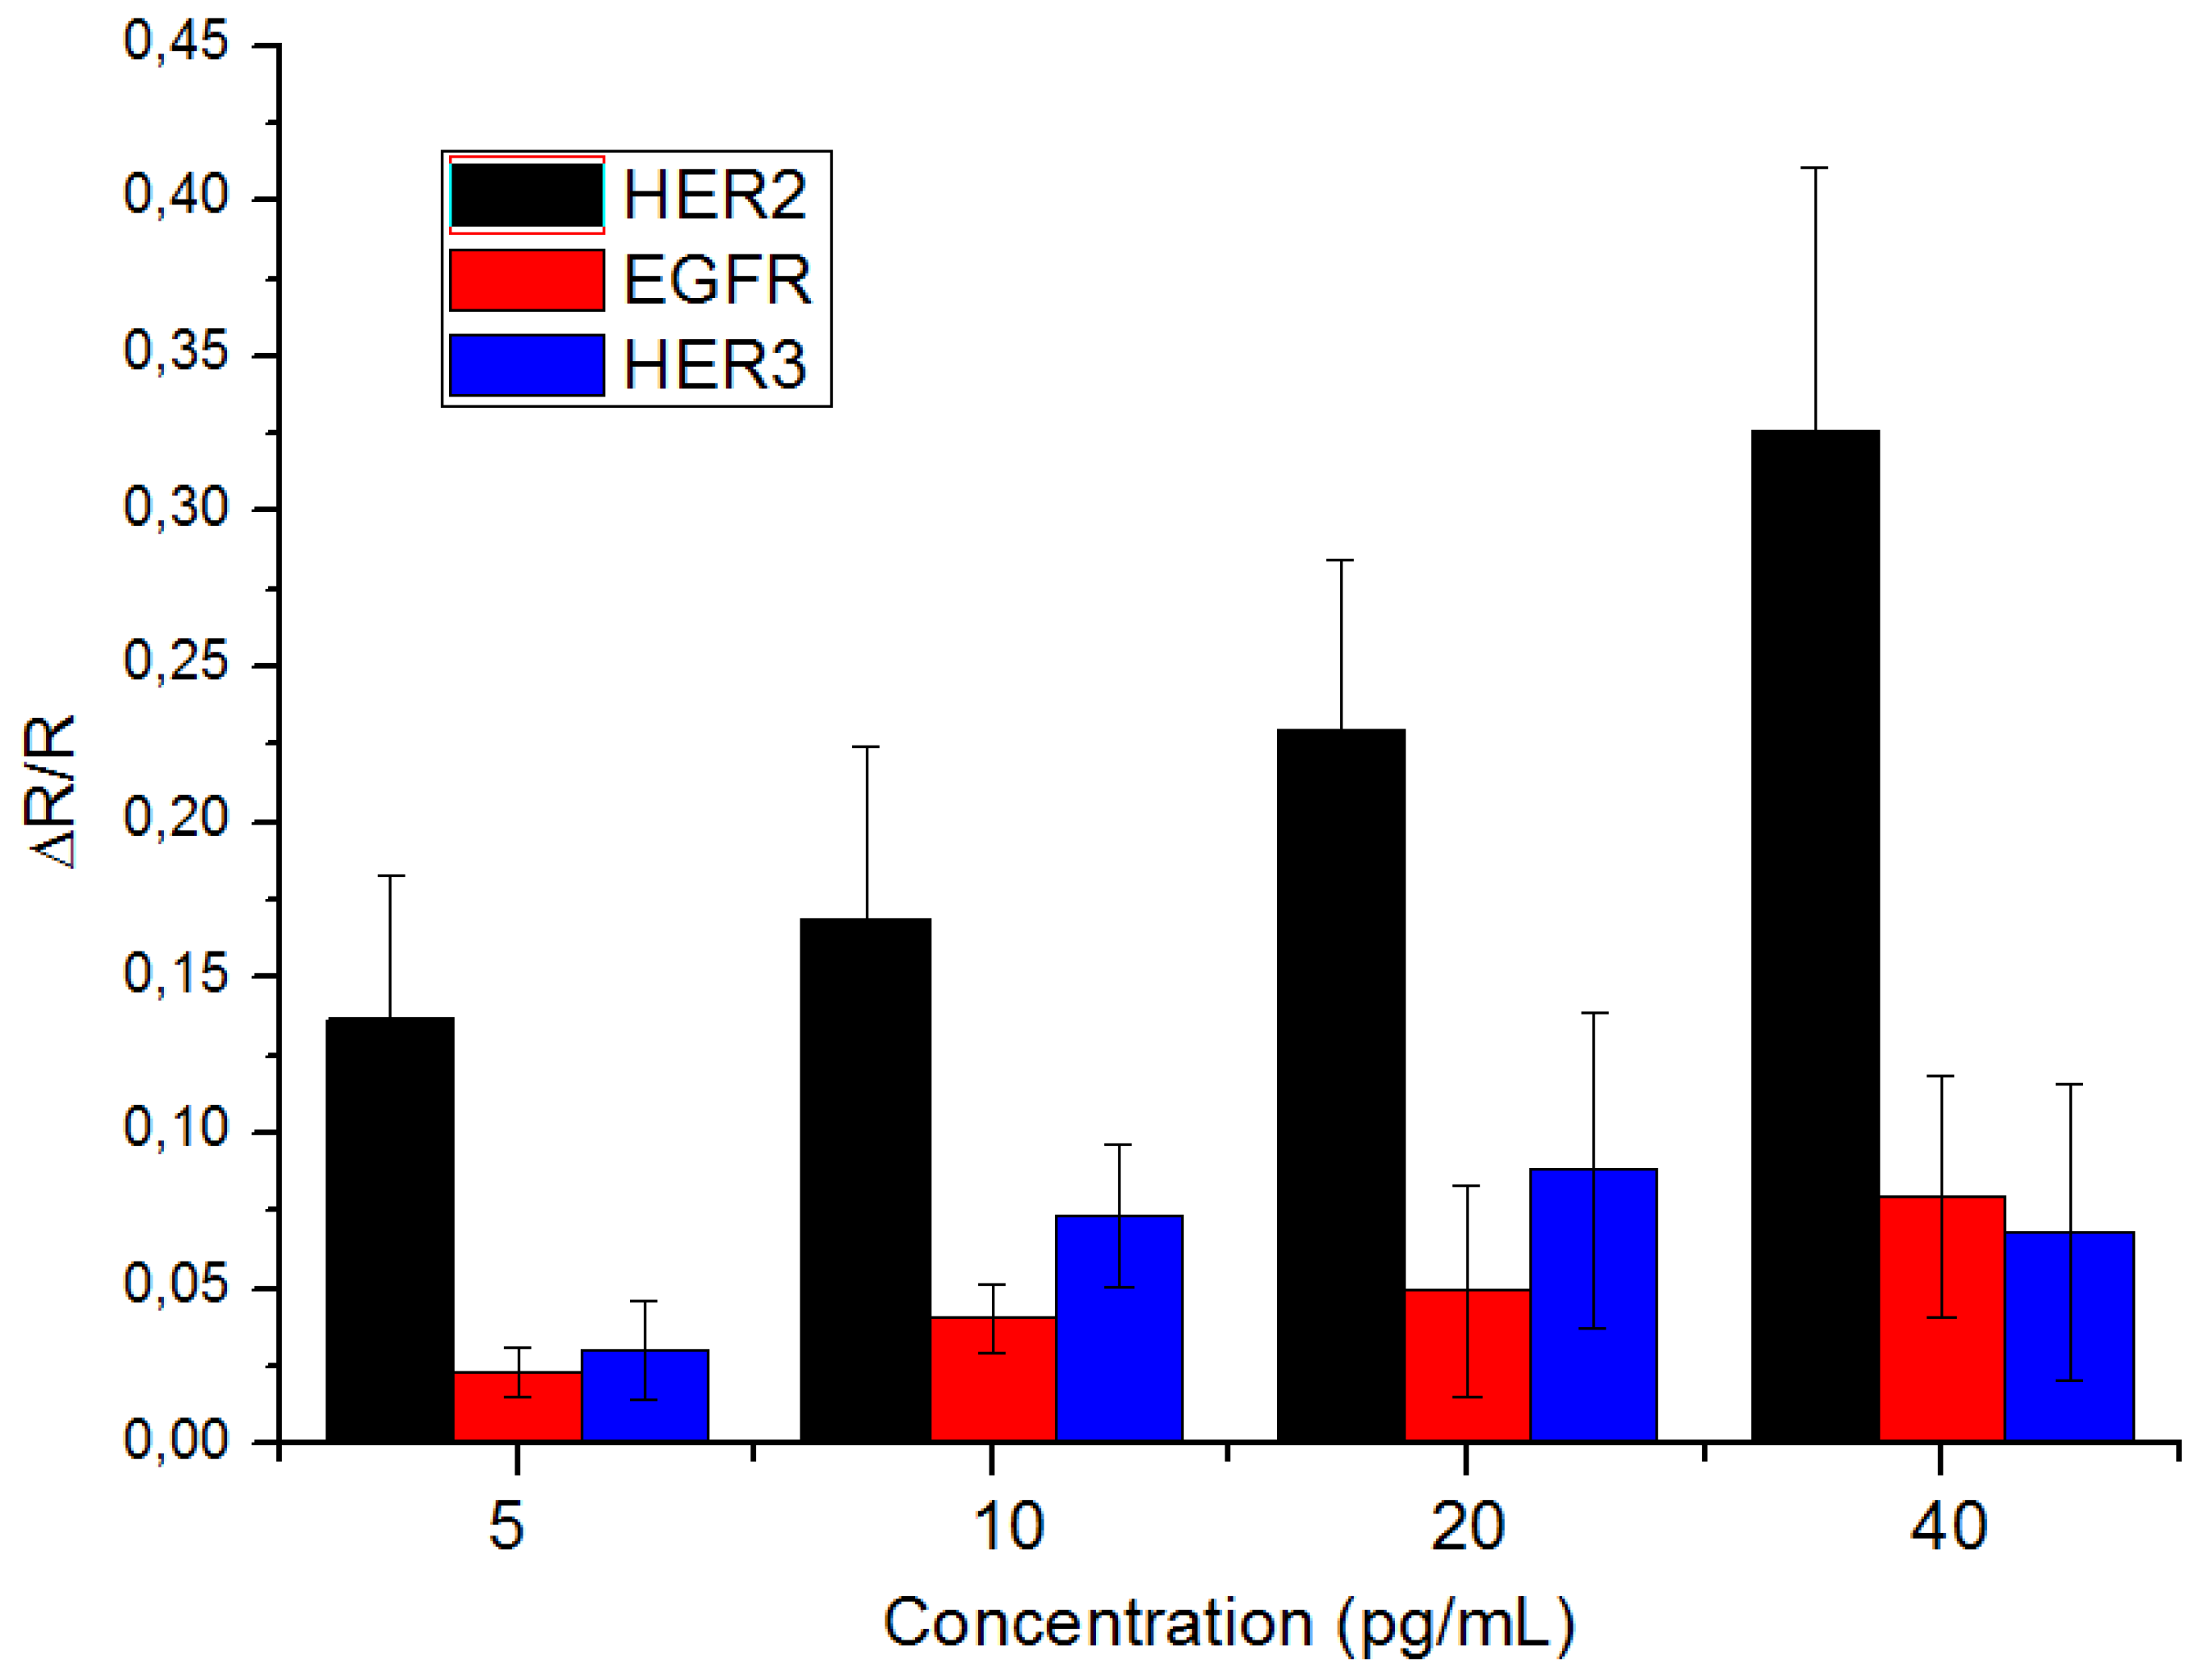
3.1. Detection and Interferences of HER2 in PBS

Detection of HER2 concentrations are presented in Bode plot format in Figure 3A. Bode plot allows the presentation of both the total impedance described as Z (Ohm) and the phase angle (degree) shifts in relations to base 10 logarithms of the frequencies (log freq) of a given spectrum. The equivalent circuit used for the detection can be found in Figure 3A inlet.
Fitting was done using EIS analyzer, an open source program used for the deduction of the value of each component of a given equivalent circuit. The biosensor is being designed to use the resistive current, as such the area with the greater significant differences in the resistance between each HER2 concentration is the one used for the detection, in this case, it is the R3. The fitting analysis was performed on all the EIS Bode plots. This step is followed by the normalization of the data which is presented in Figure 3B as absolute ΔR3/R3 (Whereas absolute ΔR3/R3 = |R3(HER2)-R3(anti-HER2)|/R3(anti-HER2)) as a function of HER2 concentrations.
To test the sensitivity of the biosensor, the detection of HER2 was tested against the detection of two interfering proteins EGFR and HER3. Their respective detection yielded the following curves: HER2 (Y = (0.0062 ± 0.0001)X + (0.1066 ± 0.0016)/R2 = 0.9992); EGFR (Y = (0.0016 ± 0.0006)X + (0.0188 ± 0.0086)/R2 = 0.7214); and HER3 (Y = (0.0035 ± 0.0018)X + (0.0225 ± 0.0235)/R2 = 0.5992).

3.2. Detection of HER2 in Real Saliva

This is then followed by detecting HER2 in saliva through standard addition method as described in Section 2.4. The results, shown in Figure 4, of the detection of the concentration of the HER2 in saliva is seen in Figure 4, the linearity (R2 = 0.9904) and the detection of the spiked HER2 concentration (Y = (0.0118)X + (0.1282)), meaning the platform can be used in future work for detecting HER2 in saliva.

4. Discussion

4.1. Bode Plot and the Equivalent Circuit

Due to the vast quantity of value a single measurement of EIS provides, several forms of representations were designed in order to show the value of any given measurement. In our case, bode plot proved to be more useful in terms of presentation of our measurement as it allowed us to deduce the equivalent circuit used to fit the data presented through the presentation of the number of peaks shown in the phase shift part of the graph [30]. From Figure 3A, two distinct phase shift peaks are observed: the first starts at log freq of 5 and ends at log freq of 2.5; in this range, the phase angle peaks shift lower when the concentration of HER2 is increased. The other peak starts at log freq 2.5 and ends at log freq of 0; in this range the shift in the phase angle peaks increases with the increase concentration of HER2. Below the log freq of 0 there is a leveling off of the phase shifts indicating the end of the detection peaks. What this means is that the equivalent circuit of the system is made up of three charge resistances, two constant phase elements (CPE), and a Warburg element W as seen in Figure 3B.
In comparison, the impedance part of the plot shows a decrease with the increase concentration of HER2 in each of the steps presented in the graph, this decrease is most pronounced with the second step that corresponds with the second phase shift peak.
A similar circuit was described in the Nouira 2012 article [31] that highlights the presence of two electrochemical layers due to the presence of inter and intra nanoparticle regions. The observation of these two layers in these electrode confirms with the nature of the gold ink used in these screen-printed electrode as them being porous electrodes as discussed in Barhoumi 2019′s work on these electrodes [26,32].
The explanation of the circuit’s components are as follows: The charge resistances presented are as follows: the solution resistance R1, the inter-gold particles resistance R2, which is presented in the high frequency peaks, and the intra-gold particles R3 which is presented in the low frequency peaks. The CPE for the inter- gold particle is Q1 which is presented in the high frequency peaks, and for the intra-gold particle Q2 which is presented in the low frequency peaks, and finally the Warburg diffusion W.

4.2. Detection of HER2 in PBS

The biosensor’s ability to detect HER2 is the responsiveness of the impedance response toward the increasing concentrations of HER2 in PBS. The concentration range chosen is perfect for the detection of salivary HER2 concentrations in healthy individuals and breast cancer patients alike [16,17]. The resulting fit of the bode plot showed excellent response to the concentrations of HER2, while repeated detection of HER2 have yielded a similarly repeatable curve of Y = (0.0055 ± 0.0003)X + (0.1127 ± 0.0052)\R2 = 0.9909 with high linearity, indicating high repeatability.
To test the biosensor’s selectivity, additional tests were carried out using the same bio-functionalization steps as mentioned before only with the detection of biomarkers other than HER2. For that purpose, EGFR and HER3 were chosen. These biomarkers have a similar structure to HER2 [7,33], and while several studies found the presence of EGFR in saliva [16,17] it remains unclear whether HER3 is also present there. The result of the detection of the interferences shows that the biosensor is quite selective at this low concentration; the biosensor managed to detect HER2 with a sensitivity that is four times higher than that of EGFR (Y = (0.0018 ± 0.0005)X + (0.0166 ± 0.0049)\R2 = 0.8072) and twice higher than that of HER3 (Y = (0.0020 ± 0.0169)X + (0.0530 ± 0.0151)\R2 = 0.1302), thus proving the biosensor’s selectivity toward HER2.

4.3. Detection of HER2 in Saliva

The standard addition method is one of the main analytical techniques used in determining an unknown concentration of analyte in complex matrices (biological fluids, soil samples, etc.). However, this detection only works if its linearity continues for the entire working range of the analyte [34]. The detection of HER2 through standard addition method have good linearity (R2 = 0.9904), as seen in Figure 5, while also showing a detection of the concentration of around 10.86 pg/mL of HER2 in the real saliva. Thus, proving that the biosensor can be used for the detection of HER2 in saliva.

5. Conclusions

In conclusion, we would like to report the development of a label-free biosensor for the detection of HER2 in saliva. The biosensor uses integrated gold scree printed electrode as transducer, the biosensor is then biofunctionalized first by electrodeposition of ABA on the gold surface, followed by the immobilization of anti-HER2 antibody on the electrode surface. The biosensor uses EIS to detect the impedance of the biosensor in Fe2+/Fe3+. The result of the detection is a biosensor that is sensitive toward HER2 with high linearity and is four times more sensitive than the interference molecules EGFR and twice more sensitive than HER3. This is then followed by detecting HER2 in real saliva using standard addition method which proved to have great linearity (R2 = 0.9904) proving that this technique can be used to detect HER2 solution with real patients.

Author Contributions

I.A.N. contributed toward the realization of the experiments and the writing of the article. L.M. assisted with the realization of the experiment. A.E. and N.Z. contributed equally toward the design of the biosensor and provided their expertise in the field of electrochemistry and surface modification. W.H. and J.S. have contributed equally, they are the main coordinators and they provided their expertise in the experimental aspects of the research. All authors have read and agreed to the published version of the manuscript.

Funding

We would like to acknowledge the organization UK-Lebanon techhub for funding this research under their project Primispot.

Conflicts of Interest

We declare that there is no conflict of interest in this work.

References

  1. Pilleron, S.; Sarfati, D.; Janssen-Heijnen, M.; Vignat, J.; Ferlay, J.; Bray, F.; Soerjomataram, I. Global cancer incidence in older adults, 2012 and 2035: A population-based study. Int. J. Cancer 2018, 58, 49–58. [Google Scholar] [CrossRef] [PubMed]
  2. Torre, L.A.; Bray, F.; Siegel, R.L.; Ferlay, J.; Lortet-tieulent, J.; Jemal, A. Global Cancer Statistics, 2012. CA Cancer J. Clin. 2015, 65, 87–108. [Google Scholar] [CrossRef] [PubMed]
  3. Ferlay, J.; Colombet, M.; Soerjomataram, I.; Mathers, C.; Parkin, D.M.; Piñeros, M.; Znaor, A.; Bray, F. Estimating the global cancer incidence and mortality in 2018: GLOBOCAN sources and methods. Int. J. Cancer 2018, 1–13. [Google Scholar] [CrossRef]
  4. Duffy, M.J.; Walsh, S.; McDermott, E.W.; Crown, J. Biomarkers in Breast Cancer: Where Are We and Where Are We Going? 1st ed.; Elsevier Inc.: Amsterdam, The Netherlands, 2015; Volume 71, ISBN 9780128022566. [Google Scholar]
  5. Nicolini, A.; Ferrari, P.; Duffy, M.J. Prognostic and predictive biomarkers in breast cancer: Past, present and future. Semin. Cancer Biol. 2018, 52, 56–73. [Google Scholar] [CrossRef]
  6. Rakha, E.A.; Green, A.R. Molecular classification of breast cancer: What the pathologist needs to know. Pathology 2017, 49, 111–119. [Google Scholar] [CrossRef]
  7. Omenn, G.S.; Guan, Y.; Menon, R. A new class of protein cancer biomarker candidates: Differentially expressed splice variants of ERBB2 (HER2/neu) and ERBB1 (EGFR) in breast cancer cell lines. J. Proteomics 2014, 107, 103–112. [Google Scholar] [CrossRef]
  8. Ferreira, P.M.P.; Pessoa, C. Molecular biology of human epidermal receptors, signaling pathways and targeted therapy against cancers: New evidences and old challenges. Brazilian J. Pharm. Sci. 2017, 53. [Google Scholar] [CrossRef]
  9. Greabu, M.; Battino, M.; Mohora, M.; Totan, A.; Didilescu, A.; Spinu, T.; Totan, C.; Miricescu, D.; Radulescu, R. Saliva—A diagnostic window to the body, both in health and in disease. J. Med. Life 2009, 2, 124–132. [Google Scholar] [PubMed]
  10. Liu, J.; Duan, Y. Saliva: A potential media for disease diagnostics and monitoring. Oral Oncol. 2012, 48, 569–577. [Google Scholar] [CrossRef] [PubMed]
  11. Abrao Nemeir, I.; Saab, J.; Hleihel, W.; Errachid, A.; Jafferzic-Renault, N.; Zine, N. The Advent of Salivary Breast Cancer Biomarker Detection Using Affinity Sensors. Sensors 2019, 19, 2373. [Google Scholar] [CrossRef]
  12. Malon, R.S.P.; Sadir, S.; Balakrishnan, M.; Córcoles, E.P. Saliva-Based Biosensors: Noninvasive Monitoring Tool for Clinical Diagnostics. Biomed Res. Int. 2014, 2014, 1–20. [Google Scholar] [CrossRef] [PubMed]
  13. Chojnowska, S.; Baran, T.; Wilińska, I.; Sienicka, P.; Cabaj-Wiater, I.; Knaś, M. Human saliva as a diagnostic material. Adv. Med. Sci. 2018, 63, 185–191. [Google Scholar] [CrossRef]
  14. Yordanova, M.G.; Gerova, D.I.; Galunska, B.T. Saliva application in oral and systemic diseases. Scr. Sci. Medica 2018, 50, 13–18. [Google Scholar] [CrossRef]
  15. Streckfus, C.; Bigler, L.; Dellinger, T.; Dai, X.; Kingman, A.; Thigpen, J.T. The presence of soluble c-erbB-2 in saliva and serum among women with breast carcinoma: A preliminary study. Clin. Cancer Res. 2000, 6, 2363–2370. [Google Scholar] [PubMed]
  16. Streckfus, C.F.; Arreola, D.; Edwards, C.; Bigler, L. Salivary protein profiles among her2/neu-receptor-positive and -negative breast cancer patients: Support for using salivary protein profiles for modeling breast cancer progression. J. Oncol. 2012, 2012, 1–9. [Google Scholar] [CrossRef]
  17. Laidi, F.; Bouziane, A.; Lakhdar, A.; Khabouze, S.; Rhrab, B.; Zaoui, F. Salivary expression of soluble HER2 in breast cancer patients with positive and negative HER2 status. OncoTargets Ther. 2014, 7, 1285–1289. [Google Scholar] [CrossRef] [PubMed]
  18. Chiu, M.L.; Lawi, W.; Snyder, S.T.; Wong, P.K.; Liao, J.C.; Gau, V. Matrix Effects-A Challenge Toward Automation of Molecular Analysis. JALA J. Assoc. Lab. Autom. 2010, 15, 233–242. [Google Scholar] [CrossRef]
  19. Jayanthi, V.S.P.K.S.A.; Das, A.B.; Saxena, U. Recent advances in biosensor development for the detection of cancer biomarkers. Biosens. Bioelectron. 2017, 91, 15–23. [Google Scholar] [CrossRef] [PubMed]
  20. Barhoumi, L.; Baraket, A.; Bellagambi, F.G.; Karanasiou, G.S.; Ali, M.B.; Fotiadis, D.I.; Bausells, J.; Zine, N.; Sigaud, M.; Errachid, A. A novel chronoamperometric immunosensor for rapid detection of TNF-A in human saliva. Sens. Actuators B Chem. 2018, 266, 477–484. [Google Scholar] [CrossRef]
  21. Baraket, A.; Lee, M.; Zine, N.; Sigaud, M.; Bausells, J.; Errachid, A. A fully integrated electrochemical biosensor platform fabrication process for cytokines detection. Biosens. Bioelectron. 2017, 93, 170–175. [Google Scholar] [CrossRef]
  22. Bahadir, E.B.; Sezgintürk, M.K. A review on impedimetric biosensors. Artif. Cells, Nanomedicine Biotechnol. 2016, 44, 248–262. [Google Scholar] [CrossRef] [PubMed]
  23. Randviir, E.P.; Banks, C.E. Electrochemical impedance spectroscopy: An overview of bioanalytical applications. Anal. Methods 2013, 5, 1098–1115. [Google Scholar] [CrossRef]
  24. Karunakaran, C.; Rajkumar, R.; Bhargava, K. Introduction to Biosensors. Biosens. Bioelectron. 2015, 60, 1–68. [Google Scholar]
  25. Taleat, Z.; Khoshroo, A.; Mazloum-Ardakani, M. Screen-printed electrodes for biosensing: A review (2008-2013). Microchim. Acta 2014, 181, 865–891. [Google Scholar] [CrossRef]
  26. Barhoumi, L.; Bellagambi, F.G.; Vivaldi, F.M.; Baraket, A.; Clément, Y.; Zine, N.; Ali, M.B.; Elaissari, A.; Errachid, A. Ultrasensitive immunosensor array for TNF-α detection in artificial saliva using polymer-coated magnetic microparticles onto screen-printed gold electrode. Sensors 2019, 19, 692. [Google Scholar] [CrossRef]
  27. Radi, A.E.; Lates, V.; Marty, J.L. Mediatorless hydrogen peroxide biosensor based on horseradish peroxidase immobilized on 4-carboxyphenyl film electrografted on gold electrode. Electroanalysis 2008, 20, 2557–2562. [Google Scholar] [CrossRef]
  28. Campuzano, S.; Yánez-Sedeño, P.; Pingarrón, J.M. Electrochemical bioaffinity sensors for salivary biomarkers detection. TrAC Trends Anal. Chem. 2017, 86, 14–24. [Google Scholar] [CrossRef]
  29. Abrao Nemeir, I.; Saab, J.; Hleihel, W.; Errachid, A.; Zine, N. Impedimetric label-free detection of salivary EGFR on screen printed electrode. Integr. Cancer Sci. Ther. 2019, 6, 1–3. [Google Scholar] [CrossRef]
  30. Huang, J.; Li, Z.; Liaw, B.Y.; Zhang, J. Graphical analysis of electrochemical impedance spectroscopy data in Bode and Nyquist representations. J. Power Sources 2016, 309, 82–98. [Google Scholar] [CrossRef]
  31. Nouira, W.; Maaref, A.; Vocanson, F.; Siadat, M.; Saulnier, J.; Lagarde, F.; Jaffrezic-Renault, N. Enhancement of Enzymatic IDE Biosensor Response Using Gold Nanoparticles. Example of the Detection of Urea. Electroanalysis 2012, 24, 1088–1094. [Google Scholar] [CrossRef]
  32. Lasia, A. Electrochemical Impedance Spectroscopy and Its Applications; Springer: New York, NY, USA, 2014; Volume 9781461489337, ISBN 9781461489337. [Google Scholar]
  33. Sierke, S.L.; Cheng, K.; Kim, H.H.; Koland, J.G. Biochemical characterization of the protein tyrosine kinase homology domain of the ErbB3 (HER3) receptor protein. Biochem. J. 1997, 322, 757–763. [Google Scholar] [CrossRef] [PubMed]
  34. Bellagambi, F.G.; Baraket, A.; Longo, A.; Vatteroni, M.; Zine, N.; Bausells, J.; Fuoco, R.; Di Francesco, F.; Salvo, P.; Karanasiou, G.S.; et al. Electrochemical biosensor platform for TNF-α cytokines detection in both artificial and human saliva: Heart failure. Sens. Actuators B Chem. 2017, 251, 1026–1033. [Google Scholar] [CrossRef]
Figure 1. (A) Chip platform containing 8 integrated screen-printed electrode of a silver/silver oxide reference electrode (RE) a carbon counter electrode (CE) and a gold working electrode (WE) each. (B) The microfluidic system used for the management of the experiment.
Proceedings 60 00017 g001
Figure 2. Effect of the electrodeposition of ABA on the electrode surface. CV of the gold WE in 5 mM K3[Fe(CN)6]/K4[Fe(CN)6] before (black) and after (red) electrodeposition.
Proceedings 60 00017 g002
Figure 3. (A) Bode impedance plot (Log(frequency) vs –phase (°) vs Z (OHM)) of K3[Fe(CN)6]/K4[Fe(CN)6] (5mM) in PBS (pH = 7.4) for various concentrations of HER2. (B) Equivalent circuit used to fit the resulting bode plots.
Proceedings 60 00017 g003
Figure 4. Detection histograms for the detection of HER2 (N = 4 times), EGFR (N = 3 times) and HER3 (N = 4 times) with the error being the calculated standard deviation for each detected protein.
Proceedings 60 00017 g004
Figure 5. Result of the standard addition method for the detection of HER2 in real saliva (N = 1).
Proceedings 60 00017 g005
Publisher’s Note: MDPI stays neutral with regard to jurisdictional claims in published maps and institutional affiliations.

