Proceeding Paper

Biocompatible Temperature Nanosensors Based on Titanium Dioxide †

1
Department of Chemical Science, University of Padua, Via Marzolo 1, I-35131 Padova, Italy
2
Consorzio INSTM, Via G. Giusti, 9, 50121 Firenze, Italy
*
Author to whom correspondence should be addressed.
Presented at the 1st International Electronic Conference on Biosensors, 2–17 November 2020; Available online: https://iecb2020.sciforum.net/.
Proceedings 2020, 60(1), 16; https://doi.org/10.3390/IECB2020-07086
Published: 2 November 2020
(This article belongs to the Proceedings of The 1st International Electronic Conference on Biosensors)

Abstract

:
The measurement of temperature is of fundamental importance in a huge scale of applications, from nanomedicine, where the early detection of tumorous cells is an essential requirement, to microelectronics and microcircuits. Optical sensors with a micro/nano-spatial resolution can be used for temperature determination within a biological frame. Within this context, Raman spectroscopy is particularly interesting: the inelastic scattering of light has the advantage of a contactless measurement and exploits the temperature-dependence of intensities in the spectrum by observing the intensity ratio of anti-Stokes and Stokes signals. Titanium dioxide can be regarded as a potential optical material for temperature detection in biological samples, thanks to its high biocompatibility, already demonstrated in literature, and to its strong Raman scattering signal. The aim of the present work is the realization of biocompatible optical thermometers, with a sub-micrometric spatial resolution, made of titanium dioxide. Raman measurements have been performed on anatase powder using 514.5, 568.2 and 647.1 nm excitation lines of the CW Ar/Kr ion laser. The laser beam was focalized through a microscope on the sample, kept at defined temperature using a temperature controller. The Stokes and anti-Stokes scattered light was analyzed through a triple monochromator and detected by a liquid nitrogen-cooled CCD camera. Raw data were analyzed with Matlab and Raman spectrum parameters—such as area, intensity, frequency position and width of the peak—were calculated using a Lorentz fitting curve. Preliminary results showed that good reliable temperatures can be obtained.

1. Introduction

The field of temperature sensors application is wide and varied, ranging from the measurement of temperature in biological samples and tissues to the detection of hot spots in microcircuits [1]. In particular, biological applications [2,3,4,5] require high temperature resolution, high spatial resolution and proven biocompatibility of the material chosen as sensor.
Among all techniques available nowadays for temperature measurement with the requirement of nano and micrometric spatial resolution, Raman spectroscopy [6,7,8,9] has the great advantage of a contactless measurement; moreover it does not require a specific preparation of the samples. With respect to other optical thermometric techniques, such as IR thermography, they are characterized by a greater spatial resolution, in the order of the diffraction limit of the probe laser [10].
The Raman effect is the inelastic scattering of light and well-defined characteristics of the Raman spectrum, such as intensity, position in frequency and width of peak signals, are related to temperature. It follows that temperature can be measured from Raman spectra by determining the degree of the shift position of a defined peak at different temperatures, or by evaluating the broadening of its linewidth or by measuring the peak intensity ratio of the anti-Stokes signal to the Stokes signal. In the present work, the anti-Stokes/Stokes intensity ratio is used to estimate the local temperature of the material [11].
A good Raman thermometer material should possess these properties: (a) a large Raman scattering cross-section (to reach high signal-to-noise ratios); (b) high-intensity Raman peaks at low Raman shifts, as the upper limit depends on the working temperature and in general near room temperature it is about 600 cm−1 [9]; indeed the lower the Raman shift, the more sensitive is the peak intensity to temperature; (c) well-defined and distinguishable Raman peaks; (d) low absorbance at the excitation wavelength, to avoid heating mechanisms.
Studies of Raman temperature measurement can be found in literature for silicon [10,12], gallium arsenide [13], gallium nitride [14] and graphene [15]. Titanium dioxide (TiO2) has also been tested in few works as a Raman temperature thermometer for titanium dioxide microparticles [16,17] and for thin films of titania used in solar cells [18].
Titanium dioxide’s general features of chemical stability and nontoxicity make it a very interesting compound for various different applications, including photocatalysis [7,19], optical coatings, optoelectronic devices [20] and biomedicine [21]. It is a wide band gap insulator (3.0 eV [22]) and exists in nature in three different crystal structures: anatase, rutile and brookite. In particular the anatase phase is exploited in photocatalysis, photochemical solar cells, optoelectronic devices and chemical sensors [23,24]. Titanium dioxide seems to suite perfectly all the requirements for a good thermometer material and has been chosen as Raman active thermometric material in our research.

2. Materials and Methods

Raman measurements have been performed using a micro-Raman setup in a back-scattering geometry. The system was equipped with a CW Ti:Sapphire Laser tunable in the range 675–1000 nm (Spectra Physics, 3900S) pumped by a CW Optically Pumped Semiconductor Laser (Coherent, Verdi G7) and an Ar+/Kr+ gas laser (Coherent, Innova 70) providing the lines at 488, 514.5, 530.8, 568 and 647.1 nm. The laser beam was coupled to a microscope (Olympus BX 40) and focused on the sample by 100×, 50× or 20× objectives (Olympus SLMPL). The Raman scattering was collected into the slit of a three-stages subtractive spectrograph (Jobin Yvon S3000) by means of a set of achromatic lenses. The spectrograph was made up of a double monochromator (Jobin Yvon, DHR 320), working as a tunable filter rejecting elastic scattering, and a spectrograph (Jobin Yvon, HR 640). The Raman signal was detected by a liquid nitrogen-cooled CCD (Jobin Yvon, Symphony 1024 × 256 pixels front illuminated).
A temperature-controlled stage (Linkam, THMS600/720) was used to change the temperature of the sample, by means of a liquid nitrogen reservoir and heating resistances. The sample, a commercial anatase powder (Sigma Aldrich, Merck KGaA, St. Louis, Missouri, United States), was inserted in the temperature controller stage, and uniformly heated/cooled to reach the desired temperature, with a rate of 5° K/min and a thermalization time of at least 30 min. Before starting the experiment, a procedure of purging air from the stage chamber with nitrogen was done. Once the thermalization process was done, consecutive Stokes and anti-Stokes measurements were conducted to calculate the local temperature of the sample. Measurements were repeated to obtain a consistent set of data. The frequency incident on the sample was properly chosen in order to avoid sample heating, that is by using photons less energetic than the band gap of titanium dioxide [22]. Measurements of the anti-Stokes/Stokes ratio at different laser powers confirmed that the signal was independent by power over the range explored, i.e., 0.5–20 mW. Usually for temperature measurements a power of 3–4 mW is used.

3. Results and discussion

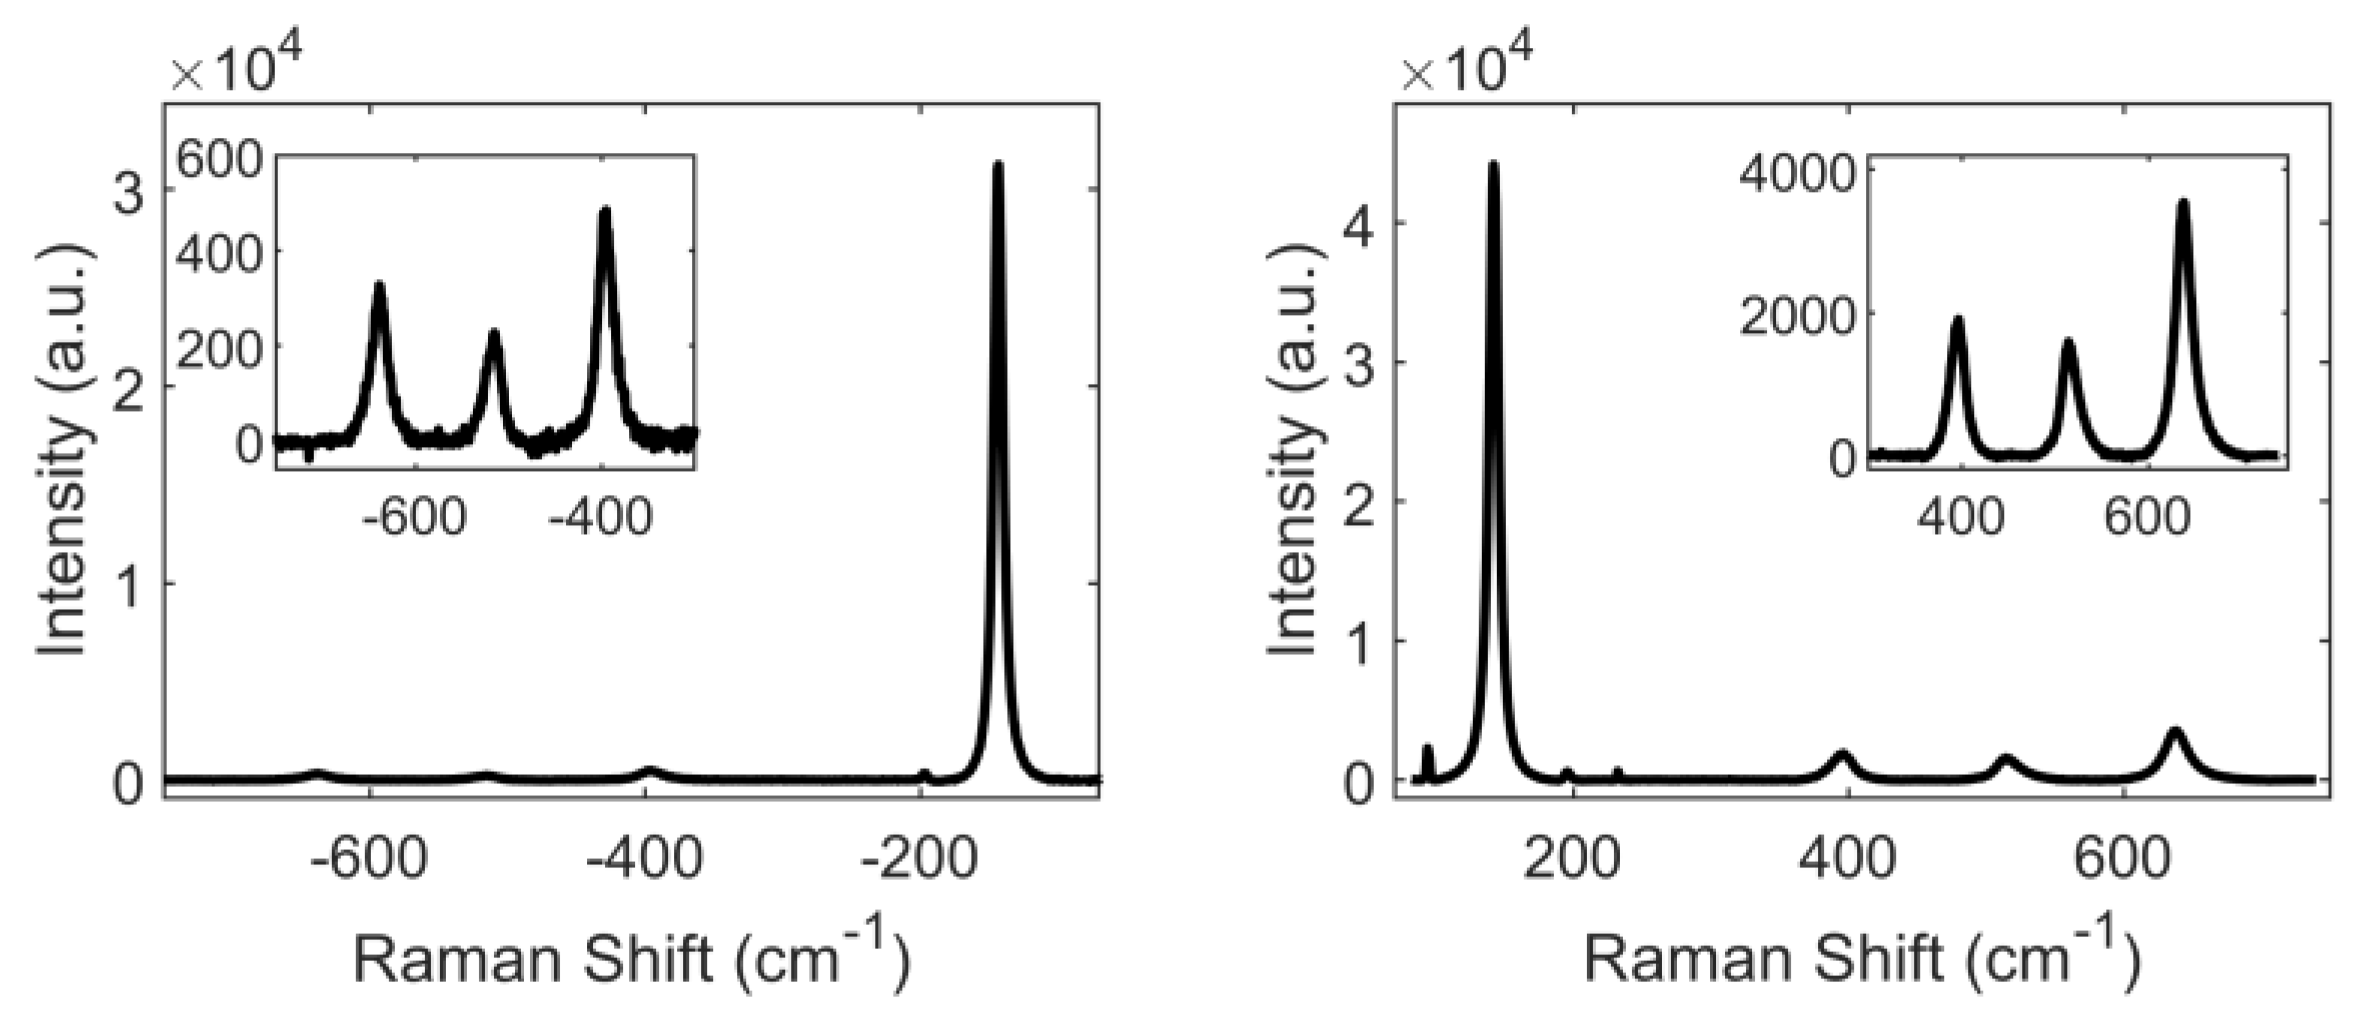
3.1. Characterization of TiO2 through Raman Spectroscopy

The Raman spectrum of anatase powder, recorded at room temperature, using a laser at 647.1 nm with an input power of 1.52 mW, is reported in Figure 1. The spectrum clearly shows an intense peak centered at 143 cm−1 and peaks with a lower intensity that are outlined in the insets.
Anatase is characterized by 15 optical modes at the Γ point of the Brillouin zone, described with the following irreducible representation of the normal vibrational modes [20,25]:
1 A 1 g + 1 A 2 u + 2 B 1 g + 1 B 2 u + 3 E g + 2 E u
Among these, six modes, A 1 g , 2 B 1 g , and 3 E g are the Raman-active ones (as reported in Figure 1 and in Table 1); the Raman spectra show only five peaks since the B1g and A1g modes at 512 and 518 cm−1 are not distinguishable at the experimental conditions. The experimental frequencies, reported in Table 1, have been corrected by using the cyclohexane frequencies as calibration, and are comparable to data reported in literature [20].
By observing Stokes and anti-Stokes data, it turned out that the best peak for temperature monitoring was the Eg mode at 143 cm−1. It is well defined, very intense even at low laser powers, and highly sensitive to temperature, thanks to its low Raman shift.

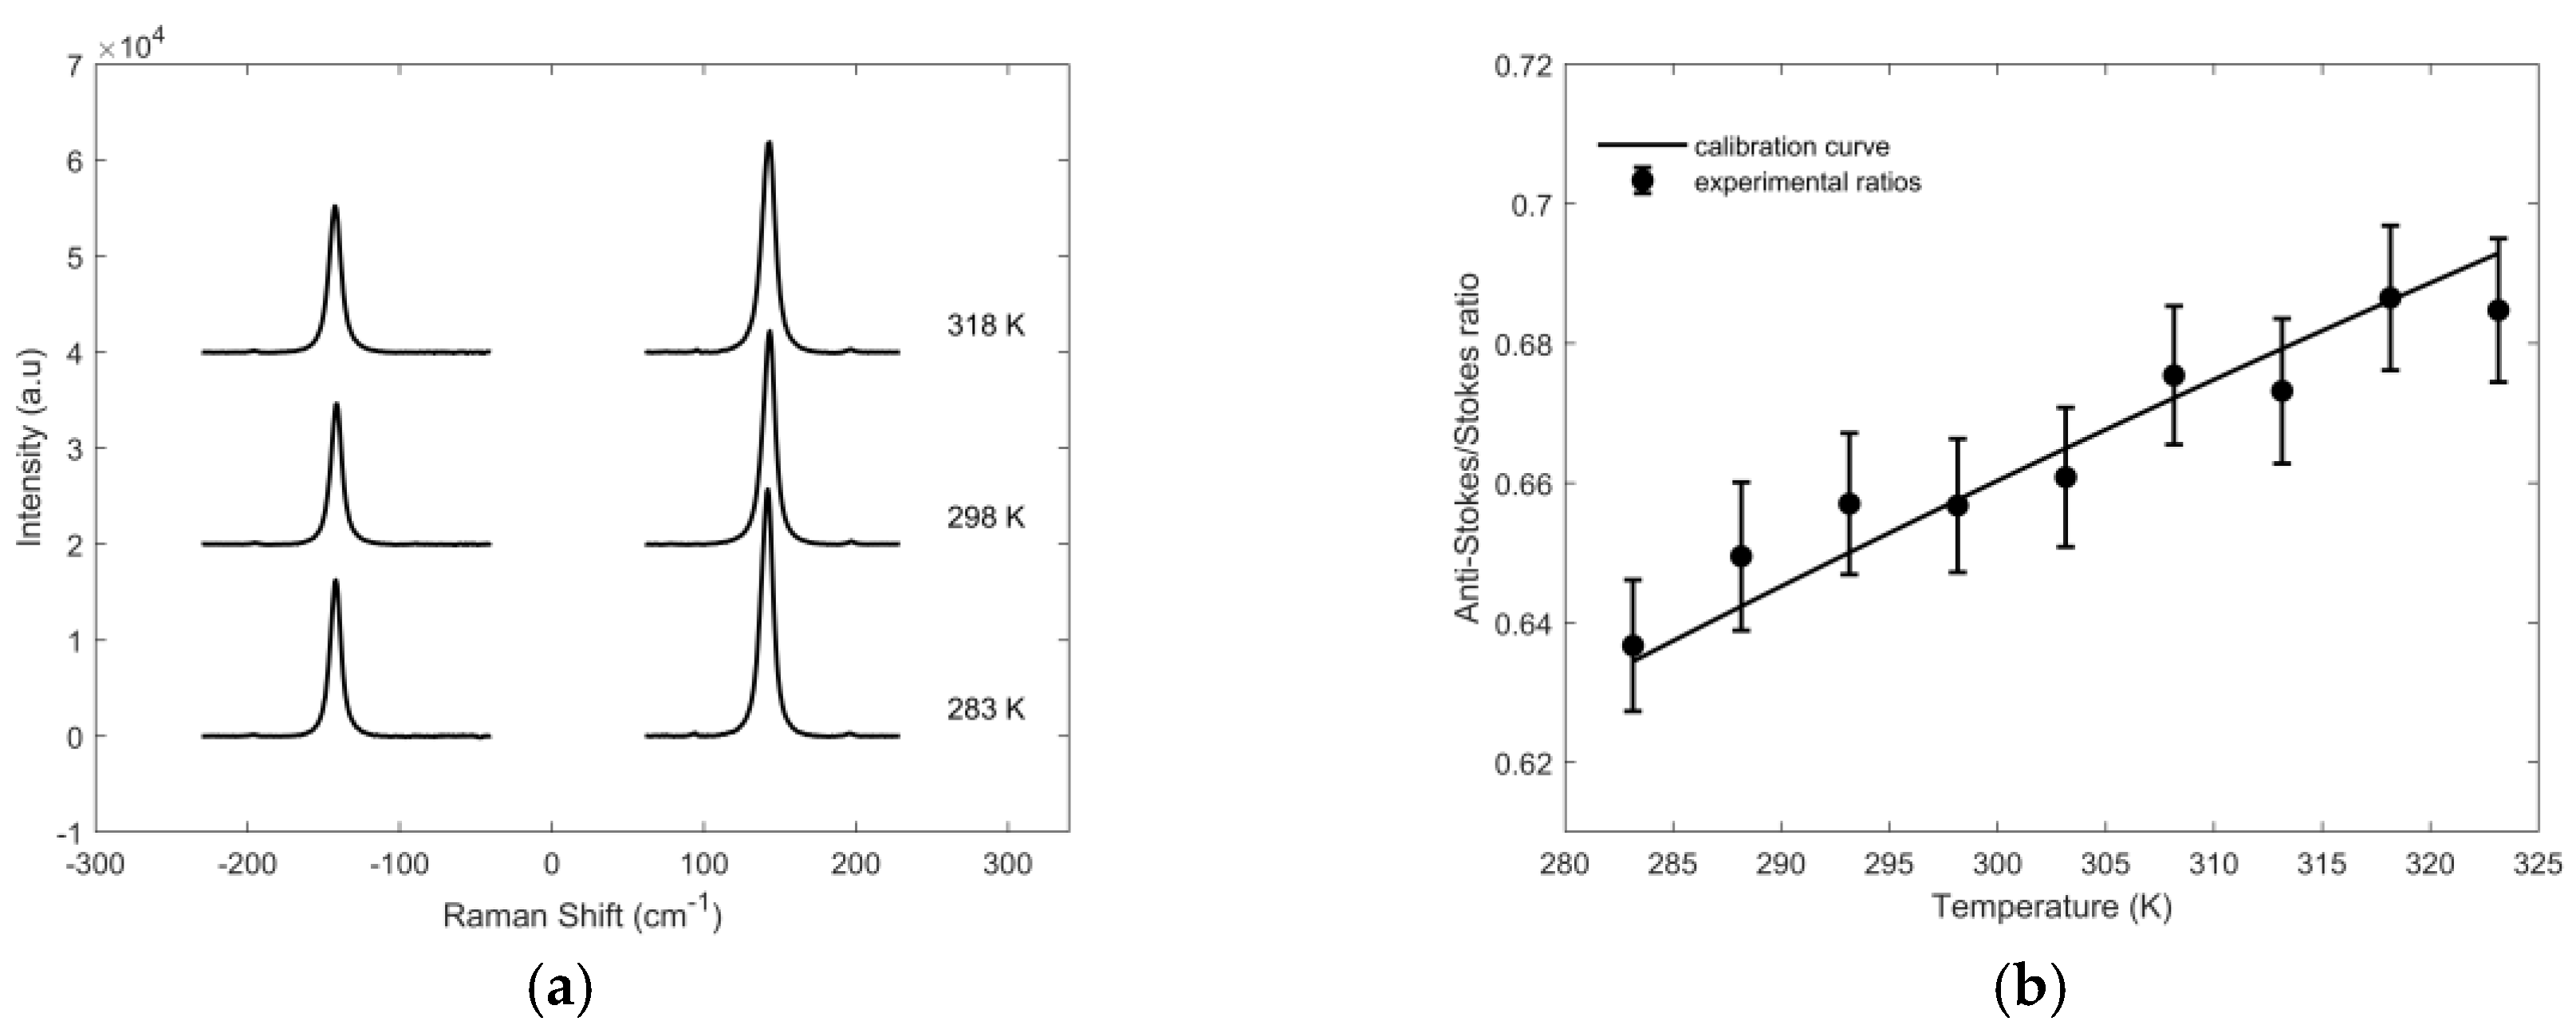
3.2. Temperature Determination

Raw Raman data were analyzed with Matlab, using a Lorentz fitting, to obtain the Raman spectrum parameters, such as area, intensity, frequency position and width of the peak. In particular, the anti-Stokes area of the Eg mode was divided by that of the Stokes signal to obtain the experimental anti-Stokes/Stokes ratio, ρ , reported in Table 2, in the second column.
The anti-Stokes/Stokes ratio allows us to determine the local temperature T   of the sample, through the relation:
ρ = I a S I S = C · ( ν 0 + ν m ) 3 ( ν 0 ν m ) 3 exp ( h ν m k B T )
where ν m is the frequency of the vibrational mode m considered, ν 0 the laser frequency, h the Planck’s constant, k B the Boltzmann constant, and C is the calibration constant. This calibration constant is related to the experimental setup, to parameters such as the polarization of the incident laser and the CCD and grating efficiency. It has been determined at each excitation wavelength by performing measurements at temperature variable in the range 283–323 K. The Raman spectra of the lower-frequency Eg mode recorded at three temperatures, 283, 298 and 318 K, using an excitation source λ e x c = 647.1 nm, are reported in Figure 2a and anti-Stokes/Stokes ratios used for the calibration are plotted in Figure 2b. Equation (1) was fitted to the experimental values, leaving C as a free parameter, and the resulting curve is the solid line shown in Figure 2b.
The same calibration procedure was applied also at 514.5 and 568.2 nm excitation wavelengths and the values of C, with relative uncertainties, are reported in the fourth column of Table 2. The calibration constant of 0.979, 0.964 and 1.22, respectively at 514.5, 568.2 and 647.1 nm, has been determined with a precision of approximately 0.6%–0.8% (less than 1%). Considering that the intensity of the peak can be determined by means of a Voigt fit with a precision of 1%, the total uncertainty on the temperature measurement can be as good as 5 K.
The goodness of the calibration was evaluated on the base of room temperature measurements (at 298 K) on the same sample of titanium dioxide powder, realized on different days. The mean values obtained from the Raman spectra acquired at room temperature using the excitation wavelengths of 514.5, 568.2 and 647.1 nm are reported in Table 2. The second and the third columns report the experimental anti-Stokes/Stokes ratios and the corresponding raw temperatures. These results display a marked difference between temperature measurements at different wavelengths, outlining the importance of the calibration coefficient which considers the instrumental response function, i.e., the efficiency of detection of photons at diverse wavelengths. The last column reports finally the measured temperature of the sample: the temperature values obtained at different wavelengths are very close to the attended one, 298 K.

4. Conclusions

The determination of local temperature at nanoscale is a key requirement to reach the control of physical, chemical and biological processes, since temperature is an important parameter influencing processes themselves. A great experimental effort should be made in the nanothermometry field, from the realization of new materials, to the implementation of detection techniques and test of prototypes of real devices.
In this work titanium dioxide is proposed as a Raman thermometer for biological applications, as it seems to be a good thermometer material, thanks to its optical and biological properties. TiO2, as anatase, has been tested in a wide optical range, at wavelengths of 514.5, 568.2 and 647.1 nm, where it has been demonstrated as efficient in temperature detection, which can be obtained following the identification of the instrumental calibration coefficients.
These preliminary results achieved are promising, and represent a starting point for future experiments, regarding the investigation in a wider wavelength range, close to the biological window, or the realization of more complex titanium dioxide-based systems.

References

  1. Quintanilla, M.; Liz-Marzan, L.M. Guiding Rules for Selecting a Nanothermometer. Nano Today 2018, 19, 126–145. [Google Scholar] [CrossRef]
  2. Neumann, P.; Dolde, I.J.F.; Burk, C.; Reuter, R.; Waldherr, G.; Honert, J.; Wolf, T.; Brunner, A.; Shim, J.H.; Suter, D.; et al. Thermometry at the Nanoscale; The Royal Society of Chemistry: London, UK, 2019. [Google Scholar] [CrossRef]
  3. McCabe, K.M.; Hernandez, M. Molecular Thermometry. Pediatric Res. 2010, 67, 469–475. [Google Scholar] [CrossRef]
  4. Bai, T.; Gu, N. Micro/Nanoscale Thermometry for Cellular Thermal Sensing. Small 2016, 12, 4590–4610. [Google Scholar] [CrossRef] [PubMed]
  5. Uchiyama, S.; Gota, C.; Tsuji, T.; Inada, N. Intracellular temperature measurements with fluorescent polymeric thermometers. Chem. Commun. 2017, 53, 10976–10992. [Google Scholar] [CrossRef] [PubMed]
  6. McCreery, R.L. Raman Spectroscopy for Chemical Analysis; John Wiley & Sons: Hoboken, NJ, USA, 2000. [Google Scholar] [CrossRef]
  7. Griffiths, J.E.; Malyj, M. Stokes/Anti-Stokes Raman Vibrational Temperatures: Reference Materials, Standard Lamps, and Spectrophotometric Calibrations. Appl. Spectrosc. 1983, 37, 315–333. [Google Scholar] [CrossRef]
  8. Beechem, T.E.; Serrano, J.R. Raman Thermometry of Microdevices: Choosing a Method to Minimize Error. Spectroscopy 2011, 26, 36–44. [Google Scholar]
  9. Tuschel, D. Raman Thermometry: Understanding the Mathematics to Better Design Raman Measurements. Spectroscopy 2019, 34, 8–13. [Google Scholar]
  10. Serrano, J.R.; Phinney, L.M.; Kearney, S.P. Micro-Raman evaluation of polycrystalline silicon MEMS devices. MRS Online Proc. Libr. Arch. 2005, 890. [Google Scholar] [CrossRef]
  11. Beechem, T.; Christensen, A.; Graham, S.; Green, D. Micro-Raman thermometry in the presence of complex stresses in GaN devices. J. Appl. Phys. 2008, 103, 8. [Google Scholar] [CrossRef]
  12. Abel, M.R.; Graham, S.; Serrano, J.R.; Kearney, S.P.; Phinney, L.M. Raman thermometry of polysilicon microelectromechanical systems in the presence of an evolving stress. J. Heat Transf. Trans. ASME 2007, 129, 329–334. [Google Scholar] [CrossRef]
  13. Sarua, A.; Bullen, A.; Haynes, M.; Kuball, M. High-resolution Raman temperature measurements in GaAs p-HEMT multifinger devices. IEEE Trans. Electron Devices 2007, 54, 1838–1842. [Google Scholar] [CrossRef]
  14. Ahmad, I.; Kasisomayajula, V.; Holtz, M.; Berg, J.M.; Kurtz, S.R.; Tigges, C.P.; Allerman, A.A.; Baca, A.G. Self-heating study of an AlGaN/GaN-based heterostructure field-effect transistor using ultraviolet micro-Raman scattering. Appl. Phys. Lett. 2005, 86, 3. [Google Scholar] [CrossRef]
  15. Calizo, I.; Balandin, A.A.; Bao, W.; Miao, F.; Lau, C.N. Temperature dependence of the Raman spectra of graphene and graphene multilayers. Nano Lett. 2007, 7, 2645–2649. [Google Scholar] [CrossRef]
  16. Rassat, S.D.; Davis, E.J. Temperature-measurement of single levitated microparticles using Stokes anti-Stokes Raman intensity ratios. Appl. Spectrosc. 1994, 48, 1498–1505. [Google Scholar] [CrossRef]
  17. Lundt, N.; Kelly, S.T.; Rodel, T.; Remez, B.; Schwartzberg, A.M.; Ceballos, A.; Baldasseroni, C.; Anastasi, P.A.F.; Cox, M.; Hellman, F.; et al. High spatial resolution Raman thermometry analysis of TiO2 microparticles. Rev. Sci. Instrum. 2013, 84, 7. [Google Scholar] [CrossRef]
  18. Gallardo, J.J.; Navas, J.; Zorrilla, D.; Alcantara, R.; Valor, D.; Fernandez-Lorenzo, C.; Martin-Calleja, J. Micro-Raman Spectroscopy for the Determination of Local Temperature Increases in TiO2 Thin Films due to the Effect of Radiation. Appl. Spectrosc. 2016, 70, 1128–1136. [Google Scholar] [CrossRef] [PubMed]
  19. Peral, J.; Domenech, X.; Ollis, D.F. Heterogeneous photocatalysis for purification, decontamination and deodorization of air. J. Chem. Technol. Biotechnol. 1997, 70, 117–140. [Google Scholar] [CrossRef]
  20. Giarola, M.; Sanson, A.; Monti, F.; Mariotto, G.; Bettinelli, M.; Speghini, A.; Salviulo, G. Vibrational dynamics of anatase TiO2: Polarized Raman spectroscopy and ab initio calculations. Phys. Rev. B 2010, 81, 7. [Google Scholar] [CrossRef]
  21. Yin, Z.F.; Wu, L.; Yang, H.G.; Su, Y.H. Recent progress in biomedical applications of titanium dioxide. Phys. Chem. Chem. Phys. 2013, 15, 4844–4858. [Google Scholar] [CrossRef]
  22. Pascual, J.; Camassel, J.; Mathieu, H. Resolved Quadrupolar Transition in TiO2. Phys. Rev. Lett. 1977, 39, 1490–1493. [Google Scholar] [CrossRef]
  23. Fujishima, A.; Honda, K. Electrochemical Photolysis of Water at a Semiconductor Electrode. Nature 1972, 238, 37–38. [Google Scholar] [CrossRef] [PubMed]
  24. Michael, G. The Artificial Leaf, Molecular Photovoltaics Achieve Efficient Generation of Electricity from Sunlight. Comments Inorg. Chem. 2006, 12, 93–111. [Google Scholar] [CrossRef]
  25. Ohsaka, T.; Izumi, F.; Fujiki, Y. Raman spectrum of anatase, TiO2. J. Raman Spectrosc. 1978, 7, 321–324. [Google Scholar] [CrossRef]
Figure 1. Stokes (right) and anti-Stokes (left) Raman spectrum of titanium dioxide anatase at 647.1 nm.
Proceedings 60 00016 g001
Figure 2. (a) Raman spectra of the lower-frequency Eg mode recorded at 283, 298 and 318 K, using excitation source of 647.1 nm, (b) anti-Stokes/Stokes experimental ratios (open circles) as function of the temperature imposed by the thermostat and calibration curve (solid line).
Proceedings 60 00016 g002
Table 1. Experimental titanium dioxide anatase Raman-active modes compared to those reported in literature [20].
SymmetryExperimental (cm−1)Literature [20] (cm−1)
Eg143143
Eg197198
B1g397395
B1g515512
A1g518
Eg640639
Table 2. Anti-Stokes/Stokes ratios and row temperatures determined from Raman experimental data, measured at 298 K, at different excitation wavelengths (II and III columns). Values of the calibration constant at the used excitation wavelengths (IV column). Sample temperature obtained from experimental anti-Stokes/Stokes ratios, using the calibration constant (V column).
Excitation Wavelength (nm)Anti-Stokes/Stokes RatioRaw Temperature (K)Calibration ConstantSample Temperature (K)
514.50.52312920.979 ± 0.006301
568.20.51202810.964 ± 0.007296
647.10.65694251.22 ± 0.01298
Publisher’s Note: MDPI stays neutral with regard to jurisdictional claims in published maps and institutional affiliations.

