Proceeding Paper

Reduced Graphene Oxide on Screen-Printed Carbon Electrodes as Biosensor for Escherichia coli O157:H7 Detection †

by
Piravin Raj Barthasarathy
1,2,
Nasteho Ali Ahmed
1 and
Wan Wardatul Amani Wan Salim
1,*
1
Department of Biotechnology Engineering, Faculty of Engineering, International Islamic University Malaysia, Gombak 50728, Kuala Lumpur, Malaysia
2
nanoSkunkWorkX Sdn. Bhd., Level 11, Menara KEN TTDI, 37 Jalan Burhanuddin Helmi, Taman Tun Dr. Ismail 60000, Kuala Lumpur, Malaysia
*
Author to whom correspondence should be addressed.
Presented at the 1st International Electronic Conference on Biosensors, 2–17 November 2020; Available online: https://iecb2020.sciforum.net/.
Proceedings 2020, 60(1), 13; https://doi.org/10.3390/IECB2020-07056
Published: 2 November 2020
(This article belongs to the Proceedings of The 1st International Electronic Conference on Biosensors)

Abstract

:
Mixture of drinking-water supplies with sewage discharges poses disease threats in flood-stricken areas. In such exigent conditions, on-site testing of water samples is the only option, as water samples cannot be transported to laboratories owing to severely impacted transportation services. Hence, we developed a low-cost electrochemical biosensor fabricated from a screen-printed carbon electrode (SPCE) to detect E. coli O157:H7, a virulent pathogen often found in sewage discharges. We focused on understanding antigen-antibody interaction when the antibody used is not specific for E. coli O157:H7. We found that antibody immobilized on a reduced graphene oxide (rGO)–modified SPCEs distinguished between E. coli O157:H7 concentrations of 4 × 10⁸ and 4 CFU/ml, with lowest current reported for 4 × 10⁸ CFU/ml. In contrast, a reduced graphene oxide–modified SPCEs without antibody immobilization does not produce a prominent peak that distinguishes the highest and lowest E. coli concentrations. However, a few E. coli cells were still attached to the rGO/SPCEs in the absence of antibody, as shown in FESEM images. A processing step of differential readings from reference and active electrodes needs to be programmed into an Arduino® microprocessor to realize a prototype of a bacteria sensor for field use.

1. Introduction

Rapid development and deployment of electrochemical biosensors for pathogen quantification is needed for use in flood-stricken areas where drinking-water supplies and sanitation systems are disrupted and making possible serious waterborne diseases. These outbreaks of waterborne diseases become more serious when flooding occurs in rural areas with limited resources, such the case of Kuala Krai, Kelantan, East Coast of Malaysia [1]. In the resource-constrained setting of Kuala Krai, water samples are filtered through microfiltration techniques that remove only large debris and are ineffective for removing bacteria and viruses [2,3]. However, water samples generally cannot be sent to laboratories for biochemical analysis owing to severely impacted transportation facilities. Hence, on-site testing using biosensors may be the only option in such emergency situations. Biosensors for pathogen quantification can be developed by following WHO ASSURED—affordable, sensitive, specific, user-friendly, rapid and robust, equipment-free, and deliverable to end-users—guidelines for diagnostic devices for use in resource-constrained settings [4]. In this paper, we describe a low-cost electrochemical biosensor that can be integrated into an Arduino® microprocessor encased in a portable platform for Escherichia coli (E. coli) O157:H7 detection. To fulfil ASSURED criteria, antibodies used in the biosensors require a very specific epitope to the E. coli strain because surface proteins with similar homologs across bacterial species can lead to nonspecific binding [5]. We aim to understand the effect of E. coli O157:H7 binding to an antibody (Immunoglobulin G, IgG) not specific for E. coli O157:H7 on the measurements made by electrochemical biosensors fabricated from screen-printed carbon electrodes (SPCEs) and their suitability for use in flood-stricken areas.

2. Materials and Methods

2.1. Chemicals and Reagents

Ultra-highly concentrated single-layer graphene oxide (UHC GO, 6.2 mg/mL) was purchased from Graphene Supermarket, Richmond, NY, USA. Potassium ferricyanide (K3Fe(CN)6), potassium ferrocyanide (K4Fe(CN)6·3H2O), phosphate buffered saline (PBS, pH 7.4 at 25 °C) tablets, sulfuric acid (H2SO4), hydrochloric acid (HCl), N-hydroxysulfosuccinimide (NHS), 1-ethyl-3-(3-dimethylaminopropyl) carbodiimide (EDC), and IgG from rabbit serum (I5006) were purchased from Sigma-Aldrich, St. Louis, MI, USA. PBS tablets were dissolved in deionized water, and the pH was adjusted by addition of HCl. Heat-killed Escherichia coli serotype O157:H7 in dextran solution (Product ID: 50-95-90) was purchased from Kirkegaard and Perry Lab (KPL) Inc., Gaithersburg, Maryland, USA. Tap water was collected from sink taps at the Kinetics Laboratory (Faculty of Engineering, IIUM, Malaysia). Deionized water was used throughout this study unless stated otherwise.

2.2. Instrumentation

SPCE activation, graphene oxide reduction, and electrochemical measurements were performed using a portable pocketSTAT (IVIUM Technologies, Eindhoven, The Netherlands) at ambient temperature. The results were analysed using IviumSoft software. Screen-printed carbon electrodes (SPCEs) with Ø = 2 mm-diameter working electrodes (WE) were purchased from Pine Instrument, Grove City, Pennsylvania, USA. The reference electrode (RE) is Ag/AgCl, and the counter electrode (CE) is made of carbon. Morphological change in the modified SPCEs incubated with different E. coli concentrations was observed via field emission scanning electron microscopy (FESEM) using a Hitachi SU8020 UHR Cold-Emission FESEM available at MIMOS Technology Solutions, Sdn. Bhd., Seri Kembangan, Selangor, Malaysia.

2.3. Preparation of GO, rGO, and IgG/rGO Electrodes

All SPCEs were activated using repetitive cyclic voltammetry for 3 cycles at a scanning potential of −2.5 to 2.5 V and scan rate of 100 mV/s in 0.1 M H2SO4. GO/SPCEs were prepared by drop-casting 3 µl GO onto the WE of an activated SPCE and dried at ambient temperature for 2 h. To prepare rGO/SPCEs, GO/SPCEs were electrochemically reduced using repetitive CV for 5 cycles at a scanning potential of 0 to −1.5 V, and scan rate of 100 mV/s in PBS, pH 5.0. Then, 3 µl 1-ethyl-3-(3-dimethylaminopropyl) carbodiimide (EDC; 0.5 M) and N-hydroxysulfosuccinimide (NHS; 0.1 M) (ratio: 1:1) composite was drop-cast onto the WE of a rGO/SPCE, and dried at 37°C for 20 min. Three (3) µl IgG (2 µg/ml) was drop-cast onto the WE of a rGO/SPCE with EDC-NHS and incubated at 37 °C for 2 h. The electrode was rinsed with PBS, pH 7.1, to remove unbound IgG. All modified electrodes were stored in a 90 × 15-mm (diameter × height) Petri dish and kept at ambient temperature until needed for further use.

2.4. Characterization

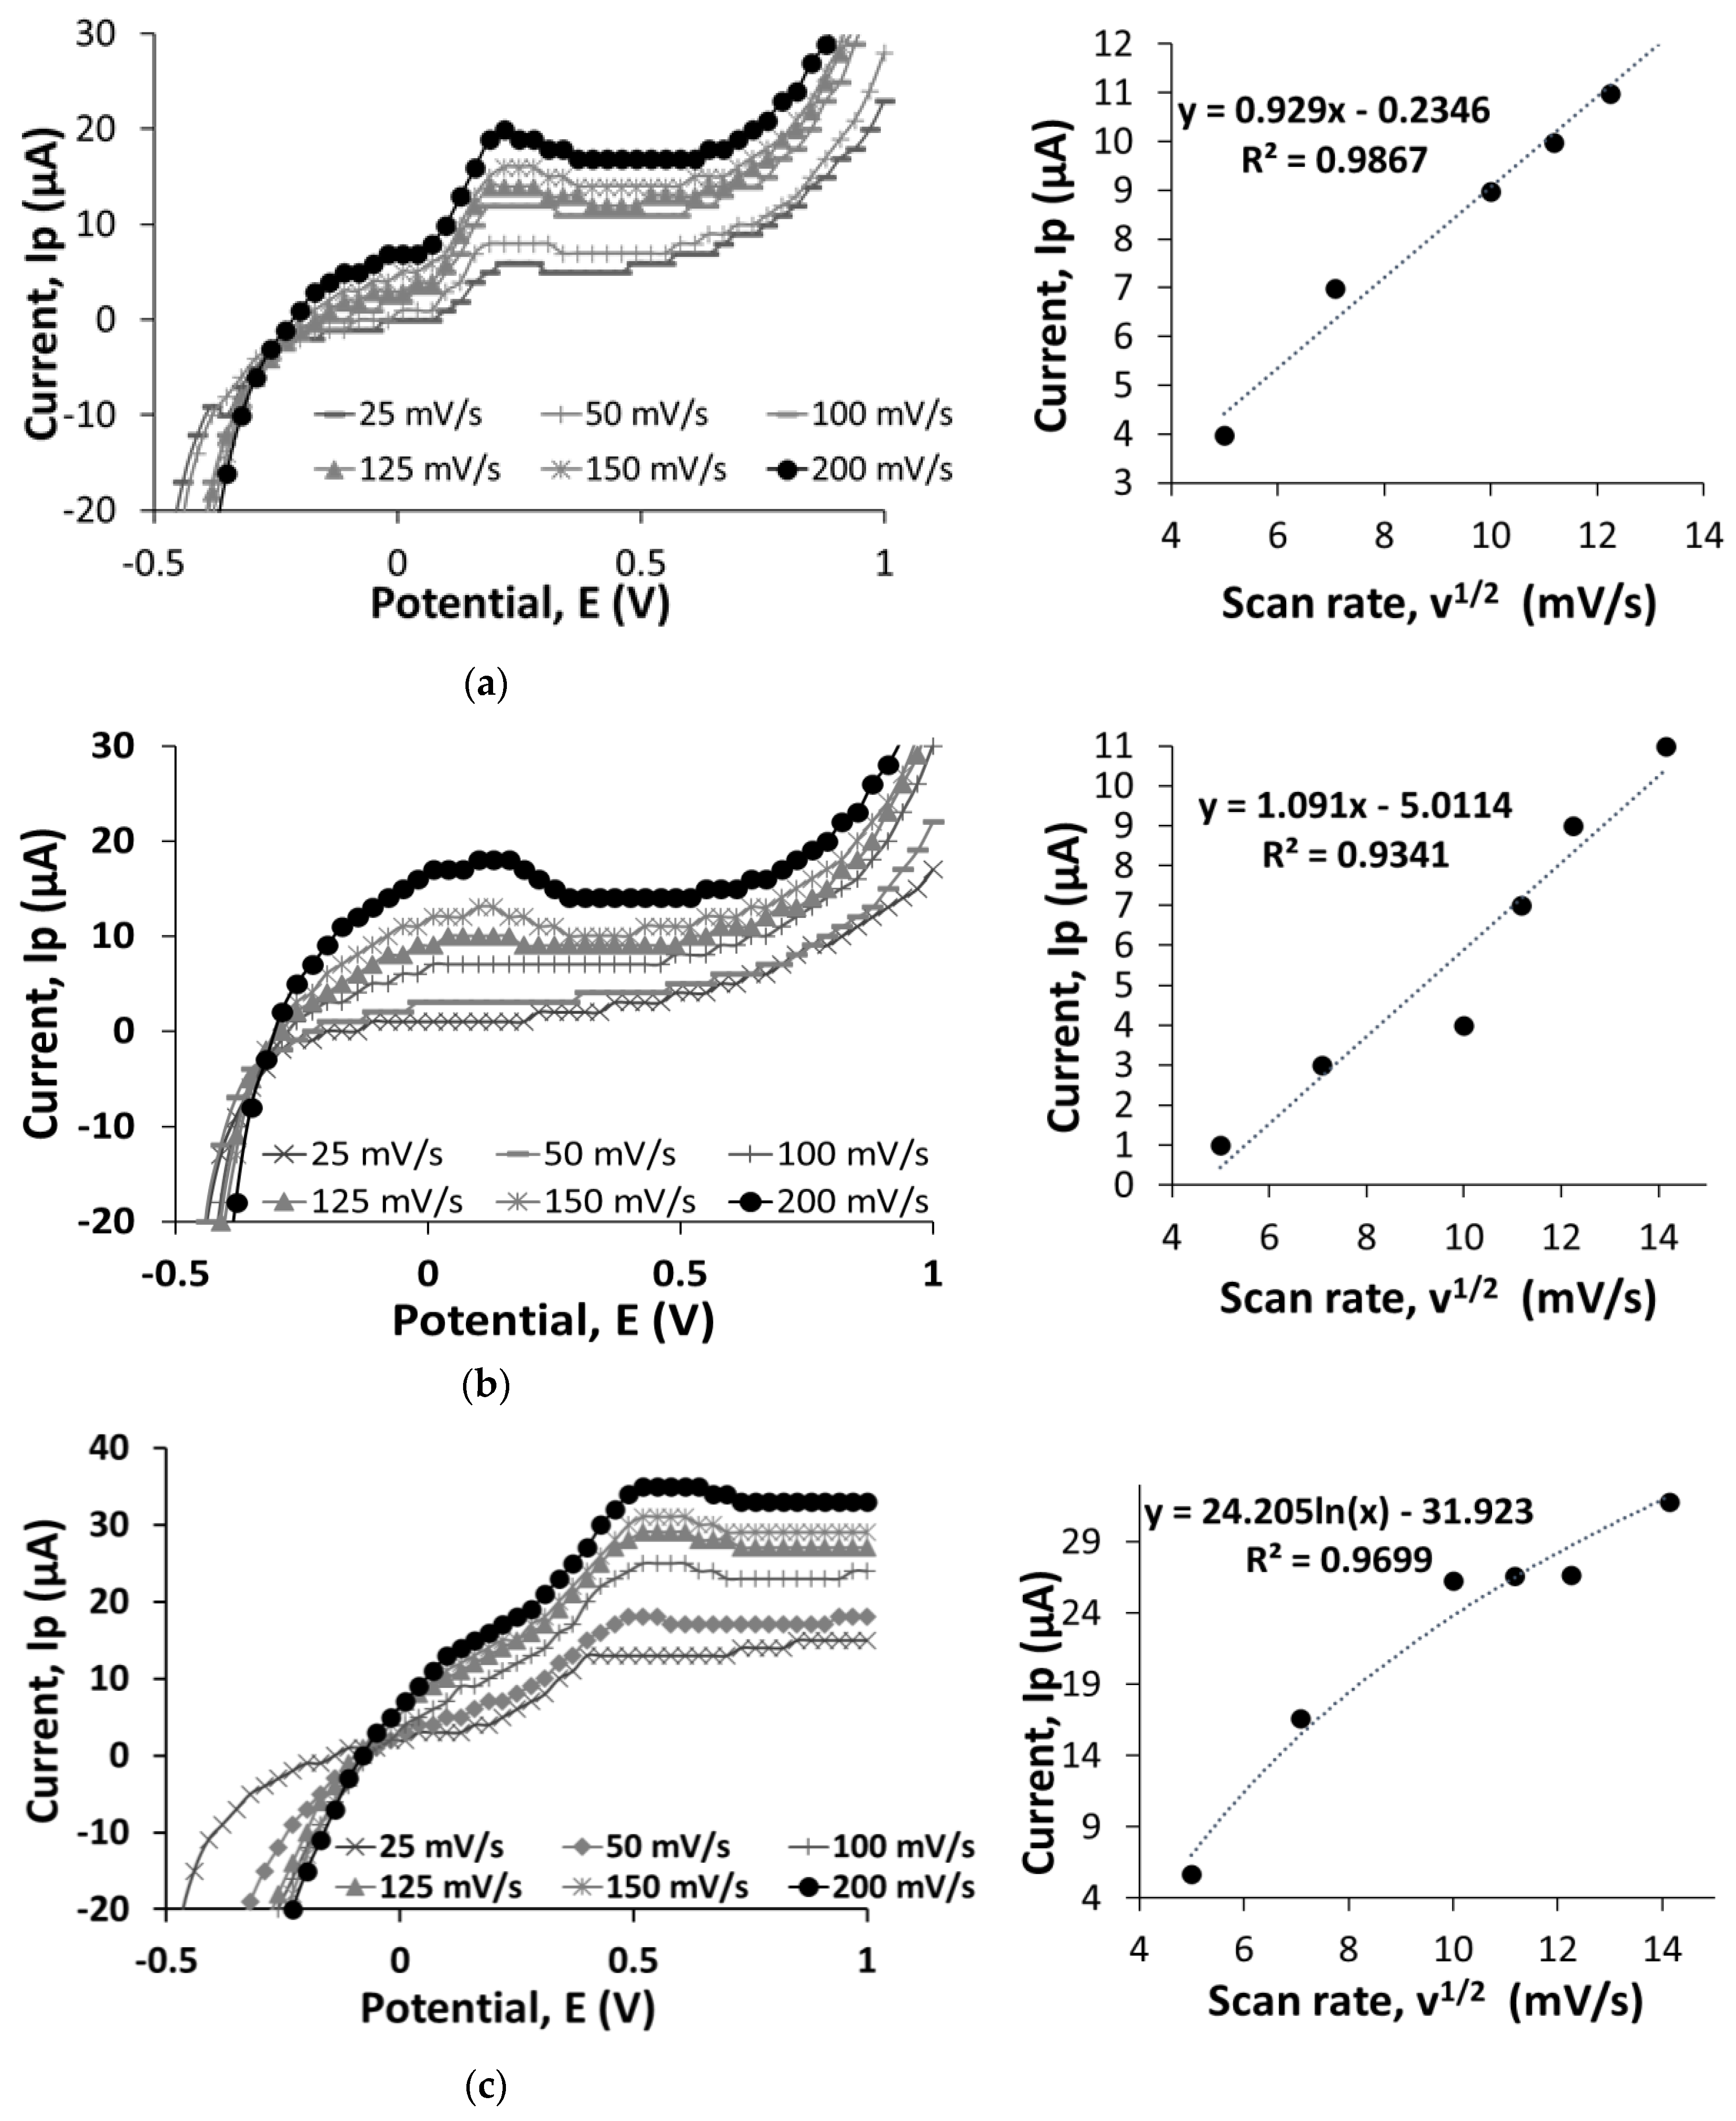
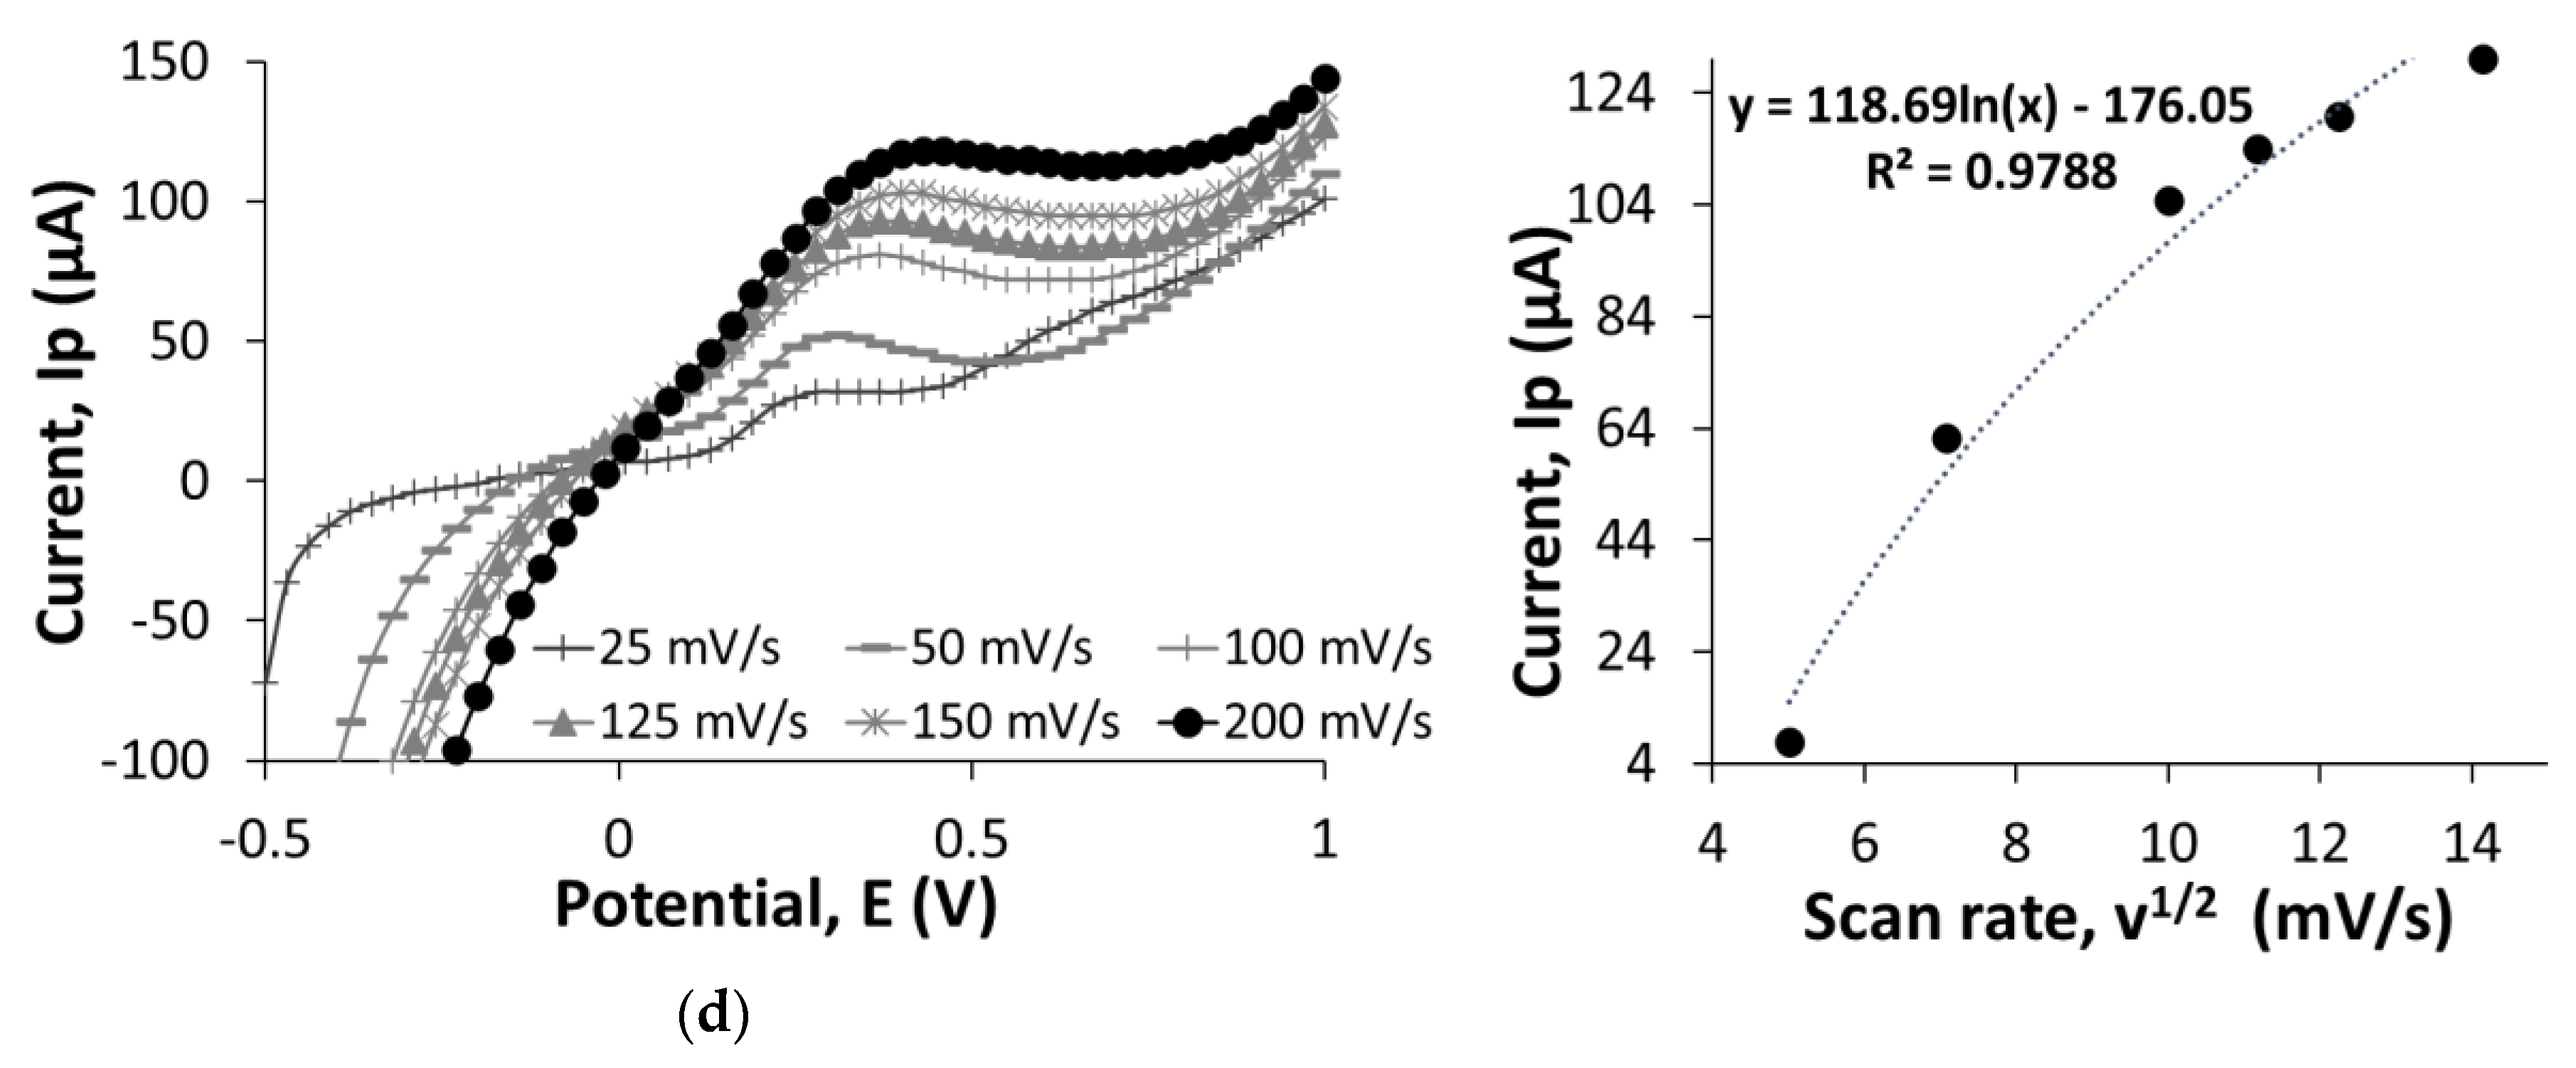
2.4.1. Linear Sweep Voltammetry (LSV) Measurements

LSV was performed at a scanning potential of −0.5 to 1 V, and scan rates of 25, 50, 100, 125, 150, and 200 mV/s in 0.01 M PBS, pH 7.1, containing 5 mM K3Fe(CN)6: K4Fe(CN)6 to determine the current flow in SPCEs, GO/SPCEs, rGO/SPCEs, and IgG/rGO/SPCEs. The half reaction that occurs at the electrode can be described by Equation (1) [6]:
F e ( C N ) 6 3 + e F e ( C N ) 6 4
From the peak current obtained from LSV measurement, the graph of peak current (Ip) vs. square root of scan rate (v1/2) was plotted, and effective surface area was calculated from only the slopes of linear curves using the Randles Sevcik Equations (2) and (3) [7,8]:
I p = ( 2.69 × 10 5 ) n 3 / 2   D 1 / 2   C   A   v 1 / 2
A = k / ( ( 2.69 × 10 5 ) n 3 2   D 1 2   C ) ,
where the diffusion coefficient D for the ferricyanide/ferrocyanide redox couple is typically 6.70 × 10⁻⁶ cm2/s, C is the molar concentration of ferricyanide-ferrocyanide solution (5 mM), A is the effective surface area (cm2), v is the scan rate (mV/s), and n is the number of moles of electrons transferred per mole of electroactive species, which in this case is one (1).
The nonspecific binding of E. coli O157:H7 to rGO/SPCEs and IgG/rGO/SPCEs was tested using LSV. To prepare E. coli solution (4 × 10⁸, 4 × 10⁷, 4 × 10⁶, 4 × 10⁵, 4 × 10⁴, 4 × 10³, 4 × 10², 4 × 101, and 4 CFU/ml), the stock solution (3.98 × 10⁹ CFU/ml in dextran solution) was diluted with PBS, pH 7.1. Then, 3 µl diluted E. coli solution was drop-cast onto the WEs of IgG/rGO/SPCEs and rGO/SPCEs and incubated at 37 °C for 1 h. Both SPCEs were washed with PBS, pH 7.1, to remove unbound E. coli. For SPCEs incubated with E. coli, LSV was performed at a scanning potential of −0.5 to 1 V and a scan rate of 100 mV/s in tap water.

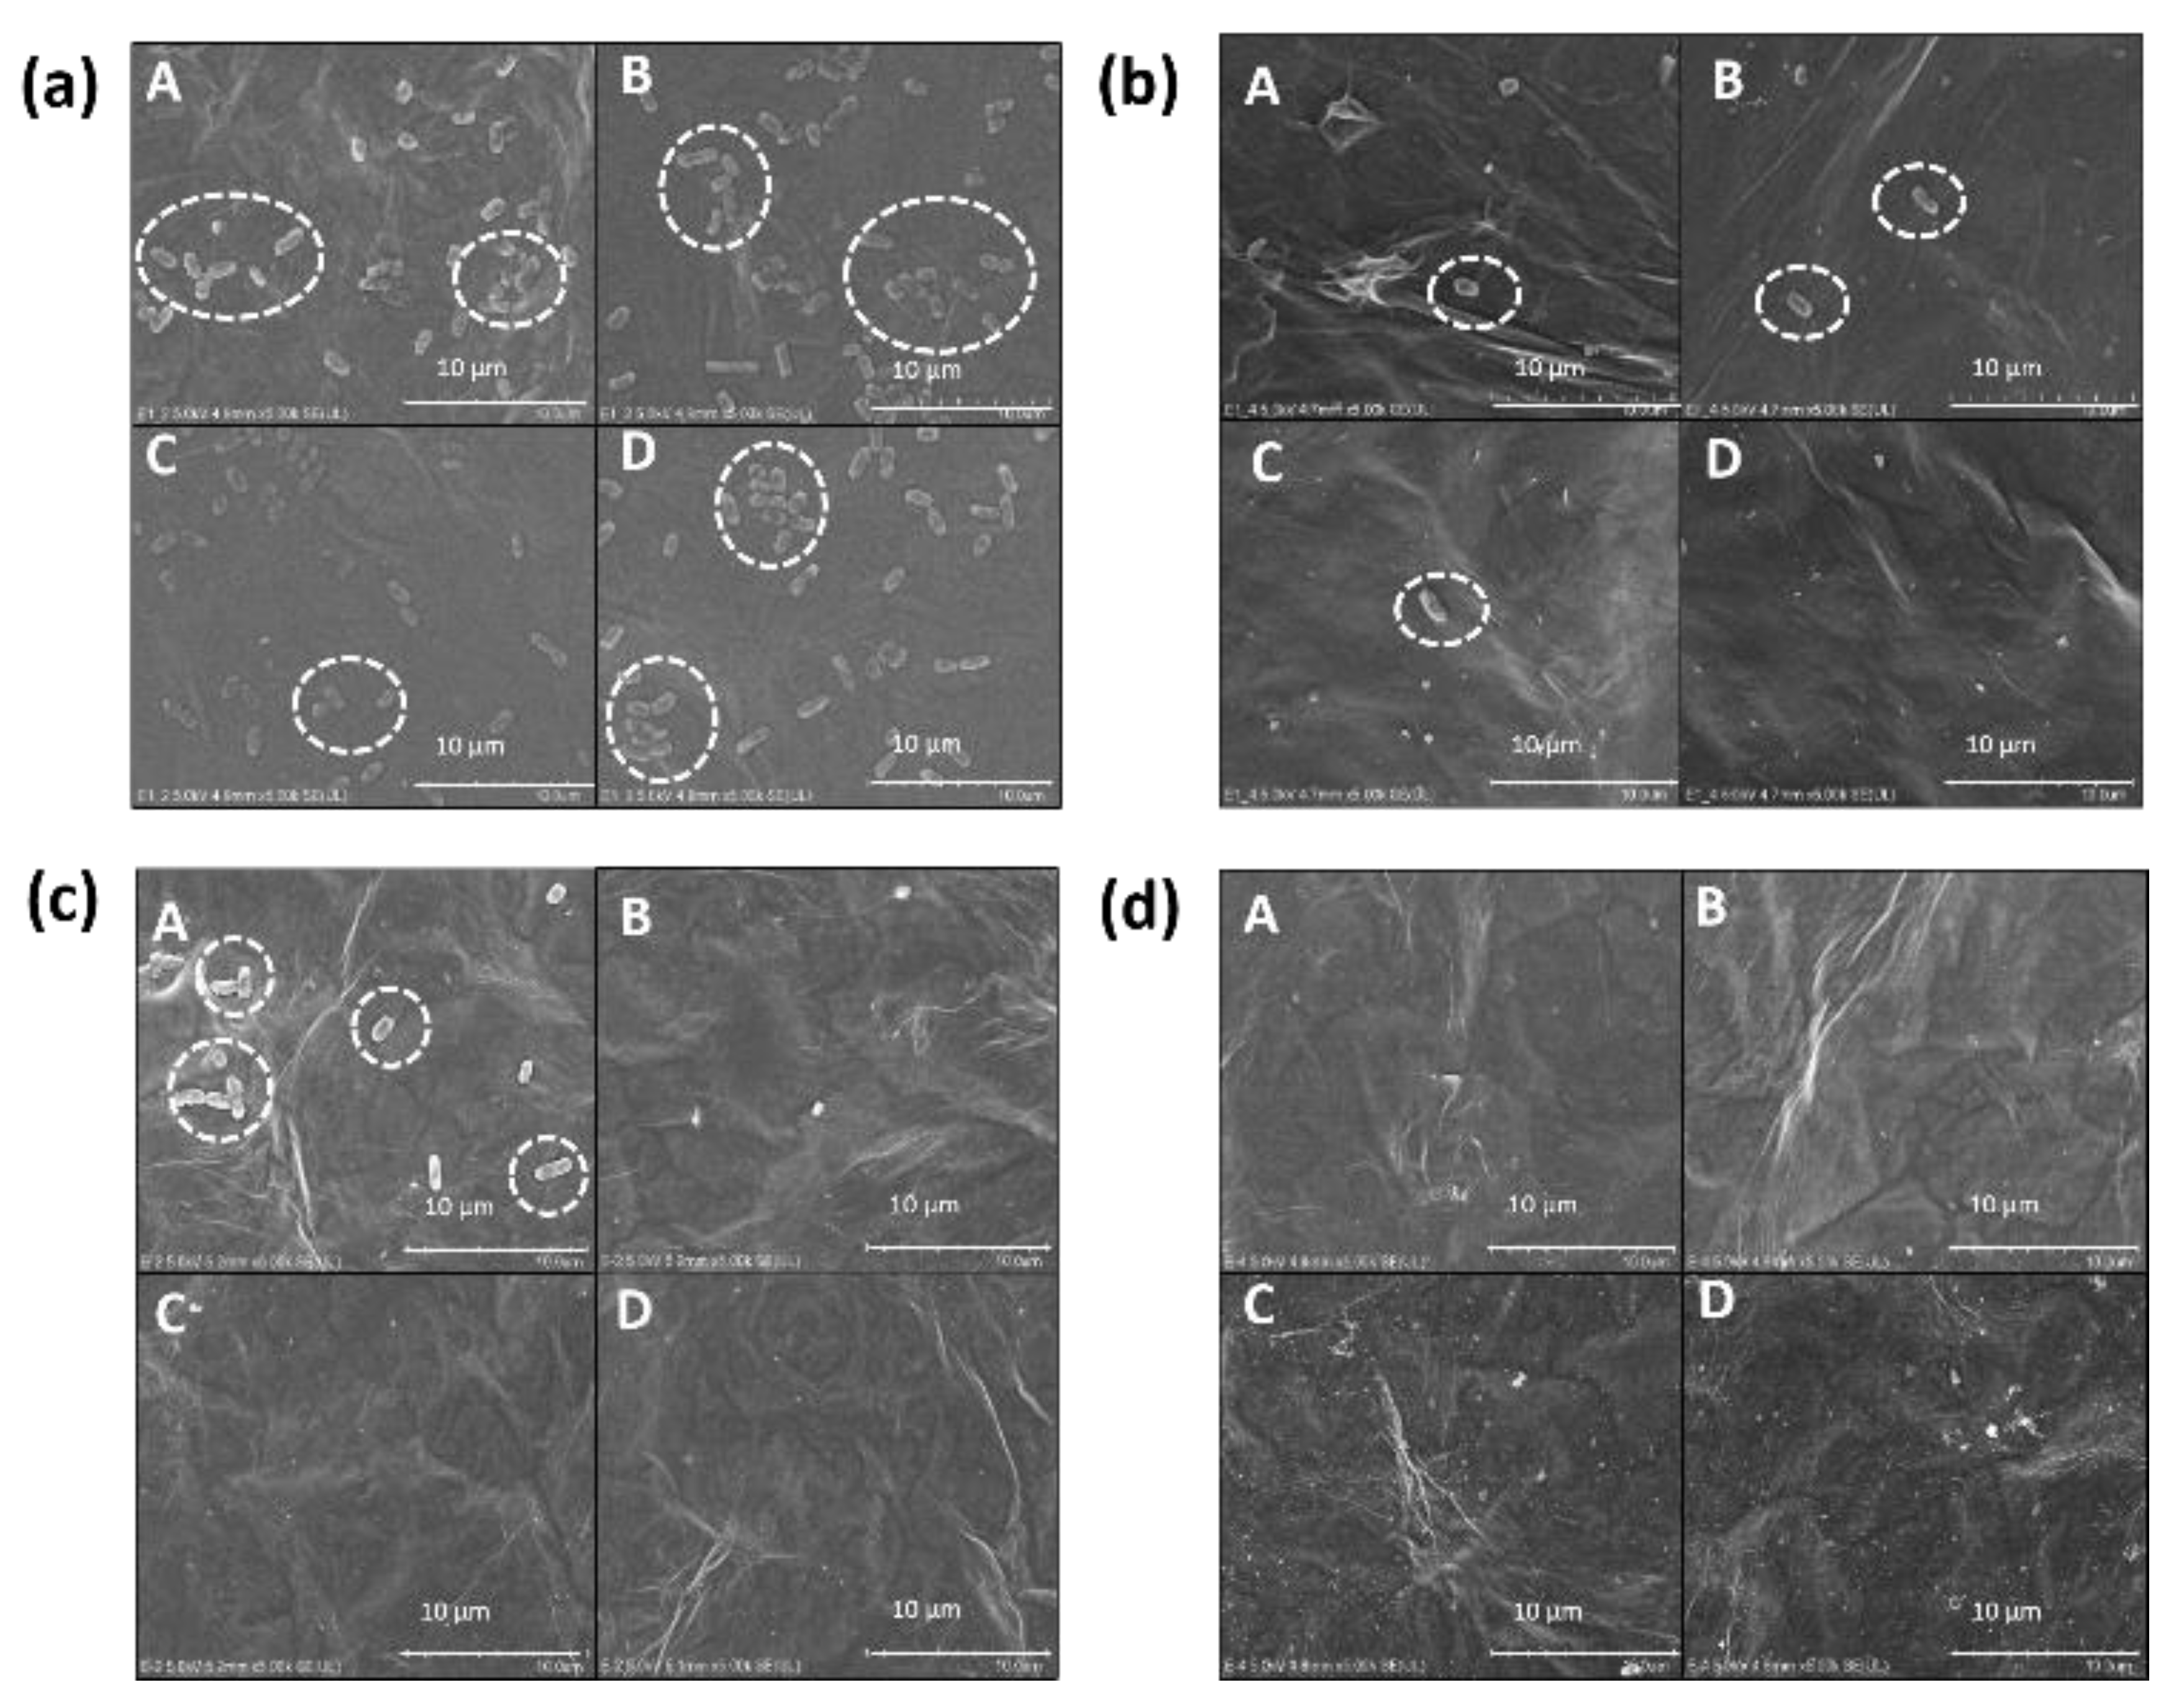
2.4.2. Field Emission Scanning Electron Microscopy

The morphology of SPCEs incubated with E. coli was observed using a FESEM. The SPCEs were coated with platinum to avoid charging effects during FESEM imaging. FESEM images were obtained at a magnification of 5K at all four quadrants of the WE to provide an overall overage of sensing area.

3. Results and Discussion

3.1. Linear Sweep Voltammetry for Bare SPCEs, GO/SPCEs, rGO/SPCEs, and IgG/rGO/SPCEs

Figure 1 shows LSV measurements of bare SPCEs, GO/SPCEs, rGO/SPCEs, and IgG/rGO/SPCEs conducted at a scanning potential of −0.5 to 1 V and scan rates of 25, 50, 100, 125, 150, and 200 mV/s in 0.01 M PBS, pH 7.1, containing 5 mM K3Fe(CN)6:K4Fe(CN)6. We compared the current values obtained at 100 mV/s to understand electron-transfer behavior on the bare SPCEs, GO/SPCEs, rGO/SPCEs, and IgG/rGO/SPCEs. At 0.7 V, the bare SPCEs recorded higher current value of 14 µA compared to the GO/SPCEs (11 µA), because of the oxygenated functional groups that impair electron flow at the edges of GO [9,10]. The current value was improved to 23 µA for rGO/SPCEs owing to the electrochemical reduction process that removed a considerable number of oxygenated functional groups. Studies have shown that electrochemical reduction with precise control over the reduction potential and time [11,12] allows reproducibility of rGO for use in electrochemical devices [13]. We found that IgG/rGO/SPCEs achieved the highest current value of 73 µA, which could be due to the semiconductive nature of protein in dry and wet states [14]. In addition, the conductivity can be influenced by the way in which IgG is immobilized on the electrode surface such that the alpha domain is more conductive than the beta domain of a protein [15].
Nanomaterials increase the effective surface area (Aeff); higher Aeff leads to improved sensitivity of biosensors. We plotted a graph of current (Ip) vs. square root of scan rate (v1/2) to determine Aeff. The Aeff of bare SPCEs and GO/SPCEs were 21.7 mm2 and 4.06 × 10⁻⁹ mm2; the graphs of current (Ip) vs. square root of scan rate (v1/2) were linear. However, the graphs of current (Ip) vs. square root of scan rate (v1/2) for rGO/SPCEs and IgG/rGO/SPCEs were nonlinear, and hence we did not calculate Aeff. This nonlinearity can be the result of a heterogenous electron-transfer process [16].

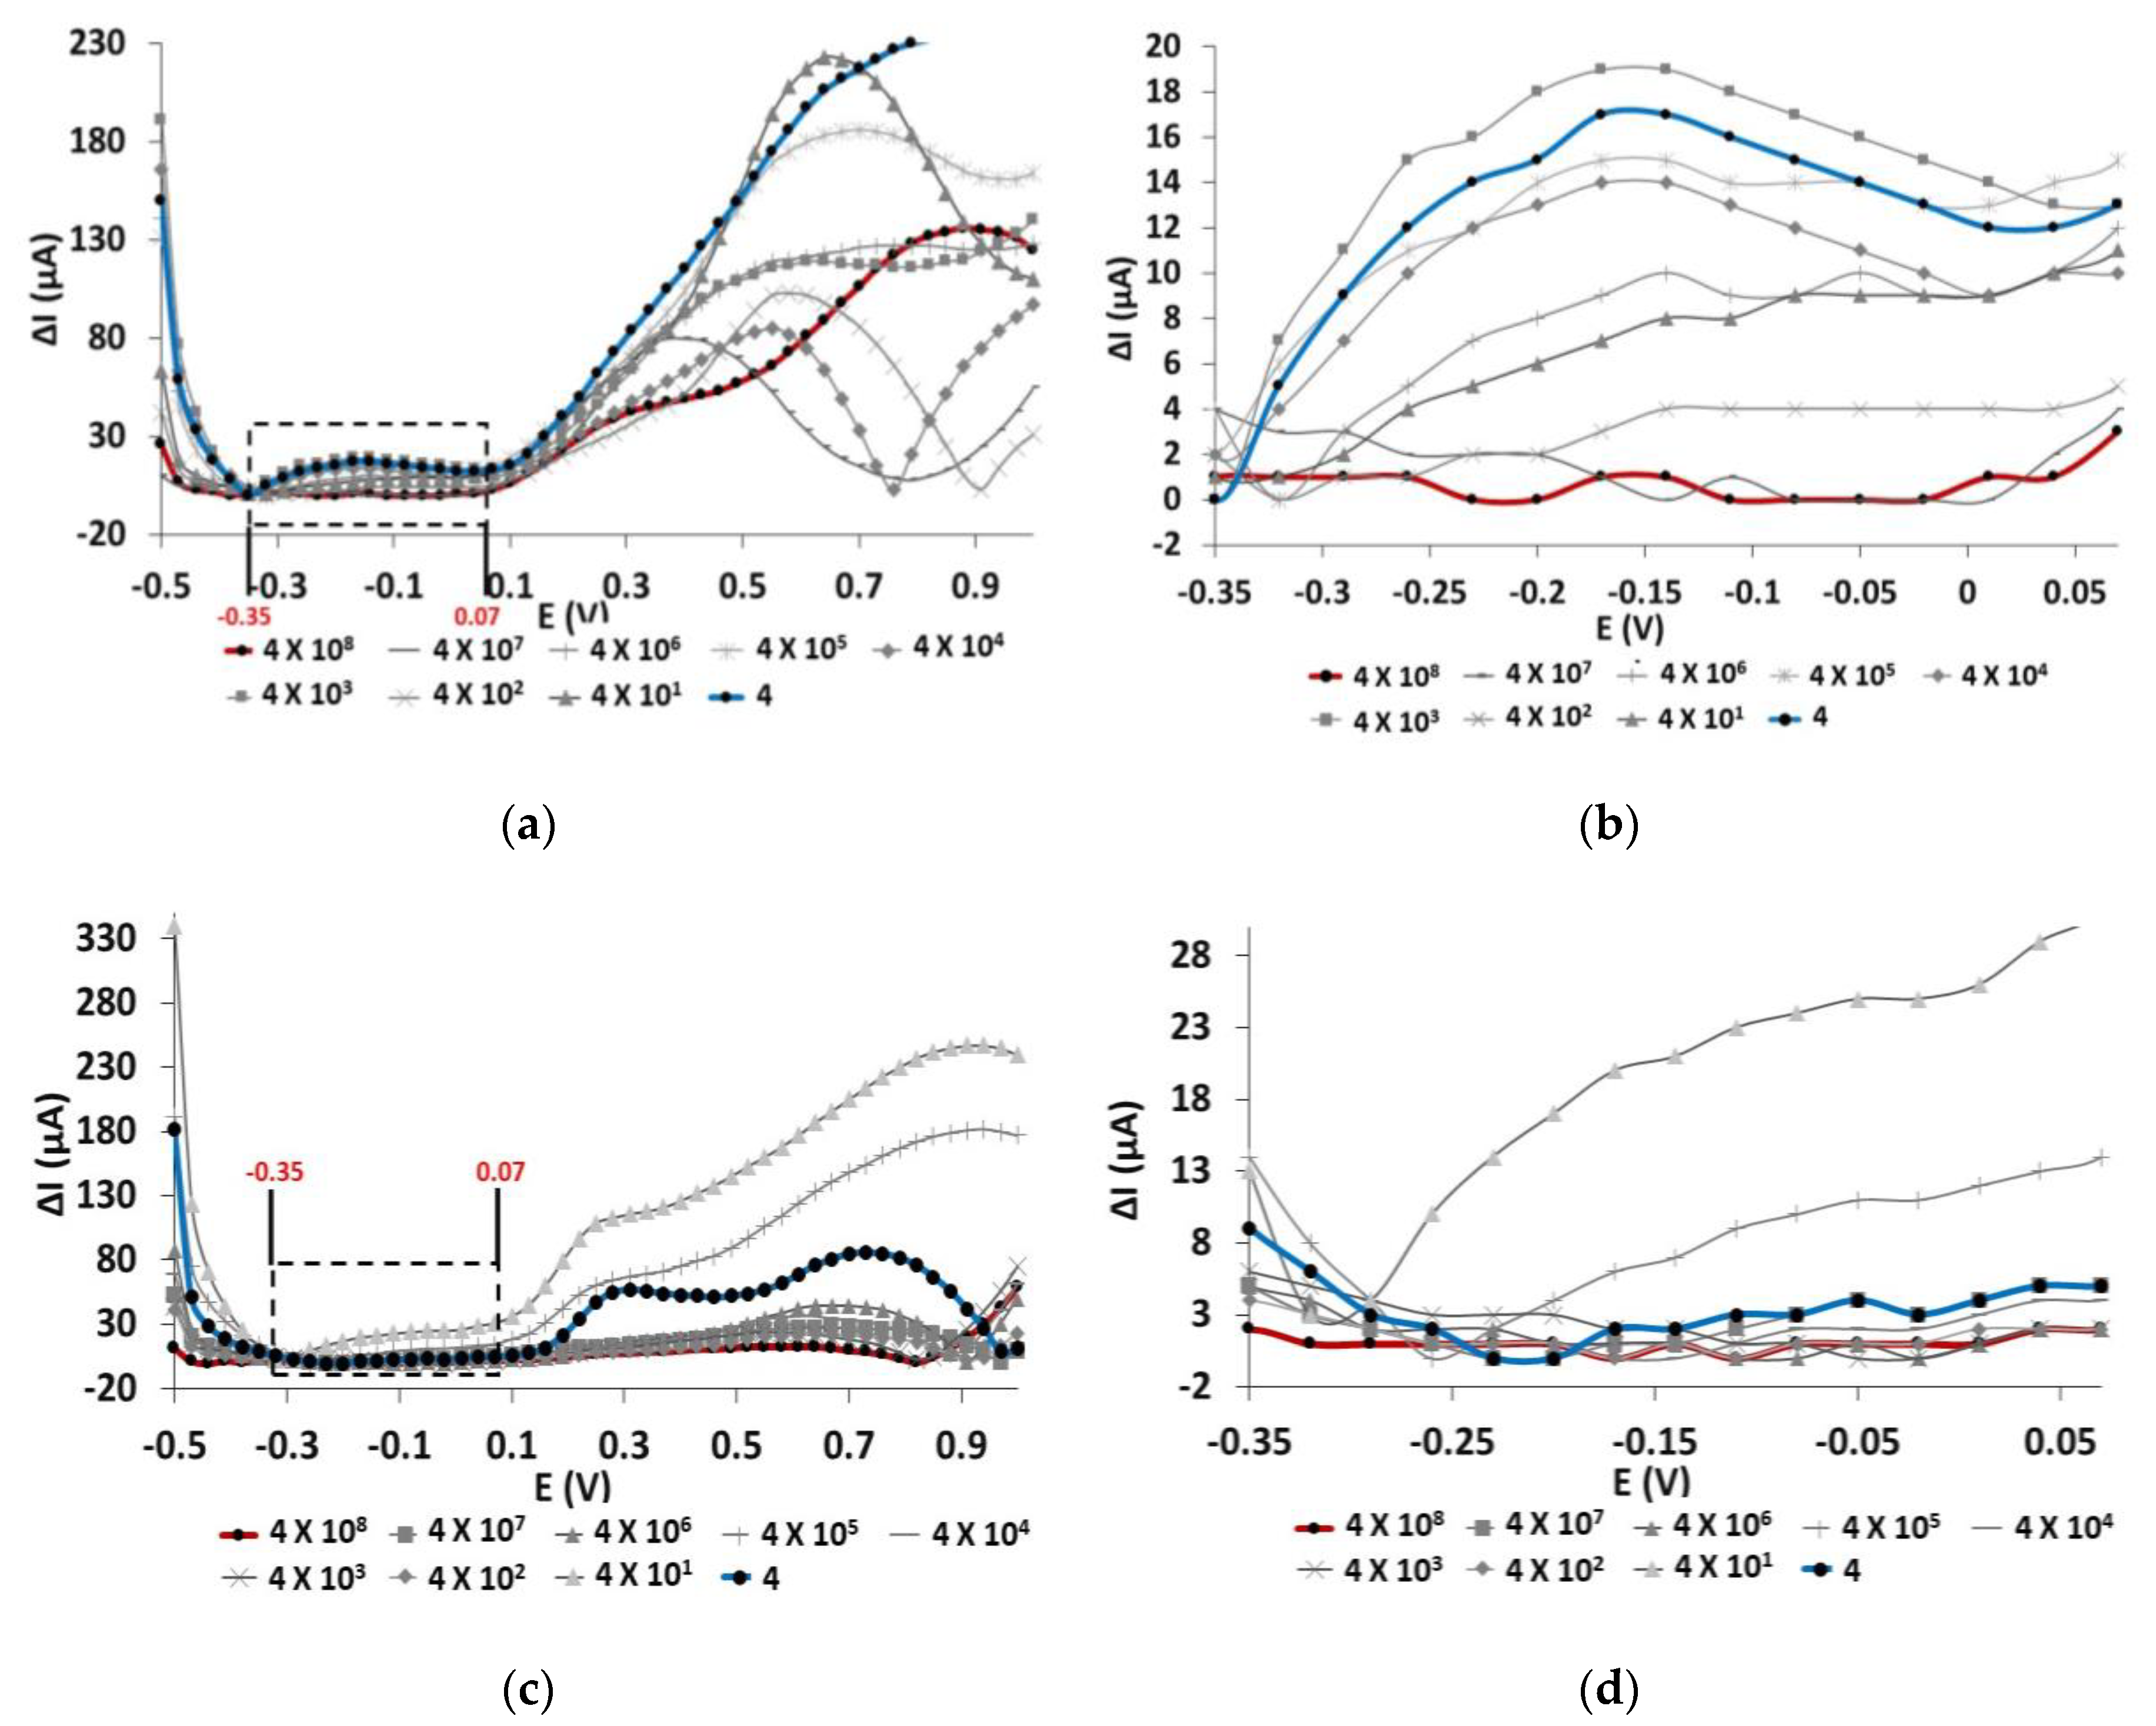
3.2. LSVs at Different E. coli Concentrations

Figure 2 shows LSVs over a potential range of −0.5 to 1 V and scan rate of 100 mV/s for IgG/rGO/SPCEs and rGO/SPCEs incubated with E. coli concentrations that ranged from 4 × 10⁸ to 4 CFU/ml. We compared the current values obtained for the above-mentioned SPCEs; high current value indicates lower binding of E. coli cells to the IgG or the rGO surface. We performed preprocessing of the signal by subtracting the current value of zero E. coli from that of each E. coli concentrations.
In Figure 2a, a prominent peak was observed in the region of −0.35 to 0.07 V, and the graphs for E. coli concentrations of 4 × 10⁸ and 4 CFU/ml have a distinct gap in current values that enables us to differentiate between the highest and lowest concentrations. Incubation with a higher concentration of E. coli reported lower current value, implying a higher number of E. coli cells attached to IgG/rGO/SPCEs. We found that current value does not increase linearly as the concentration of E. coli cells is reduced, which could be due to the random attachment of E. coli to IgG with low affinity for E. coli O157:H7. In addition to affinity, several IgGs could also potentially bind to a bacterium, which might lead to random orientation of the E. coli cells on the surface of the electrode. IgG could bind to several outer membrane constituents of the E. coli, including its lipopolysaccharides and porins. Since the IgG used in this study is not specific to E. coli O157:H7, a condition of nonspecific binding can be expected. However, we found that binding of E. coli to IgG occurred even at E. coli concentrations of 4 CFU/ml. Therefore, a nonspecific IgG can be used to detect but not quantify E. coli O157:H7 in the event of unavailability of antibody specific for E. coli O157:H7.
On the other hand, we found rGO/SPCEs do not produce any distinctive peak between E. coli concentrations of 4 × 10⁸ and 4 CFU/ml (Figure 2c). The LSV graphs overlapped for most of the E. coli concentration range, implying a random attachment of E. coli to the rGO surface. Studies have proven that rGO surfaces in general repel E. coli attachment [17], which could result in the random attachment of E. coli to the rGO surfaces.

3.3. Morphology of IgG/rGO/SPCEs and rGO/SPCEs Incubated with E. coli O157:H7

Figure 3 shows FESEM imaging of IgG/rGO/SPCEs incubated with (a) 4 × 10⁷ and (b) 4 × 10⁵ CFU/ml E. coli. Higher amount of E. coli was attached to IgG/rGO/SPCE for 4 × 10⁷ CFU/ml than for 4 × 10⁵ CFU/ml. The attachment of E. coli influences current value obtained during LSV; higher rate of attachment results in lower current value. We found that IgG/rGO/SPCEs incubated with 4 × 10⁷ CFU/mL reported lower current value than did those with 4 × 10⁵ CFU/mL, confirming that E. coli attachment blocks electron flow to the electrode surface. However, IgG/rGO/SPCEs incubated with 4 × 10³ CFU/ml reported higher current value than 4 CFU/ml, implying E. coli attaches randomly to IgG and making the biosensor suitable only for E. coli O157:H7 detection and not quantification. We observed nonspecific binding of E. coli O157:H7 to rGO/SPCEs (Figure 2 c). Studies have shown that E. coli O157:H7 attachment is dependent on orientation of the graphene structure; GO extracts phospholipids from the E. coli cell membrane onto the basal planes, which leads to bacterial cell death [18]. However, the basal plane of GO readily absorbs a variety of molecules via noncovalent interactions that quench the antibacterial property of GO [19]. In this study, we presume that molecules from the dextran solution (a medium used to store E. coli O157:H7) could possibly mask the basal plane, and thus E. coli are not destroyed when they adhere to rGO/SPCEs.

4. Conclusions

We developed a low-cost electrochemical biosensor using antibody not specific towards E. coli O157:H7 immobilized on a screen-printed carbon electrode. The biosensor was able to distinguish between E. coli O157:H7 concentrations of 4 × 10⁸ and 4 CFU/ml, and hence allows the use of nonspecific IgG for E. coli O157:H7 detection but not quantification in the event of unavailability of antibody specific for E. coli O157:H7. Since E. coli O157:H7 attaches to rGO/SPCEs, an additional processing step is required wherein readings from reference electrode (without antibody) is subtracted from the working electrodes (with antibody). Such a processing step can be programmed in an Arduino® microprocessor and the biosensor can be made portable for use in flood-stricken areas.

Author Contributions

N.A.A. planned and performed the experiments, P.R.B. Bdrafted, wrote the manuscript, and validated the experimental results. W.W.A.W.S., the Principal Investigator, acquired funding for the work, provided the initial idea, contributed intellectually to the planning of the experimental design, validated the experimental results, edited and revised the manuscript content and writing, and approved the submitted version.

Funding

This research was funded by nanoSkunkWorkX Sdn. Bhd and the The Royal Society Travel Grant.

Acknowledgments

The authors would like to thank members of Amani Research Group for their assistance during preparation of electrodes.

Conflicts of Interest

The authors declare no conflict of interest. The funders had no role in the design of the study; in the collection, analysis, or interpretation of data; in the writing of the manuscript, or in the decision to publish the results. The preprints for this research is available for public viewing, and can be assessed at doi: 10.20944/preprints201810.0631.v1.

References

  1. Jaafar, A.S.; Sidek, L.M.; Basri, H.; Zahari, N.M.; Jajarmizadeh, M.; Noor, H.M.; Osman, S.; Mohammad, A.H.; Azad, W.H. An Overview: Flood Catastrophe of Kelantan Watershed in 2014; Springer: Singapore, 2016; pp. 17–29. [Google Scholar]
  2. Madaeni, S.S. Microfiltration (MF). In Encyclopedia of Membranes; Drioli, E., Giorno, L., Eds.; Springer: Berlin, Heidelberg, 2015; pp. 1–3. [Google Scholar]
  3. Zhu, B.; Clifford, D.A.; Chellam, S. Virus removal by iron coagulation–microfiltration. Water Res. 2005, 39, 5153–5161. [Google Scholar] [CrossRef] [PubMed]
  4. Kosack, C.S.; Page, A.-L.; Klatser, P.R. A guide to aid the selection of diagnostic tests. Bull. World Health Organ. 2017, 95, 639. [Google Scholar] [CrossRef] [PubMed]
  5. Byrne, B.; Stack, E.; Gilmartin, N.; O’Kennedy, R. Antibody-based sensors: Principles, problems and potential for detection of pathogens and associated toxins. Sensors 2009, 9, 4407–4445. [Google Scholar] [CrossRef] [PubMed]
  6. Huang, T.H.; Salter, G.; Kahn, S.L.; Gindt, Y.M. Redox titration of ferricyanide to ferrocyanide with ascorbic acid: Illustrating the Nernst equation and Beer–Lambert law. J. Chem. Educ. 2007, 84, 1461. [Google Scholar] [CrossRef]
  7. Bard, A.J.; Faulkner, L.R. Fundamentals and applications. Electrochem. Methods 2001, 2, 580–632. [Google Scholar]
  8. Shi, J.; Claussen, J.C.; McLamore, E.S.; ul Haque, A.; Jaroch, D.; Diggs, A.R.; Calvo-Marzal, P.; Rickus, J.L.; Porterfield, D.M. A comparative study of enzyme immobilization strategies for multi-walled carbon nanotube glucose biosensors. Nanotechnology 2011, 22, 355502. [Google Scholar] [CrossRef] [PubMed]
  9. Pumera, M. Graphene in biosensing. Mater. Today 2011, 14, 308–315. [Google Scholar] [CrossRef]
  10. Azman, N.Z.M.; Zainal, P.N.S.; Alang Ahmad, S.A. Enhancement the electrochemical conductivity of a modified reduced graphene oxide/calixarene screen-printed electrode using response surface methodology. PLoS ONE 2020, 15, e0234148. [Google Scholar] [CrossRef] [PubMed]
  11. Gutić, S.J.; Kozlica, D.K.; Korać, F.; Bajuk-Bogdanović, D.; Mitrić, M.; Mirsky, V.M.; Mentus, S.V.; Pašti, I.A. Electrochemical tuning of capacitive response of graphene oxide. Phys. Chem. Chem. Phys. 2018, 20, 22698–22709. [Google Scholar] [CrossRef] [PubMed]
  12. de Camargo, M.N.; Santhiago, M.; Maroneze, C.M.; Silva, C.C.; Timm, R.A.; Kubota, L.T. Tuning the electrochemical reduction of graphene oxide: Structural correlations towards the electrooxidation of nicotinamide adenine dinucleotide hydride. Electrochim. Acta 2016, 197, 194–199. [Google Scholar] [CrossRef]
  13. Ambrosi, A.; Pumera, M. Precise tuning of surface composition and electron-transfer properties of graphene oxide films through electroreduction. Chem. -A Eur. J. 2013, 19, 4748–4753. [Google Scholar] [CrossRef] [PubMed]
  14. Rosenberg, B. Electrical conductivity of proteins. Nature 1962, 193, 364–365. [Google Scholar] [CrossRef] [PubMed]
  15. Zhang, X.; Shao, J.; Jiang, S.; Wang, B.; Zheng, Y. Structure-dependent electrical conductivity of protein: Its differences between alpha-domain and beta-domain structures. Nanotechnology 2015, 26, 125702. [Google Scholar] [CrossRef] [PubMed]
  16. Chen, S.; Liu, Y.; Chen, J. Heterogeneous electron transfer at nanoscopic electrodes: Importance of electronic structures and electric double layers. Chem. Soc. Rev. 2014, 43, 372–5386. [Google Scholar] [CrossRef] [PubMed]
  17. Choudhary, P.; Das, S.K. Bio-reduced graphene oxide as a nanoscale antimicrobial coating for medical devices. ACS Omega 2019, 4, 387–397. [Google Scholar] [CrossRef]
  18. Tu, Y.; Lv, M.; Xiu, P.; Huynh, T.; Zhang, M.; Castelli, M.; Liu, Z.; Huang, Q.; Fan, C.; Fang, H. Destructive extraction of phospholipids from Escherichia coli membranes by graphene nanosheets. Nat. Nanotechnol. 2013, 8, 594. [Google Scholar] [CrossRef] [PubMed]
  19. Hui, L.; Piao, J.-G.; Auletta, J.; Hu, K.; Zhu, Y.; Meyer, T.; Liu, H.; Yang, L. Availability of the basal planes of graphene oxide determines whether it is antibacterial. ACS Appl. Mater. Interfaces 2014, 6, 13183–13190. [Google Scholar] [CrossRef] [PubMed]
Figure 1. Linear sweep voltammetry (LSV) results of bare screen-printed carbon electrodes (SPCEs) (a), GO/SPCEs (b), rGO/SPCEs (c), and IgG/rGO/SPCEs (d) at different scan rate of 25, 50, 100, 125, 150, and 200 mV/s in ferricyanide-ferrocyanide solution. The figure indicates the electron-transfer behavior at the electrode surface as the potential sweep was run at −0.5 to 1 V. The calibration curve of current (Ip, µA) is plotted against square root of the scan rate (v1/2, mV/s) to observe the correlation between the current changes and the square root of scan rate.
Proceedings 60 00013 g001aProceedings 60 00013 g001b
Figure 2. LSV graph of (a) IgG/rGO/SPCEs and (c) rGO/SPCEs treated with different concentrations of E. coli O157:H7 (4 × 10⁸ to 4 CFU/ml) in tap water at a scan rate of 100 mV/s and potential range of −0.5 to 1 V. LSV graph of (b) IgG/rGO/SPCEs and (d) rGO/SPCEs plotted at a potential range of −0.35 to 0.07 V.
Proceedings 60 00013 g002
Figure 3. FESEM images showing cell attachment on electrode surfaces (shown with dotted lines). (a) and (b) IgG/rGO/SPCEs for E. coli concentrations of 4 × 10⁷ and 4 × 10⁵ CFU/ml, respectively. (c) and (d) rGO/SPCEs for E. coli concentrations of 4 × 10⁷ and 4 × 10⁵ CFU/ml, respectively. FESEM images were taken for quadrants of Ø = 2 mm-diameter working electrodes (WE) of a SPCE.
Proceedings 60 00013 g003
Publisher’s Note: MDPI stays neutral with regard to jurisdictional claims in published maps and institutional affiliations.

