1. Introduction
Energy storage devices or accumulators are often inserted to enable a system to cope with extremes of demand using a less powerful source, to respond more quickly to a temporary demand, or to smooth out pulsations. More recently, new applications of solar-powered devices are appearing, allowing many tasks that need short-term high-power demand, while being powered by small photovoltaic cells. Collecting solar power with PV panels under high-efficiency conditions is enabled by following strict conditions related to the maximum solar irradiation combined with the conversion efficiency of the PV cells. Usually, PV installations have the property of consuming a large surface for a defined power level in the order of magnitude of 10 m
2 for 1 kWp. Specific applications such as compacting waste collectors or other applications such as the composter machine (
Figure 1a,b) are characterized by the small surface of their PV collectors and through the higher instantaneous power needed by the internal actuator. Because of the typical intermittency of solar irradiation, but also in order to provide a given level of power to the final application, these kinds of systems usually need integrated energy storage components such as batteries. Higher power densities of these elements are generally required in order to achieve sufficient energy efficiency.
One can assume that usually, the power density of an accumulator during the charge process is identical to its discharge power density. In the presented application framework, the real operation conditions are different. Indeed, even if the averaged power required is relatively low, the impulse power peak can be several orders of magnitude higher than the latter. In such a case, an energy harvesting system with very low input power level can be designed. This paper will introduce the design criteria of such harvesting systems that are able to provide a high-power level to the final application, with the help of an energy storage element.
2. The Principle of Power Amplification
A given amount of energy can be represented by the time integral of an instantaneous value of power, leading to the representation by a geometric surface. The simplified model of
Figure 2 represents the corresponding energy amount under the curve of a given power level. In this representation, the power, P
1, is kept constant during the time duration, t
1. At the right side of the figure, the higher power level, P
2, is also kept constant during the shorter time duration, t
2. In the idealized case where the energy amount would be kept constant in the transformation from P
1*t
1 to P
2*t
2, the energy efficiency is defined as unity. The power amplification factor, PAF, is defined as the ratio of P
2/P
1. In the non-ideal case, the energy efficiency is defined as P
2*t
2/P
1*t
1.
For both the charge and discharge process of an energy storage device, the energy efficiency can be calculated. Its dependency from the actual value of the exchange power level has been highlighted in [
1] and [
2].
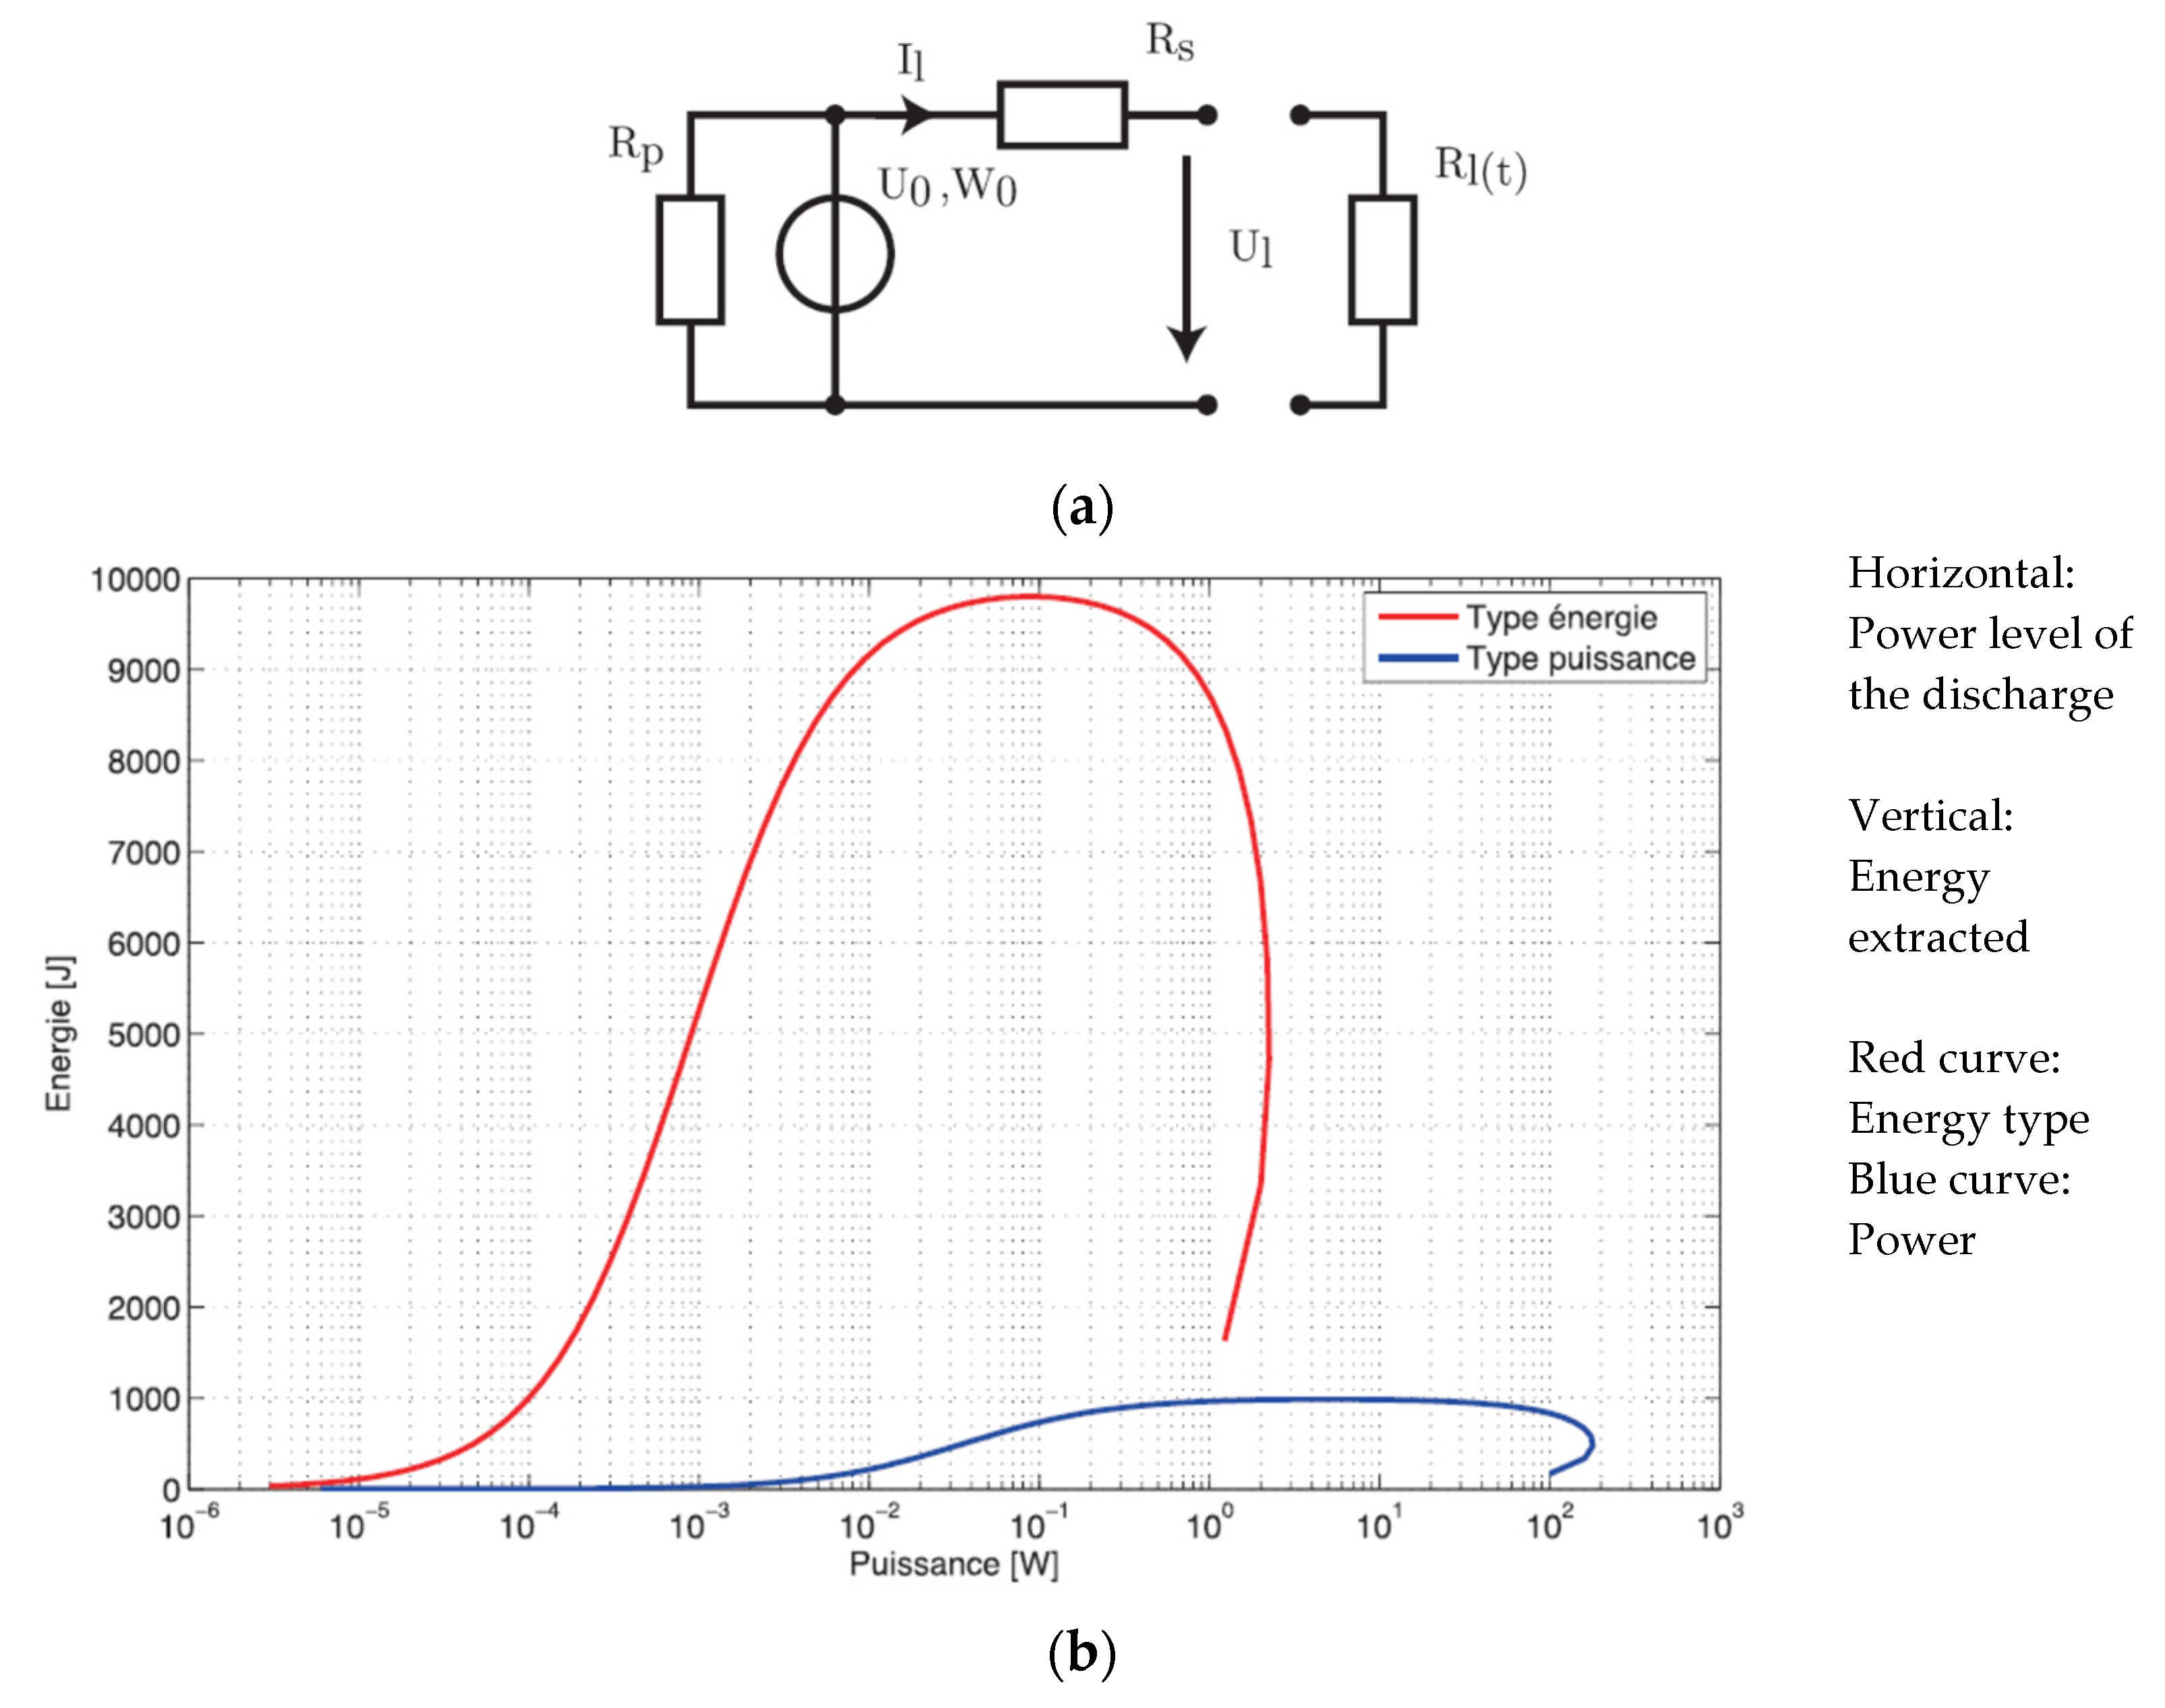
The Modified Ragone Representation (MRR)
Figure 3 is one general representation that illustrates the energy losses of one storage device, where both effects of the self-discharge loss due to the presence of a shunt way, and the load-related loss caused by the internal series resistor of an ideal battery, are represented.
Figure 3a shows the equivalent scheme of an ideal battery, where an ideal voltage source, U
0, is represented, together with the parallel resistor, R
p, and the series resistor, R
s. The amount of stored energy is represented through the quantity W
0.
Figure 3b shows the so called modified Ragone representation MRR [
3], representing the amount of energy to be extracted from a storage device while being discharged at constant power from a full state of charge down to zero. The red curve illustrates the properties of an energy-type accumulator where the energy quantity is significant while the power capability is limited. The blue curve is related to a power-type accumulator where the power capability is significant while the energy content is limited.
The diagram represents the energy amount that one can recover from an ideal storage device considering the self-discharge (R
p in
Figure 3a), and also the internal loss in the series resistor, R
s. The horizontal axis of
Figure 3b represents the power at which the energy is recovered. The scale is chosen as a logarithmic scale in order to represent the extreme low-power values and the high solicitations in the same diagram. The left side of these diagram illustrates the domain where the power level of the discharge is in the range of the self-discharge power. The extracted energy amount is near zero. On the right side of the diagrams, the operation conditions represent the cases where the internal losses due to the presence of the series resistor are strongly reducing the amount of extractable energy. The middle of the curve represents the normal operation domain where an acceptable amount of energy can be extracted. Such domains cover usually about two or three decades of the power range.
For the charging process, similar curves can be defined, because the self-discharge as well as the internal series losses are modeled through the same equivalent scheme. As a result, one can recommend charge and discharge of a storage device at a power level situated between the positive and negative slope of the MRR curve, preferably at power levels where the curve reaches sufficiently high values.
3. Energy Harvesting with Small Photovoltaic Panels and a Two-Stage Amplification
An energy harvesting system is developed with the goal to provide energy to a specific application characterized by an intermittent operation. The harvesting of the energy amount is done from a minimal surface of PV panels. A cascaded energy conversion and storage system overtakes the function of the power amplification.
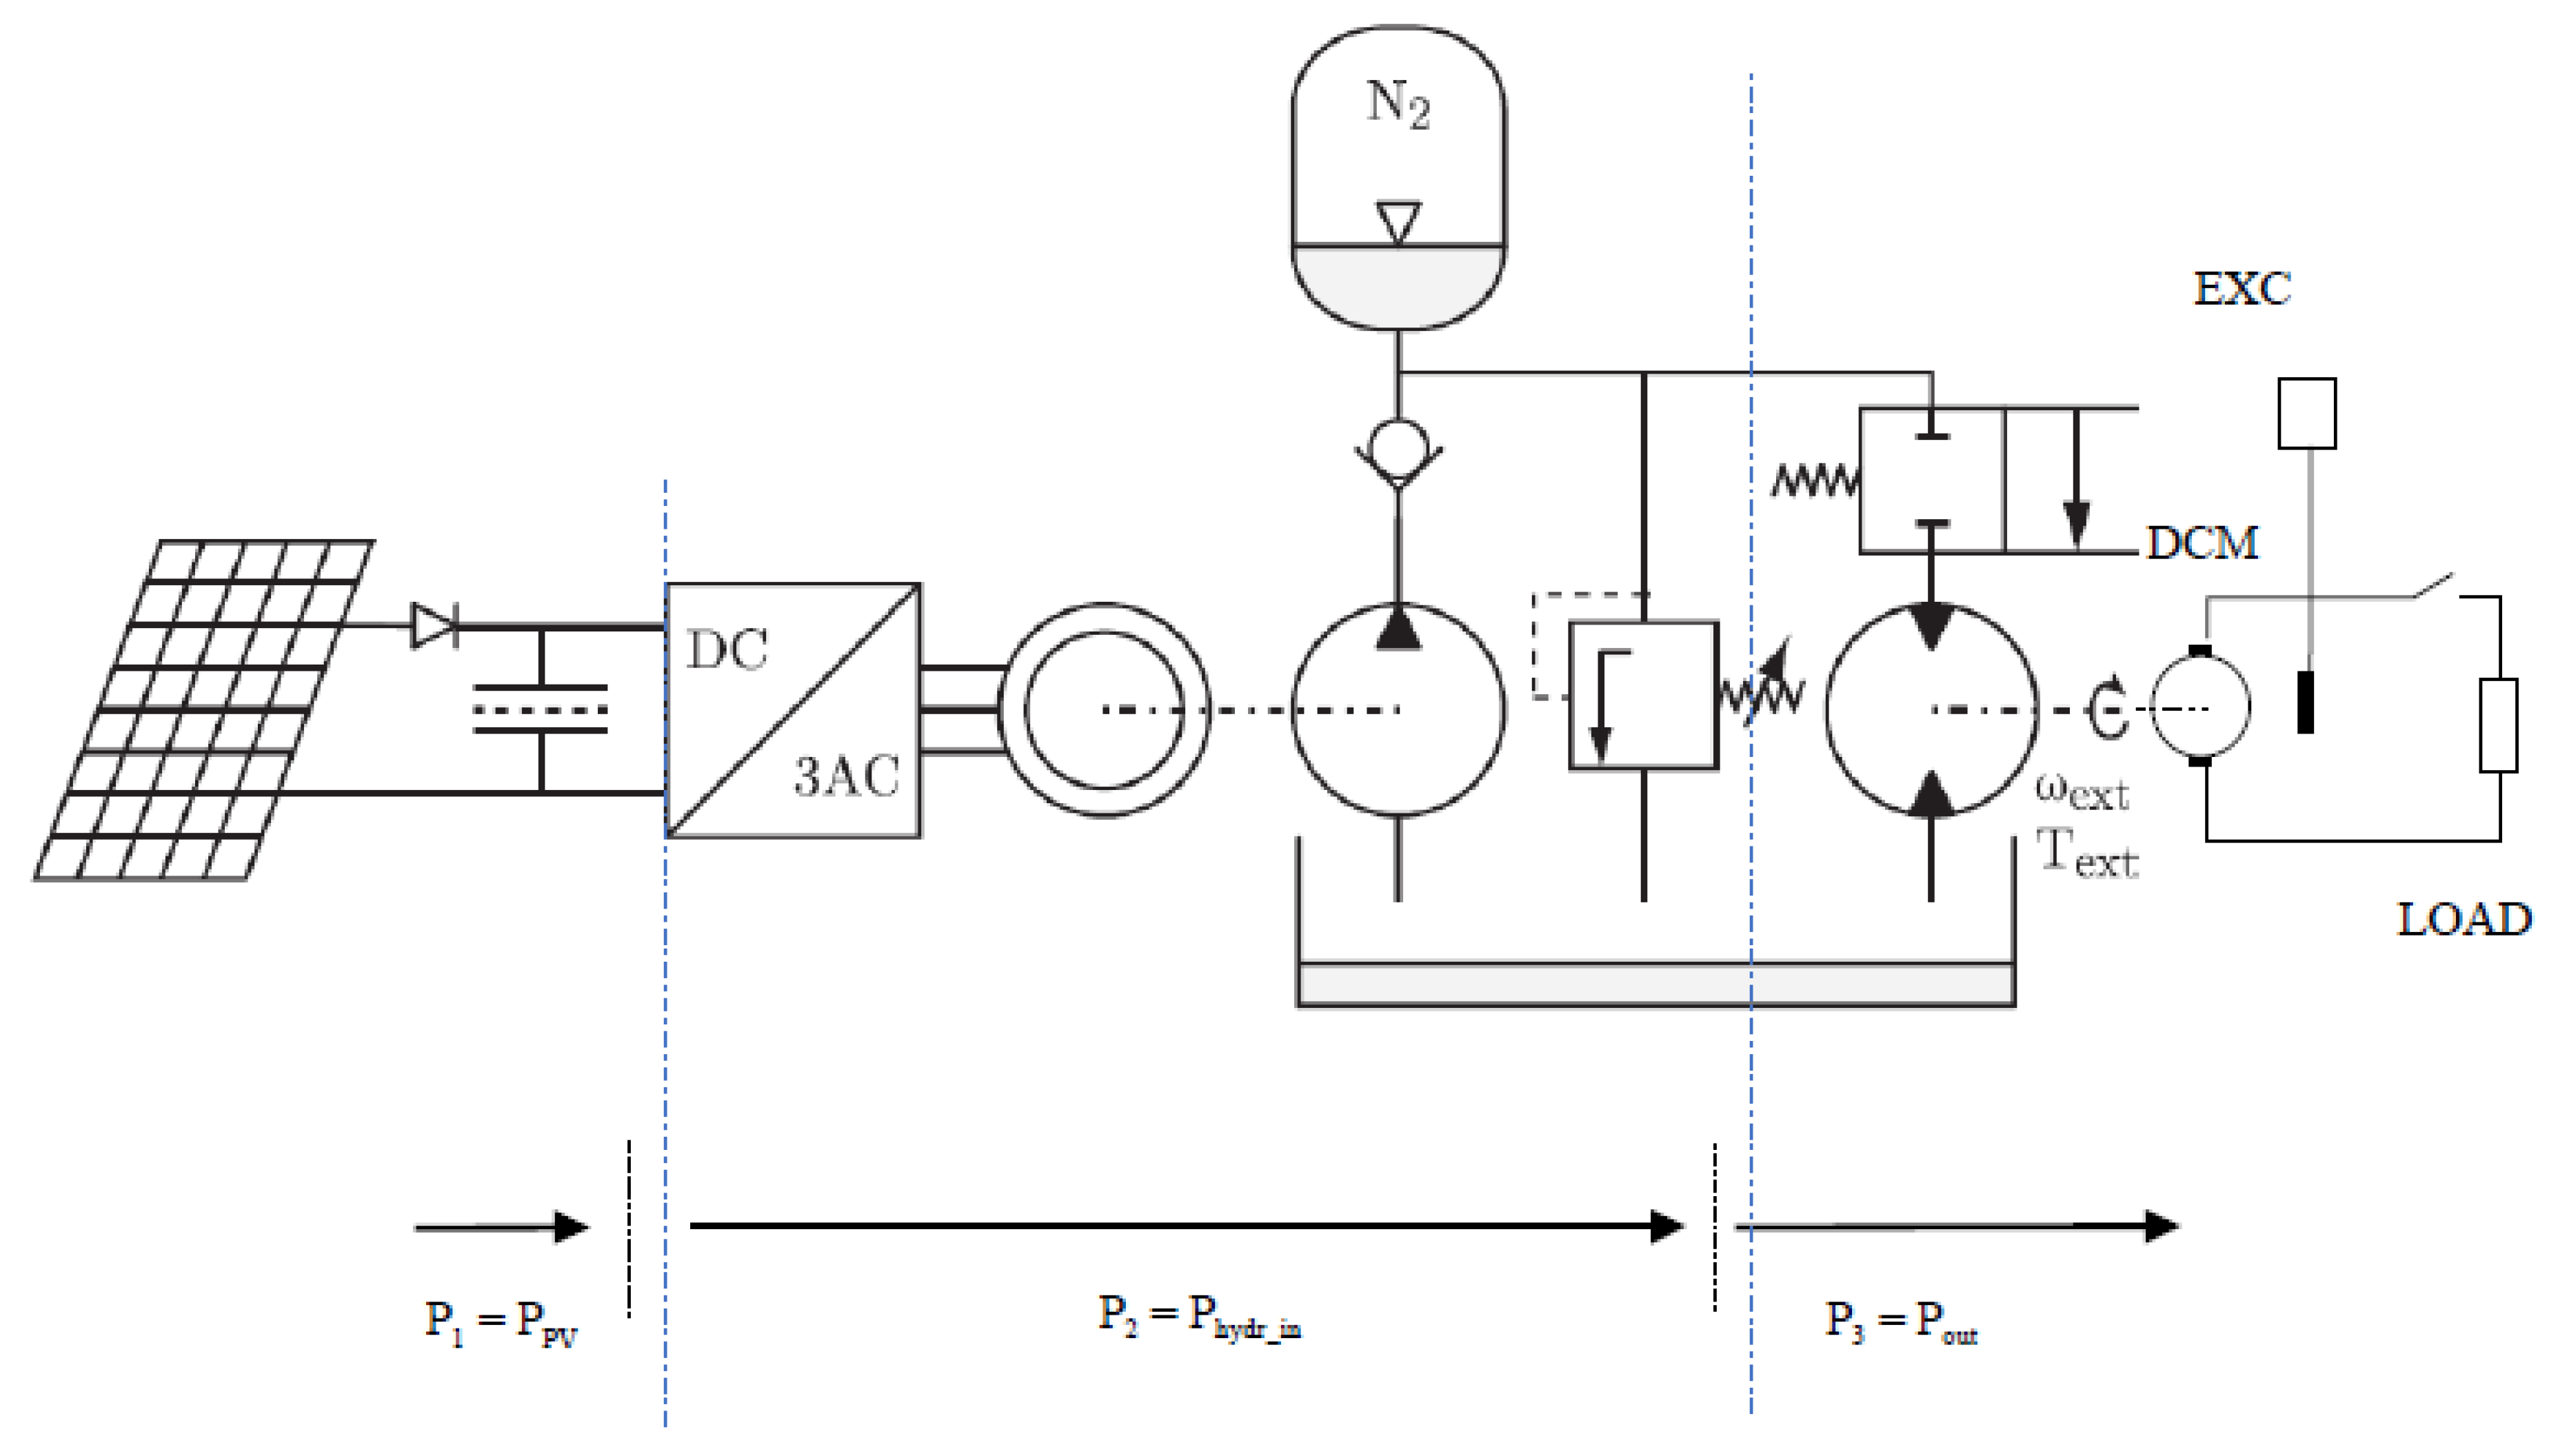
An example of such an energy harvesting system can be found in the field of collection containers for plastic or other waste materials, where mechanical equipment compacts periodically (two or three times a day) the collected materials in order to reduce their volume. Between the small PV panels and the final actuator, a two-stage system is used as represented in
Figure 4.
First, the collected PV power, P
1, is stored in a supercapacitor bank, simply connected through a single diode, without any converter in order to avoid unnecessary losses [
4,
5]. This principle relies on the property of the PV panels to limit by themselves their current. This allows transfer of energy under very low power levels. The value of the supercapacitor charging current is imposed passively through the I-V curve of the directly connected PV panels, their voltage being that of the supercapacitors themselves. The maximum state of charge of the supercapacitors is designed in such a way that their maximum voltage is situated above the voltage value of the panels at their maximum power point.
After surpassing this MPP, the supercapacitors are discharged, feeding an electric motor coupled to a hydraulic pump, feeding the second accumulation stage that consists in a hydraulic accumulator as will be discussed later.
The increase and decrease of the supercapacitor’s voltage is limited by the upper and lower boundaries of a sliding mode controller. Within these two limits, the MPP is surpassed while the supercapacitor’s voltage rises (slowly, the small PV power defining the slope), and is passed again in the opposite direction while discharging (fast, the power being defined by the cascaded equipment). The charge and discharge of the supercapacitors at their respective two different power levels and times corresponds to a first power amplification stage of the harvesting chain where PAF1 = P2/P1.
The second accumulation stage consists of a hydraulic accumulator (or bladder) [
6], fed by successive pulses of power in the form of pressurized hydraulic oil and driven by the discharge of the first stage (the supercapacitors) at a power level P
2. The SOC of this second stage is increased sequentially by successive pulses of injected oil in order to reach the upper threshold of a second sliding mode controller, which focuses on the SOC of the hydraulic accumulator through its pressure level. Since the energy stored in this second stage reaches its maximum, the hydraulic cylinders of the mechanical compacting equipment can be energized.
The high output power of the hydraulic accumulator, P3, together with its charging power, P2, define the power amplification factor of the second stage, PAF2 = P3/P2. Finally, we can define the global PAFtot = PAF1*PAF2.
Figure 4 depicts the energy harvesting system that also embeds a test load made of a hydraulic motor coupled to an electric generator. The generator is electrically loaded by a resistor. Through the excitation of the DC generator it is possible to produce a constant voltage at the terminals of the resistor, assuming constant power dissipation.
The evolution of the different quantities as the PV power, P
1, charging the supercapacitors, the power, P
2, transmitted from the supercapacitors to the pump and hydraulic accumulator, as well as the variation of the supercapacitor’s voltage ,U
SC, are represented in the upper part of
Figure 5.
In the lower part of the figure, the variation of the accumulator’s pressure, Press, as well as the amount of its output power, P3, can be seen.
4. The Efficiency of the 1st Stage Power Amplification with Supercapacitors
As explained at the beginning of this paper, the first stage of the power amplification is achieved using direct coupled supercapacitors.
Figure 6 highlights the operation principle of the so-called « riding cap », where the power delivered by the PV panels, P
PV, is drawn on the left side of the figure as a function of the panel’s voltage, V
PV. The corresponding value of the voltage of the PV panels that is identical to the voltage of the direct connected supercapacitors is represented as a time-function in the upper right part of the figure.
The instantaneous power fed to and delivered by the supercapacitors is represented in the lower curve of
Figure 6. P
in is the value of the charging power level of the supercapacitors, and P
out is their discharging value. The charging and discharging durations are indicated as t
in and t
out. In the following calculation of the energy efficiency of this first power amplification stage, the variation of the value of the supercapacitor’s voltage is neglected, due to the fact the hysteresis of the sliding-mode controller is kept small. The calculation is done with a constant parameter, U
SC, corresponding to the mean value.
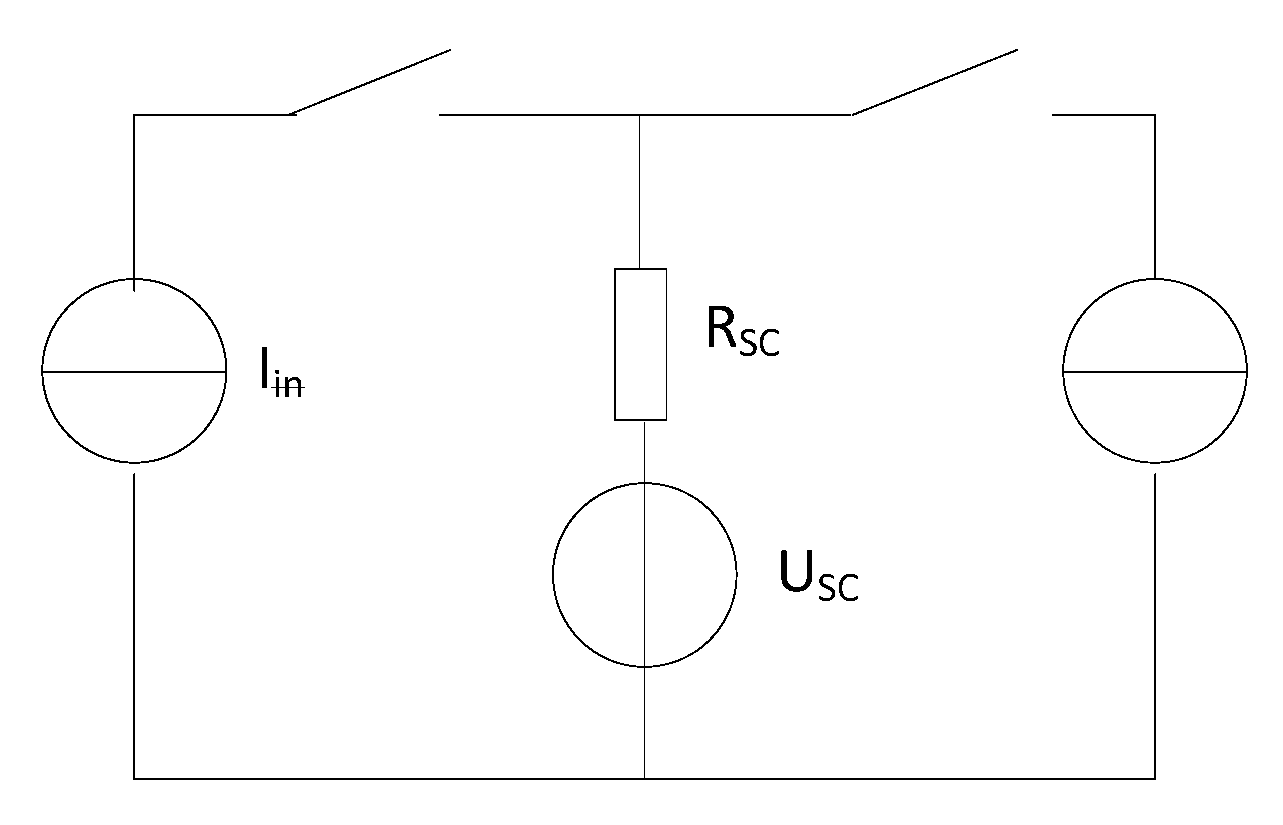
The calculation of the energy efficiency of the power amplification is based on the equivalent scheme of
Figure 7. A simplified calculation is given here, where not only the voltage variations of the supercapacitors is neglected, but where the charging/discharging current is kept constant. A more accurate calculation of this efficiency can be found in [
4].
Then, the discharge time t
out can be expressed as
leading to
where
corresponds to the short-circuit power of the supercapacitors at the beginning of their discharge. Introducing (2) in (1) the energy efficiency becomes
Further, with the definition of the power amplification factor, PAF =
and together with the power utilization factor
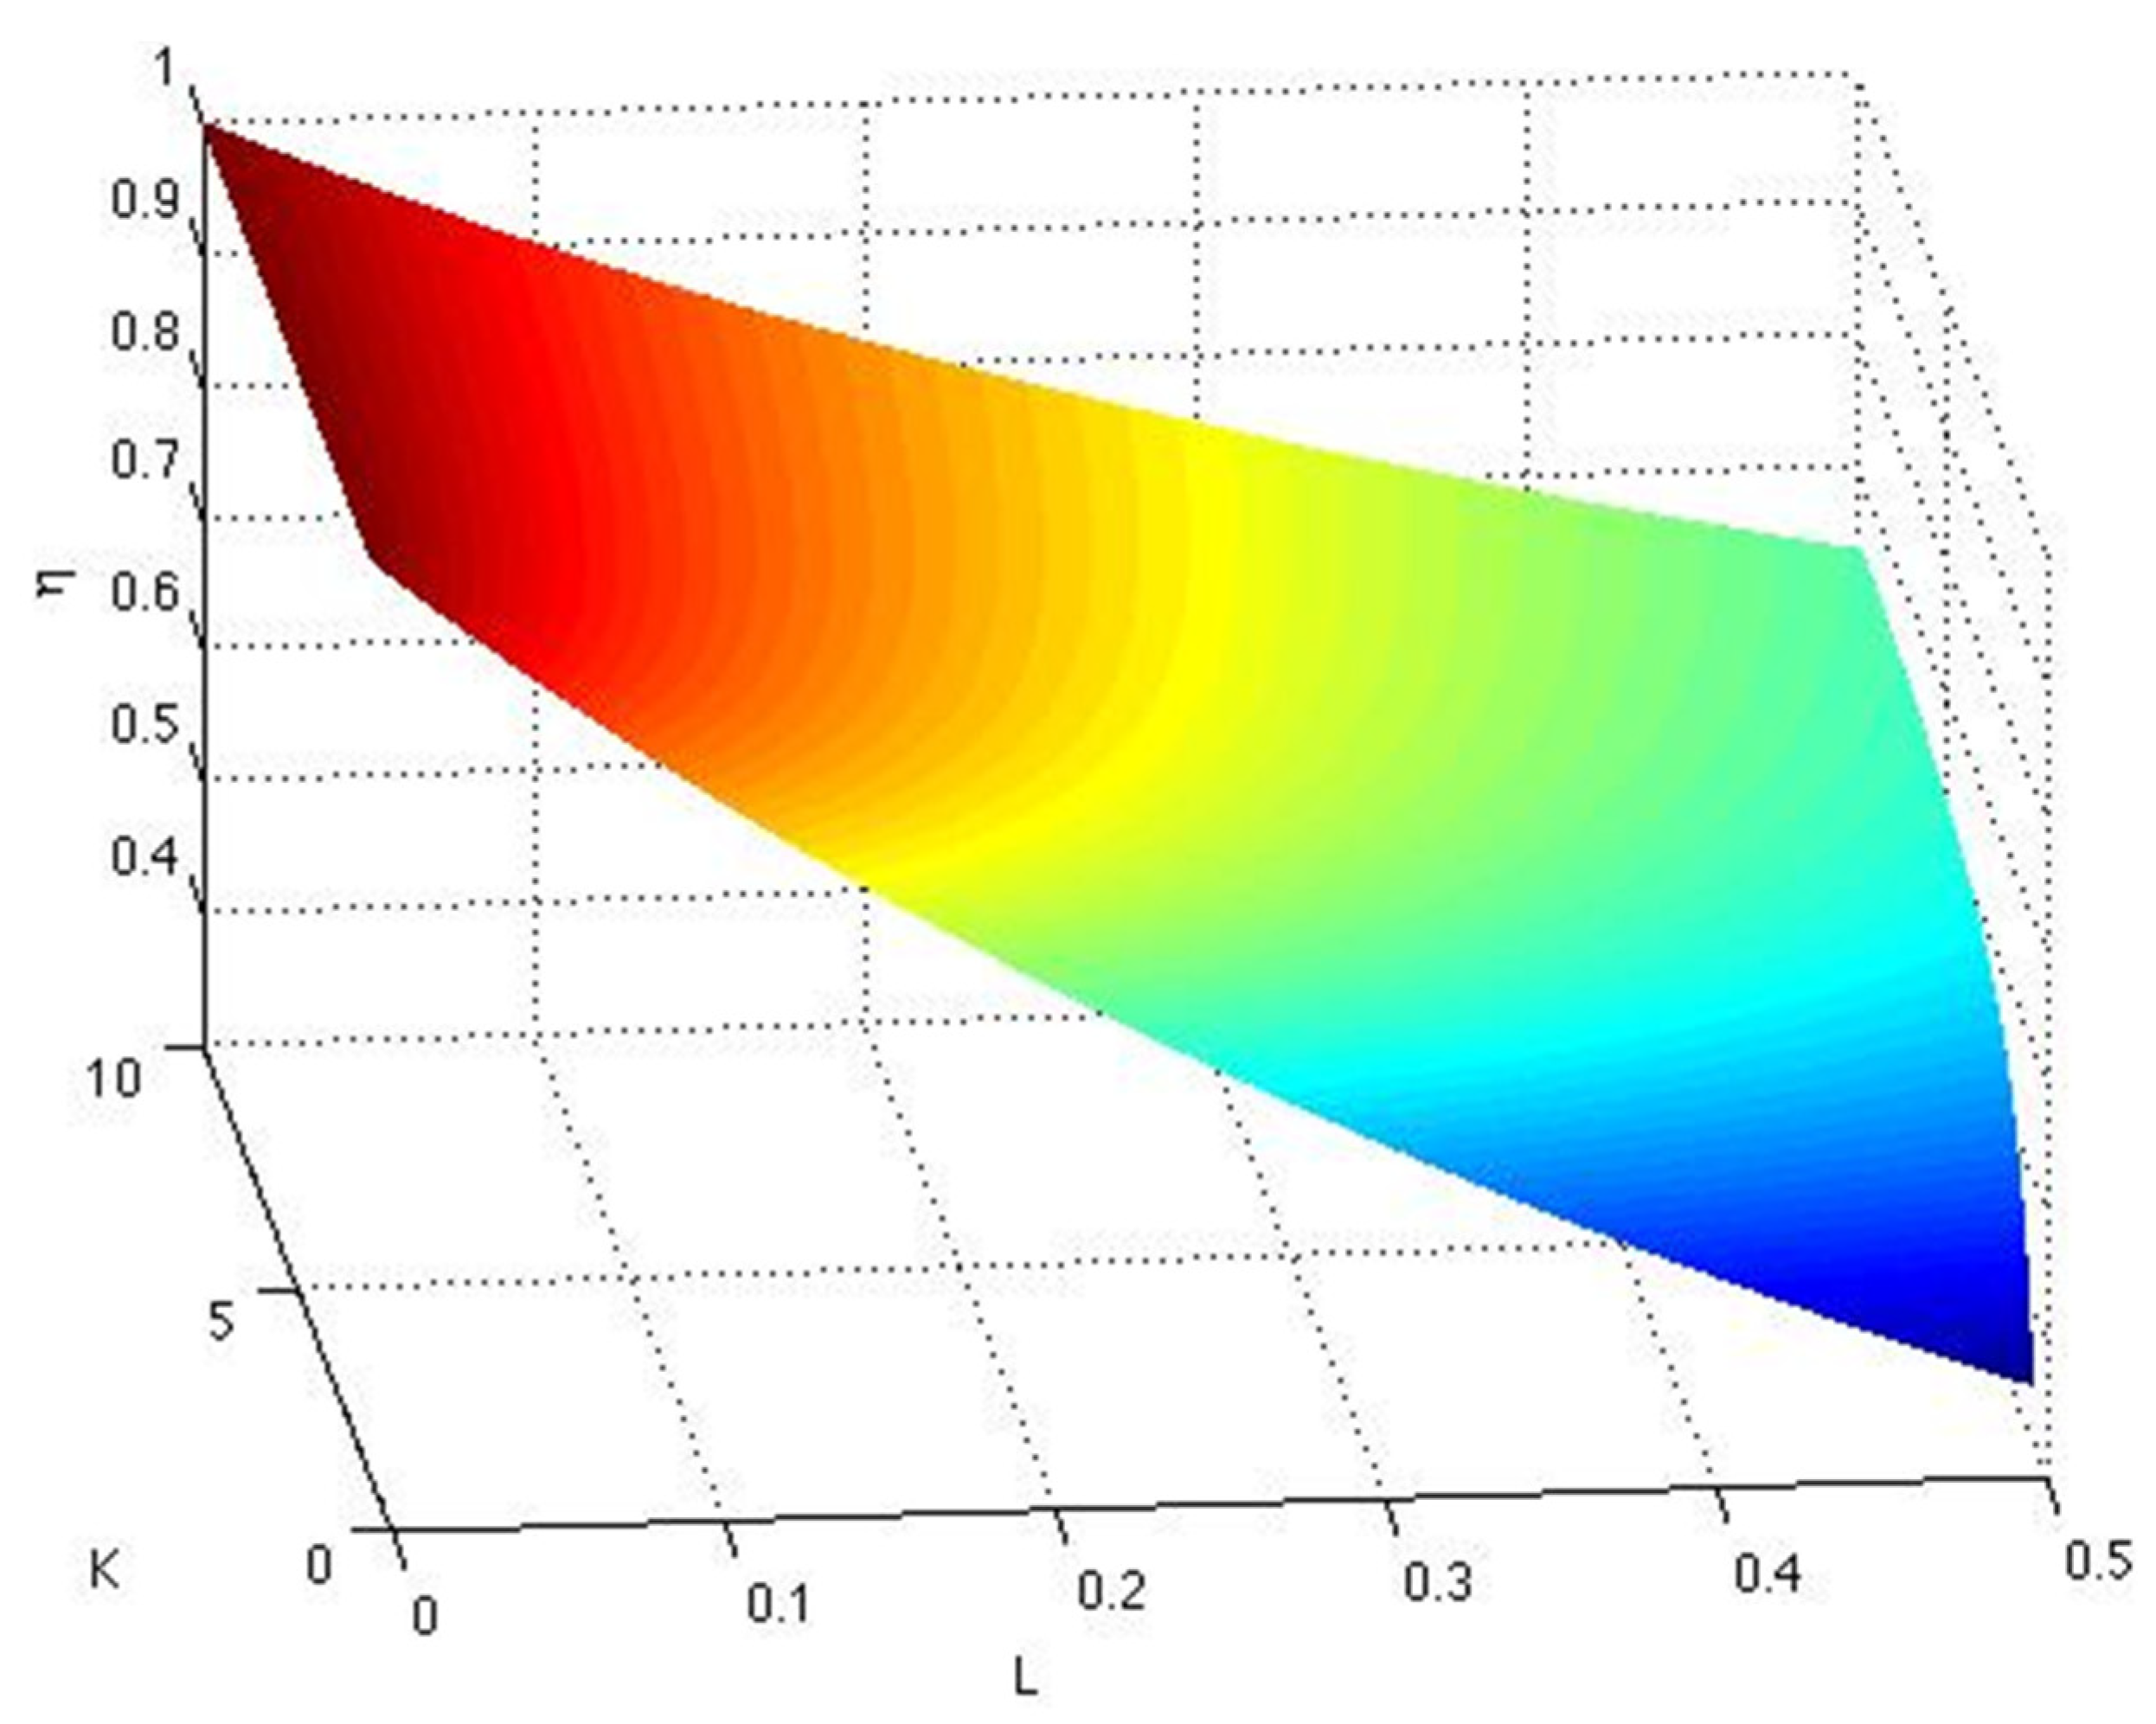
, the energy efficiency of the power amplification can be written as
The representation of the value of
ηamplif in dependency of the power amplification factor
K and of the power utilization factor,
L, is given in
Figure 8.
5. The Modified Ragone Representation (MRR) for the Evaluation of the Efficiency of a Two-Stage Amplification System
The method of the modified Ragone representation has been presented in
Section 2.1 for a one-stage storage system. The two stage system represented in
Figure 4 can be analyzed through the same tool of the modified Ragone representation. The properties of the studied system represented in
Figure 1b), e.g., an input PV power of around 70 W and an application power level of 5kW, result in a minimal value of the global power amplification factor, PAF
tot, of around 70. However, in reality, when the sun radiation is poor, this factor can be much higher, and reach values of several hundreds. This was the main motivation of the realization of the two-stage system. The individual energetic properties of the components of the two-stage system are represented in the diagram of
Figure 9. First, the blue lines of the PV panels are drawn (one line per solar irradiance value), where the power should ideally be kept at the MPPT point corresponding to the unity value. The intersections with the black line of the modified Ragone representation of the supercapacitors show that the choice of these components is well adapted, and the MRR of the supercapacitors gives the value of the energy efficiency of this first energy transfer. Then the energy transfer from the supercapacitors to the hydraulic accumulator is influenced as well by the MRR of the former component (the supercapacitors) for its discharge, as by the MRR of the hydraulic accumulator during its charge. This energy transfer is represented through the green zone of
Figure 9, where one can see the optimal design due to the intersection of the curves at their respective maximums. The width of the green zone in
Figure 9 corresponds to the power variation of the charging impulses of the hydraulic accumulator due to the variation of the internal pressure which is related to the accumulator’s state of charge. Finally, the high power value of the final application (5kW) is represented by the vertical dotted line. It can be read that the intersection with the MRR of the hydraulic accumulator corresponds to an acceptable energy exchange, the intersection point being in the region of the high performance of the bladder. One can easily see also that there is a total incompatibility between the curves of the PV panel and the final application, and also an incompatibility between the supercapacitive pre-storage and the same final application. The total power amplification factor of this two-stage application is equal to 5kW/70W = 71.4 in the case of the highest PV power collected.

