1. Introduction
Several large-scale projects, such as TCGA (The Cancer Genome Atlas) or ICGC (International Cancer Genome Consortium), have studied dozens of tumor types through the analysis of hundreds of samples with several molecular assays of the genome, epigenome, proteome, transcriptome and the respective clinical data. One such example is stomach adenocarcinoma (STAD), representing nearly 5% of new cancer cases worldwide [
1]. STAD is a complex disease, with a mortality rate almost equivalent to its incidence.
The molecular profiling of more than four hundred tumor cells with five different assays has allowed for the identification of four novel STAD sub-types with different diagnostic and prognostic value [
2]. However, extensive characterization of tumor samples is not always possible due to clinical, technical or budget limitations.
Previous studies have shown that strong outcome predictor signatures can be derived from RNA data in cancer [
3]. These studies indicate that gene expression carries sufficient signal for the accurate prediction of phenotypes. For this reason, we believe that the genetic alterations observed in different STAD molecular subtypes should be reflected in differential tissue gene expression
Here, we set to investigate if it is to possible to develop a predictive tool that, based on transcriptome profiling with RNA-seq, can predict stomach cancer samples according to the proposed stratification. In order to minimize the effect of possible unwanted sources of variation in the data, we have analyzed the impact of pre-processing the data, taking into account the effect of the available covariate information.
2. Materials and Methods
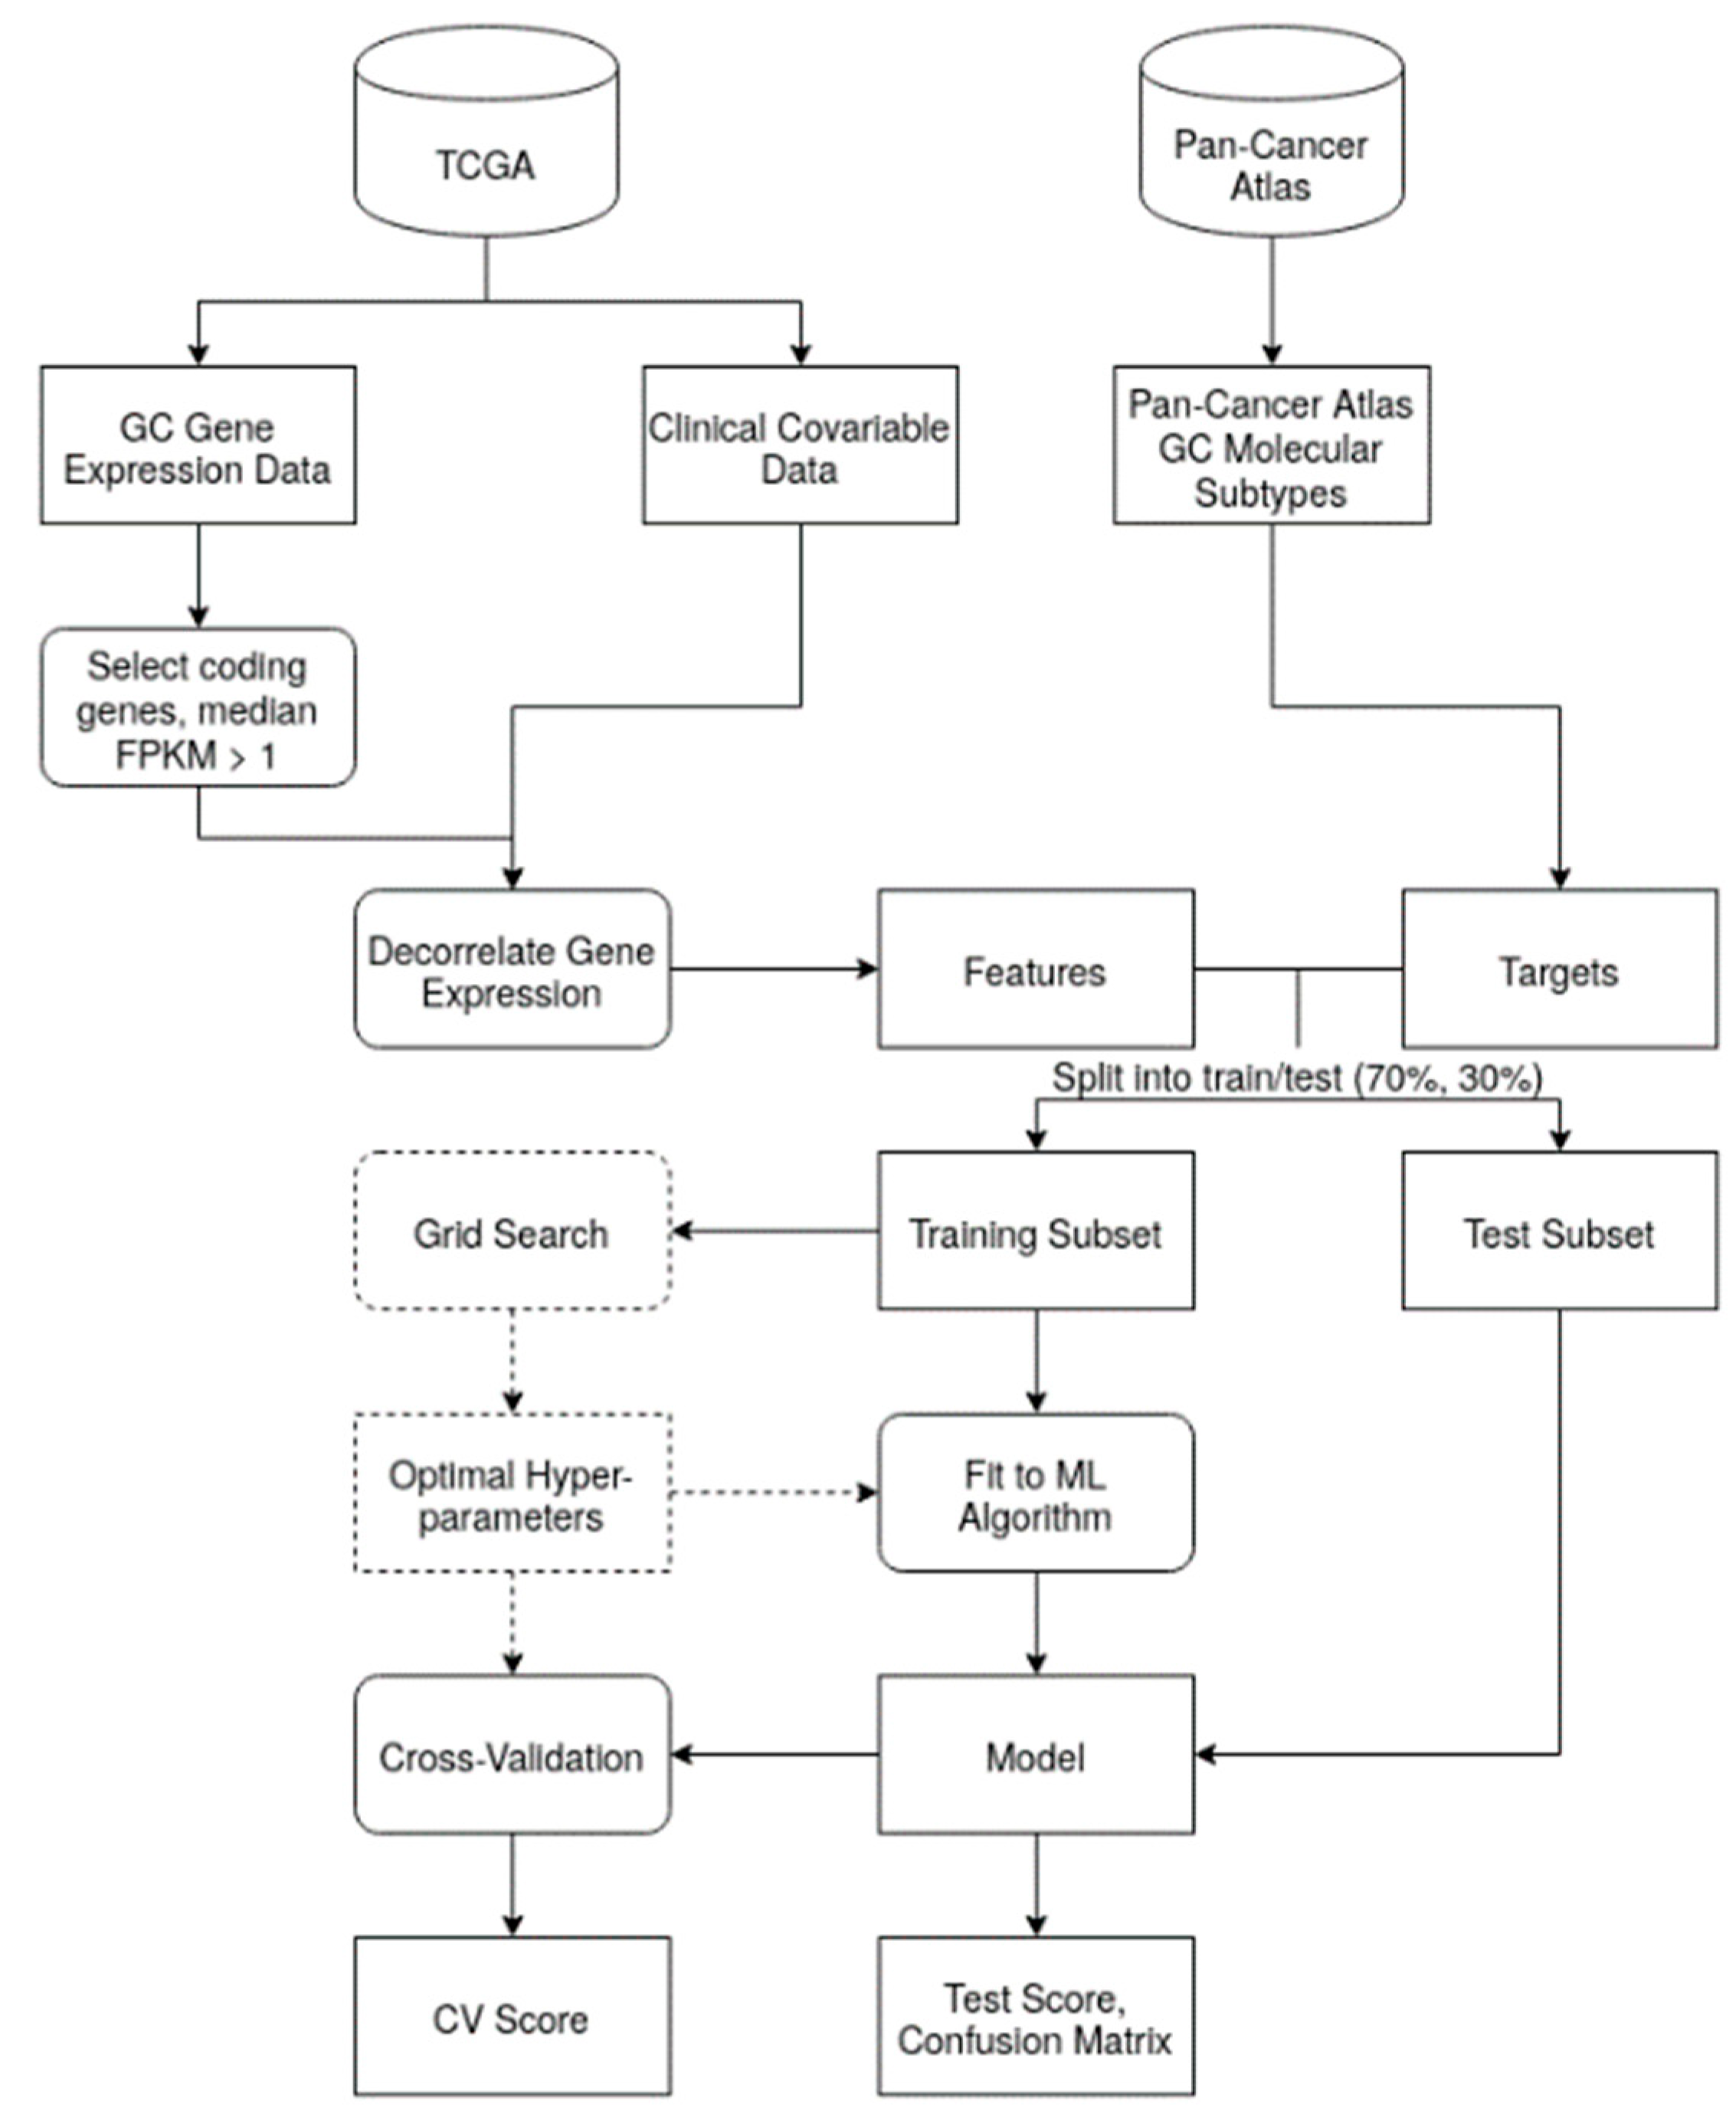
STAD-specific transcriptome data were obtained from the TCGA Research Network (
https://www.cancer.gov/tcga). Samples with insufficient clinical information were excluded. As features, only coding genes with a median Fragments per Kilobase per Million (FPKM) value higher than 1 were retained (
Figure 1) and their values were log2 transformed.
Technical or clinical factors may correlate with both the features and the target STAD molecular subtypes, possibly confounding machine learning (ML) predictions. Without a decorrelation step, the model may thus over- or under-estimate the effect of the features on the target variable. As a data pre-processing step, we regressed out the possible confounding effects of the covariates on the gene expression data through a multiple linear model:
where g
i represents the gene expression for gene i, 𝛃
0 is the intercept, 𝛃
i i ∈ (1, ..., 12) is the regression coefficients for the covariates, and ɛ is the noise term.
The residuals of the model, obtained as the difference between the real gene expression value (gi) and the predicted expression (ĝi), were used as the expression phenotype.
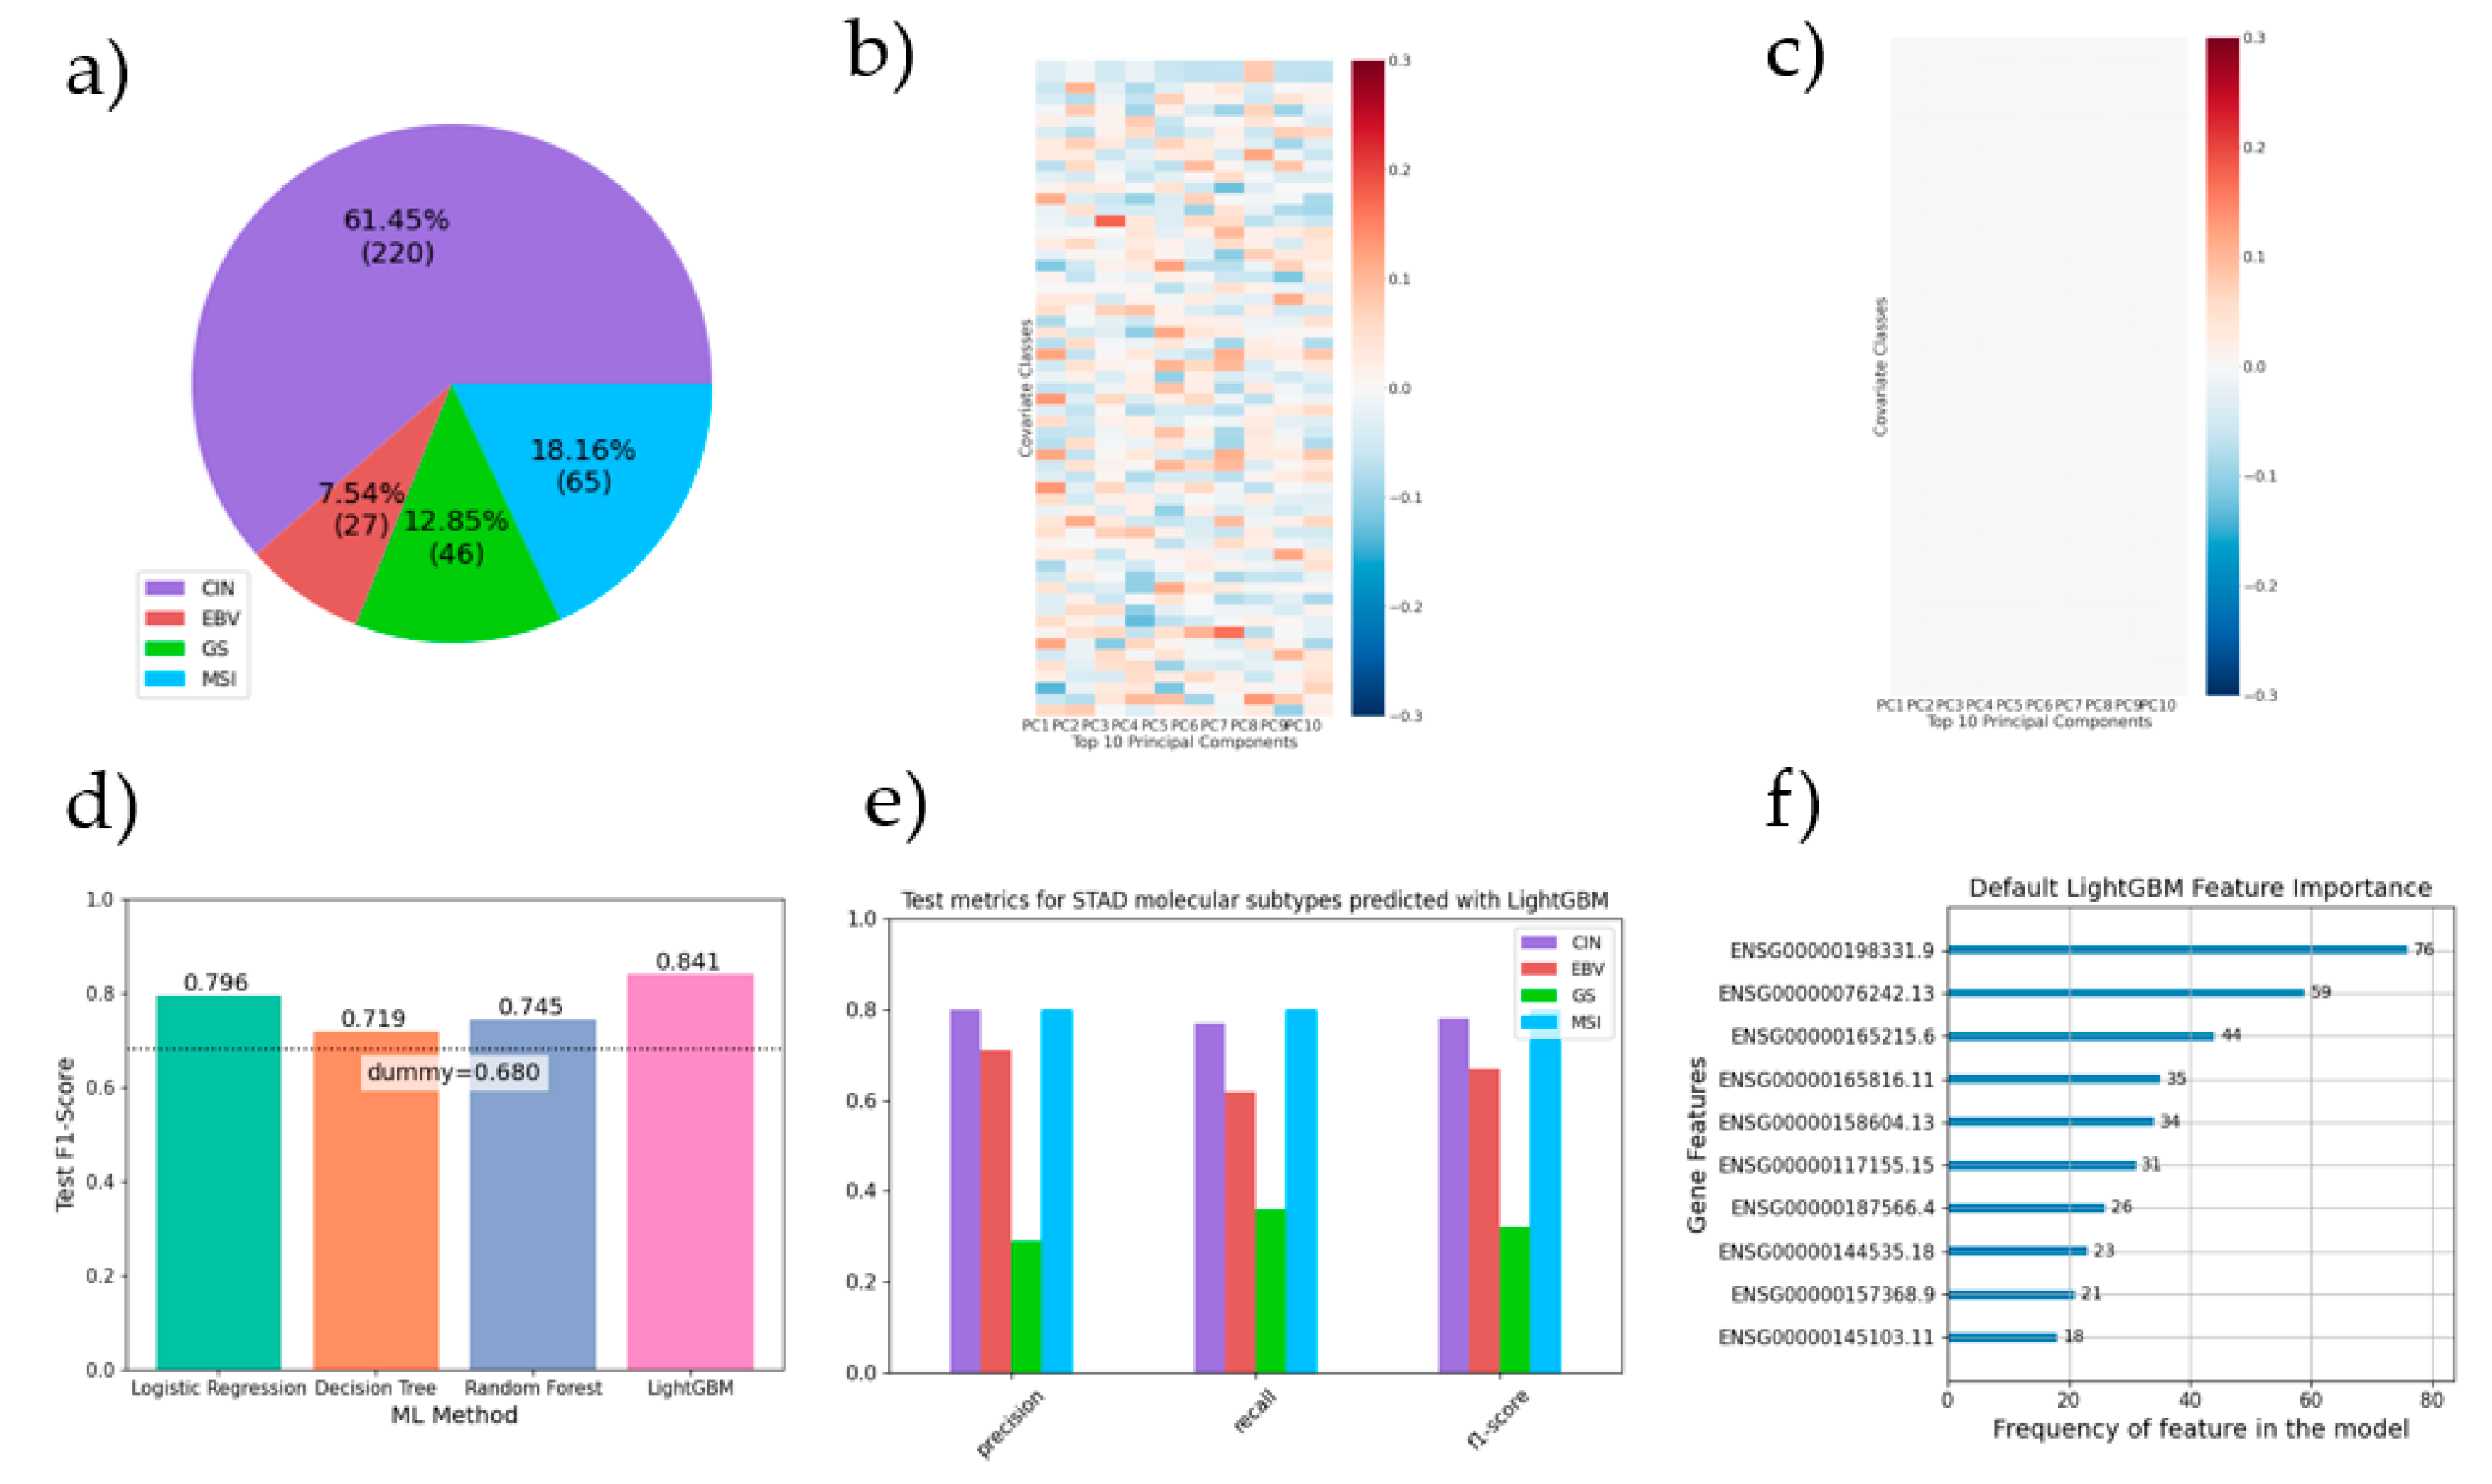
After this step, several ML pipelines were devised with the goal of predicting STAD molecular subtypes from RNA-seq data (chromosomal instability (CIN) 61.45%, Epstein–Barr virus (EBV) 7.54%, genomically stable (GS) 12.85%, microsatellite instability (MSI) 18.16%; see
Figure 2a). First, the dataset was split into stratified training (n = 250) and test (n = 108) sets. Each algorithm learned from the training set’s features to build prediction models, with or without hyper-parameter optimization. Cross-validation was performed to test the model’s performance on sampled portions of the training data, with subsequent validation using the unseen test set.
3. Results
Several covariates possessed significant correlation (ranging from -0.14 to 0.17) with the top 10 principal components for gene expression (
Figure 2b). As expected, all covariate correlation was lost after gene-wide covariate decorrelation (
Figure 2c).
Despite a heavy class imbalance (
Figure 2a), all machine learning models outperformed a dummy estimator that always predicted the most frequent class, with an average 8% improvement across methods (
Figure 2d). There were also notable differences in performance between algorithms, with the best performer, LightGBM, having a test F1-score 5.6% better than the second best, logistic regression. By contrast, there was no significant difference between results of models using default algorithm hyper-parameters and those obtained following hyper-parameter optimization. On a per class basis, the CIN sub-type exhibits the best results (
Figure 2e). The top 10 most informative gene features for the best performing model (LightGBM default) are shown in
Figure 2f. Of special interest, the second most contributing gene, ENSG00000076242 (MLH1), is a tumor suppressor gene whose epigenetic silencing is associated to MSI tumors.
4. Discussion
Machine learning methods show promise for the prediction of molecular subtypes in STAD, with even the simplest methods performing better than random chance. However, perhaps due to the small sample size and/or imbalance of the data, hyper-parameter optimization offered no performance improvements.

