Proceeding Paper

Fully Automatic Method for the Visual Acuity Estimation Using OCT Angiographies †

1
Centro de investigación CITIC, Universidade da Coruña, 15001 A Coruña, Spain
2
Grupo VARPA, Instituto de Investigación Biomédica de A Coruña (INIBIC), Universidade da Coruña, 15001 A Coruña, Spain
*
Author to whom correspondence should be addressed.
Presented at the 3rd XoveTIC Conference, A Coruña, Spain, 8–9 October 2020.
Proceedings 2020, 54(1), 57; https://doi.org/10.3390/proceedings2020054057
Published: 4 September 2020
(This article belongs to the Proceedings of 3rd XoveTIC Conference)

Abstract

:
In this work we propose the automatic estimation of the visual acuity of patients with retinal vein occlusion using Optical Coherence Tomography by Angiography (OCTA) images. To do this, we first extract the most relevant biomarkers in this imaging modality—area of the foveal avascular zone and vascular densities in different regions of the OCTA image. Then, we use a support vector machine to estimate the visual acuity. We obtained a mean absolute error of 0.1713 between the manual visual acuity measurement and the estimated, being considered satisfactory results.

1. Introduction

Optical Coherence Tomography by Angiography (OCTA) is the newest imaging modality in the ophthalmic field. This imaging modality is mainly characterized by allowing the visualization of the retinal vasculature non-invasively, being extracted in real time at different levels of depth. The most relevant biomarker in this imaging modality is the Foveal Avascular Zone (FAZ), which represents a region without vascular circulation in the macular area. In our previous work, we have performed the automatic extraction of this biomarker [1]. Visual Acuity (VA) is the representation of a patient’s vision. Problems related to the loss of microvasculature lead to a consequent loss of vision. In this work, we present the estimation of the VA of patients with Retinal Vein Occlusion (RVO) using features that were extracted directly from the OCTA images [2,3].

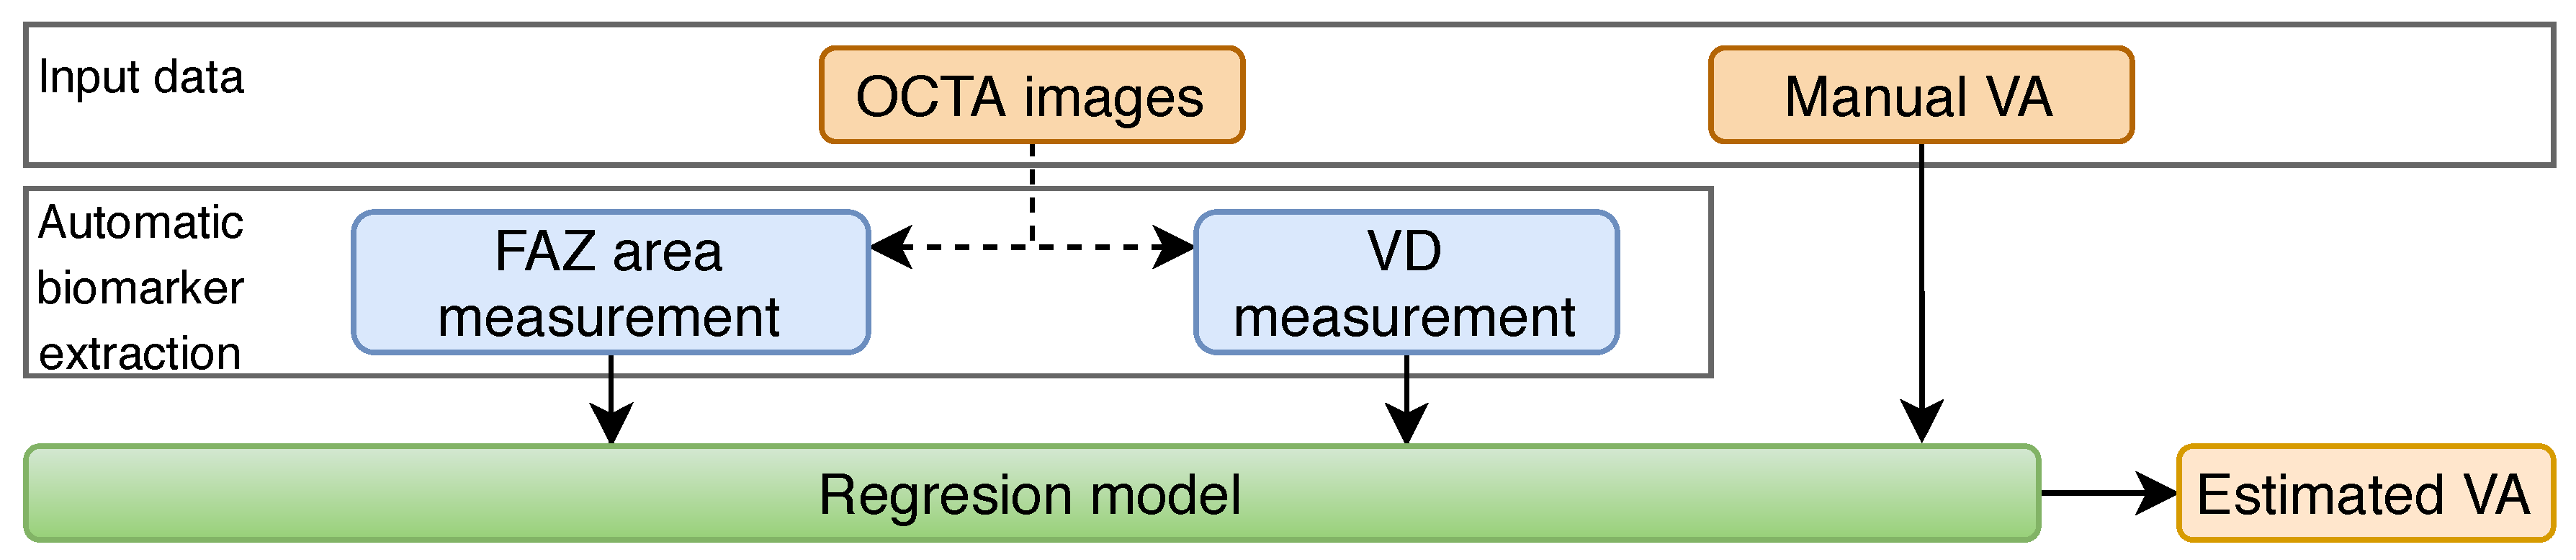
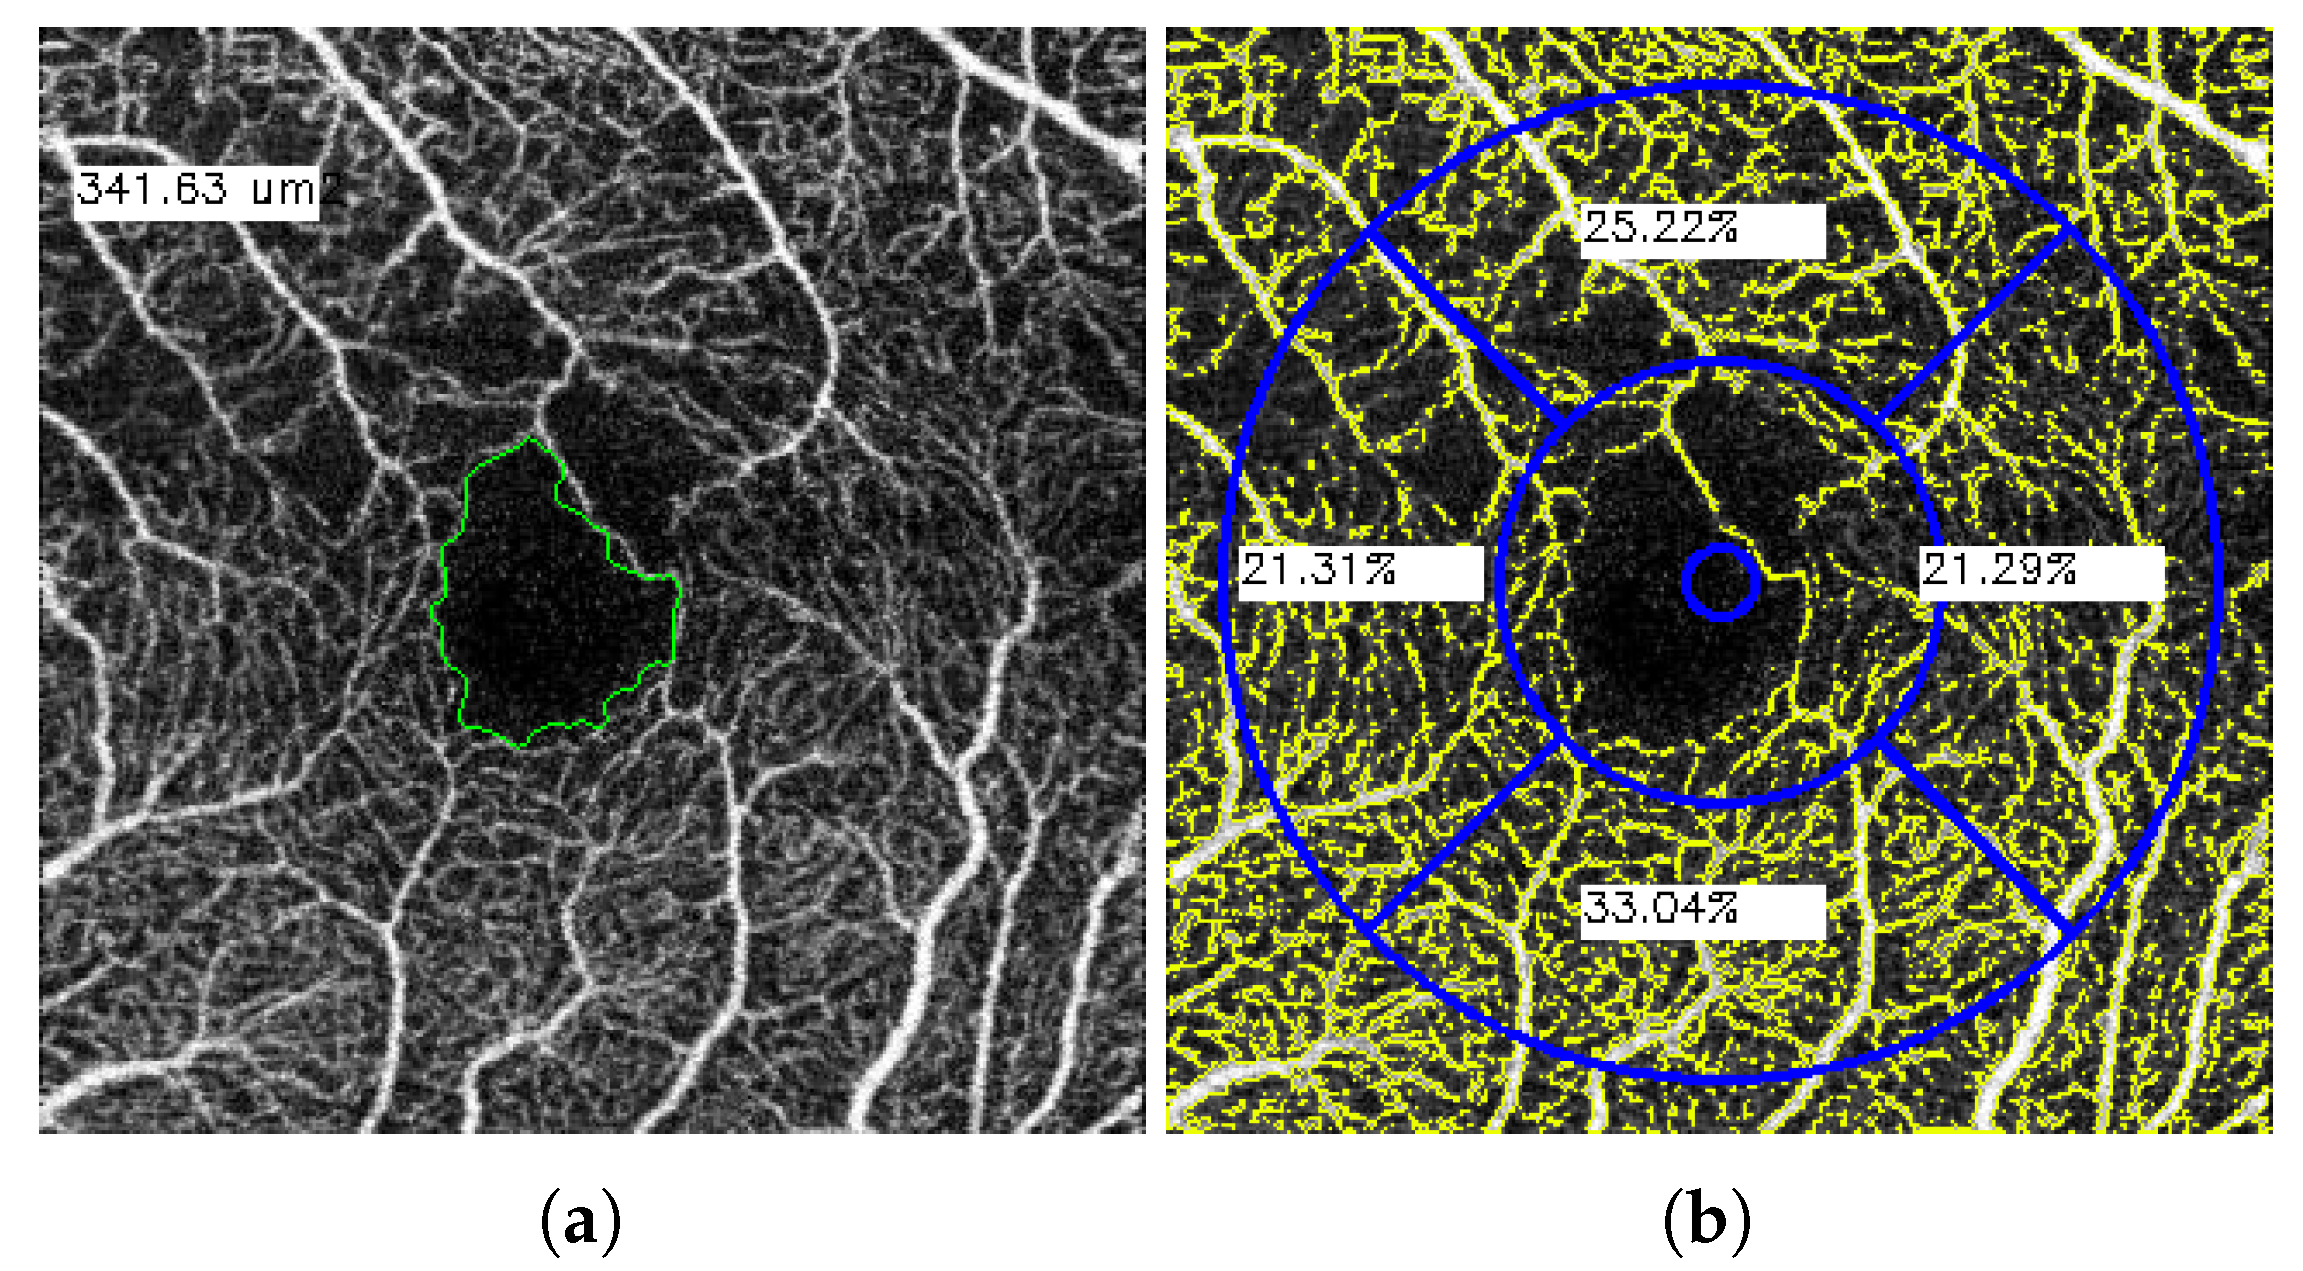
2. Materials and Methods

A dataset containing 860 OCTA images divided into different patient visits is used to validate the proposed method. Each visit consists of four OCTA images representing different depths of the retina (superficial and deep) as well as different zoom levels (3 × 3 mm 2 and 6 × 6 mm 2 ). For a more detailed specification of the used dataset, see Reference [3].
In Figure 1, we can see the steps that were followed to estimate the VA. Using the input OCTA images, we extract the FAZ using the methodology explained in Reference [1] and then we extract the vascular density (VD). To extract the VD, a thresholding process using the Otsu’s algorithm was used, followed by a skeletonization procedure. At this point, the image is divided into a grid, typically used in the clinical domain, being the density in each of the regions of this grid calculated. Figure 2 shows a representation of the extractions of these parameters. Finally, using a Support Vector Machine (SVM), we estimate the visual acuity using the FAZ measurements, as well as the densities in each quadrant of the employed grid.

3. Results

To validate the methodology we used the Mean Absolute Error (MAE) to evaluate the distance between the manually measured VA and the estimated one with the proposed method. The obtained results reported a MAE of 0.1713 of variation in the VA estimation. Given that the VA takes values in the range [0–1], and the results are obtained in real time (while the manual measurement of the VA is long in time), we can conclude that the results are satisfactory.

Author Contributions

These authors contributed equally to this work. All authors have read and agree to the published version of the manuscript.

Funding

The authors declare no conflict of interest. The funders had no role in the design of the study; in the collection, analyses, or interpretation of data; in the writing of the manuscript, or in the decision to publish the results. This research was funded by CITIC, Centro de Investigación de Galicia ref. ED431G 2019/01 that receives financial support from Consellería de Educación, Universidade e Formación Profesional, Xunta de Galicia, through the ERDF (80%) and Secretaría Xeral de Universidades (20%) and by the Instituto de Salud Carlos III, Government of Spain through the DTS18/00136 research project and by the Ministerio de Ciencia, Innovación y Universidades, Government of Spain through the RTI2018-095894-B-I00 research projects. Also, this work has received financial support from the European Union (European Regional Development Fund - ERDF).

References

  1. Díaz, M.; Novo, J.; Cutrín, P.; Gómez-Ulla, F.; Penedo, M.G.; Ortega, M. Automatic segmentation of the foveal avascular zone in ophthalmological OCT-A images. PLoS ONE 2019, 14, e0212364. [Google Scholar] [CrossRef]
  2. Díez-Sotelo, M.; Díaz, M.; Abraldes, M.; Gómez-Ulla, F.; Penedo, M.G.; Ortega, M. A Novel Automatic Method to Estimate Visual Acuity and Analyze the Retinal Vasculature in Retinal Vein Occlusion Using Swept Source Optical Coherence Tomography Angiography. J. Clin. Med. 2019, 8, 1515. [Google Scholar] [CrossRef] [PubMed]
  3. Díaz, M.; Díez-Sotelo, M.; Gómez-Ulla, F.; Novo, J.; Penedo, M.G.; Ortega, M. Automatic Visual Acuity Estimation by Means of Computational Vascularity Biomarkers Using Oct Angiographies. Sensors 2019, 19, 4732. [Google Scholar] [CrossRef] [PubMed]
Figure 1. Steps of the presented methodology.
Proceedings 54 00057 g001
Figure 2. Representative examples of the (a) FAZ extraction and (b) VD measurement process.
Proceedings 54 00057 g002
Publisher’s Note: MDPI stays neutral with regard to jurisdictional claims in published maps and institutional affiliations.

