Regression Linear Model of Air Pollution Emission on the Example of a Waste Incineration Plant †

Abstract
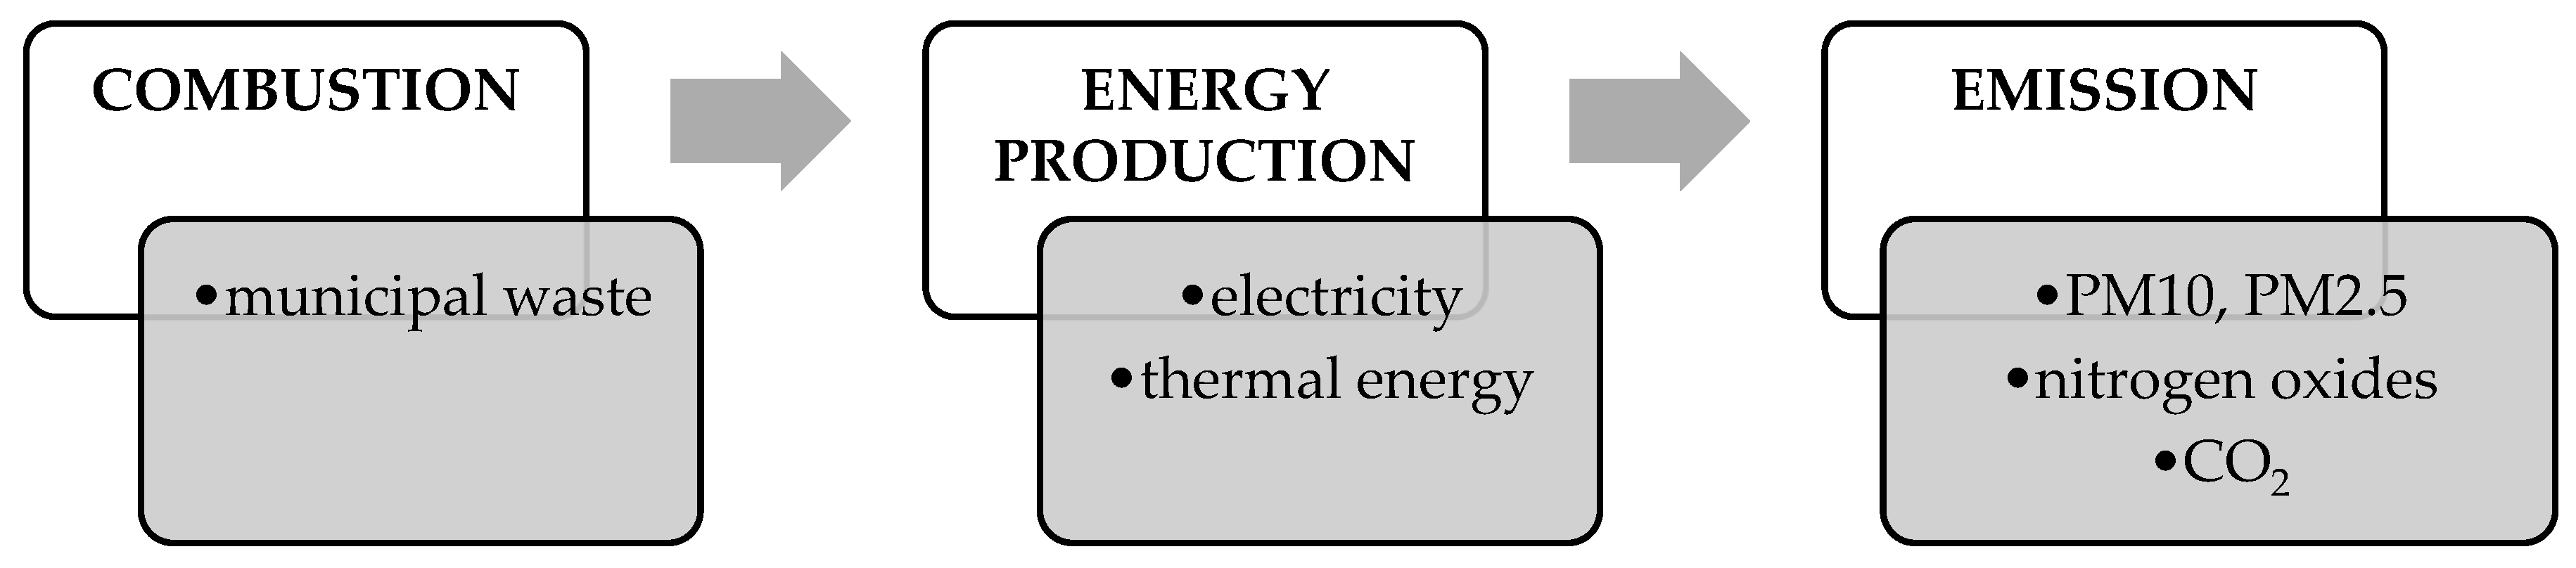
:1. Introduction
2. Materials and Methods
- —
- Amount of waste accepted for incineration;
- —
- Fuel oil consumption (in spare burners);
- —
- Consumption of activated carbon for waste gas treatment;
- —
- Electricity generated;
- —
- Heat generated.
3. Results
4. Conclusions
Author Contributions
Conflicts of Interest
References
- Ramos, A.; Teixeira, C.A.; Rouboa, A. Environmental Analysis of Waste-to-Energy—A Portuguese Case Study. Energies 2018, 11, 548. [Google Scholar] [CrossRef]
- Pires, A.; Pires, A.; Chang, N.-B. Solid waste management in European countries: A review of systems analysis techniques. J. Environ. Manag. 2011, 92, 1033–1050. [Google Scholar] [CrossRef]
- Zhang, D.; Huang, G.; Xu, Y.; Gong, Q. Waste-to-Energy in China: Key Challenges and Opportunities. Energies 2015, 8, 14182–14196. [Google Scholar] [CrossRef]
- Ryu, C.; Shin, D. Combined Heat and Power from Municipal Solid Waste: Current Status and Issues in South Korea. Energies 2012, 6, 45–57. [Google Scholar] [CrossRef]
- Inoue, K.; Yasuda, K.; Kawamoto, K. Report: Atmospheric pollutants discharged from municipal solid waste incineration and gasification-melting facilities in Japan. Waste Manag. Res. 2009, 27, 617–622. [Google Scholar] [CrossRef] [PubMed]
- Margallo, M.; Aldaco, R.; Irabien, A.; Carrillo, V.; Fischer, M.; Bala, A.; Fullana-I-Palmer, P. Life cycle assessment modelling of waste-to-energy incineration in Spain and Portugal. Waste Manag. Res. 2014, 32, 492–499. [Google Scholar] [CrossRef] [PubMed]
- Cucchiella, F.; D’Adamo, I.; Gastaldi, M. Sustainable management of waste-to-energy facilities. Renew. Sustain. Energy Rev. 2014, 33, 719–728. [Google Scholar] [CrossRef]

| Month | Waste Accepted for Incineration | Consumption of Heating Oil (Auxiliary Burners) | Consumption of Activated Carbon | Electricity Generated | Heat Generated |
|---|---|---|---|---|---|
| (Mg) | (kg) | (kg) | (MWh) | (GJ) | |
| January | 10,236.64 | 0.00 | 2861.04 | 4613.52 | 48,026.39 |
| February | 10,189.14 | 60.00 | 2055.93 | 4222.54 | 42,635.98 |
| March | 10,096.52 | 840.00 | 2245.03 | 4824.17 | 42,653.52 |
| April | 9916.24 | 565.00 | 1394.23 | 4771.58 | 38,146.46 |
| May | 8036.38 | 14,335.00 | 1114.72 | 4064.62 | 20,441.55 |
| June | 10,097.48 | 144.00 | 884.5 | 5625.69 | 13,535.42 |
| July | 11,163.62 | 427.00 | 2751.88 | 5819.11 | 13,967.86 |
| August | 10,744.08 | 6.00 | 3781.81 | 5772.26 | 14,482.11 |
| September | 3011.6 | 14771.00 | 4892.1 | 22074.1 | 54,976.3 |
| October | 12,056.3 | 530.00 | 38,511.3 | 5151,05 | 342,759.6 |
| November | 10,093.02 | 136.00 | 19,281.1 | 45,199.8 | 44,240.26 |
| December | 9533.1 | 0.00 | 25,647.8 | 49,487.2 | 378,565.1 |
| Total | 115,174.12 | 31814.00 | 25,922.37 | 56,540.65 | 355,759.65 |
Publisher’s Note: MDPI stays neutral with regard to jurisdictional claims in published maps and institutional affiliations. |
© 2020 by the authors. Licensee MDPI, Basel, Switzerland. This article is an open access article distributed under the terms and conditions of the Creative Commons Attribution (CC BY) license (https://creativecommons.org/licenses/by/4.0/).
Share and Cite
Załuska, M.; Gładyszewska-Fiedoruk, K. Regression Linear Model of Air Pollution Emission on the Example of a Waste Incineration Plant. Proceedings 2020, 51, 32. https://doi.org/10.3390/proceedings2020051032
Załuska M, Gładyszewska-Fiedoruk K. Regression Linear Model of Air Pollution Emission on the Example of a Waste Incineration Plant. Proceedings. 2020; 51(1):32. https://doi.org/10.3390/proceedings2020051032
Chicago/Turabian StyleZałuska, Monika, and Katarzyna Gładyszewska-Fiedoruk. 2020. "Regression Linear Model of Air Pollution Emission on the Example of a Waste Incineration Plant" Proceedings 51, no. 1: 32. https://doi.org/10.3390/proceedings2020051032
APA StyleZałuska, M., & Gładyszewska-Fiedoruk, K. (2020). Regression Linear Model of Air Pollution Emission on the Example of a Waste Incineration Plant. Proceedings, 51(1), 32. https://doi.org/10.3390/proceedings2020051032