Proceeding Paper

Assessment of Measurement Uncertainty in Optical Marker Tracking of High-Speed Motion †

1
Sports Technology Institute, Loughborough University, Loughborough LE11 3TU, UK
2
PING Inc., Phoenix, AZ 85029, USA
*
Author to whom correspondence should be addressed.
Presented at the 13th conference of the International Sports Engineering Association, Online, 22–26 June 2020.
Proceedings 2020, 49(1), 72; https://doi.org/10.3390/proceedings2020049072
Published: 15 June 2020

Abstract

:
Optical marker tracking is used in research environments to understand the dynamics of moving objects of interest. Due to the complexity of the systems and the wide field of applications, there is no simple method to assess system accuracy. In this approach, a driver clubhead functioned as a rigid body and was tracked during the delivery phase of the golf swing. Marker tracking uncertainty was assessed by measures of inter-marker distance errors. The effect of swing speed on marker tracking uncertainty was tested in the range 0 m/s (static) to 50 m/s. Results demonstrated that the rigid body position in the capture volume has a large effect on marker tracking uncertainty. Positive correlations were found between marker tracking uncertainty and swing speed. Marker size and number of cameras used for marker reconstruction were optimised to provide mean marker tracking uncertainties around the tee position of below 0.13 mm.

1. Introduction

Optical marker tracking (OMT) systems are widely used in sports research, as they can locate and digitise objects of interest in three-dimensional (3D) space to sub-millimetre accuracy [1]. Kinematic variables of the object of interest, such as (angular) velocities and accelerations, rely on the OMT positional accuracy as they are derivatives from the measured 3D trajectories. In passive OMT systems, marker tracking accuracy is a resultant of how reliably cameras can track the centroid of the retro-reflective markers. As the markers move through 3D space and out of the focus plane, the circular markers in the two-dimensional (2D) camera image (see Figure 1) morph from circles towards oval shapes. Similarly, regardless of the underlying algorithm, high marker speed will produce oval blobs as opposed to clean circles, if OMT camera settings are not set properly.
Previous attempts to quantify OMT accuracy have used basic motions, such as tracking rigid bodies on motorised systems [1,2]. This has the advantage of comparing the OMT trajectories to a reference trajectory. However, due to the restricted reference marker trajectories, results of such validation studies cannot necessarily be transferred to other motions or OMT systems. Furthermore, only in a few approaches is OMT accuracy distinguished between the three OMT system axes [1,2]. It was shown in previous work that overall marker tracking uncertainty can depend on 3D position in space, marker speed, marker size and number of cameras [1,2,3,4]. Marker speeds have been limited to 14 m/s [1], which is sufficient for modelling the tracking accuracy of human body segments, but may not be representative for the high-speed motion of balls or other sport implements, such as golf clubs, tennis rackets, and baseball, softball and cricket bats.
The aim of this work is to provide a method for estimating dynamic measurement uncertainty of OMT in high-speed applications. The proposed method is applied to the movement of a clubhead during a golf swing. Deviations in distance measures between four markers on a rigid body are utilised to estimate marker tracking uncertainty. Applying reverse error propagation allows to uncouple the marker tracking uncertainty from the rigid body orientation so that the accuracy in the three global system axes can be investigated separately. The influence of marker speed, marker size and number of cameras used for reconstruction on OMT accuracy is investigated with the purpose of optimising OMT system settings. Understanding how to optimise OMT system settings for different high-speed applications may help to improve quality and time-efficiency of data-capturing in existing motion capture system setups.

2. Materials and Methods

2.1. Experimental Design

Experiments were conducted in the laboratory of the Sports Technology Institute (Loughborough University, UK). The infrared camera-based motion capture system Vicon MX T40 (Vicon Motion Systems, Oxford, UK) was used for testing, and provided resolutions of 2352 × 1728 pixels
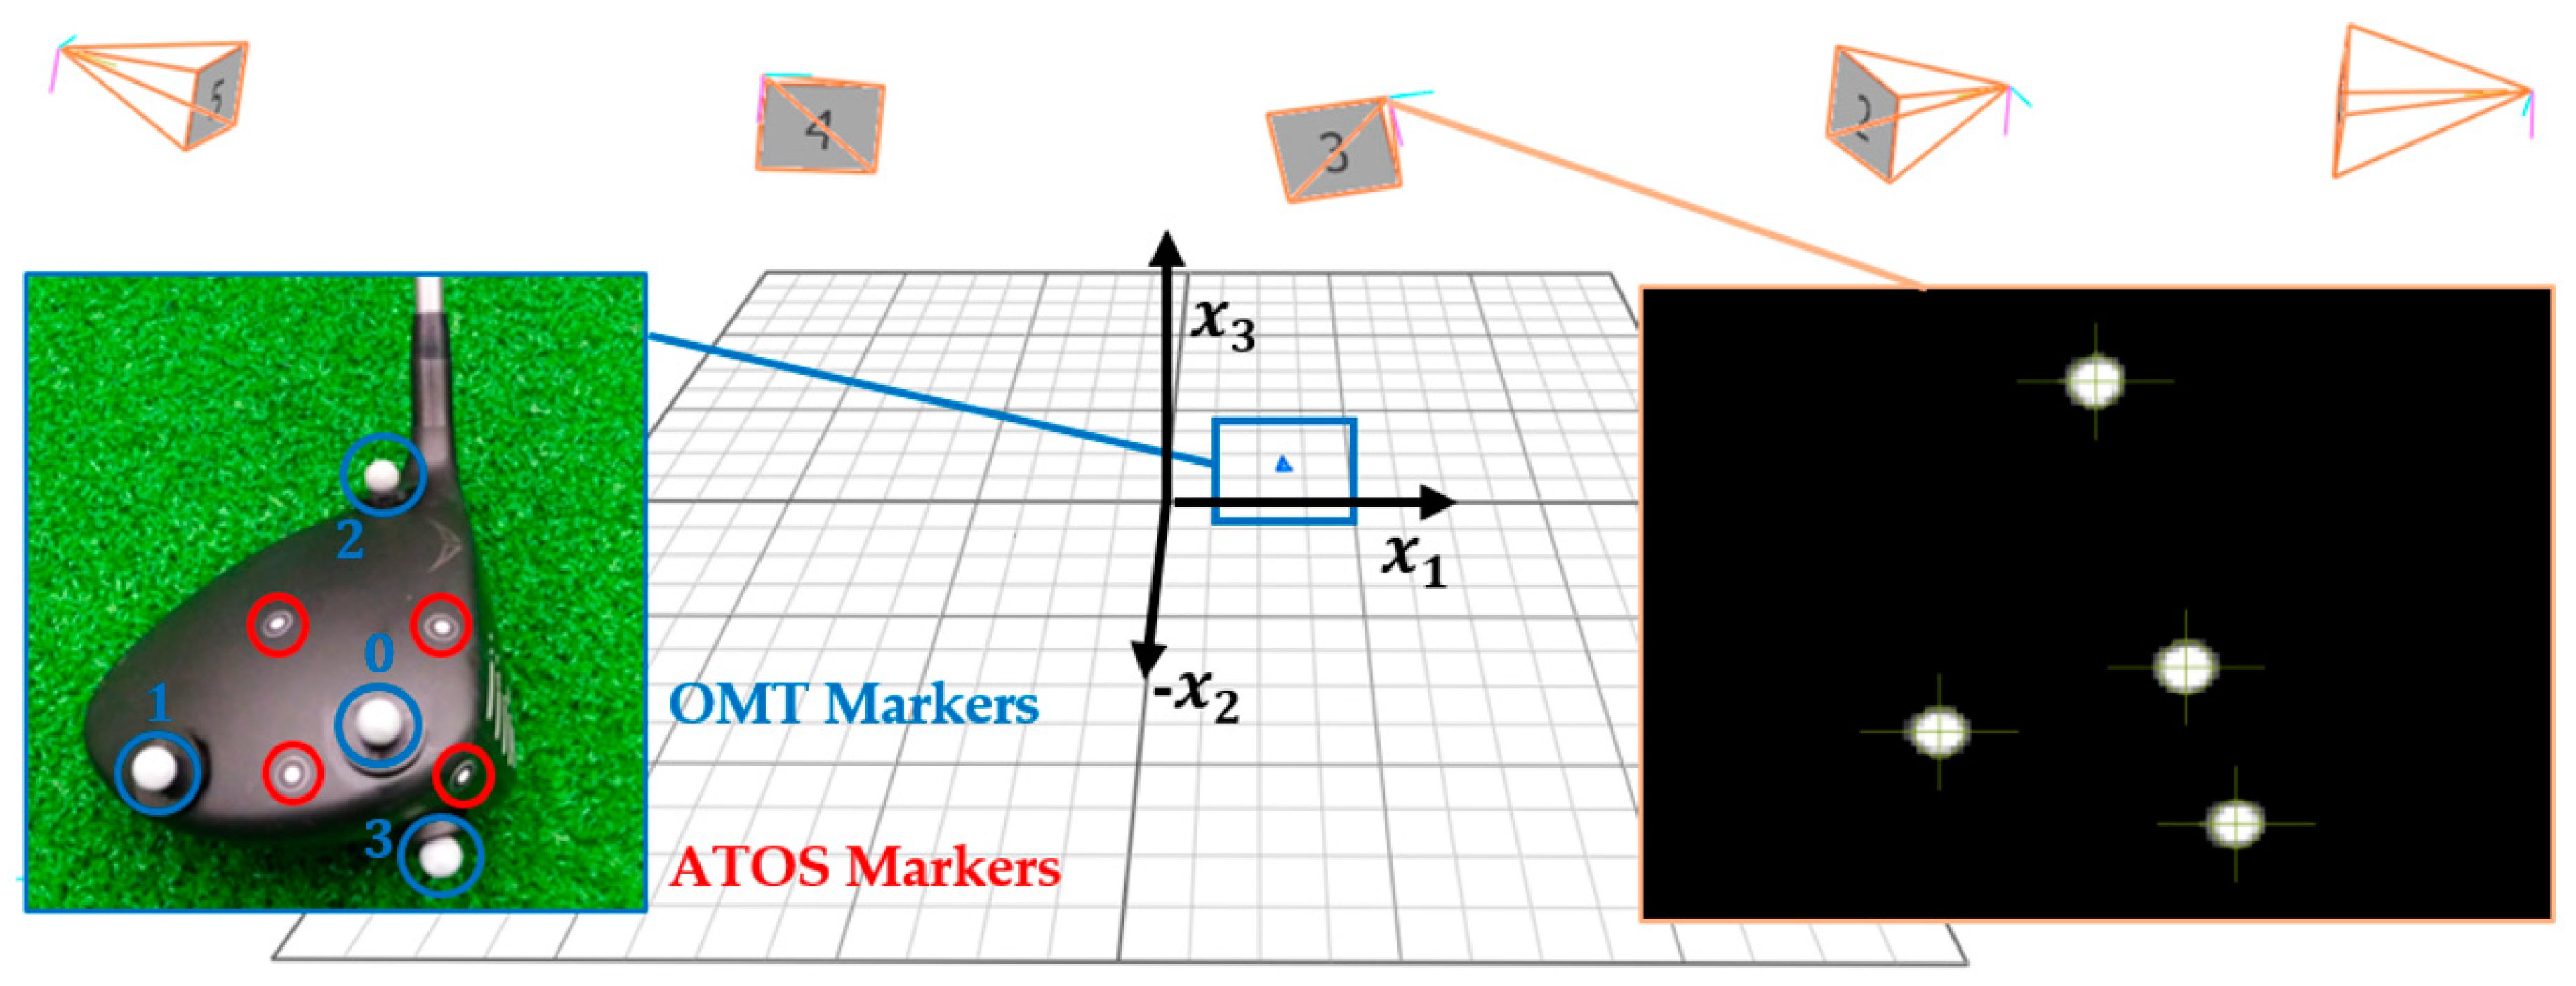
2 at a framerate of 370.37 fps. Five cameras were placed in line on an aluminium rail with the purpose of tracking a golf clubhead during delivery through the tee zone (see Figure 1 for camera setup). Vicon lenses with f = 18 mm were installed on the cameras and all apertures were set to f/2. Vicon Nexus (Version 2.9.2.118349h) was used to calibrate the camera system and to collect data. In the given OMT system, camera shutter duration could not be adjusted directly. Therefore, to prevent blurring of images at high clubhead speeds, a low exposure time was set for the cameras. This was achieved by setting a high framerate together with a reduced strobe duration (‘Strobe Intensity’ = 0.5) of the infrared strobe ring [5]. The experiments were conducted during night in order to keep the light conditions constant and minimise the effect of ambient daylight. To avoid distortion due to camera temperature changes, on each day of testing the system was allowed a one-hour warm-up at the same strobe intensity that was later used for calibration and capturing. A minimum of 4000 dynamic frames of the ‘Vicon Active Wand v2’ were captured to calibrate the full field-of-view of all cameras. All cameras provided residuals < 0.1 mm for ‘Image Errors’ and ‘World Errors’ [5]. The system origin was defined as the imaginary tee position, with the x 1 axis (Vicon x-axis) aligning with the imaginary target line, and x 3 (Vicon 
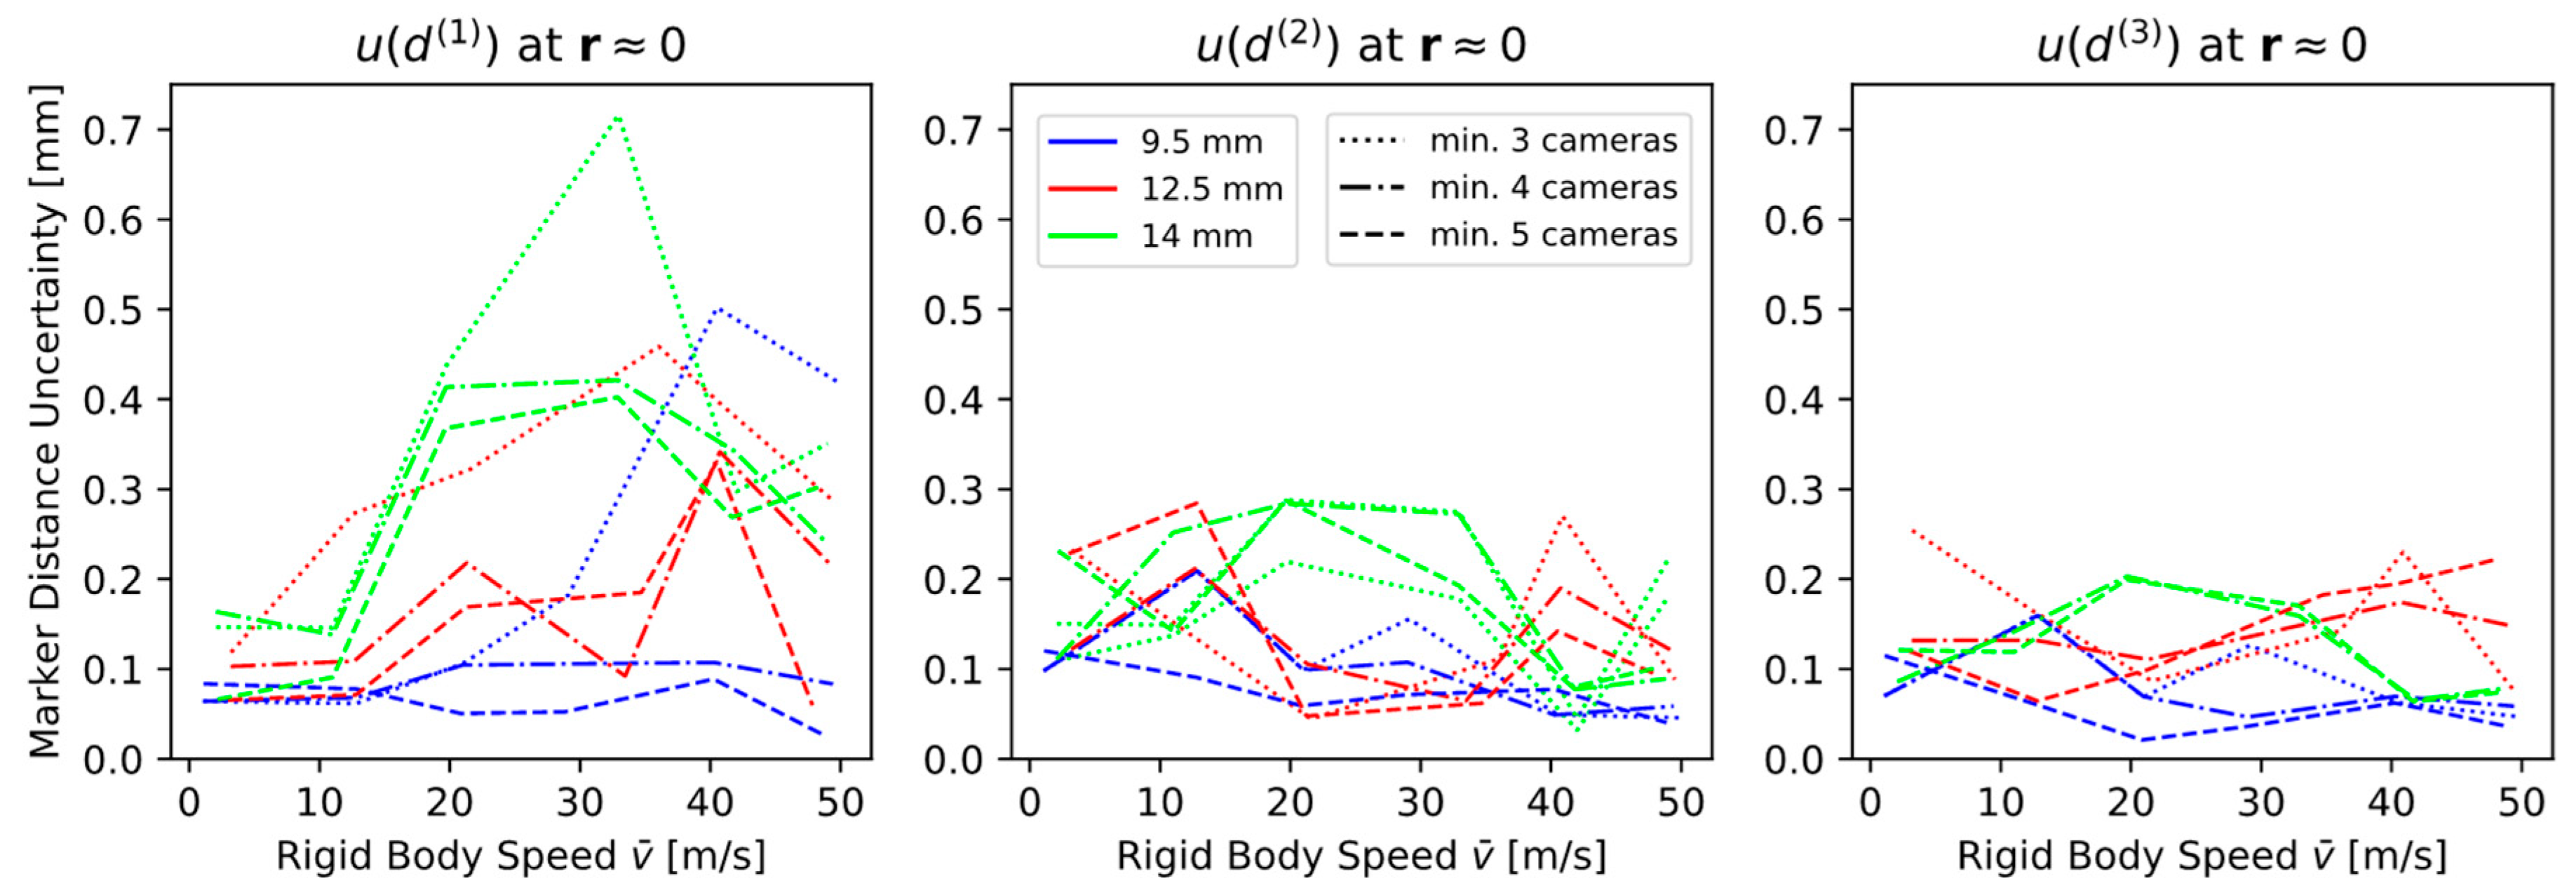
z-axis) aligning with the gravity vector. For marker reconstruction, the settings ‘Minimum Cameras to Start Trajectory’ and ‘Minimum Cameras to Continue Trajectory’ were adjusted equally to three, four or five in order to investigate their effect on tracking accuracy. Otherwise, default settings were used to automatically reconstruct and label the markers. Any mislabelling was corrected manually and no further post-processing, such as gap-filling or smoothing, was conducted.
A PING i20 driver clubhead, Ping Inc. (Phoenix, AZ, USA) was chosen as a suitable rigid body. Four marker locations on the clubhead were defined to approximate a local cartesian coordinate system, with the marker on the toe being the origin r ( 0 ) and the other three markers ( r ( 1 ) ,   r ( 2 ) ,     r ( 3 ) ) forming approximate orthogonal axes (see 
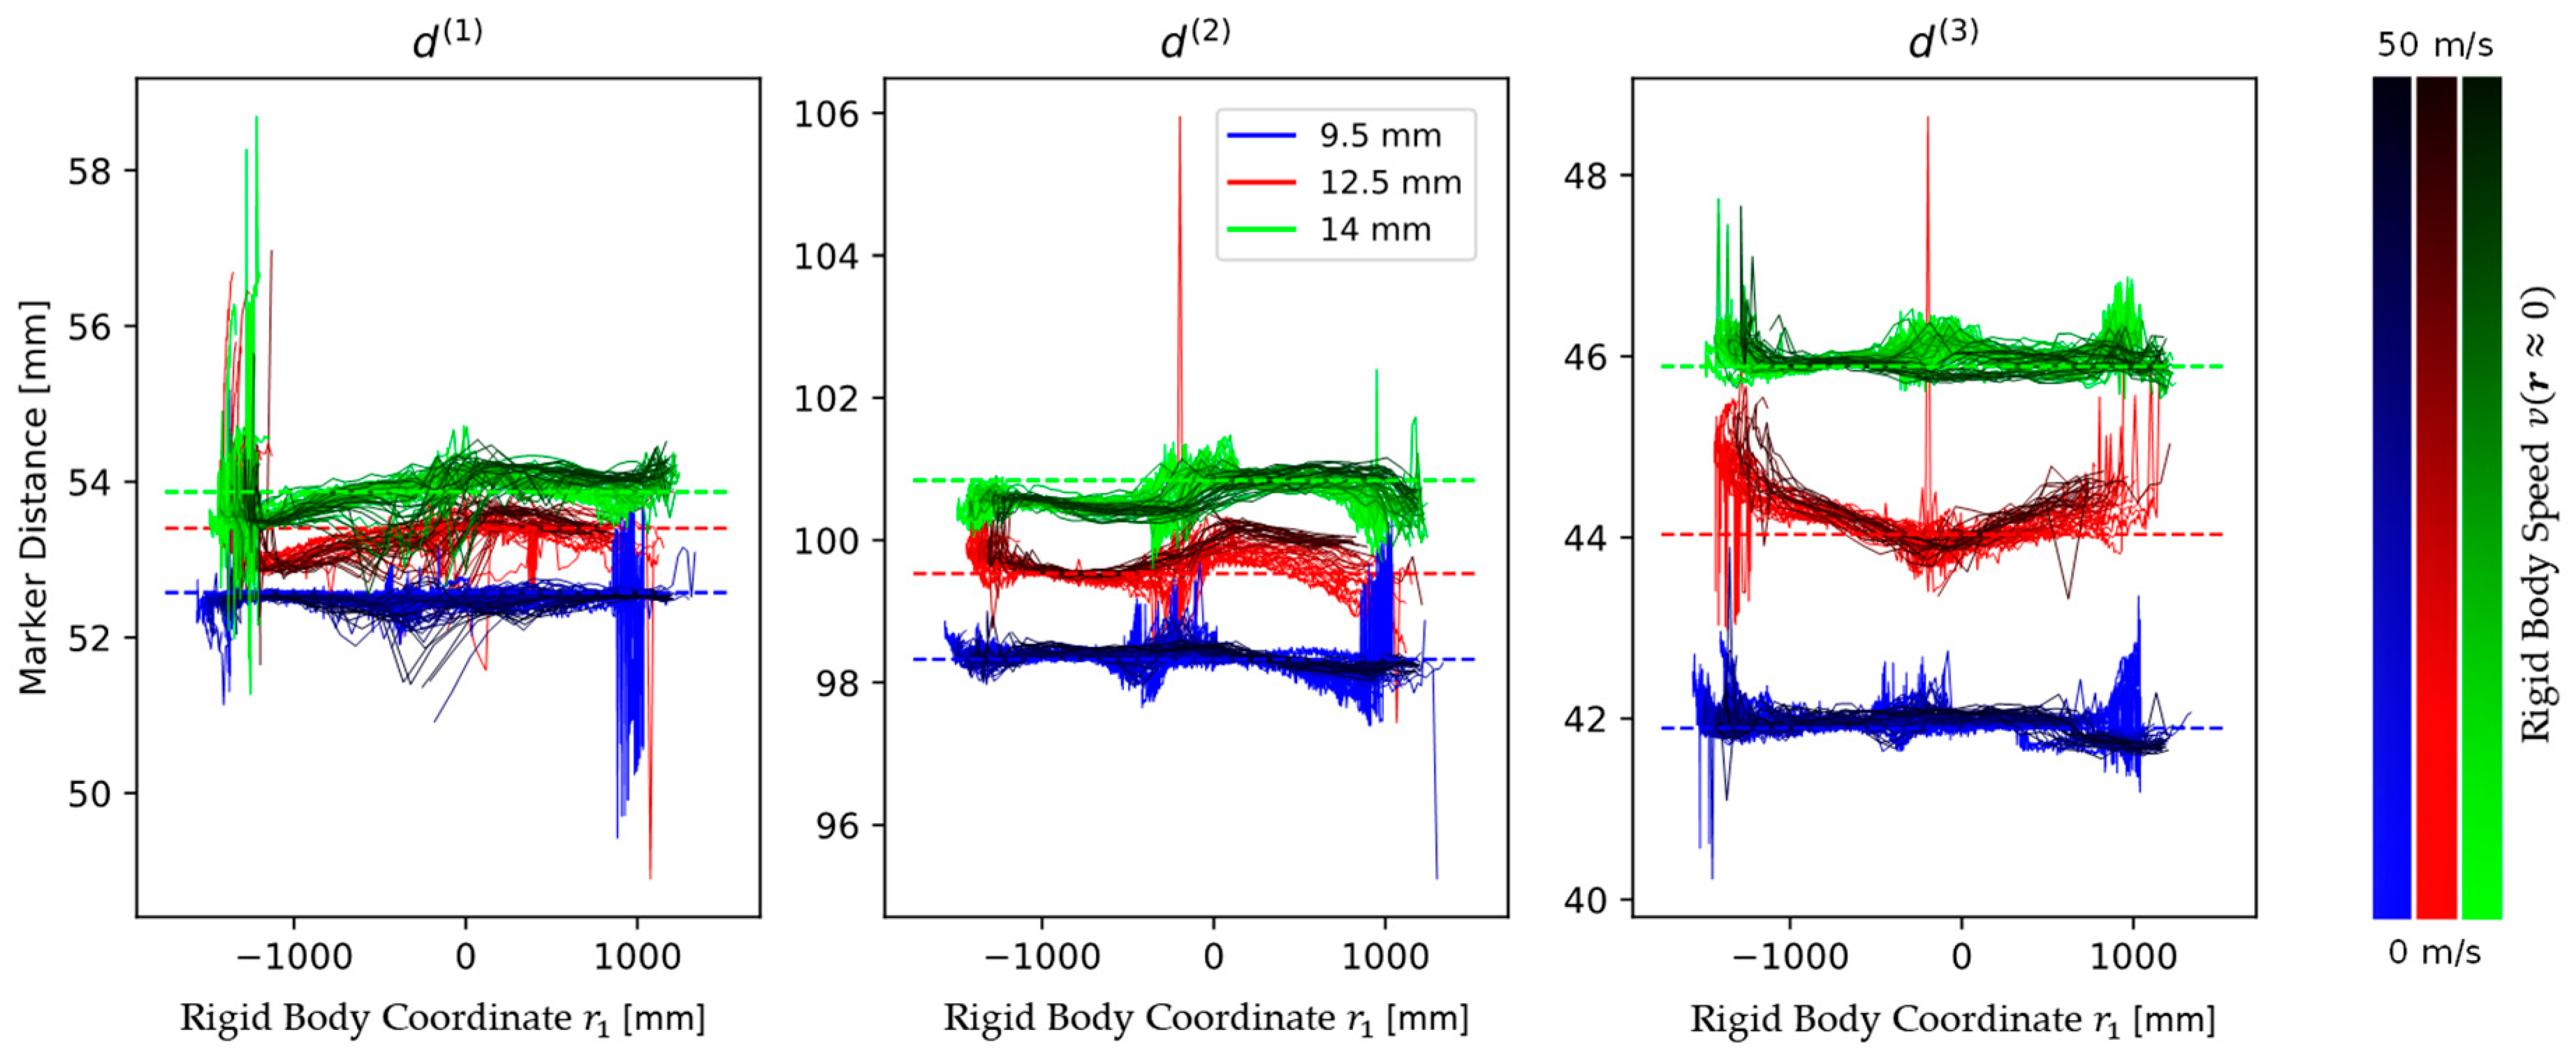
Figure 1). Angles between the axes were between 87.9° and 94.1°, with mean angle (SD) of 90.8° (2.2°). Distances between markers were varied to prevent the creation of equilateral triangles which may lead to mislabelling. Three commercially available retro-reflective marker sizes with nominal diameters of 9.5 mm, 12.5 mm and 14 mm were tested on three subsequent days. Measured diameters in the 2D camera images were between 5 pixels (9.5 mm, furthest camera) and 12 pixels (14 mm, closest camera). Before and after the test day, 10 repeated measures for the marker distances d ATOS ( j )   ( j = 1 3 ) relative to the origin marker r ( 0 ) were taken by the optical metrology system ATOS Core (GOM GmbH, Braunschweig, Germany). Four non-reflective flat markers (see Figure 1) were used for aligning the 3D scans taken with the ATOS system. OMT measures of the distances d OMT ( j ) were obtained before and after each trial from one second of OMT data for the static rigid body positioned around the OMT system origin.
Each test day, an amateur golfer (handicap 16) performed 60 swings, 10 swings for each targeted swing speed of: 2, 10, 20, 30, 40 and 50 m/s. The rigid body trajectory r and velocity ( v = | d r /   d t | ) were calculated as an average of the four marker positions r ( k ) ,   k = 0 3 . Measured swing speeds at the tee position were on average (SD): 2.2 (0.8), 10.2 (3.3), 19.9 (1.6), 33.6 (3.5), 41.6 (2.0) and 48.3 (2.7) m/s. Note that r does not represent a meaningful point on the club head, but ensured that the mathematical contributions of all marker trajectories were equal. The first rigid body coordinate r 1 was considered a representative scale for the clubhead path in the lower half of the swing, allowing the comparison of error behaviour throughout the swing at different speeds.

2.2. Statistical Analysis

Consider the positions of four fixed markers on a rigid body in 3D space, r ( k ) with k = 0 3 . Distances between the four markers, d ( j ) = | d ( j ) | = | r ( j ) r ( 0 ) | with j = 1 3 , are defined relative to the reference marker r ( 0 ) . The error propagation formula for type-A uncertainties [6] can be applied to the uncertainty in distance measures,
u ( d ( j ) ) 2 = i = 1 3 ( d ( j ) r i ( j )   · u ( r i ( j ) ) ) 2 + i = 1 3 ( d ( j ) r i ( 0 )   · u ( r i ( 0 ) ) ) 2  
with     ( d ( j ) r i ( j ) ) 2 = ( d ( j ) r i ( 0 ) ) 2 = ( r i ( j ) r i ( 0 ) ) 2 d ( j ) 2     .
For each j , one error propagation equation according to (1) and (2) can be constructed. In the resulting system of three equations, all four positions r ( k ) , all three distances d ( j ) , and uncertainty in distances u ( d ( j ) ) , are considered as knowns, as they can be measured. The 12 uncertainty components u ( r i ( k ) ) are unknown and sought to be found. Under the assumption that all points on the rigid body are tracked with the same component-wise uncertainty, u ( r i ( k ) ) = u ( r i ( l ) ) = : u ( r i )     i = 1 3 ,     k = 0 3 ,     l = 0 3 , the degrees of freedom of the problem reduces from 9 (12 unknowns minus 3 equations) to 0 (3 unknowns minus 3 equations), and hence can be solved. Together with equation (2), the problem simplifies to the equation system,
u ( d ( j ) ) 2 = 2 d ( j ) 2 i = 1 3 ( r i ( j ) r i ( 0 ) ) 2 · u ( r i ) 2 with   j = 1 . . 3 .
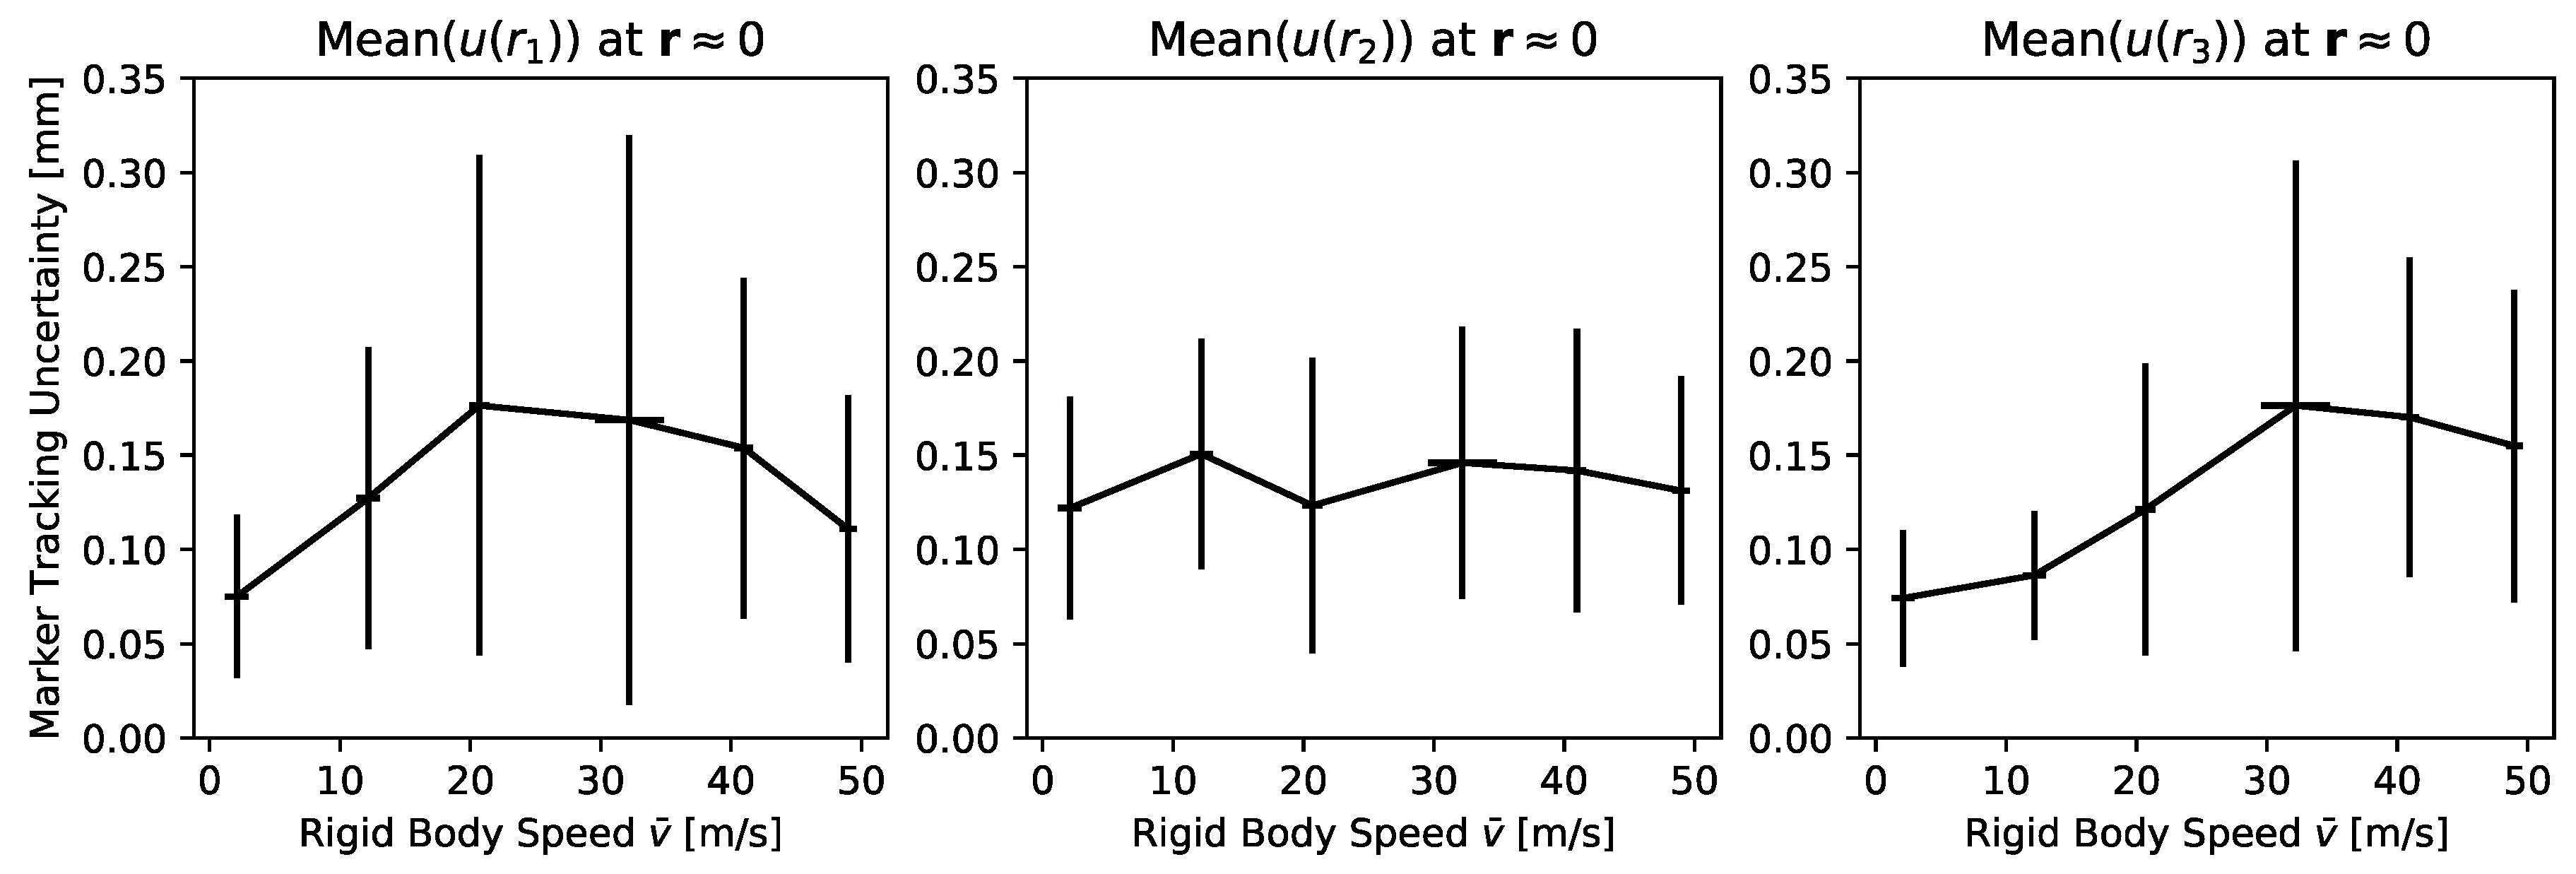
Note that orthogonality is not a requirement for the distance vectors d ( j ) formed by the four markers. However, it may increase the validity of the method. As marker tracking uncertainty changes along spatial coordinates, in a dynamic scenario u ( d ( j ) ) cannot be calculated from subsequent frames. Therefore, u ( d ( j ) ) needs to be calculated across a sample with the same expectation value. In this case, within a set of trials of equal target swing speed, the frames closest to the origin (tee position) were picked and u ( d ( j ) ) was defined as the standard deviation (SD) of d ( j ) . The equation system (3) was solved numerically for every trial using a least-squares method. The boundaries of accepted solutions for u ( r i ) were set from 1 µm to 10 mm, which was necessary to avoid non-physical solutions, such as complex or negative u ( r i ) . Solutions at the boundaries were discarded as they were considered as biased. Due to the resulting data gaps in the solutions of u ( r i ) , the investigation of OMT system settings was conducted by means of the marker distance uncertainty u ( d ( j ) ) . Paired t-tests were conducted with a significance level of p = 0.05 to identify optimal OMT system settings. From the marker tracking uncertainty components u ( r i ) , mean and SD were calculated across trials of equal target speed. Pearson’s r was calculated to assess the correlation of marker tracking uncertainty with marker speed.

3. Results

3.1. Static Validation

Mean distances measured by ATOS before each test day are given in Table 1 and compared to the OMT distances, calculated as the average of static pre-swing measurements across all trials. The OMT distance measures before and after each trial were not significantly different (p > 0.05). The results show that the standard deviations (SD) in distance measures between ATOS and OMT are of the same order, and hence, the static OMT measures offer sufficient reliability to be considered as reference values for dynamic measurements. SD of OMT distance measurements in d ( 2 ) -direction are higher than in d ( 1 ) and d ( 3 ) -direction, which is likely due to camera perspective errors. Bias between the two measurement systems was between −0.53 mm and +0.25 mm.

3.2. Dynamic Measurements of Marker Distances

The distance measures d ( j ) from all dynamic trials are plotted over r 1 in Figure 2 for the three different marker sizes. The darkness of the lines indicates the rigid body speed at tee position v ( r 0 ) : light colours correspond to low velocities, dark colours to high velocities. Marker distance measures in all three axes change in the magnitude of 1 mm depending on the rigid body position. The highest deviations from the static reference values (dashed) were observed when the rigid body approached the boundaries of the capture volume ( | r | > 1 m). Throughout the swings, distance measures changed in patterns which are specific for each axis and each marker size. The displayed data is based on reconstructions from a minimum of three cameras. Reconstructions for four and five cameras showed similar dependencies, with lower deviations to the reference value and fewer outliers.

3.3. Optimising OMT System Settings

The uncertainty of marker distance measures was assessed by calculating SD of trials with equal target swing speeds. The three marker distance uncertainties are illustrated as a function of mean rigid body speed v ¯ around the OMT system origin, in Figure 3. Graphs were created for the three different marker sizes (identified by different colours), and for different number of cameras used for reconstruction (identified by the different line styles). Marker diameters of 9.5 mm produced significantly lower mean uncertainties than 12.5 mm (p = 1.6∙× 10−4) and 14 mm (p = 5∙× 10−5). Using more cameras for reconstruction significantly decreased mean uncertainties (p < 0.026). In this specific application of tracking club delivery with the present OMT system, using 9.5 mm markers with min. five cameras for reconstruction will produce the lowest uncertainties, regardless of speed.

3.4. Effect of Rigid Body Speed on Marker Tracking Uncertainty

The average OMT uncertainty across all tested system settings is displayed as a function of mean rigid body speed v ¯ for the three rigid body components r 1 ,   r 2 and r 3 , in Figure 4. Mean marker tracking uncertainty is positively correlated with mean rigid body speed in all three axes. The correlation with rigid body speed is weakly positive for mean u ( r 1 ) and u ( r 2 ) (r = 0.37 and r = 0.23) and strongly positive for u ( r 3 ) (r = 0.89).

4. Discussion

The comparison of distance measures between an optical metrology system and the OMT system proved the repeatability of the OMT system in measuring static rigid bodies. The dynamic testing revealed a strong dependency of measurement error on the position in the capture volume, which coincides with the findings of a static OMT validation study [4]. Different patterns found during dynamic measurements may be caused by day-to-day differences in the camera calibration. Large errors (>1 mm) were observed when the set of cameras tracking a marker changed, for example, if, from one frame to the next, a marker disappears in one or more cameras. Consequently, the 3D reconstruction of the marker is based on a different set of cameras than in the previous frame. An analogue effect occurs when a marker appears in a camera image. From the three marker sizes tested, the smallest diameter (9.5 mm) produced the lowest uncertainties. This may be explained by partial marker occlusions: until a marker is entirely hidden to one camera, a part of the marker still reflects light back to the sensor, which then creates a bias to the original marker centroid. The bigger the marker is, the higher the induced bias can be. It is therefore advised to reduce the marker size as far as the camera resolution allows for proper reconstruction. The influence of both effects, marker (dis-)appearance and partial marker occlusion, may be minimised by increasing the number of cameras per capture volume. A higher total number of cameras would therefore yield lower OMT uncertainty [6]. With the given set of five cameras, mean OMT uncertainty can be decreased by increasing the minimum number of cameras in the reconstruction settings. This, however, comes with the risk of creating data gaps in situations where markers are occluded in one or more camera views. For applications with maximum target speeds lower than the here tested 50 m/s, it is recommended to increase the exposure time (‘Strobe Intensity’), and to lower the camera lens apertures, in order to increase the depth of field.

5. Conclusions

In this paper, a method to estimate 3D marker tracking uncertainty for high-speed applications has been introduced. The proposed method can be applied to any sporting or general movement. By tracking a four-marker rigid body, OMT uncertainty can be assessed component-wise by measuring inter-marker distances. Uncertainty measures can then be used to optimise system parameters such as camera positioning, the number of cameras used for marker reconstruction, and marker size, depending on the marker speed present. The results indicate that, regardless of marker speed, five cameras and 9.5 mm markers are the best configuration for the purpose of tracking clubhead delivery with the given OMT system, producing mean uncertainties of less than 0.13 mm.

Funding

The authors gratefully acknowledge the financial support of the Engineering and Physical Sciences Research Council (EPSRC) Centre for Doctoral Training in Embedded Intelligence under grant reference EP/L014998/1 and Ping Inc. for their support and input to this research.

Conflicts of Interest

The authors declare no conflict of interest.

References

  1. Merriaux, P.; Dupuis, Y.; Boutteau, R.; Vasseur, P.; Savatier, X. A study of vicon system positioning performance). Sensors 2017, 17, 1591. [Google Scholar] [CrossRef] [PubMed]
  2. Windolf, M.; Götzen, N.; Morlock, M. Systematic accuracy and precision analysis of video motion capturing systems-exemplified on the Vicon-460 system. J. Biomech. 2008, 41, 2776–2780. [Google Scholar] [CrossRef] [PubMed]
  3. Eichelberger, P.; Ferraro, M.; Minder, U.; Denton, T.; Blasimann, A.; Krause, F.; Baur, H. Analysis of accuracy in optical motion capture—A protocol for laboratory setup evaluation. J. Biomech. 2016, 49, 2085–2088. [Google Scholar] [CrossRef] [PubMed]
  4. Aurand, A.M.; Dufour, J.S.; Marras, W.S. Accuracy map of an optical motion capture system with 42 or 21 cameras in a large measurement volume. J. Biomech. 2017, 58, 237–240. [Google Scholar] [CrossRef] [PubMed]
  5. Vicon Motion Systems Ltd. Vicon Nexus User Interface Guide. 2018. Available online: https://docs.vicon.com/display/Nexus28/Vicon+Nexus+User+Guide (accessed on 1 October 2019).
  6. JCGM, WG1. GUM 1995 with minor corrections. Evaluation of measurement data—Guide to the expression of uncertainty in measurement. Int. Organ. Stand. Geneva 2008, 50, 134. [Google Scholar]
Figure 1. Marker reconstruction in optical marker tracking (OMT). (left) Physical OMT markers (0–3) on the clubhead. (right) Camera image of grayscale blobs with fitted centroids. Middle: Triangulation of the marker centroids from all cameras for reconstruction in three-dimensional space. Flat markers required for reference measurements with optical metrology system (ATOS).
Proceedings 49 00072 g001
Figure 2. Marker distance as function of the rigid body coordinate r 1 demonstrates the dependency of marker tracking accuracy on the position in 3D space. r = 0 corresponds to the imaginary tee position. Mean rigid body speed is indicated by the darkness of the lines. Reference distances from static OMT measures, d OMT ( j ) added as dashed lines.
Proceedings 49 00072 g002
Figure 3. Uncertainties of marker distances plotted as function of mean rigid body speed for different marker sizes (colours) and numbers of cameras used for reconstruction (lines).
Proceedings 49 00072 g003
Figure 4. The three components of mean marker tracking uncertainty plotted versus mean rigid body speed. Error bars represent ±1 SD both, horizontally and vertically. All variables evaluated at imaginary tee position.
Proceedings 49 00072 g004
Table 1. Repeated measures of OMT marker distances on the rigid body in resting position by ATOS and Vicon. All values presented as Mean in mm (SD in µm).
Marker ⌀ATOS SystemOMT System 1
Nominal d A T O S ( 1 ) d A T O S ( 2 ) d A T O S ( 3 ) d O M T ( 1 ) d O M T ( 2 ) d O M T ( 3 )
9.552.467 (22)98.234 (28)41.731 (22)52.576 (29)98.321 (41)41.896 (27)
12.553.591 (10)99.943 (22)44.563 (15)53.405 (29)99.533 (34)44.034 (23)
1453.821 (05)100.611 (24)45.635 (16)53.872 (31)100.840 (33)45.887 (18)
1 OMT markers reconstructed using a minimum of 3 cameras.
Publisher’s Note: MDPI stays neutral with regard to jurisdictional claims in published maps and institutional affiliations.

