Proceeding Paper

Quantifying Topographical Changes in Muscle Activation: A Statistical Parametric Mapping Approach †

by
Patricio A. Pincheira
1,*,
Eduardo Martinez-Valdes
2,
Carlos De la Fuente
3,4,
Felipe Palma
3,
Oscar Valencia
3,
Gunther Redenz
3 and
Rodrigo Guzman-Venegas
3
1
School of Human Movement and Nutrition Sciences, The University of Queensland, Brisbane 4067, Australia
2
Centre of Precision Rehabilitation for Spinal Pain, University of Birmingham, Birmingham B152TT, UK
3
School of Physiotherapy, Universidad de los Andes, Santiago 7550000, Chile
4
Carrera de kinesiología, Departamento de Ciencias de la Salud, Facultad de Medicina, Pontificia Universidad Católica de Chile, Santiago 7820436, Chile
*
Author to whom correspondence should be addressed.
Presented at the 13th conference of the International Sports Engineering Association, Online, 22–26 June 2020.
Proceedings 2020, 49(1), 71; https://doi.org/10.3390/proceedings2020049071
Published: 15 June 2020

Abstract

:
Regional changes in muscle activation occur at different contraction intensities. These changes can be observed with activity maps created with high-density electromyography (HDEMG). When quantifying these changes, statistical parametric mapping (SPM) is a neuroimaging technique that may be used to perform statistical analyses with high sensitivity and spatial resolution. The aim of this study was to identify regional changes in muscle activation at different contraction intensities, comparing SPM and the HDEMG barycenter (centroid). Twelve participants performed plantar flexion isometric contractions at 20%, 40%, and 60% of the maximal voluntary contraction (MVC), while HDEMG was recorded from the medial gastrocnemius. An SPM repeated measures ANOVA design revealed specific mediolateral and cephalocaudal changes in muscle activation with increasing contraction intensities, which were not clearly detected by the variation in the barycenter coordinates. Only SPM revealed statistically significant nonuniform changes in EMG amplitude between all increasing levels of muscle activation.

1. Introduction

In fields of study such as biomechanics, neurophysiology, and sport sciences, it is of interest to be able to investigate muscular activation patterns as they provide an indication of the mechanisms of muscle control utilized by the central nervous system. One method to explore activation across a large region of muscle during exercise or before/after training interventions is to use high-density electromyography (HDEMG). This technique uses a large number of electrodes in a grid arrangement, allowing regional changes in muscle activation to be observed. When quantifying these changes, discrete descriptors like the barycenter (i.e., center of mass, centroid) of the HDEMG signals are commonly used. Unfortunately, this measure has poor spatial resolution and low sensitivity to quantify changes in topographical distribution of muscle activity. While previous research has addressed this issue by attempting better ways to quantify changes in muscle activation [1], these new approaches are usually very complex in nature and their results are hard to extrapolate to a nonexpert audience. As such, a better and clearer method to estimate topographical changes in muscle activity is still necessary.
Statistical parametric mapping (SPM) is an approach that may be used to assess topographical changes in muscle activity with high sensitivity and spatial resolution [2]. SPM is an extensively reviewed and robust statistical technique developed in neuroimaging and refers to the construction and assessment of spatially extended statistical processes used to test hypotheses about functional imaging data [2]. With SPM, the topographical muscle activation maps (which are commonly used as a mere graphical representation) can be used directly as the substrate of the statistical analyses. As such, the interpretation of the results is straightforward and with more spatial resolution as the statistical inference is processed at a pixel-level on the same dimension of the topographical maps.
The aim of this study was to identify regional changes in medial gastrocnemius (MG) HDEMG activity at different contraction intensities using SPM and the barycenter method. This muscle was selected because it presents a spatially inhomogeneous activation at different force levels, as shown by studies using magnetic resonance imaging (MRI) [3]. We hypothesized that SPM will detect negligible changes in the distribution of activated areas with increasing contraction intensities, information that will not be completely reflected in the variation of the barycenter coordinates.

2. Materials and Methods

2.1. Participants and Experimental Protocol

Twelve healthy and sedentary men (age 23 ± 3 years, mass 71 ± 11 kg, height 173 ± 6 cm) were included in this study. Participants were excluded if they had any pre-existing lower limb injuries or surgery within the past five years. The experimental protocol was approved by the local ethics committee, and all participants gave written informed consent before participating in the study. For data collection, the participants were lying prone with their right (dominant) foot firmly strapped to a custom-made metal structure holding a load cell that recorded muscle force. Maximal and submaximal isometric ankle plantar flexions were exerted with the ankle at neutral position (0°). Three maximal voluntary contractions (MVCs) were performed over a period of 5 s, with 3 min of rest between trials. The highest MVC value was used as a reference for the definition of the submaximal force level. Five minutes after the MVC measurement, following a few familiarization trials at low force levels, the participants performed two submaximal isometric ankle plantar flexion contractions at 20%, 40%, and 60% of MVC, while HDEMG was collected from the MG. The contractions were sustained for 20 s, and the duration of the ascending/descending ramps was 2 s for 20% (16 s of hold-phase), 4 s for 40% (12 s of hold-phase), and 6 s for 60% (8 s of hold-phase) of MVC. Four minutes of rest was allowed between submaximal trials. In each trial, the subjects received visual feedback of their plantar flexor force, which was displayed as a trapezoid on a computer screen.

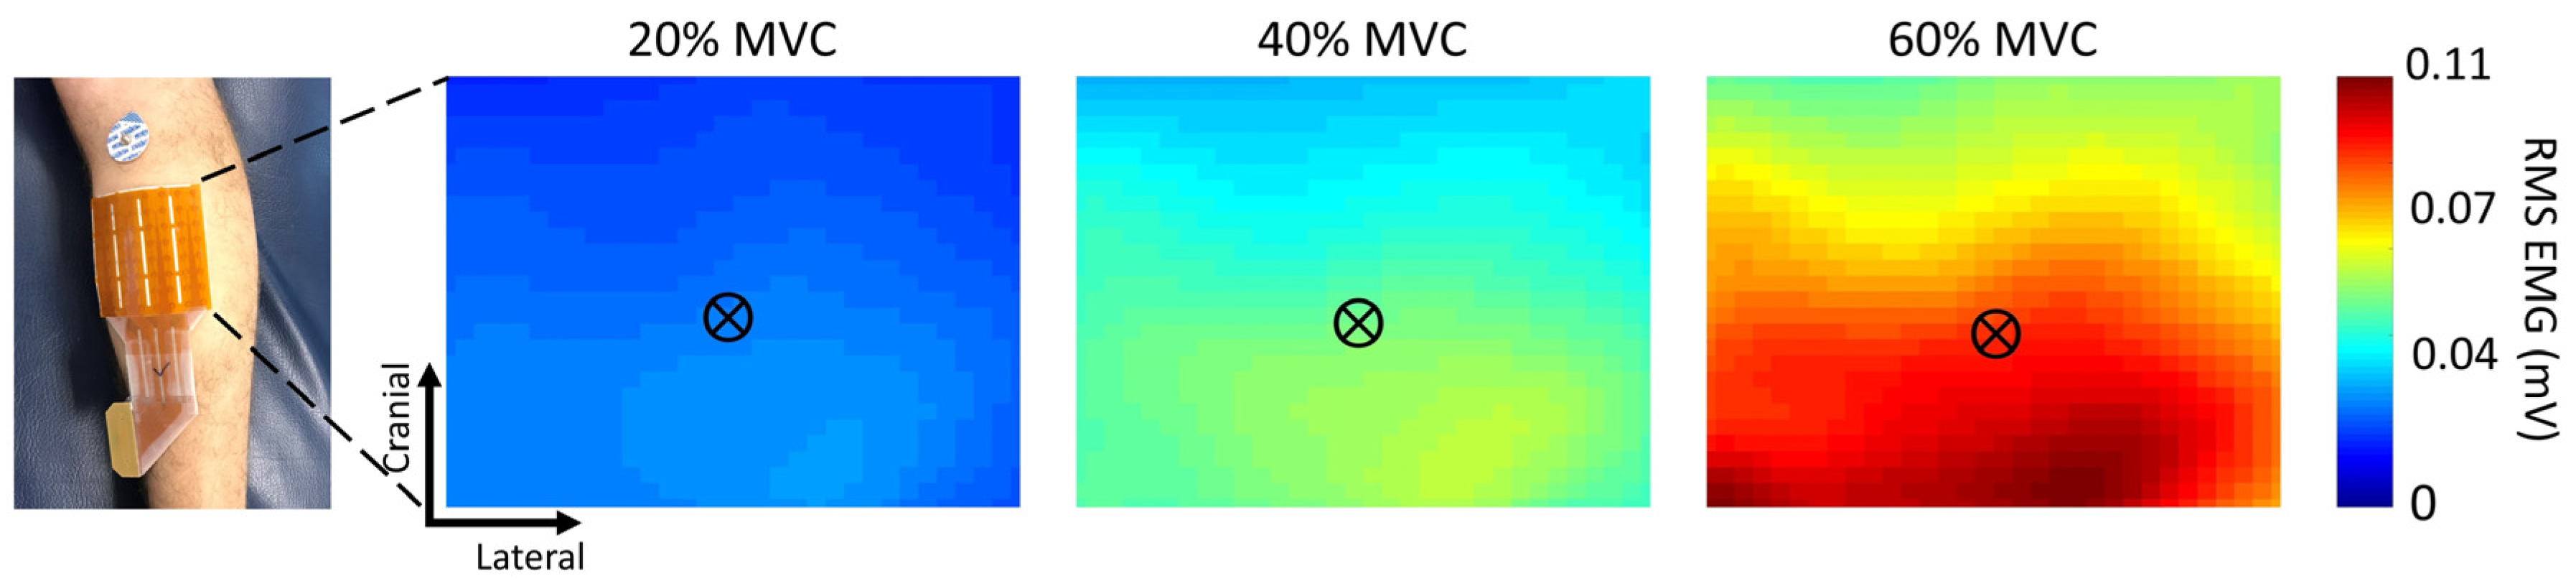
2.2. HDEMG Recordings

Surface EMG was recorded in monopolar derivation with one two-dimensional semidisposable adhesive grid (SPES Medica, Salerno, Italy). The HDEMG grid contained 64 equally spaced electrodes organized in 8 rows and 8 columns (GR10MM0808, OT Bioelettronica, Torino, Italy; 1 mm diameter, 10 mm inter-electrode distance). After skin preparation (shaving, abrasion, and water), the electrode cavities were filled with conductive paste (SPES Medica, Salerno, Italy). The electrode grid was then positioned on the MG between 87% and 100% of the line between the medial side of the Achilles tendon insertion and the medial side of the popliteal cavity. Reference electrodes were positioned at the left and right ankles. Force and EMG signals were sampled at 2048 Hz and converted to digital data by a 12-bit analogue-to-digital converter (EMG-USB 2, 256-channel EMG amplifier, OT Bioelettronica, Torino, Italy, 3 dB, bandwidth 10–500 Hz). EMG signals were amplified in the monopolar configuration by a factor of 500 for 20% and 40% of MVC and by a factor of 200 for 60% of MVC to avoid EMG signal saturation.

2.3. Data Processing

HDEMG signals were processed as follows. In MATLAB (The Mathworks Inc., Natick, MA, USA), from the two submaximal contractions at each level, the attempt with better signal quality (selected by visual inspection of the raw signals) was selected. From the chosen trial, single-differential EMGs were computed by taking the algebraic difference of consecutive pairs of monopolar EMGs in the cephalocaudal direction. Thus, 56 differentiated signals along the longitudinal line of the muscle were obtained from 64 electrodes (i.e., 7 rows and 8 columns). The signals were then band-pass filtered with a 2nd order Butterworth filter (zero phase distortion; 20–400 Hz cut-off frequencies). The central five seconds from the recorded hold-phase were considered for further analysis, and the root mean square (RMS) amplitude for each channel was calculated using a window length of 500 ms without overlapping. Then, the RMS values were averaged to obtain a significative figure for each differentiated channel.
At this point in the data processing, we calculated the X- and Y-axis coordinates of the barycenter of the signals. As commonly defined in the literature elsewhere, this barycenter represents the mean location of the distribution of EMG activity in the space of the electrode matrix. In algebraic terms:
X m m = 1 A   i = 1 n a i x i
where X is the horizontal (mediolateral) location in millimeters of the electrode matrix barycenter, A is the total activity of the electrode matrix, n is the number of channels (56 after differentiation), ai is the activity of the ith channel, and xi is the horizontal position in millimeters of the ith channel. Similarly, for the vertical direction:
Y m m = 1 A   i = 1 n a i y i
where Y is the vertical (cephalocaudal) location in millimeters of the electrode matrix barycenter, A is the total activity of the electrode matrix, n is the number of channels (56 after differentiation), ai is the activity of the ith channel, and yi is the vertical position (in millimeters) of the ith channel. The origin of the coordinate system for the barycenter estimation (X and Y axis) was located at the bottom left corner of the electrode matrix when located on the skin of the participants.

2.4. HDEMG Topographical Map Processing

To create the topographical maps, the RMS values of the signal matrix were interpolated in 2D by a factor of 4 to create a map of 32 × 28 pixels (70 × 60 mm) over the area of the electrode grid. Thus, 3 images (one for each submaximal level) were obtained for each participant. At this point, the HDEMG maps were transformed into the Neuroimaging Informatics Technology Initiative (NIfTI-1) format according to previously reported guidelines [4]. Then, images were smoothed with a full width at half maximum (FWHM) kernel of 12 × 12 mm2 [5] with MATLAB-based SPM12 software (http://www.fil.ion.ucl.ac.uk/spm/). This process is necessary to accommodate spatial variability (i.e., small anatomical differences) between subjects [5].

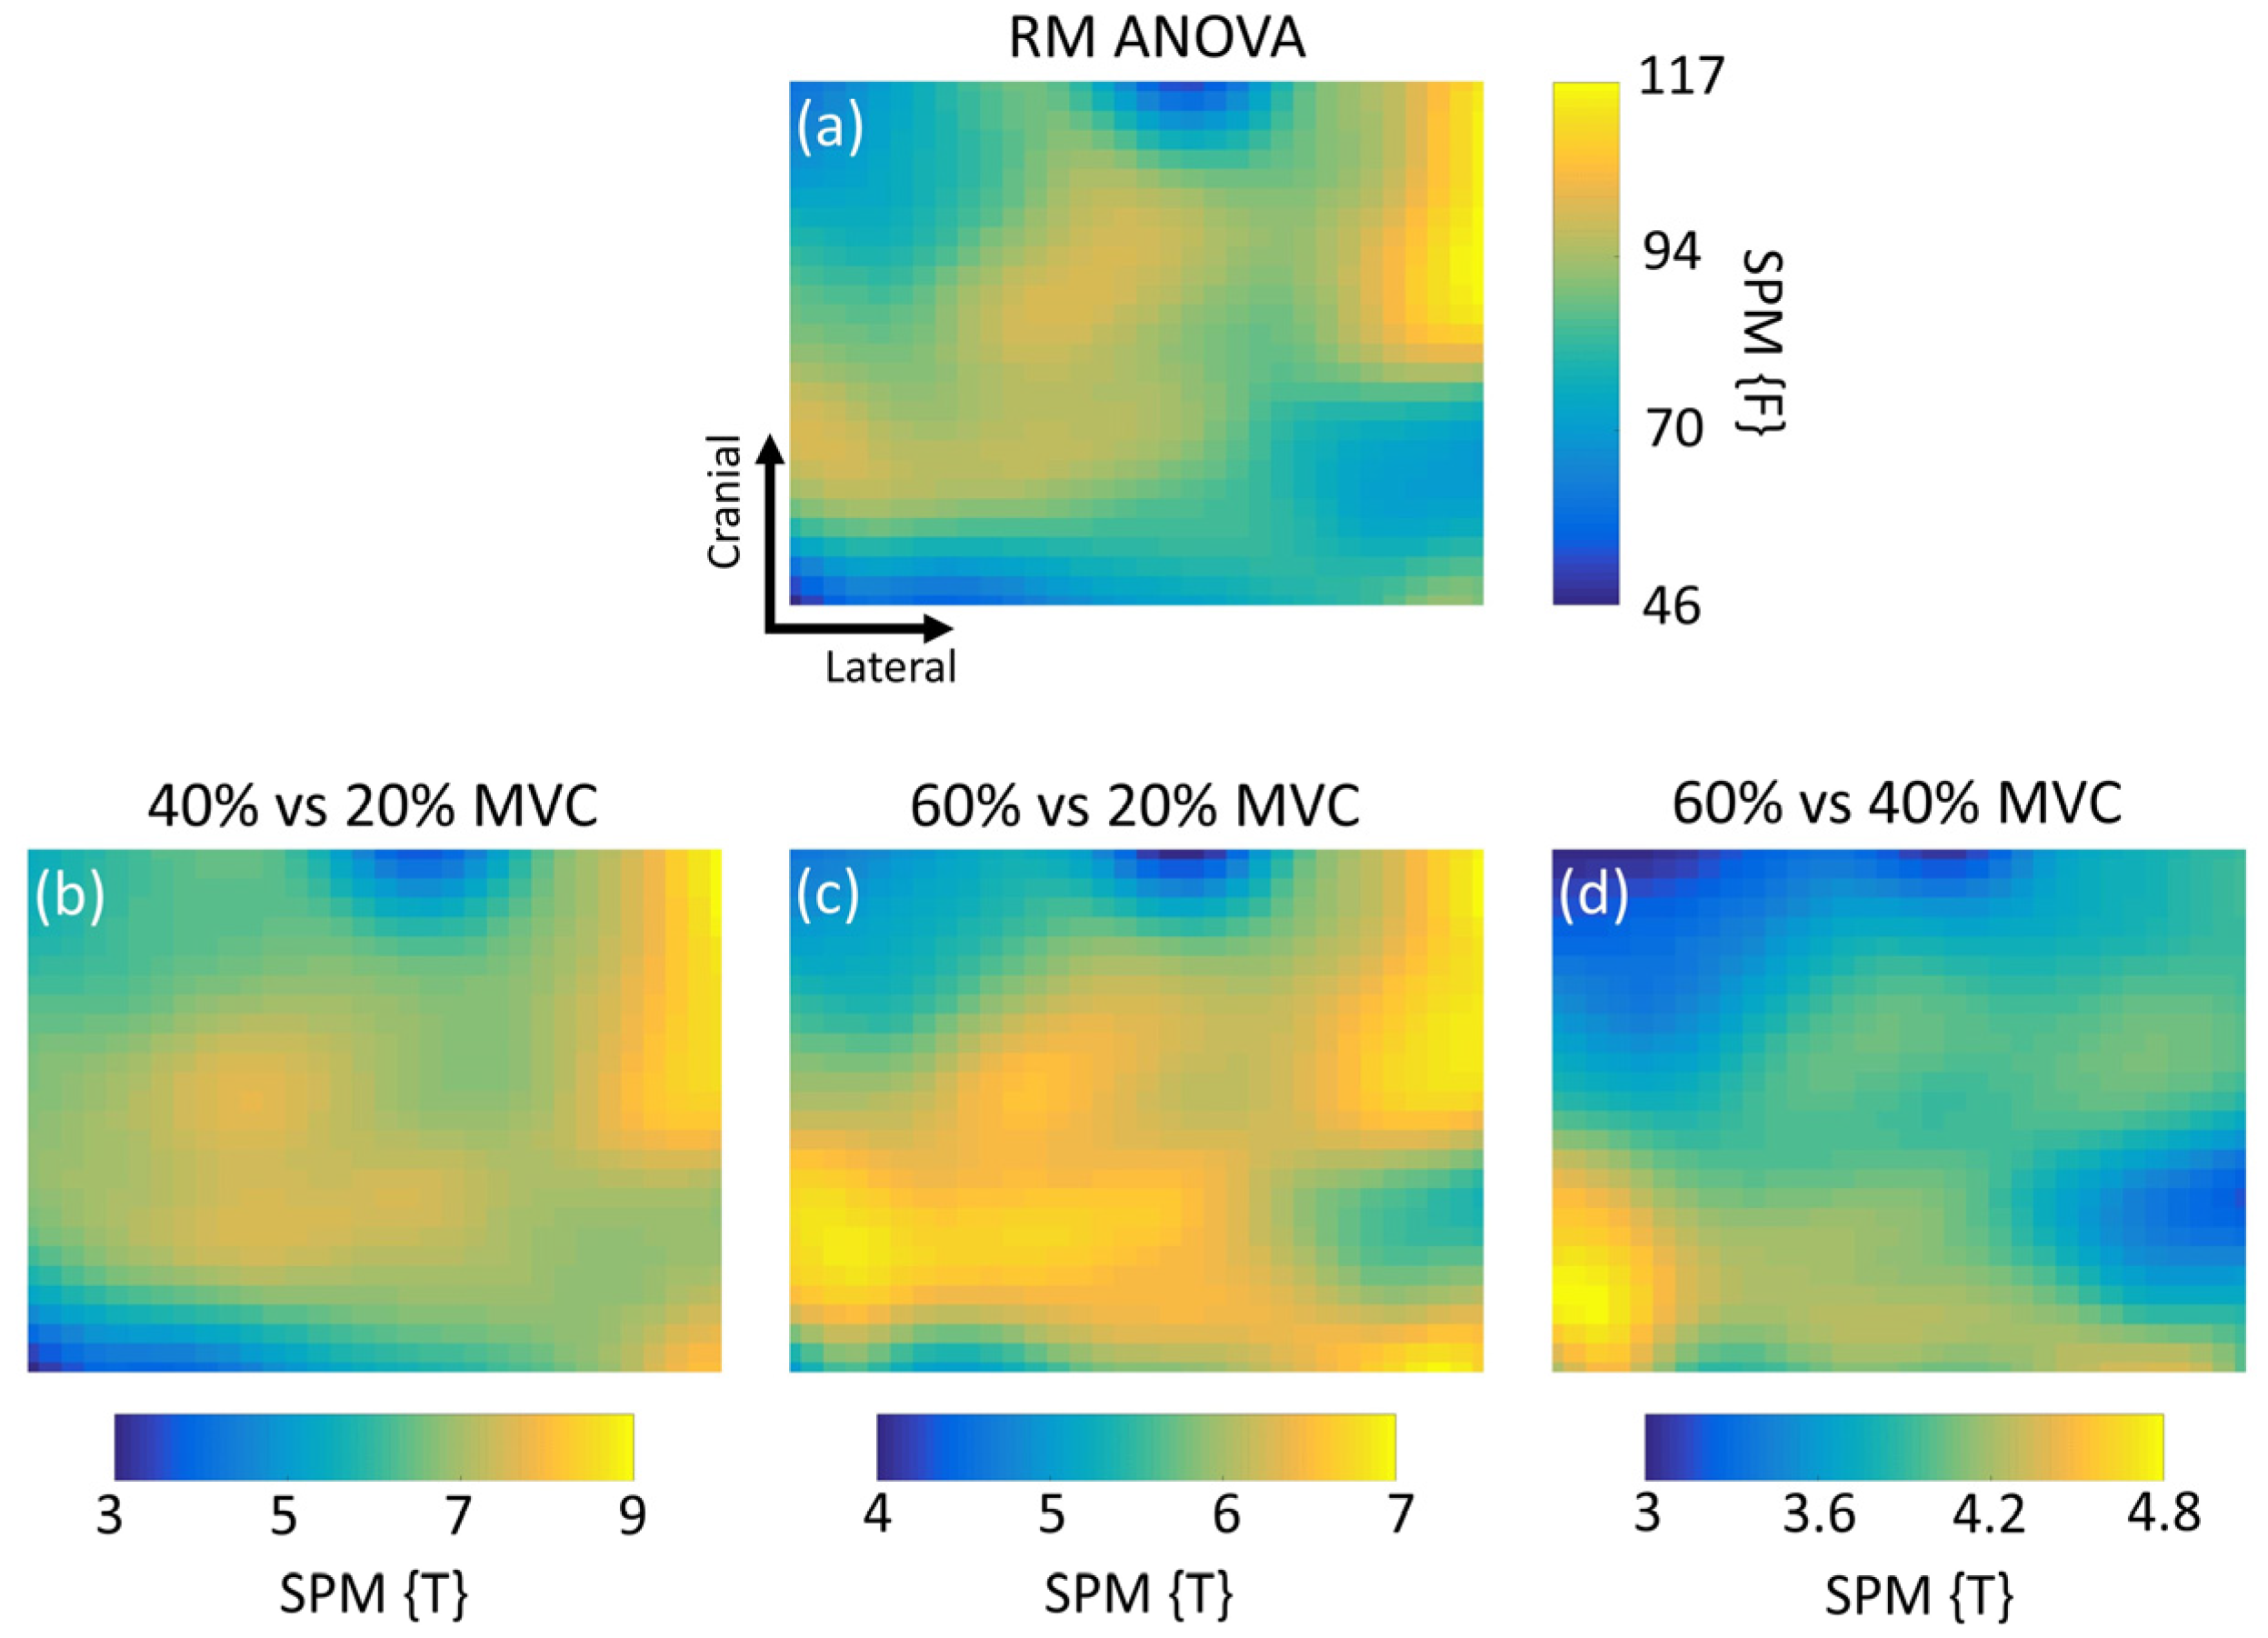
2.5. SPM and Statistical Analysis

To assess the effect of contraction intensity on EMG distribution, we employed SPM [2,5]. SPM conducts pixel-level statistical tests using random field theory to make probabilistic conclusions based on the random behavior of the 2D observational unit [2,5]. The result is a continuous statistical map that can be viewed in the context of the original HDEMG images. We performed an SPM repeated measures (RM) one-way ANOVA (F statistics) to establish the effect of contraction intensity (20%, 40%, and 60% of MVC) on muscle activity distribution. Then, a priori planned post-hoc comparisons (T statistics) were incorporated into the design to compare the different intensities. The result of the analysis was a summary statistic image (F and T distribution maps) with the same size as the topographical maps (70 × 60 mm). In all statistical maps and tables, SPM inference is reported at a threshold of p < 0.05, with family-wise error (FWE) correction for multiple comparisons [5] based on random field theory. SPM image analysis was performed using SPM12 software.
A RM one-way ANOVA was used to estimate the effect of contraction intensity on the calculated coordinates of the barycenter (-x and -y). Then, a priori planned post-hoc comparisons (Bonferroni) were used to compare the different contraction intensities. GraphPad Prism v8 (GraphPad Software, Inc., La Jolla, CA, USA) was used to perform these analyses, with a level of significance set at α < 0.05.

3. Results

Group mean activation maps and the calculated barycenter are presented in Figure 1 for the three submaximal levels evaluated.
The RM one-way ANOVA analysis revealed a significant vertical change in the position of the barycenter (F(1.6, 18) = 6.8, p < 0.05) but not in the horizontal direction (F(1.3, 14) = 1.6, p = 0.23). The mean position of the barycenter coordinates can be seen in Figure 1 and were (x ± SD, y ± SD) 20% (34.9 ± 2.7, 28.1 ± 1), 40% (35.3 ± 2.3, 27 ± 2.1), and 60% (34.5 ± 2.2, 26 ± 2.1). The post-hoc tests showed that this displacement was significant towards the caudal direction (p = 0.02) only when comparing 20% vs. 60% of MVC.
SPM revealed statistically significant nonuniform changes in EMG amplitude at increasing levels of muscle activation (Figure 2). The thresholding maps revealed that muscle activity increased in entire area of the image when contraction level was increased from 20% to 40% and 60% of MVC (Figure 2a) as all of the 896 pixels contained in the maps exceeded the significance threshold (Table 1). At 40% of MVC, activity was concentrated in the lateral cranial side of the image (Figure 2b), where the coordinates of the peak difference (local maxima) were found (Table 1). When the level was increased to 60% of MVC, muscle activity was kept on the lateral cranial side of the image, and another area with peak intensity was added on the medial–caudal side of the image (Figure 2c). This was further supported by the comparison between 60% and 40% of MVC (Figure 2d), where we could distinguish the coordinates of the local maxima closer to the origin of the image (Table 1).

4. Discussion

The aim of this study was to compare qualitatively two different methods to estimate changes in the distribution of muscle activation. The main finding of our research was that SPM was able to detect more detailed (pixel-level) information of the regional changes in HDEMG with increased MVC levels in comparison to RM ANOVA using barycentre coordinates. Similar to previous studies using MRI in the MG muscle, our results show that with increasing contraction intensities, muscle activity distribution changes within the mediolateral and proximal–distal directions [3]. This information was not identified by the changes in the barycenter coordinates, where only a minimal (~2 mm) but significant shift towards the caudal direction was detected. Moreover, the barycenter method was unable to identify muscle activity changes when comparing 20% vs. 40% of MVC. As barycenter coordinate shifts occur due to large changes in the distribution of muscle activation, it fails to detect variations when the EMG amplitude is relatively homogenous over a large portion of the registration area. In this regard, detecting the channels with the largest RMS values with respect to the total number of channels prior the calculation of the barycenter [6] may help to improve the sensibility of this technique in identifying changes in muscle activation.
SPM has several advantages for the analysis of topographical maps of EMG activity [2,5]: (i) Random field theory is used to conduct statistical inference topologically, adjusting p-values considering the fact that neighboring electrodes (i.e., pixels) in the map are not independent by virtue of continuity in the original data. (ii) Statistical results are straightforward to interpret as common tests (T-tests, F-tests) generalize to SPM and are conducted on a field-wide basis. This provides a clear advantage over other methods used to analyze changes in regional activation of EMG activity [1], and as mentioned before, it overcomes barycenter calculations, which can be a source of discretization-induced bias. (iii) It is well documented and has been extensively validated. (iv) Although it may appear complex in nature, the existence of various open-source SPM packages (e.g., SPM12, Wellcome Trust Centre for Neuroimaging, University College London) and a wide community of users (e.g., https://www.fil.ion.ucl.ac.uk/spm/support/) promotes an easier implementation of the technique.

5. Conclusions

SPM revealed with high resolution and sensitivity statistically significant nonuniform changes in EMG amplitude at increasing levels of MG muscle activation. SPM is of relatively simple implementation and poses clear advantages in comparison to barycenter calculation when analyzing topographical changes of EMG activity.

Acknowledgments

This research was funded by Fondo de Ayuda a la Investigación (FAI: INV-IN-2017-01), Universidad de los Andes, Santiago, Chile.

Conflicts of Interest

The authors declare no conflict of interest.

References

  1. Gallina, A.; Garland, S.J.; Wakeling, J.M. Identification of regional activation by factorization of high-density surface EMG signals: A comparison of Principal Component Analysis and Non-negative Matrix factorization. J. Electromyogr. Kinesiol. 2018, 41, 116–123. [Google Scholar] [CrossRef] [PubMed]
  2. Friston, K.J.; Ashburner, J.T.; Kiebel, S.J.; Nichols, T.E.; Penny, W.D. Statistical Parametric Mapping: The Analysis of Functional Brain Images; Elsevier: Amsterdam, The Netherlands, 2011; ISBN 978-0-08-046650-7. [Google Scholar]
  3. Kinugasa, R.; Kawakami, Y.; Sinha, S.; Fukunaga, T. Unique spatial distribution of in vivo human muscle activation. Exp. Physiol. 2011, 96, 938–948. [Google Scholar] [CrossRef] [PubMed]
  4. NIfTI-1 Data Format—Neuroimaging Informatics Technology Initiative. Available online: https://nifti.nimh.nih.gov/nifti-1/ (accessed on 18 October 2019).
  5. Litvak, V.; Mattout, J.; Kiebel, S.; Phillips, C.; Henson, R.; Kilner, J.; Barnes, G.; Oostenveld, R.; Daunizeau, J.; Flandin, G.; et al. EEG and MEG Data Analysis in SPM8. Comput. Intell. Neurosci. 2011, 2011, 852961. [Google Scholar] [CrossRef] [PubMed]
  6. Vinti, M.; Gracies, J.-M.; Gazzoni, M.; Vieira, T. Localised sampling of myoelectric activity may provide biased estimates of cocontraction for gastrocnemius though not for soleus and tibialis anterior muscles. J. Electromyogr. Kinesiol. 2018, 38, 34–43. [Google Scholar] [CrossRef] [PubMed]
Figure 1. Mean topographic maps of medial gastrocnemius activity at different contraction intensities (N = 12), presented with their respective barycenter. The maps (32 × 28 pixels) were created from the 56 root mean square (RMS) values using an interpolation factor of 4. The reference system at the bottom left corner of the image represents an example of the origin of each image (0,0), from where the barycenter (crossed black circle) coordinates were calculated.
Proceedings 49 00071 g001
Figure 2. Statistical parametric mapping (SPM) repeated measures (RM) one-way ANOVA inference images when comparing medial gastrocnemius high-density electromyography maps from contractions at different intensities. (a) Inference image for the SPM RM one-way ANOVA result; (bd) post-hoc inference images for comparisons between submaximal activity levels. For each inference image, the critical threshold for statistical significance at α = 0.05 is presented at the lower boundary of the color bar (dark blue). If the SPM ({F} or {T}) comparison crossed the threshold, the test statistic result is presented as a pixel (in the green-yellow range) in the image. Thus, pixels closer to the top boundary of the color scale (yellow) depict an area in the muscle where a larger EMG amplitude difference was found.
Proceedings 49 00071 g002
Table 1. SPM statistics when comparing topographic maps before and after repeated bouts of eccentric exercise.
Height Threshold 1KE 2PFWEcorr 3Test Statistic 4Peak Coordinates 5
RM ANOVAF = 3.7896<0.001F = 1176839
40% vs. 20%T = 2.8896<0.001T = 9.486856
60% vs. 20%T = 2.8896<0.001T = 7.066854
60% vs. 40%T = 2.8896<0.001T = 4.7729
1 Height threshold: calculated for p < 0.05, corrected for family-wise error rate; 2 KE: number of pixels that exceeded the significance threshold; 3 PFWEcorr: p-values corrected for family-wise error rate; 4 test statistic: the maximum T or F value obtained by the local maxima; 5 peak coordinates: position on the map (70 × 60 mm) in millimeters of the maximum value (x = lateral; y = cranial) (local maxima).
Publisher’s Note: MDPI stays neutral with regard to jurisdictional claims in published maps and institutional affiliations.

