Proceeding Paper

A Penetrometer for Quantifying the Surface Stiffness of Sport Sand Surfaces †

by
David V. Thiel
1,*,
Matthew T. O. Worsey
1,
Florian Klodzinski
1,2,
Nicholas Emerson
1,3 and
Hugo G. Espinosa
1
1
School of Engineering and Built Environment, Griffith University, Nathan, QLD 4111, Australia
2
SeaTech, École d’Ingénieurs, Université de Toulon, 83130 Toulon, France
3
School of Product Design, University of Canterbury, Christchurch 8041, New Zealand
*
Author to whom correspondence should be addressed.
Presented at the 13th conference of the International Sports Engineering Association, Online, 22–26 June 2020.
Proceedings 2020, 49(1), 64; https://doi.org/10.3390/proceedings2020049064
Published: 15 June 2020

Abstract

:
Sand sports include running, volleyball, soccer, beach flags, ironman, and fitness training. An increased amount of soft tissue injuries have been widely reported. A novel technique of determining the surface stiffness of beach sand in-situ used a simple drop-test penetrometer. The relationship between drop height and the depth of penetration squared was linear (Pearson’s correlation coefficient r2 > 0.92). The stiffness ratio between the soft dry sand and ocean-saturated wet sand compacted by eight hours of coastal water exposure was approximately seven, which was similar to previously reported stiffness measurements in a sand box. However, the absolute stiffness values were much smaller. While this technique was manually operated, an automatic system is postulated for future studies.

1. Introduction

In Australia, the Surf Lifesaving Association conducts competitions at the beach during the summer. There are a number of events that require running on sand. This has been reported to increase the risk of soft tissue injury [1], particularly in the mid-portion of the Achilles tendon [2,3], but also includes foot blisters for bare feet, excessive ankle flexion, etc. The beach events include:
  • the ‘iron man competition,’ which features four main disciplines in one race: swimming, board paddling, ski paddling, and running. For the running event, flags demark a course of approximately 150 m from wet to soft sand and back;
  • the beach flags event [4], which is a sand run of approximately 20 m in soft sand with competitors prone at the start;
  • the beach relay [4], which has six competitors in a team running a total distance of 90 m in soft sand;
  • the beach sprint [4], which has an approximate distance of 80 m;
  • beach volleyball [5], which has two players on soft dry sand;
  • beach soccer [6], which has five players on soft dry sand.
In mixed path running, the athletes adjust their leg stiffness to accommodate the change in ground reaction forces [7]. While variations in biomechanical processes are reported in a companion paper [8], the measurement of the surface stiffness is reported here.
While geotechnical engineers have used three dimensionally confined samples in the laboratory, penetrometer measurements used to establish the required depth of structural foundations in unconfined soils have a standard measure [9] but are less common. The technique is based on measuring the penetration resistance of soil to a 9 kg steel cone (angle of 30 degrees with diameter 20 ± 0.2 mm) dropped from a height of 0.5 m. The impact is repeated until the last penetration distance is less than 2 mm. Following this observation, an additional eight impacts are required. The penetration resistance is calculated as the total number of impacts required to produce a penetration depth of 300 mm.
As a beach represents an unconstrained surface, the structural foundation technique in [9] was used as the basis for the development of a simple alternative penetrometer for use in sand-based sports, where athletes’ feet typically penetrate less than 25 mm into the sand. This paper details the development and testing of the new penetrometer on both wet-compacted and dry sand. The measurements are important for monitoring surface uniformity for competitors, to report potentially sudden, dangerous changes in running conditions, and to explore ankle flexion on uneven and unpredictable surfaces.

2. Materials and Methods

A manually operated penetrometer was designed and constructed using the following guidelines:
(1)
the penetration depth should be similar to the penetration depth of a runner’s footprint;
(2)
the impact force per square area during contact should be similar to that from an average-sized runner;
(3)
the device should be easy to deploy and operate.
Assuming that the runner is an average-sized adult (weighing approximately 60 kg) with a vertical ground reaction from an elevation height of 20 mm, the force per unit area is approximately 750 kN/m2 for a foot contact area of 1.6 × 10⁻³ m2. A penetrometer with a circular cross section (radius 20 mm) has an equivalent pressure as if a 1 kg weight is dropped from a height of 0.5 m.
The penetrometer was constructed from a 2 m steel pipe (diameter 40 mm) with a closed end. A steel collar was welded to the pipe 0.35 m from the sealed end. The remaining length of pipe was marked into 0.1 m graduations. The total weight of the impactor was 7.82 kg. The pipe diameter was chosen to accommodate standard weights used in the sport of weight lifting. The clearance between the pipe’s outer dimensions and the weight’s inner dimensions was 4 mm radially and the penetrometer pipe was positioned vertically inside a PVC (Polyvinyl Chloride) sleeve using a spirit level. Two different weights were used in these tests: 1.25 kg and 5 kg for soft and hard sand, respectively. The range of heights was up to 0.8 m. The drop weight remained attached to the penetrometer after impact and so added to the total mass of the penetrometer.
The measurements followed the sequence:
  • the sand under test was smoothed on the surface to be horizontal (see Figure 1);
  • the end of the penetrometer was rested on the sand’s surface;
  • the penetrometer was oriented vertically;
  • the weight was raised to a fixed height and released;
  • the penetrometer was carefully removed from the sand and the depth of the indentation was measured.
The sequence was repeated for the same weight at different heights h at an adjacent location. The penetrometer was positioned vertically using a spirit level in two orthogonal locations. The pole orientation was maintained during the weight drop by using a PVC sleeve of a larger diameter (60 mm). After each weight drop, the indentation distance was measured and the penetrometer was moved to a new position and a new drop height was used. The experimental arrangement is shown in Figure 1.
Measurements were made on the two different sand surfaces during an outgoing tide immediately before low tide. The location was the Southport Spit, Gold Coast, Queensland, Australia. The area is a popular attraction for both local residents and international tourists.
The dry sand was located above the high-tide mark for the day and was relatively uniform but had been disturbed somewhat by foot traffic through the area. The wet sand was located close to the end of the wave run up the beach and had been covered in shallow water for more than 8 h before the measurements were made.
The measurements were repeated in several different locations where the surface was untouched. The quality of the linear relationships and the very large error spread in the final results were an indication of the variability of both the sand surface and the measurement technique.

Theory

The velocity of the weight at impact vw is given by:
v w = 2 g h
where g is the gravitational acceleration.
The velocity of the combined mass vm of the weight plus the penetrometer can be calculated using the conservation of momentum:
v m = m w v w ( m w + m p )
with the weight of the penetrometer pipe mp plus the weight mw.
The opposing force (braking force) F is calculated from the mechanical energy equation:
F s = 1 2 m w v m 2 = m w g h
where s is the penetration depth into the sand.
If the force F is a constant, plotting s versus h should be a straight line with slope:
s h = m w g F
The stiffness of the sand S [9] is defined by:
S = F s
Thus, it can be written:
S = m w g h s 2
Clearly, the stiffness is proportional to the inverse penetration depth squared.

3. Results

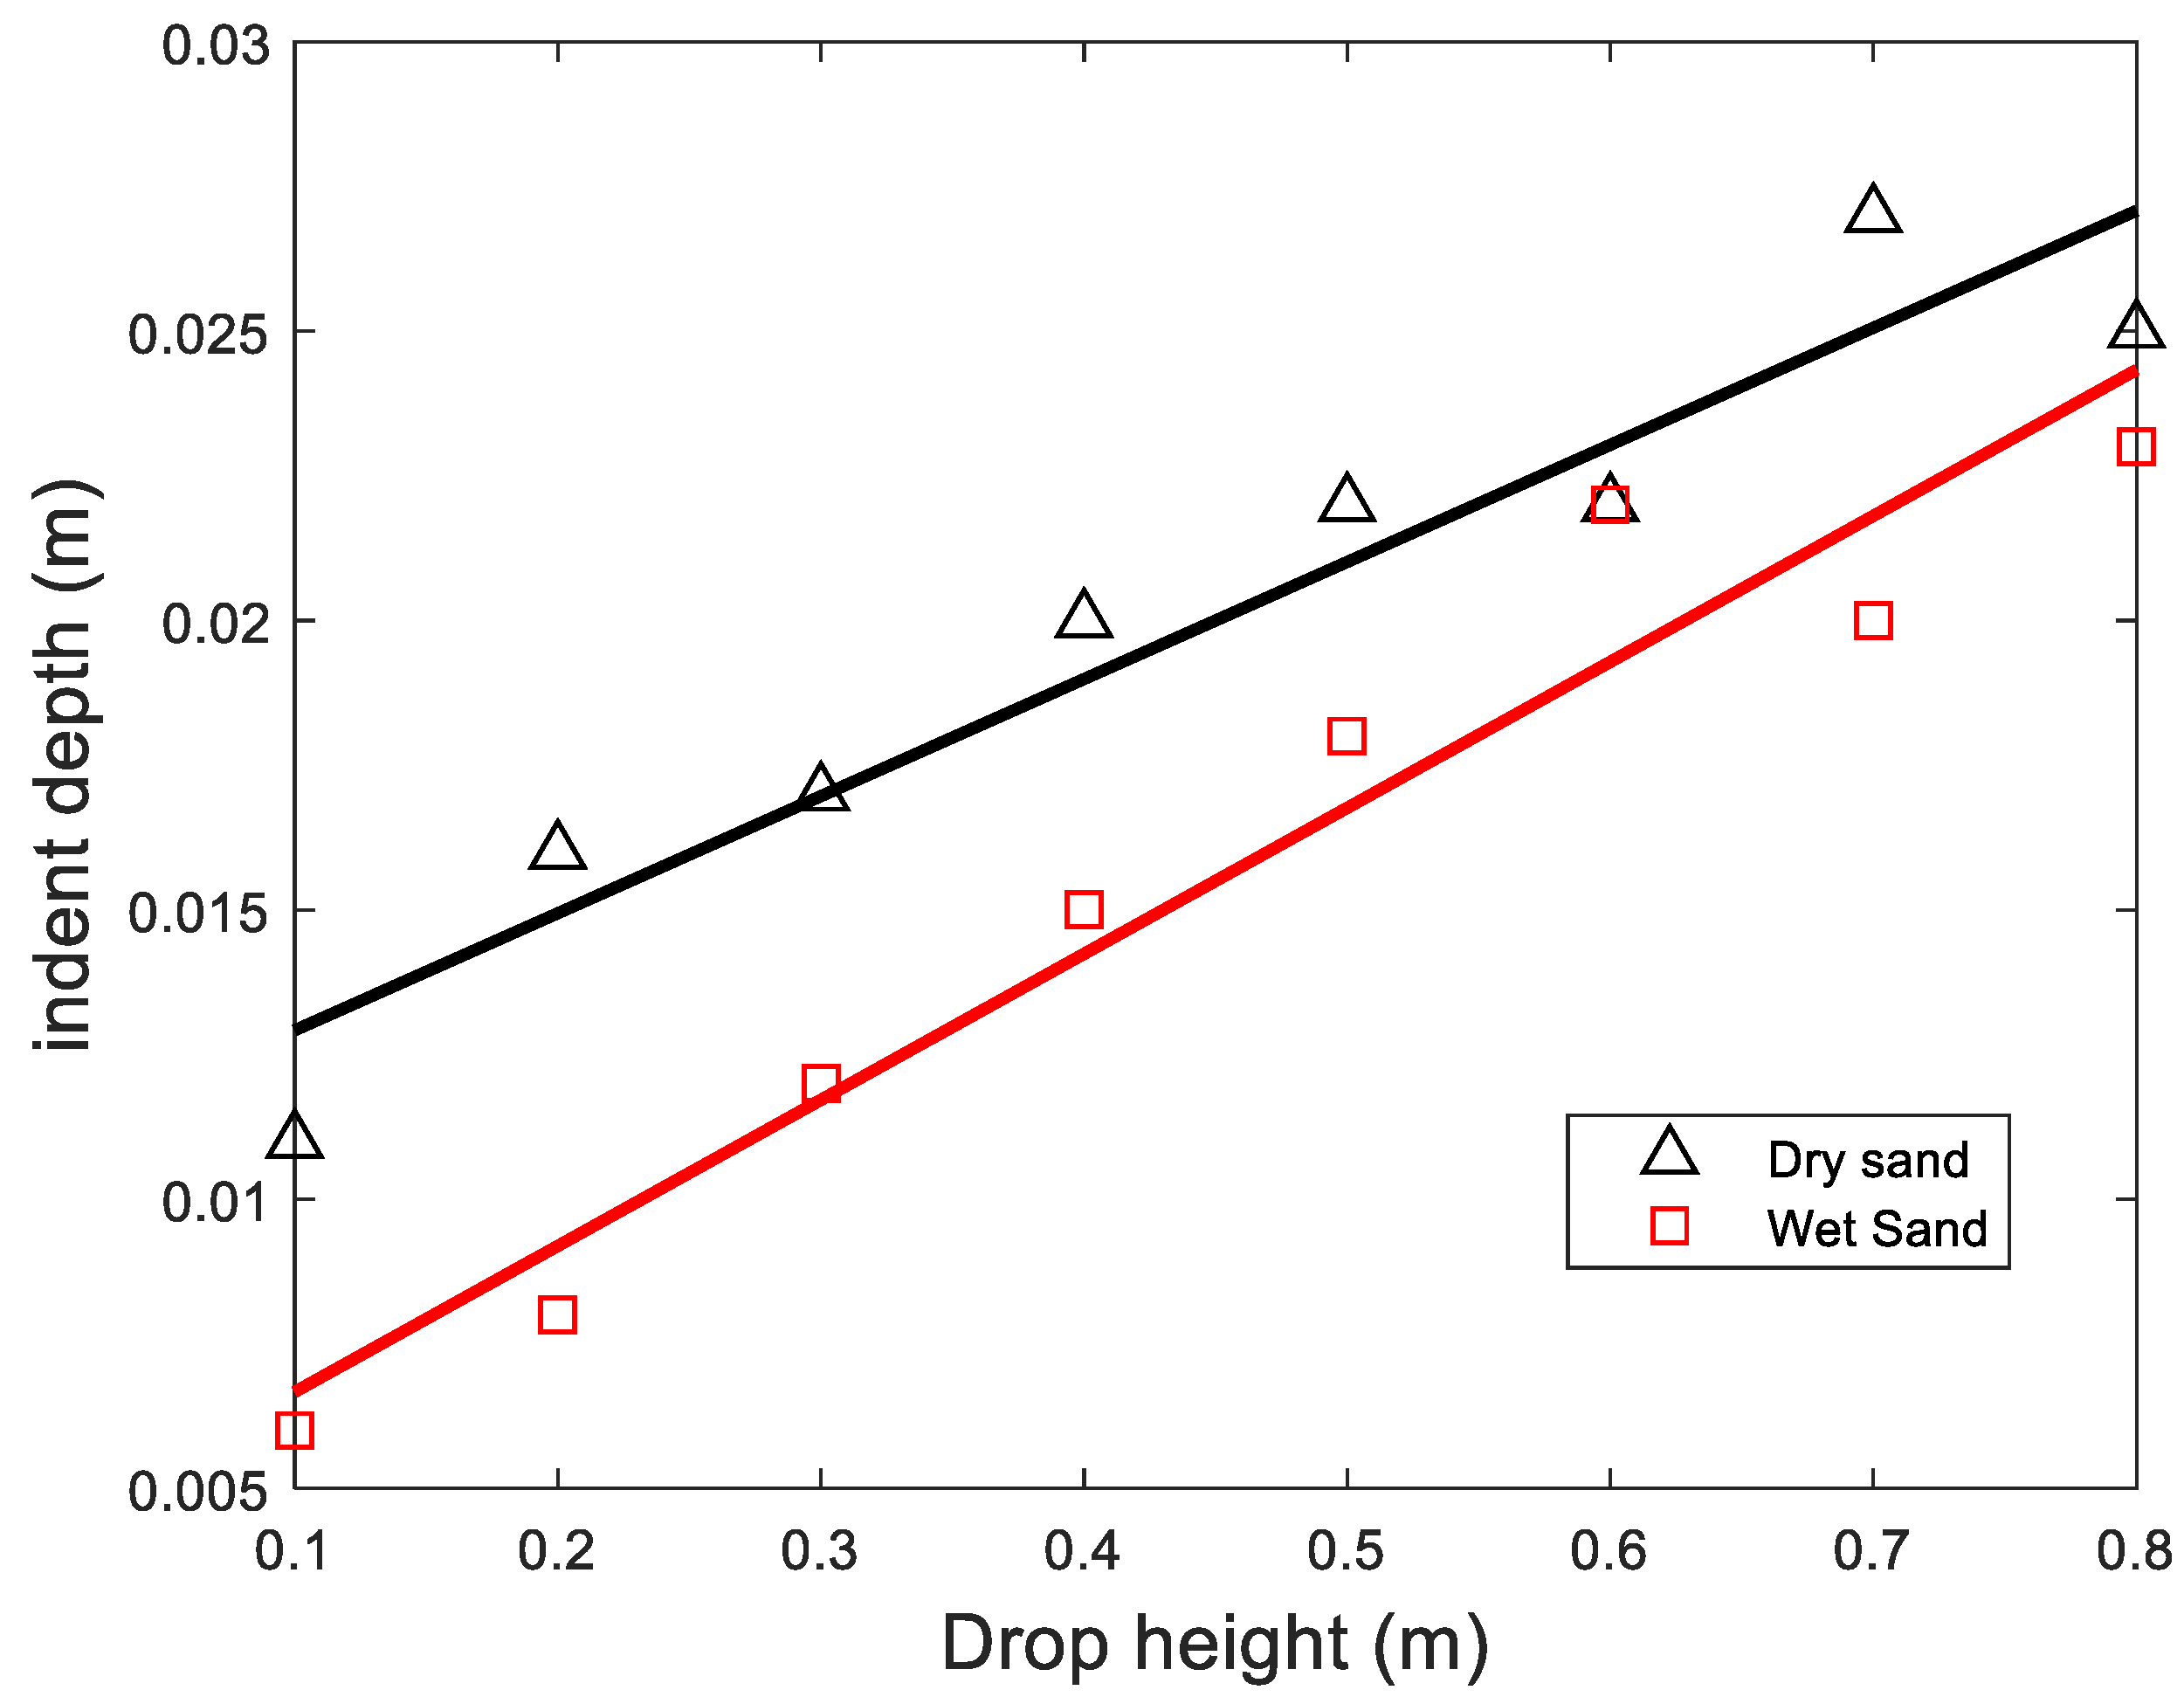
Through a process of elimination, the most effective drop weight for the dry sand was found to be 1.25 kg, and for the wet sand, the drop weight was 5 kg. The indentation depth was plotted as a function of drop height (see Figure 2). The stiffness of the two surfaces, S, was calculated for every measurement point for the two surfaces. Table 1 includes the mean and standard deviation stiffness values.

4. Discussion

The comparison with the previously reported stiffness measurements [3] are somewhat different, although the stiffness ratio between dry and wet sand is approximately the same (=7 or 13%–15%). The difference in the absolute stiffness values is thought to be related to several effects:
  • the measurements reported were in-situ on unconfined sand, whereas the sand box measurements [3] were constrained on five sides (only the top surface was unconfined);
  • the standard deviation in the measurements was large as every measurement was on a different but adjacent sand surface;
  • the in-situ, undisturbed sand could be highly layered, with the top layer consisting of very fine particles. One assumes that the sandbox measurements were conducted over a homogeneous sand sample.
In this study, the dry sand measurements were relatively consistent for all drop heights, with a smaller standard deviation (16%) compared to 50% from [3]. The wet sand measurements had a similar standard deviation (32%) to those from [3].
Several uncertainties were evident in the experimental technique. Firstly, the penetrometer had a tendency to rebound slightly on impact on both surface types. Infrequently, some sand from the edges fell into the indentation when the penetrometer was removed. This created some uncertainty in the penetration depth measurements. In addition, the edges of the indentation were raised slightly. This added to the uncertainty of the indentation depth measurements. The experiments reported in [3] also showed evidence of this rebound effect on the displacement measurements. One might expect that these two effects might be increased with increasing weight, but the plots in Figure 2 do not provide any substantive evidence of this effect. As these effects were more problematic when the penetrometer was not held vertically, significant care was taken during the trials to minimize misalignment from the vertical by using a spirit level on the pole before the weight was released.

5. Conclusions

The experimental technique reported in this paper was designed to replicate the indentation depth of an athlete running barefoot on the sand. Thus, the penetrometer cross-sectional area and the weights and drop heights used were based upon observations of running on these surfaces, as reported in a companion paper [8]. Unlike previously reported measurements, the experiments were conducted on undisturbed sand in-situ.
In future, the penetrometer can be instrumented with sensors and actuators. The addition of an accelerometer, an automatic weight release mechanism, and a positioning rig to ensure the penetrometer falls vertically are planned. The positioning rig could also be used to determine the penetration depth measurements.

Acknowledgments

No grants have been received in support of this research work. M.T.O.W. is undertaking PhD candidature with the assistance of a Griffith University Postgraduate Scholarship. Geotechnical assistance from Dominic Ong (Griffith University) is greatly appreciated.

Conflicts of Interest

The authors declare no conflict of interest.

References

  1. Ganderton, C.; Cook, J.; Docking, S.; Rio, E.; van Ark, M.; Gaida, J. Achilles tendinopathy: Understanding the key concepts to improve clinical management. Aust. Musculosketal Med. 2015, 19, 12–18. [Google Scholar]
  2. Gaudino, P.; Gaudino, C.; Alberti, G. Minetti, Biomechanics and predicted energetics of sprinting on sand: Hints for soccer training. J. Sci. Med. Sport 2013, 16, 271–275. [Google Scholar] [CrossRef] [PubMed]
  3. Barrett, R.; Neal, R.; Roberts, L. The dynamic loading response of surfaces encountered in beach running. J. Sci. Med. Sport 1997, 1, 1–11. [Google Scholar] [CrossRef]
  4. SLSQ Secondary School Surf League. Beach Flags. Available online: http://nbbsurflifesaving.com.au/wp-content/uploads/2013/05/Event-Descriptions-2013.pdf (accessed on 26 August 2019).
  5. Reeser, J.C.; Verhagen, E.; Briner, W.W.; Askeland, T.I.; Bahr, R. Strategies for the prevention of volleyball related injuries. Br. J. Sports Med. 2006, 40, 594–600. [Google Scholar] [CrossRef] [PubMed]
  6. Altman, A.; Nery, C.; Sanhudo, A.; Pinzur, M.S. Osteochondral injury of the hallux in beach soccer players. Foot Ankle Int. 2008, 29, 919–921. [Google Scholar] [CrossRef] [PubMed]
  7. Ferris, D.P.; Liang, K.; Farley, C.T. Runners adjust leg stiffness for their first step on a new running surface. J. Biomech. 1999, 32, 787–794. [Google Scholar] [CrossRef]
  8. Worsey, M.T.O.; Espinosa, H.G.; Shepherd, J.B.; Lewerenz, J.; Klodzinski, F.S.M.; Thiel, D.V. Features observed using multiple inertial sensors for athletics track and hard-soft sand running: A comparison study. MDPI Proc. accepted for publication.
  9. Standards Australia. Soil strength and consolidation tests—Determination of the penetration resistance of a soil—9 kg dynamic cone penetrometer tests. In Methods of Testing Spoils for Engineering Purposes; AS 1289.6.3.2-1997; Standards Australia: Sydney, Australia, 1997. [Google Scholar]
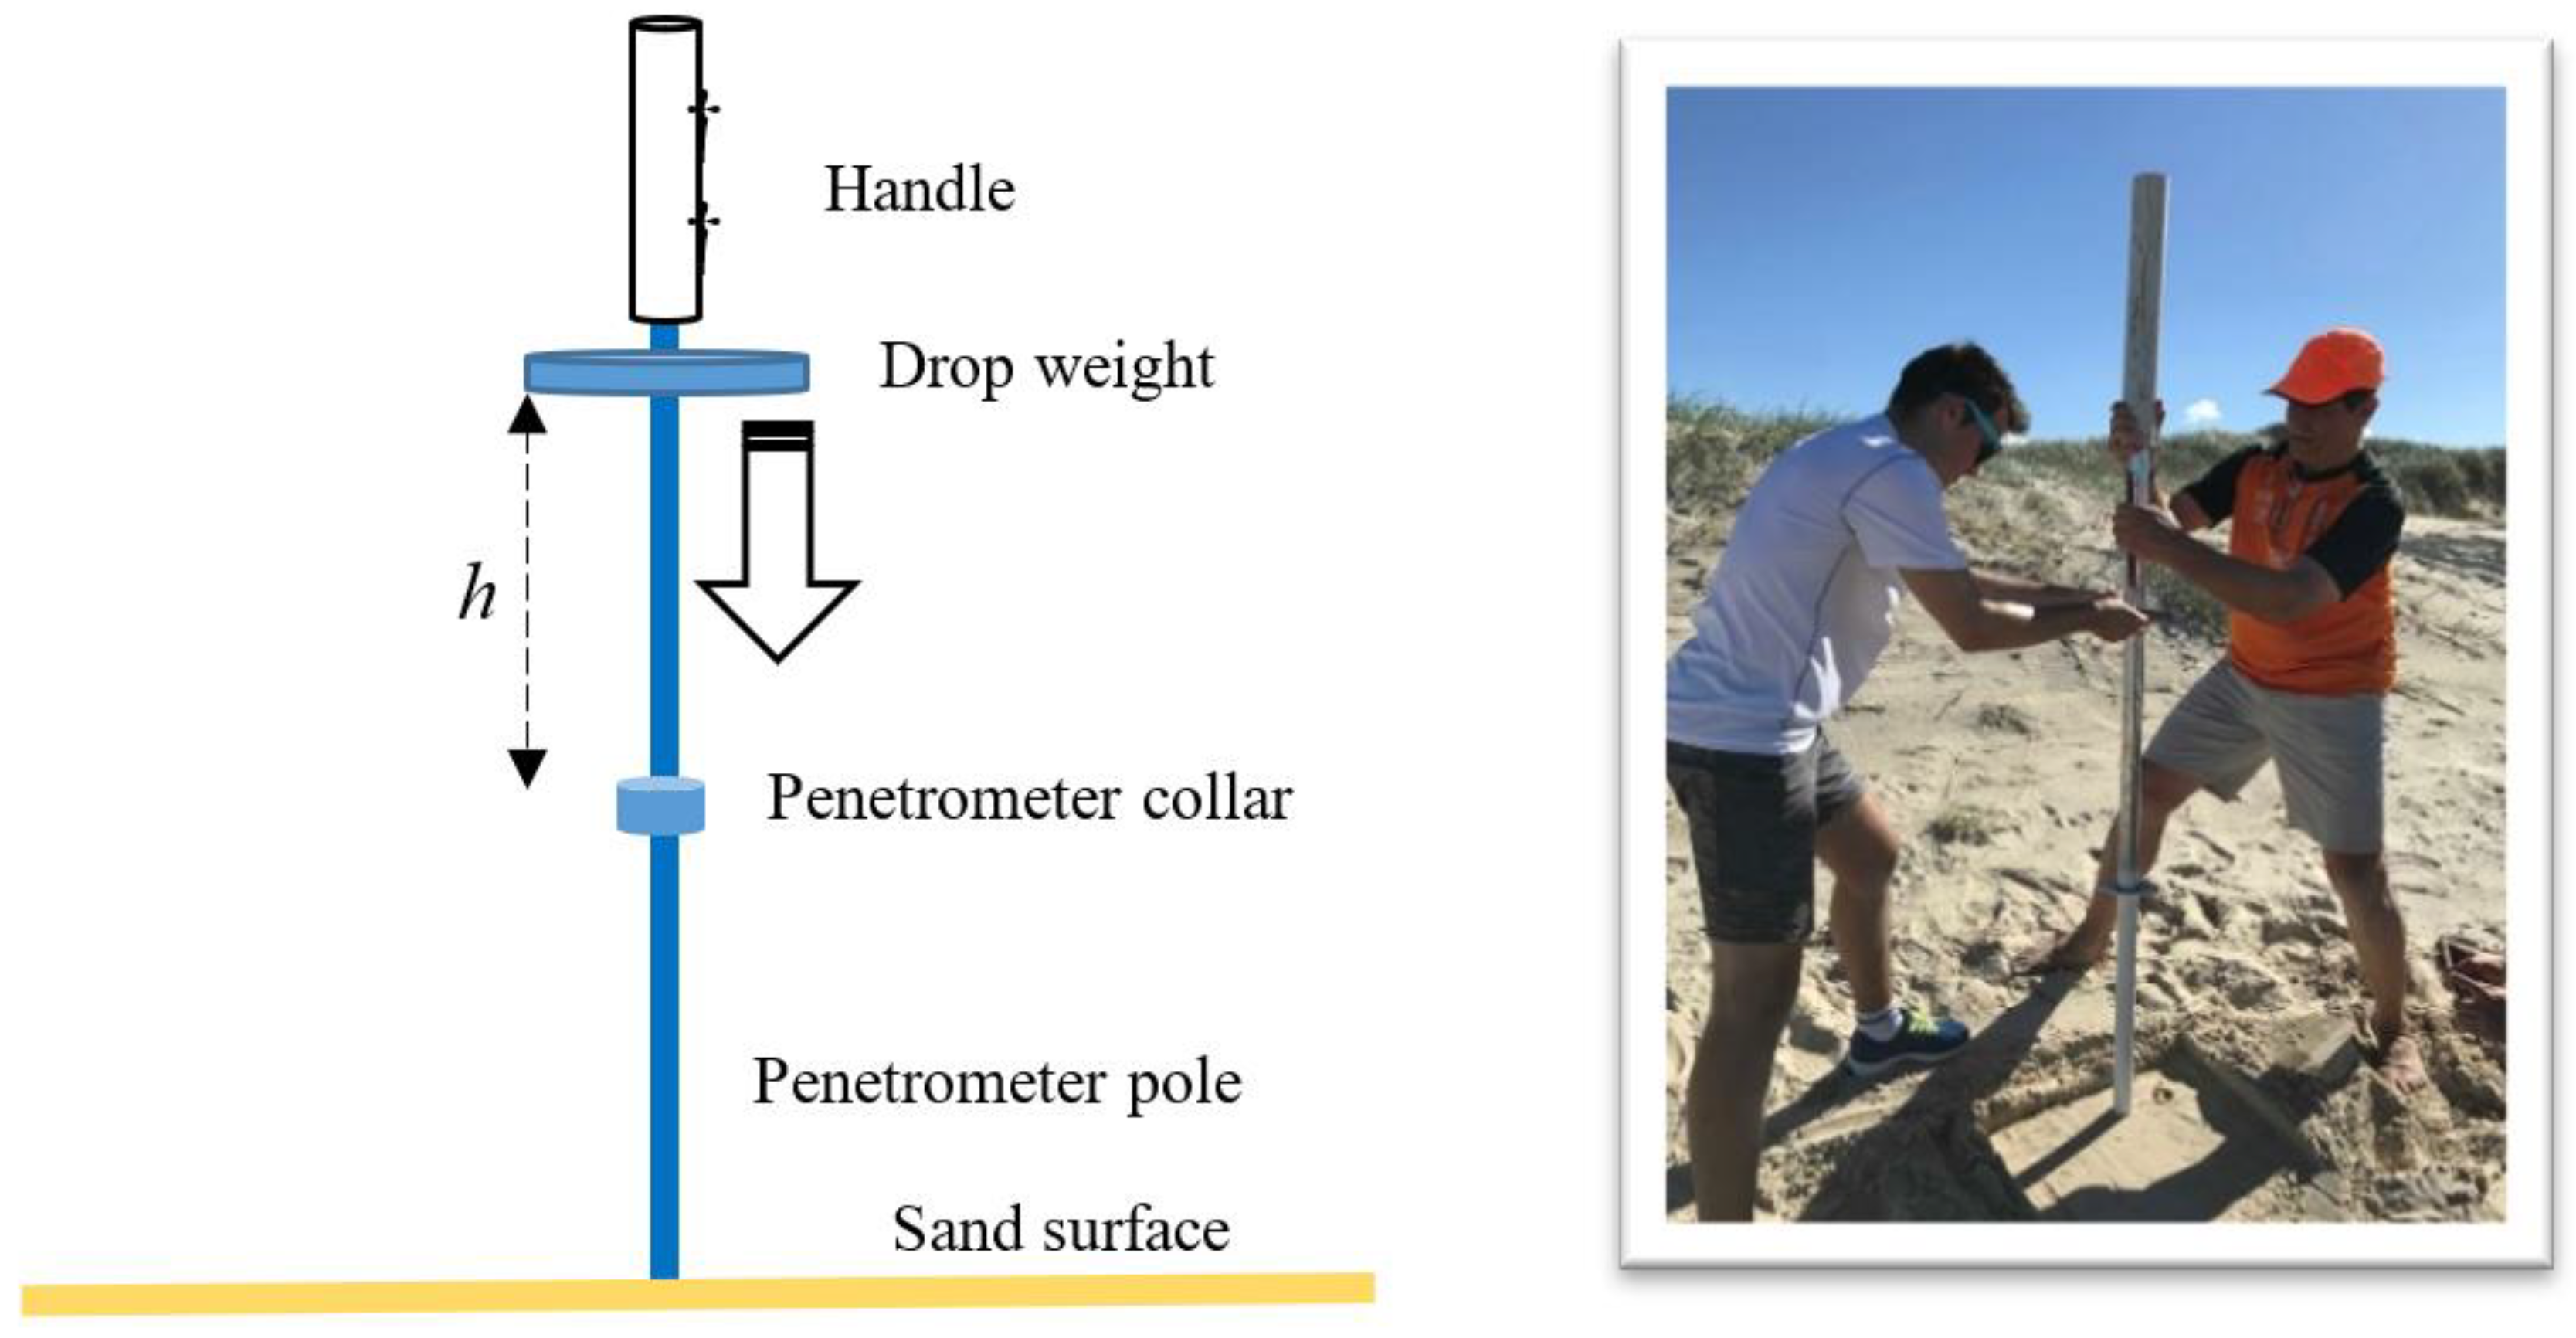
Figure 1. The experimental configuration. The drop weight was released from a predefined height h and the penetration depth in the sand was measured. The handle was used to position the pole vertically with the assistance of a spirit level.
Proceedings 49 00064 g001
Figure 2. The indentation depth plotted as a function of the weight release height h as discrete points for the two sand surfaces. The two continuous straight lines show a linear relationship (Pearson correlation coefficient r2 > 0.92).
Proceedings 49 00064 g002
Table 1. Comparison of stiffness values for dry and wet sand. The standard deviation from the measurements is given in brackets. The results from a previous study [3] are given for comparison. The stiffness ratio between dry and wet sand is given as a percentage value.
Drop Weightr2Stiffness SS [3]
Dry sand1.25 kg0.9213 (2) kN/m59 (29) kN/m
Wet sand5.0 kg0.9297 (32) kN/m380 (118) kN/m
Stiffness ratio 13%15%
Publisher’s Note: MDPI stays neutral with regard to jurisdictional claims in published maps and institutional affiliations.