1. Introduction
Treadmills are often used for various purposes because they do not require much space and allow many walking patterns. Most treadmills automatically move at a constant speed. Since we believe that people contract their muscles and create force when they walk on a self-paced treadmill, we developed a self-paced load-controlled treadmill with two built-in force plates and predicted that the treadmill would strengthen lower limb muscles, such as the soleus and gastrocnemius. We expect that such a treadmill will be widely utilized in rehabilitation for seniors, patients who have difficulty walking, and training for athletes.
We previously compared the differences between a treadmill with a constant speed and a load-controlled treadmill with various load cases [
1]. Our results showed that when walking on a load-controlled treadmill, the ankle joint moment and the iEMG (integrated electromyography) of the soleus muscle were larger. Our subject moved with a fore posture when walking on a load-controlled treadmill.
The purpose of this study was to find a method that applied a load that would most efficiently stimulate the lower limb muscles by a load-controlled treadmill to prevent muscle atrophy and enhance the muscles. We investigated the differences between single-belt treadmills, which closely simulate actual walking, and split-belt treadmills, which are often used in gait research because they allow for more detailed measurements.
2. Methods
2.1. Load-Controlled Treadmill
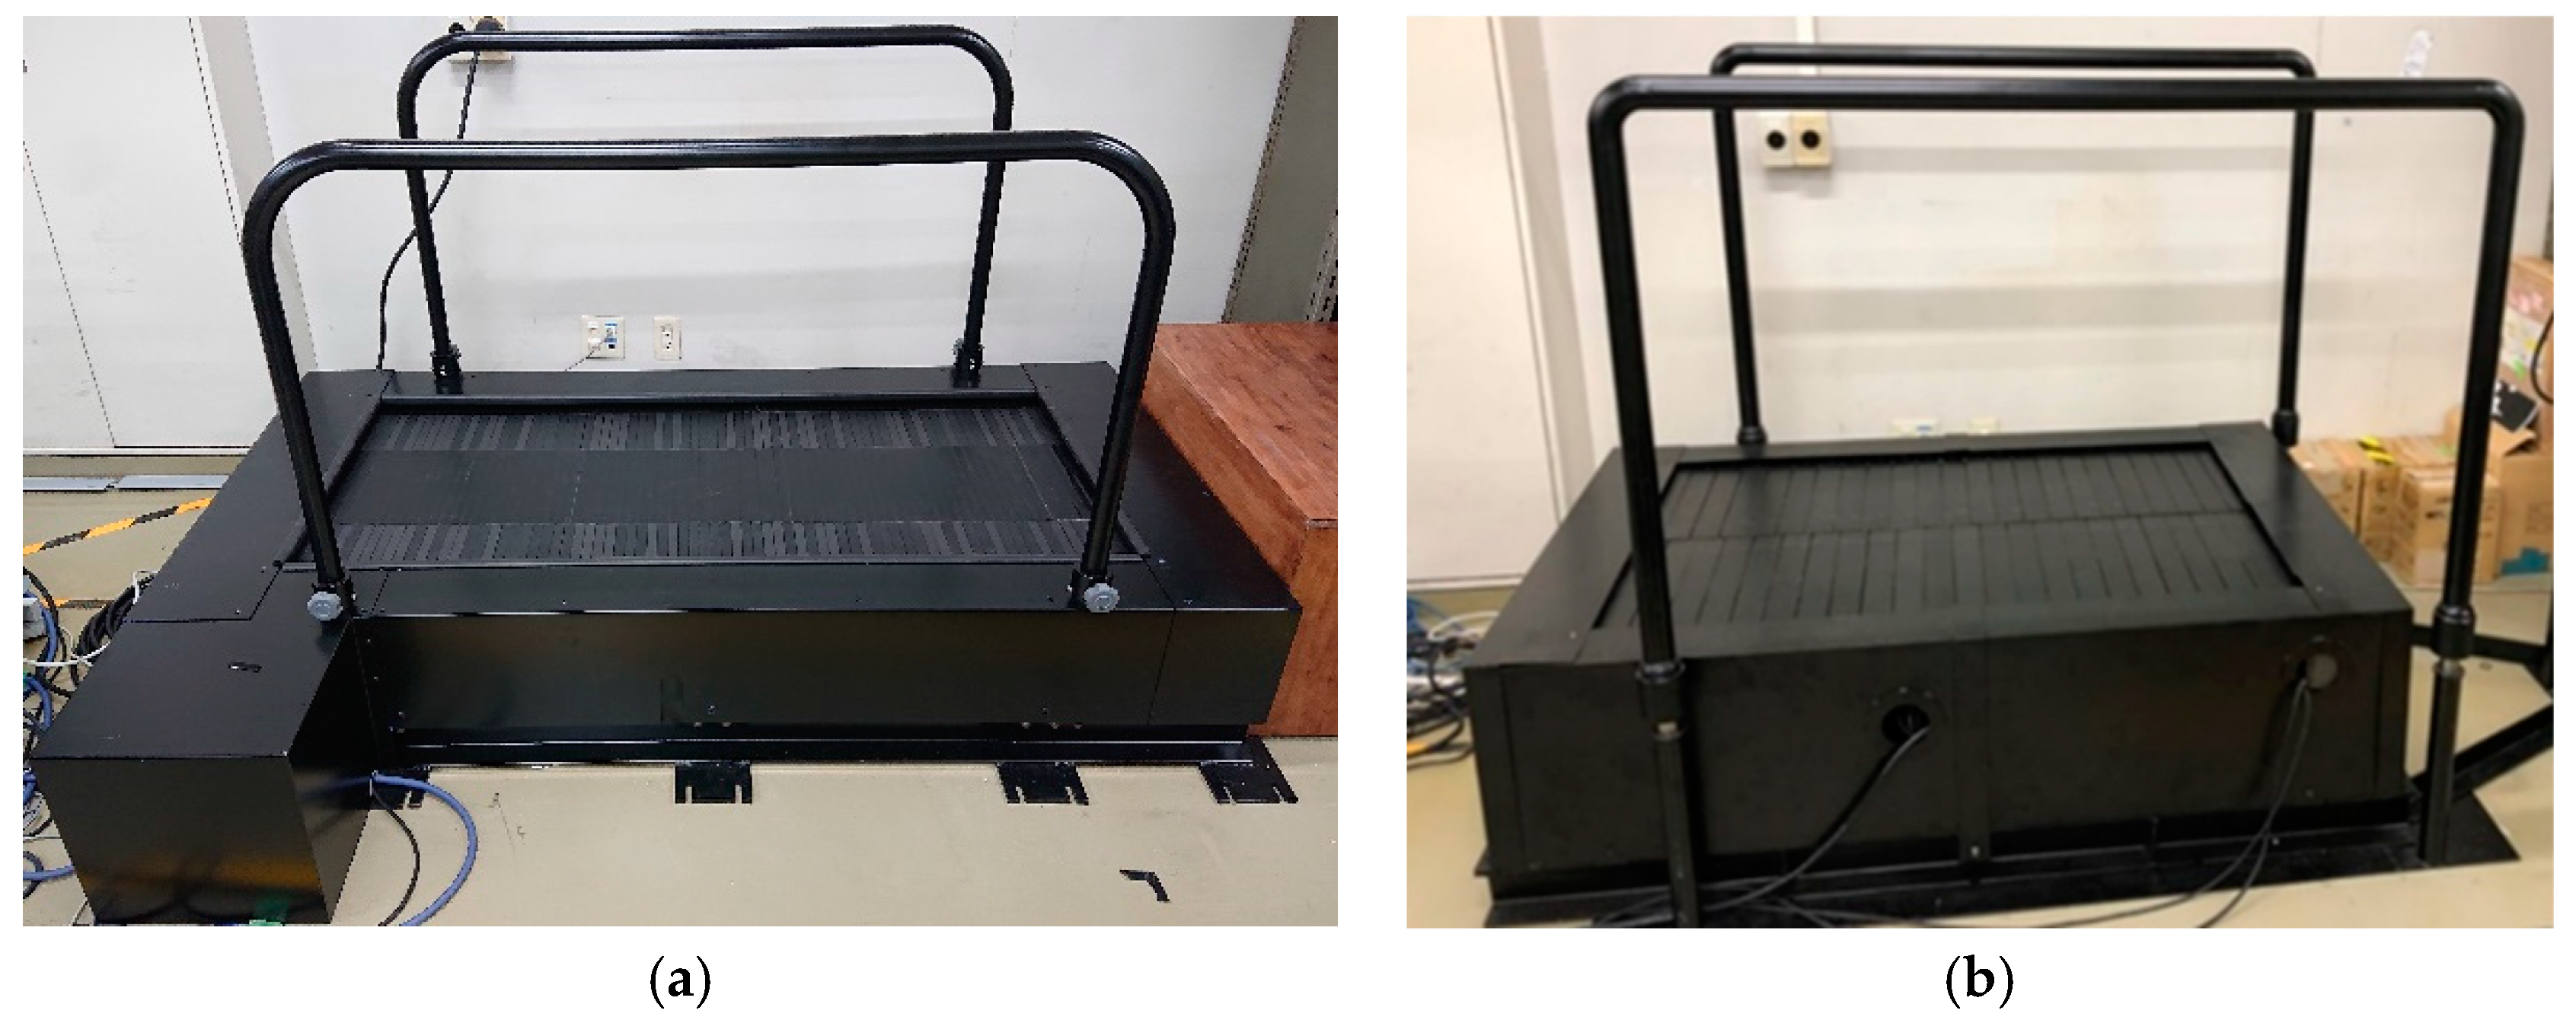
We used a load-controlled treadmill jointly developed with TecGihan Co. Ltd. (Kyoto, Japan) (
Figure 1). Many conventional treadmills provide walking or running at a constant speed [
2]. On the other hand, a load-controlled treadmill is a self-paced machine on which users can walk or run by applying a kicking force to the plate belts. Compared to a rubber belt, which has been widely used in the past, plate belts are close to the actual ground. In addition, they have two built-in force plates and can measure the ground reaction force during walking. A load that corresponds to the reaction force can be generated by sending feedback of the force information obtained from the force plates.
Treadmills that drive the belts with a motor can be simply controlled by a motor torque control. The disturbance signal (a disorder signal), however, is generated from human motion. To appropriately control a load, we must control both the target and disturbance responses. Since adjusting the controller design is complicated, we designed a feedback control that was based on the speed and output force data. In this treadmill, the load’s target response was controlled by a PID controller (Proportional-Integral-Differential controller), and the disturbance response was controlled by a servo motor amplifier. This design greatly simplified the control system. We could easily change the responsiveness and parameters, such as load gain or how to apply the load.
2.2. Measurement Device
Floor reaction force shoes and a motion capture system were used to measure the kinetic data.
We attached the floor reaction force shoes (M3D, TecGihan Co. Ltd.) and small mobile floor reaction force meters with a built-in transmitter and posture sensors on the toes and the heels. The transmitter supplied power to the meters, and the force and moment data were transferred through it.
A motion capture system (VENUS3D, Nobby Tech. Ltd., Tokyo, Japan) measured the positions of the markers that were attached to the shoulder, waist, knee, ankle, heel, and toe on the left side of the subjects. We calculated the sagittal knee and ankle joint angles using the position data by reverse dynamics.
2.3. Procedure of Data Analysis
We calculated the joint angles and the joint moments using the data of the reaction force and marker positions. In this paper, a x–y–z coordinate system was defined, where the x-axis was the medio–lateral direction, the y-axis was the anterior–posterior direction, and the z-axis was in the gravitational direction. The angles and moments were cut out for each walking cycle based on ground reaction force . The data times were normalized so that one cycle was 100 points, and then we averaged the cycles for 15 of the 6–20 steps.
We calculated the sagittal angles around the x-axis,
,
,
, using the coordinate data of the markers from the motion capture system:
The ranges of the knee joint angles are 0–130 degrees when the flexion is positive and the extension is negative. The ankle joint angles range from −45 to 20 degrees when the dorsal is positive and the plantar is negative [
3]. The knee and ankle joint angles are expressed by the following equations:
In this study, the ankle joint moment was one evaluation criterion for muscle activity. The reaction force along the sagittal plane was especially important because the load was applied to the y-axis. Therefore, the ankle joint moment
was calculated using the driving force, which was generated when the subjects kicked the belts along the sagittal plane:
In Equation (6), and are the forces along the sagittal plane obtained from the force plates of the heel and toe sides. The distance from the floor to the center of the ankle joint was set to 0.1 m.
2.4. Test Condition
Our subjects were two healthy males (21 and 23 years old). The experiment was conducted at Doshisha University Kyotanabe Campus (Kyoto, Japan). They walked on both the split- and single-belt treadmills with the constant load r = 0, 5, 10, 15%, based on a maximum driving force, for 30 s. The maximum driving force denoted the maximum force at which the subjects could move the belts. The load direction was the y-axis positive direction. The sampling frequency of the floor reaction force shoes and the motion capture was set to 100 Hz. This experiment was approved by the Doshisha University Research Ethics Committee regarding clinical experiments, and the subjects gave written, informed consent after receiving complete explanations.
3. Results
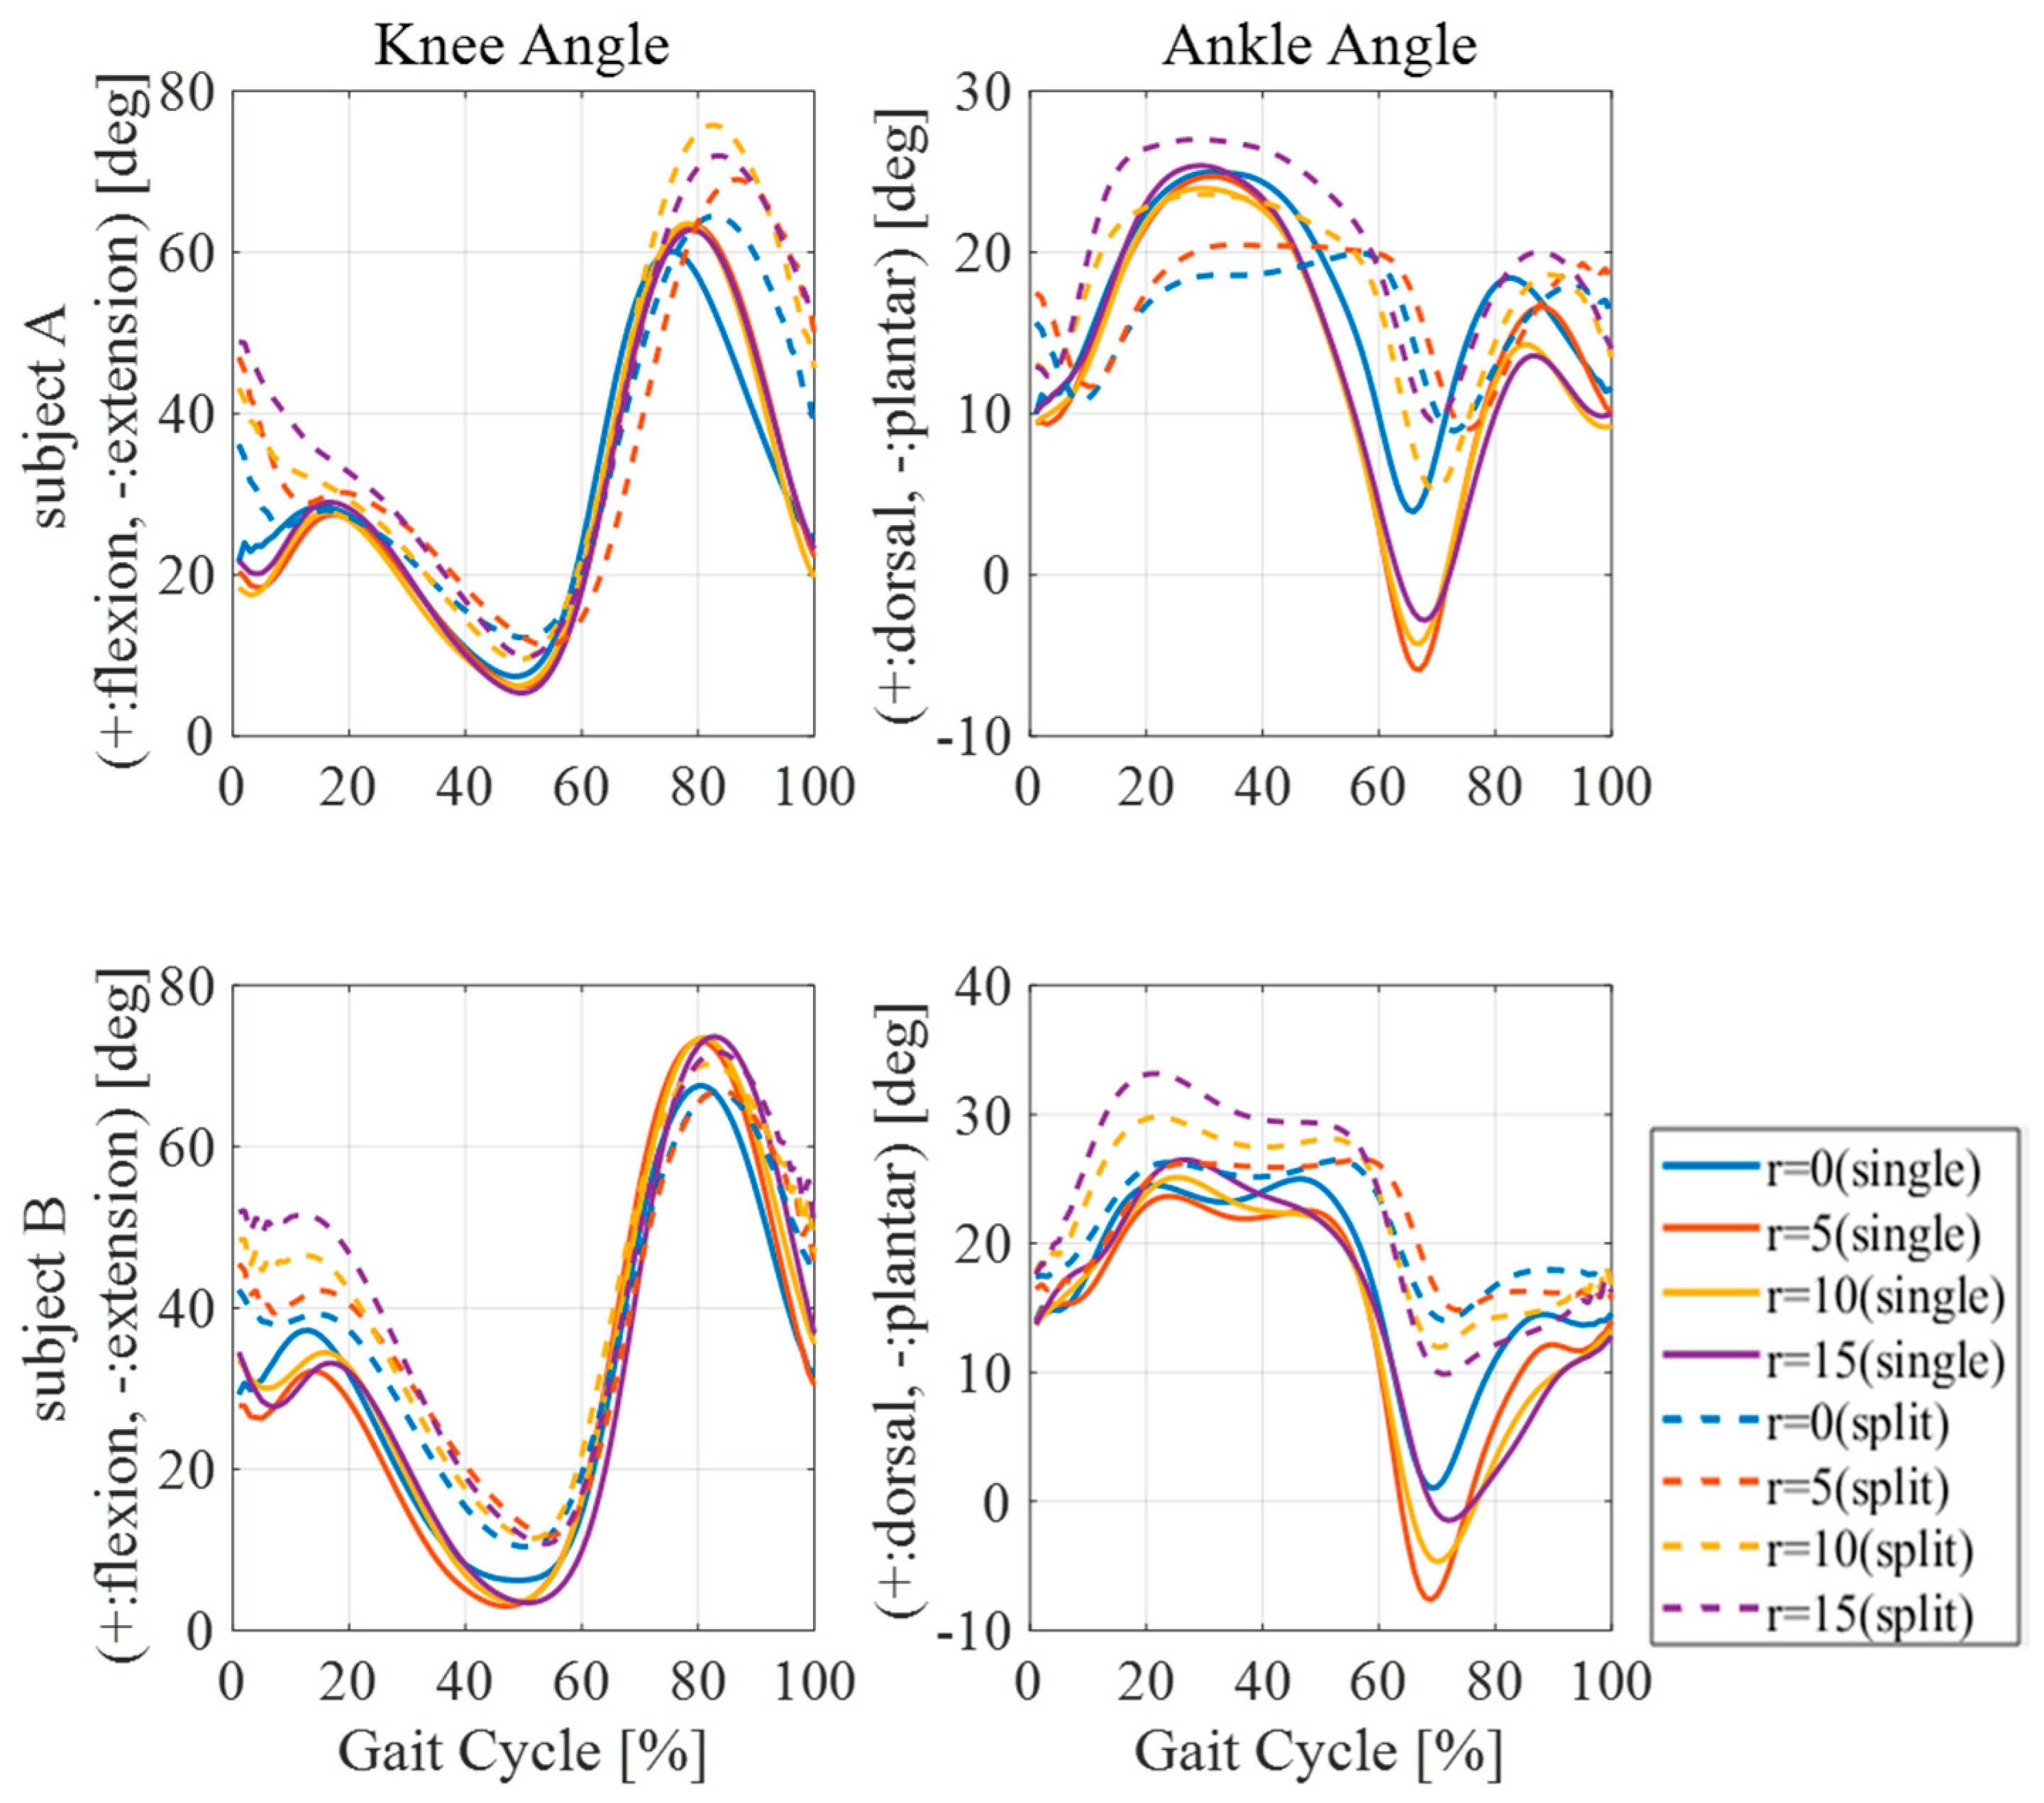
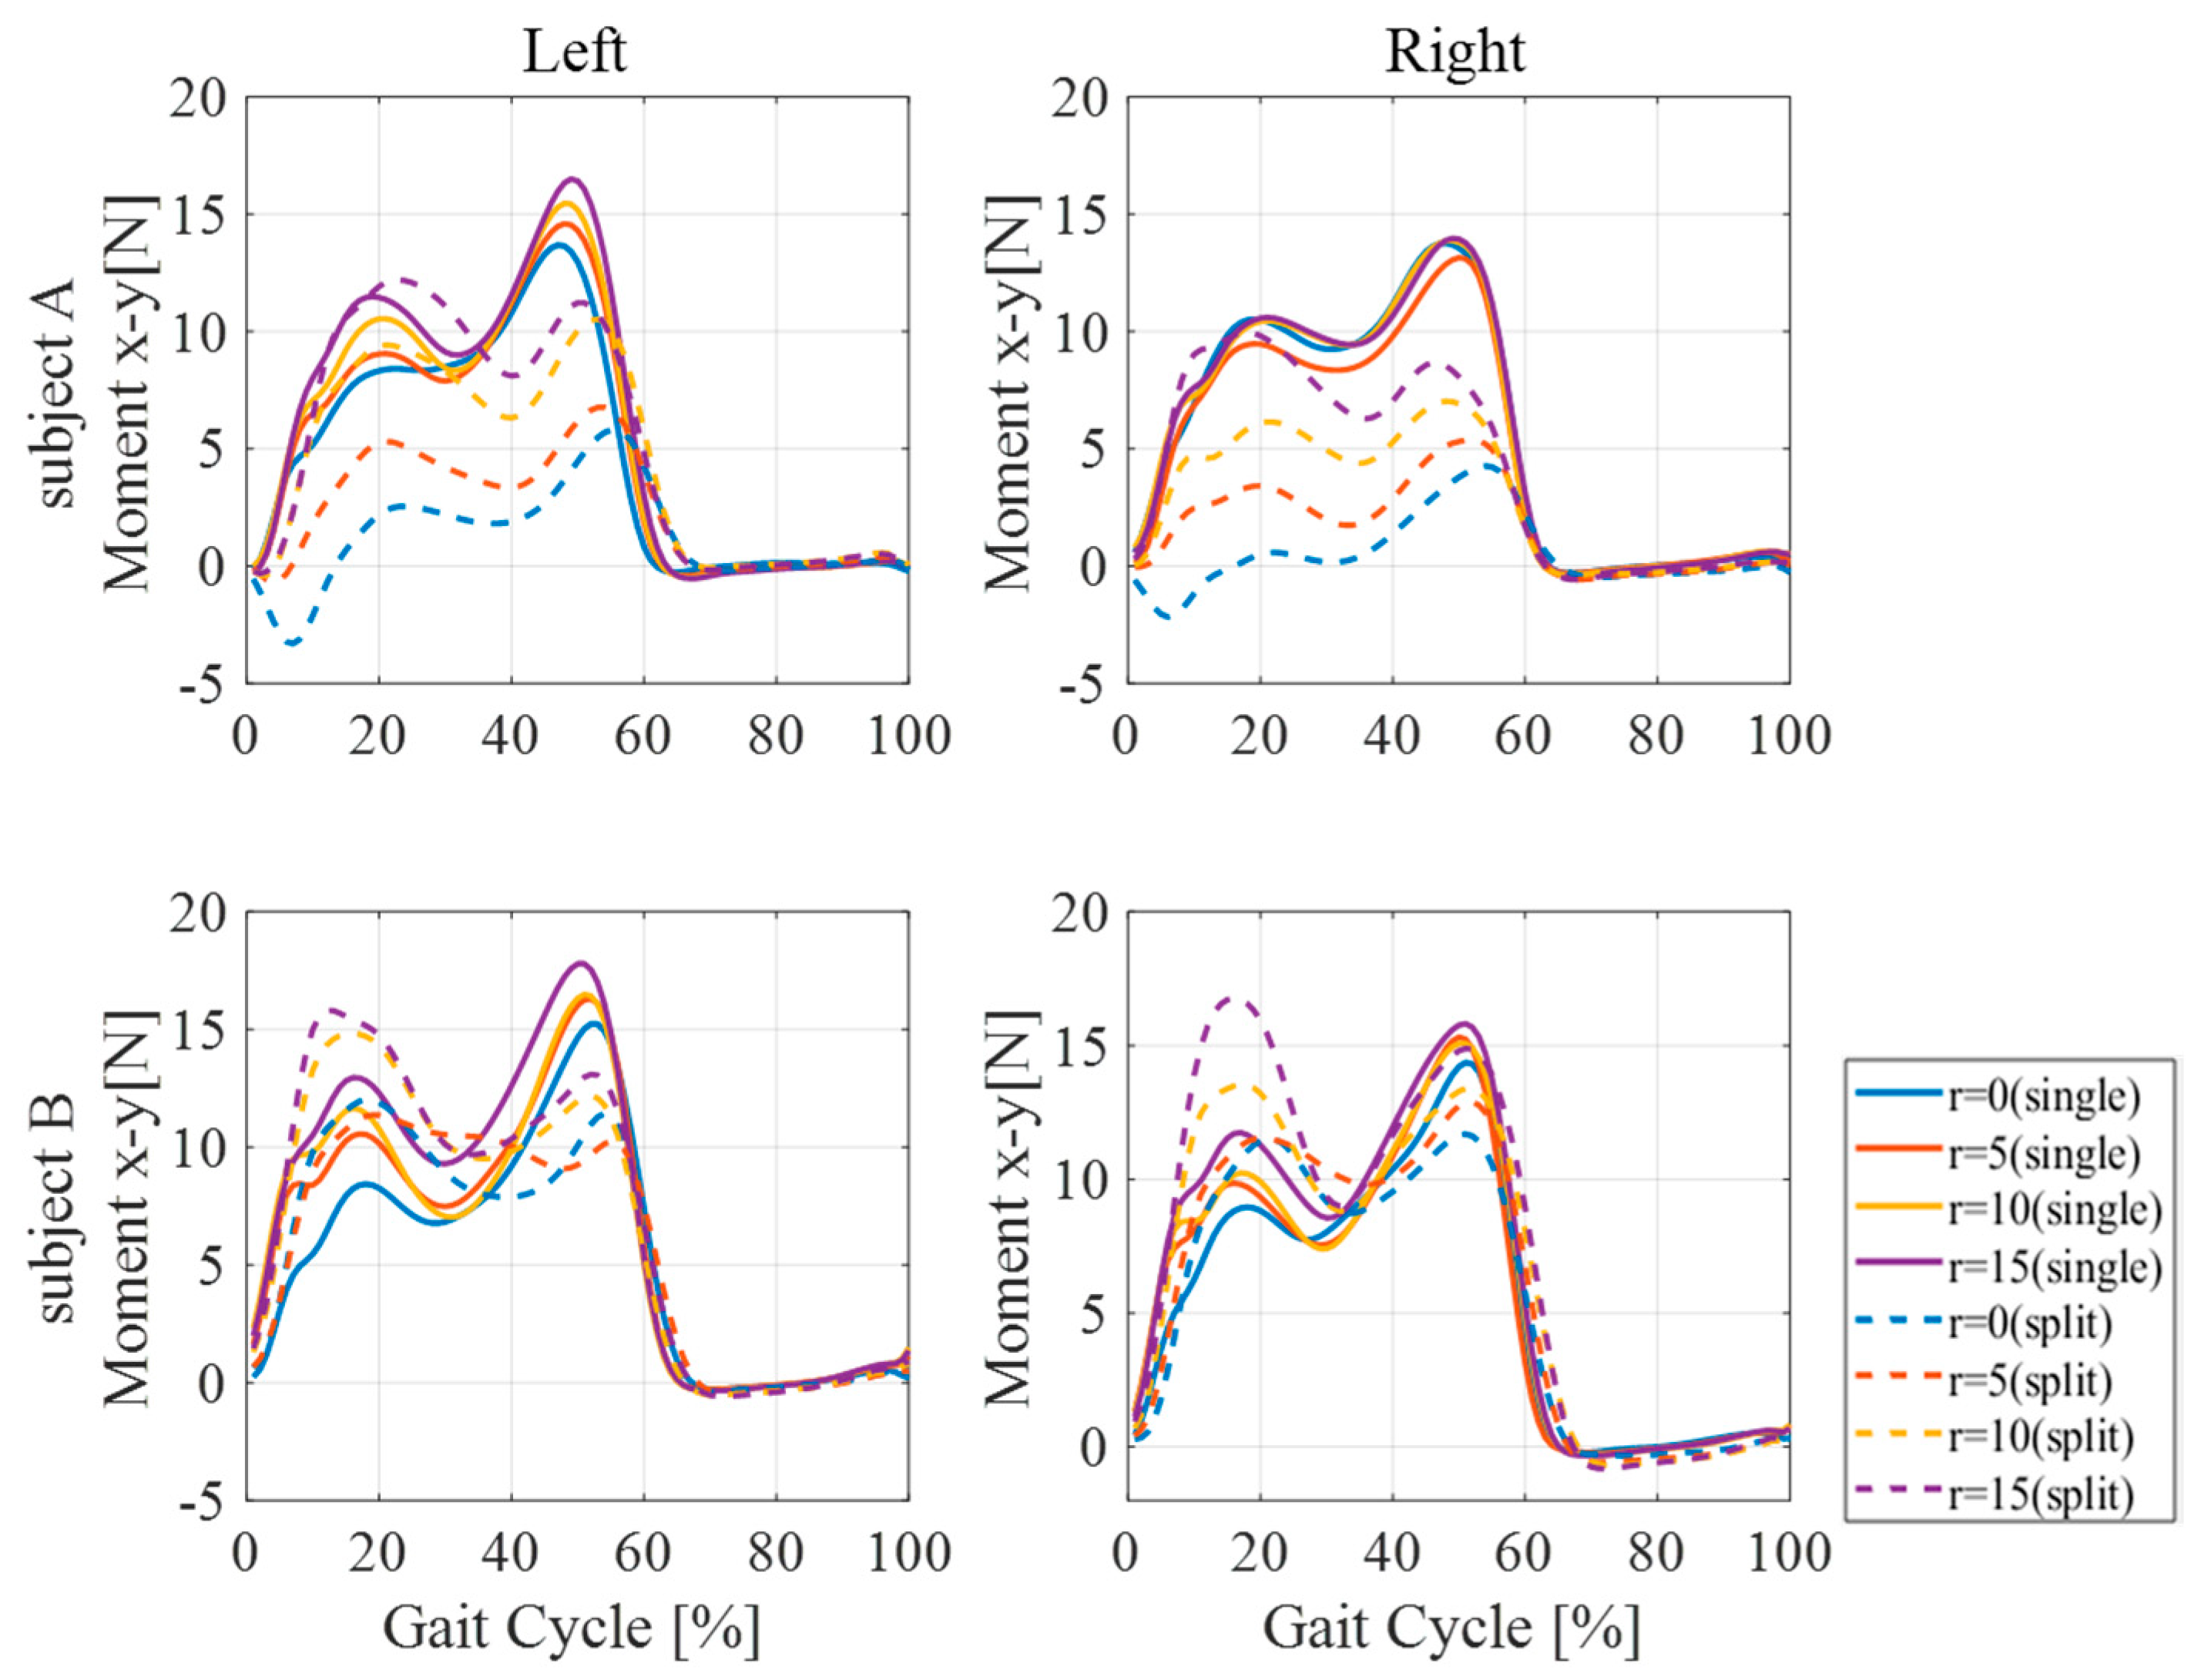
In the following figures, gait cycle 0% means the timing when the subject’s heel contacted the treadmill.
3.1. Joint Angle
Figure 2 displays the knee joint angles and the ankle joint angles per stride. The left figures show the knee joint angles and the right ones show the ankle joint angles. We calculated these angles from the data of the left foot in the sagittal plane. In stance phase 0–60%, when walking on the single-belt treadmill, the knee joint angles tended to be smaller than those when using the split-belt treadmill. This tendency is shown in the results of both subjects. Based on the results of the ankle joint angles, the dorsiflexion angles of subject B when using the single-belt treadmill were smaller than when using the split-belt one in all the load cases during the stance phase. In subject A, the angles when walking on the single-belt treadmill were larger than when walking on the split-belt treadmill in r = 0, 5, 10%, but the results of the rest resembled subject B.
We also calculated the angular range of motion of the ankle joints. As shown in
Table 1, the single-belt ranges were more than 1.2 times larger than the split-belt ranges. It was 2.68 times when r = 5%.
3.2. Ankle Joint Moment
Figure 3 shows the ankle joint moments around the x-axis generated by the driving force per stride. From the mid-stance to the pre-swing, the ankle joint moments when walking on the single-belt treadmill were larger than when walking on the split-belt treadmill in the results of both subjects. Comparing the peak of the moments, the single-belt peak was 1.39–3.27 times larger than the split-belt peak when subject A walked. The single-belt peak was 1.06–1.59 times larger than the split-belt peak when subject B walked, denoting that the kicking force was greater when walking on the single-belt treadmill. On the other hand, the ankle joint moment from the initial contact to the mid-stance tended to be different between subjects A and B. In subject A, the split-belt moments were larger, but the opposite result was shown in subject B.
4. Discussion
4.1. Walking Posture
The knee flexion angle with a single-belt was larger because its center of gravity was higher than one with a split-belt. On the split-belt load-controlled treadmill, the belt speed was different between the left and right sides and the subject’s posture became unstable, so the center of gravity was lowered to maintain balance. The instability was reduced when walking on the single-belt treadmill, and the center of gravity increased, possibly decreasing the knee flexion angles. For general walking on the ground, the knee joint angles increased to 20 degrees from the initial contact to the mid-stance and decreased to 0 degrees to the pre-swing. Comparing the graphs of
Figure 2, walking on a single-belt treadmill can reproduce walking on the ground more closely than walking on a split-belt treadmill.
The results of the angular range of motion of ankle joints suggest that people can efficiently perform both efferent and afferent contractions of the soleus and gastrocnemius muscles on a single-belt treadmill. As the range expands, the muscles around the ankle joint greatly expand and contract. In other words, walking on single-belt treadmill leads to an increase in the flexibility of the muscles and may help to prevent muscle atrophy [
4].
4.2. Ankle Joint Moment and Driving Force
Compared to a split-belt treadmill, an increase in the ankle joint moments from the mid-stance to the pre-swing with a single-belt treadmill suggests that the force to the kick belts becomes stronger. This is because the reverse foot plays a braking role by making contact with the heel. Reverse foot braking leads to a momentary increase in the belt load. The foot, which kicks the belts, generates more force to maintain a smooth belt movement.
From the initial contact to the mid-stance, the ankle joint moments with a split-belt are larger in subject A, but the moment with a single-belt is larger in subject B. This difference may be caused by various subject gaits. Based on the ankle joint angles when walking on the split-belt treadmill in
Figure 2, the angles decreased to the planter flexion and then increased to the dorsiflexion during the 0–20% gait cycle in subject A. This is close to general ground walking. On the other hand, the angles continued to increase from the initial contact in subject B. Since the original gait varies among people, it is difficult to estimate which belt type creates the larger ankle joint moments from the data of this experiment alone. For examining the trend, we must conduct experiments and correct more data of the other subjects.
5. Conclusions
We investigated the differences between walking on single-belt and split-belt treadmills. We experimentally conducted under different load cases, evaluated the lower limb muscle activities by joint angles and ankle joint moments, and reached the following conclusions:
- (1)
the postures of the subjects on the single-belt treadmill were more stable;
- (2)
the angular range of the motion of the ankle joints when walking on the single-belt treadmill was up to 2.68 times larger than when walking on the split-belt treadmill;
- (3)
when walking on the single-belt treadmill, the ankle joint moments were larger during the terminal stance.
Our results suggest that single-belt treadmills can generate more foot kicking force, which may enhance limb muscles.

